14 - Interface and Application Programming
This week we have worked in different programming languages to visually represent and interact with our projects.
Summary
This week we have worked in different programming languages to visually represent and interact with our projects.
Assigments
- individual assignment:
- write an application that interfaces a user with an
- input &/or output device that you made - group assignment:
- compare as many tool options as possible
Individual Assigment
For more than 25 years I have dedicated myself to carrying out multimedia projects, where one of the most important parts, in addition to good content, is the visual aspect, whether on CD-ROMs, apps, web…
For many years, I worked with Macromedia Director, doing projects in which we integrated everything from digital content to external interactions, either with sensors, displaying Laser Disc content on screen or obtaining remote data from servers. In Director you could work with Xtras that provided those features or develop your own in c.
Adobe Flash was another of the tools I worked with for many years, which did have many options to obtain data via the web and the server, but many times we used small portions of .php to connect to the server and parallel development behind the server to obtaining this data.
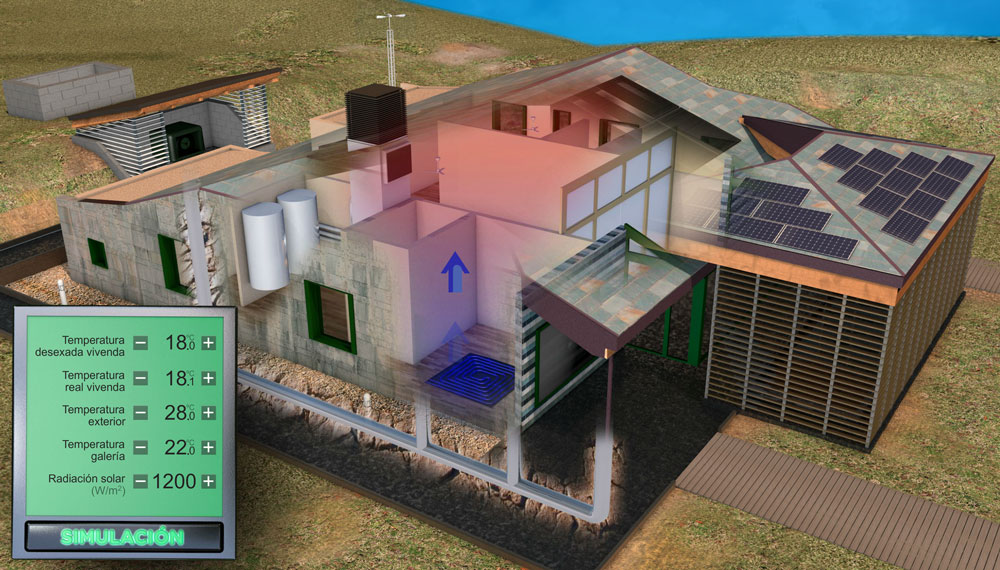 Smart home simulator App made in Adobe Flash with animations and 3D renderings for training during visits to the Sotavento Experimental Wind Farm.
Since Adobe Flash and Director are obsolete, many of the new developments are on the web, using canvas, js, php….
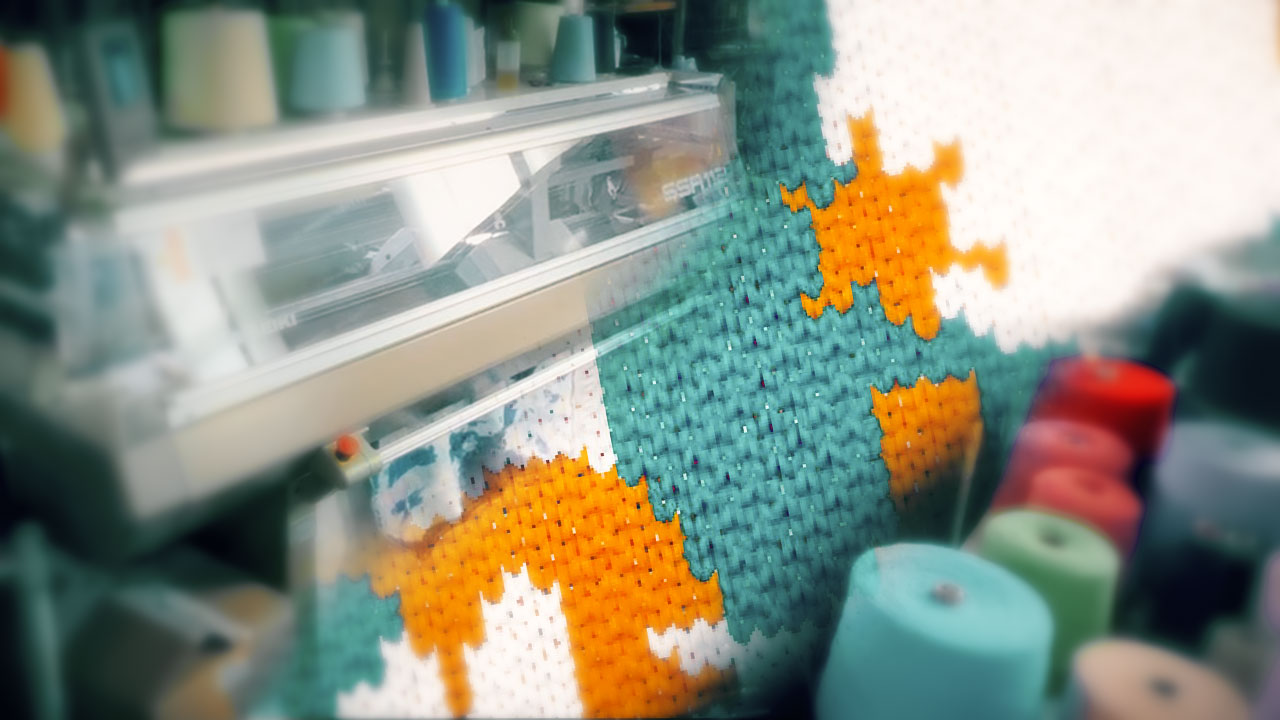
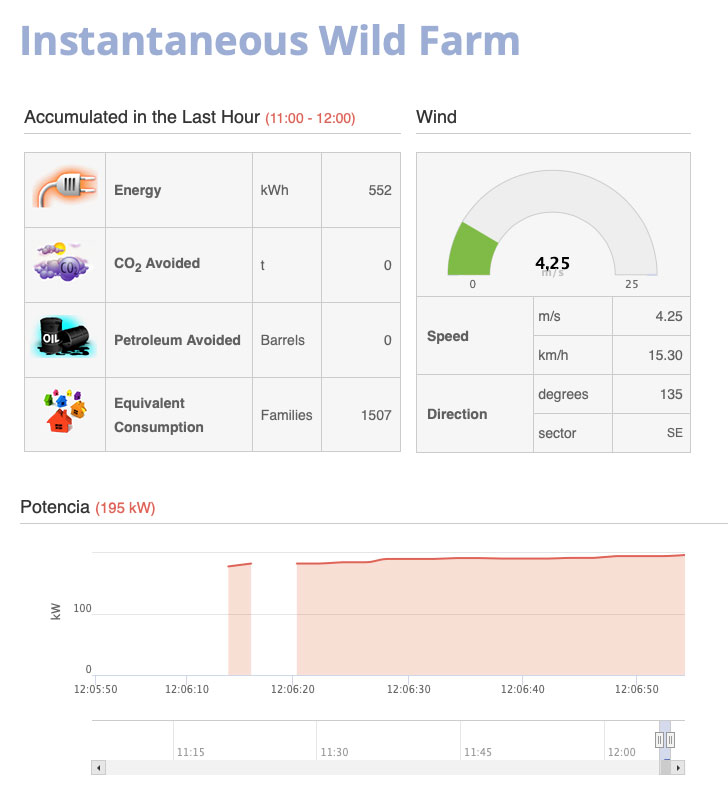 Web of representation of data in real time of the generation of electrical energy made in .js, canvas and php of the Sotavento Experimental Wind Farm.
This week I want to continue my learning using Processing and Max/MSP, as well as continue with the development of the final project designing the data visualization interface.
Processing
Processing is a flexible software sketchbook and a language for learning how to code within the context of the visual arts.
Although I had already experienced it years ago, I never managed to make a project from scratch, so it is a good time to do it.
Hello World!
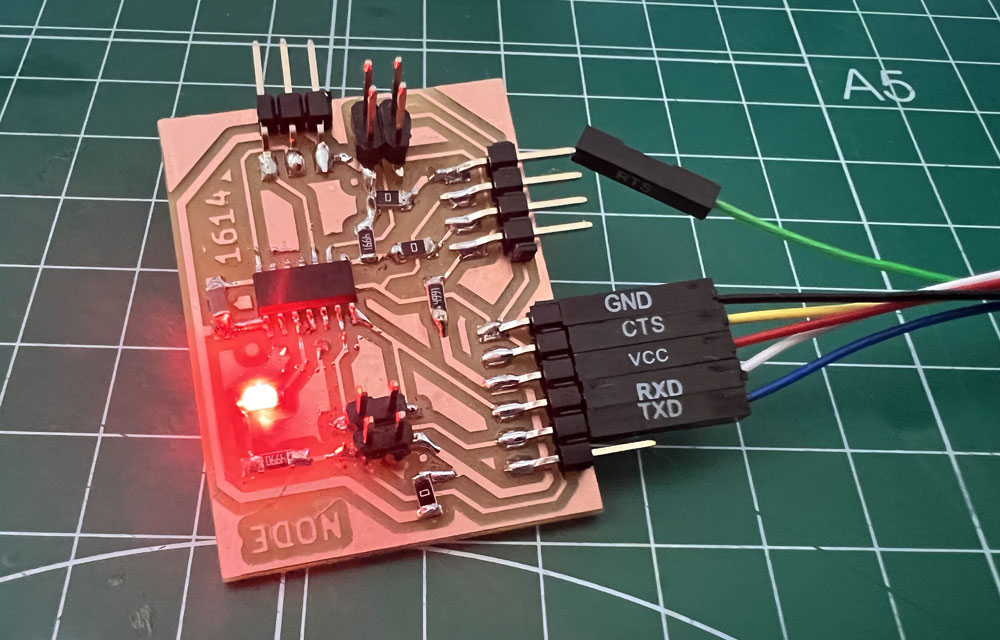
The first thing I did was a small Arduino program that sends a message through the serial port. I used the pcb with the Attiny1614 from the previous week.
 Download source code (.ino | .zip)
The Processing has an interface very similar to the ArduinoIDE, but what can be recognized with a simple view is everything.
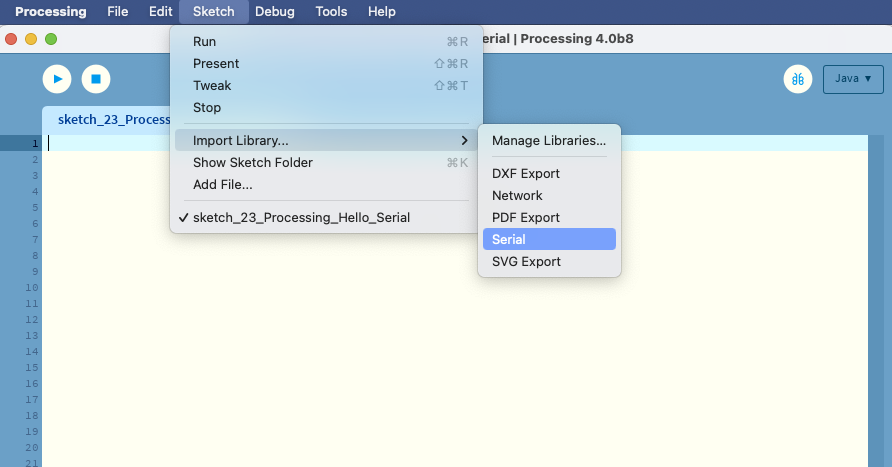
Once in processing, the first thing is to load the “Serial” library, from the top menu “Sketch”.
The code is divided into three parts, similar to Arduino, first we call the libraries, we declare variables… and then a void with setup and another with the loop called “draw”.
In the Setup, with the command printArray(Serial.list()); I make a list of all the serial ports that I have on my Mac, so I know which one is the Arduino or the programmer in this case. At the bottom of the screen, the “console” I see the list.
Once the port number is identified, I call it from Serial.list()[5], which is the number in this case.
And I define the baud rate of the port, the same one that I put in my Arduino program, 9600.
Inside the draw loop we check if it has been correctly connected to the serial port. If so, we get the message that comes through the port and save it in the “val” variable and print it to the console, as we can see.
 Download source code (.pde | .zip)
Temperature monitor
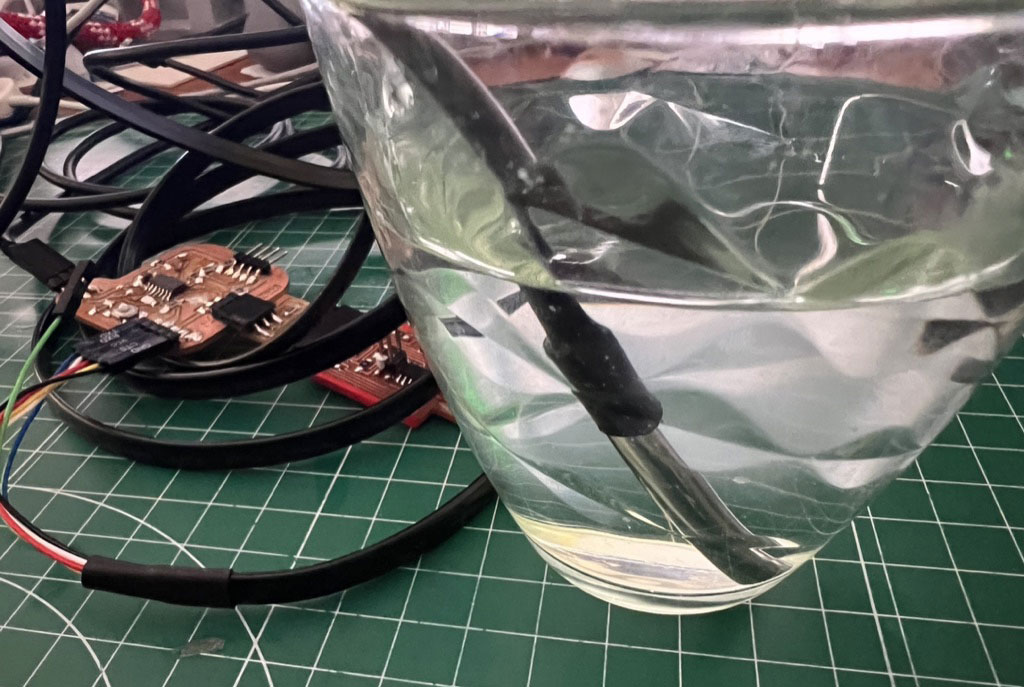
The next exercise is to make a visual representation on the screen of the values of a sensor. In this case I will use the Arduino program from the Inputs practice, in which I read the temperature of the DS1820 sensor. (24_temperature Arduino). I have simplified the code to simply serialize the temperature value and ignore the other values that were sent.
Already in Processing I start to make the program based on the previous example.
Inside the setup I make a 400x400pixels screen with size(400, 400);
When designing the objects and how to represent them on the screen, before defining what we want to put, we must give it the attributes of color, fill, font,… In processing, the objects are drawn in the order in which we do the code, so if we want to superimpose one on another we must respect this order.
Initially, the screen is not refreshed, so we will initially do backgroun(0); to delete everything at the beginning of the draw, otherwise the overlapping objects will appear.
I have followed the Processing reference manual to make the different drawings and texts on the screen (Processing Reference)
In processing we can use different Color modes, so initially I will work with the RGB components, to then easily animate with HSB the color change from blue (cold) to red (hot) of the temperature bar.
The H value (Hue) of the color allows us to vary the tone without affecting the saturation and brightness of our object, so in the following visual I will represent the colors that I am going to obtain.
In this case I make a map between the temperature values from 20 to 35 ºC and I equate them to 220º tone for the blue cold and 0º for the red heat, therefore in case of being at about 30 degrees centigrade the color shown will be a orange.
Also in the interface, I show the current hour and minute and if the temperature is rising or falling
 Download source code (.pde | .zip)
This is the result of the previous program.
List fonts
To know the fonts and their names in Processing that you have installed on your computer is as simple as making a simple sketch.
Once executed, it shows us by console the entire list of fonts that we have available, but be careful! When using fonts, remember that not all of them will be on all computers, and that ultimately in many cases your clients will not see the content as you have designed it, although for that it is always recommended to attach the font and load it directly from processing.
 Download source code (.pde | .zip)
Import images
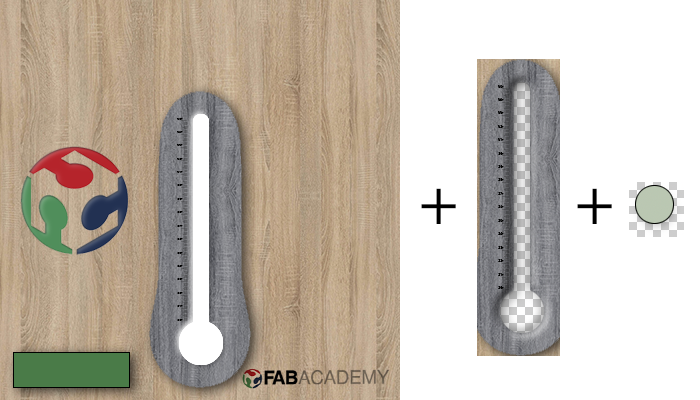
I could implement more design and customize it with graphic resources via programming, but in my case I am going to make an image in Photoshop to have a more real interface.
Finally I have designed 3 images in Photoshop in .png with transparencies to place on elements and thus make masks on the objects that I want to integrate into the interface.
 Download source code (.pde | .zip)
Group Assigment
The link to Group Assignments of Fab Lab León is this
Max
Max, also known as Max/MSP/Jitter, is a visual programming language for music and multimedia developed and maintained by the software company Cycling ‘74. It has been used by composers, performers, software designers, researchers, and artists to create recordings, performances, and installations.
The Max program is modular, with most of the existing routines as shared libraries. An application programming interface (API) allows the development of new routines by third parties (external named objects). Therefore, Max has a large user base of programmers not affiliated with Cycling ‘74 who enhance the software with commercial and non-commercial extensions to the program. Due to this extensible design, which simultaneously represents both the structure of the program and its graphical user interface (GUI), Max has been described as the lingua franca for developing interactive music performance software.
The way to program in Max is visual, through objects that connect to each other. We have our own audio (MSP), visual or 3d (Jitter) and the new Beap, preprogrammed audio modules.
For star to draw a program can double click in the work area. Will draw a new object. If write cycle~, this is the name of the object. After write will ask for the argument.
Now can add a gain~, can double click and write or add from top menu. Connect the sound generator to the gain is draw a line from signal output to the gain input same this images.
Later will add a ezdac~ the audio output and conenct to the gain to wire for the stero input of the object.
Finally will add 3 object types.
First add a scope~ this will made a graph similar to a oscilloscope and draw the audio signal.
Second with number~ and link from cycle output this show the current value of a audio object.
With number will can made a value numeric, in this case we link the output number to Y Display, samples per buffer. We can drag or write a new number for change the scope scale.
To create our interface, we must select which objects we want to show in presentation mode, once we have selected the objects that we want to present, if we select in Presentation Mode, we will see only those objects, which we can place in the way we want. Median .js will be able to give them another visual aspect.
Downloads
Explore more like this
17 - Invention, Intellectual Property, and Income
This is the last week before I present the final project, I already have a slide and video proposal of my project.
16 - Applications and Implications
Propose a final project masterpiece that integrates the range of units covered, answering: