Task required:
We assigned to write an application that interfaces with an input &/or output device that we made.
what I did ?
First of all, I downloaded the Matlab . Then, I connected it with the board that I made in week11 for the input devices it required to install the package for Arduino. Furthermore, after succeeding in connecting my board with the MATLAB. I write a code to read the temperature from the sensor. Finally, I plotted the readings from the sensor with real time.
Task Procedure
Connecting Arduino with MATLAB
I chose MATLAB for this assignment because I am familiar with it from undergraduate studies. I used MATLAB before for solving mathematical equations and plotting relations. This assignment is a good practice for me to review the software and learn new features. As well as I am excited to read real-time data as my first time to do that.
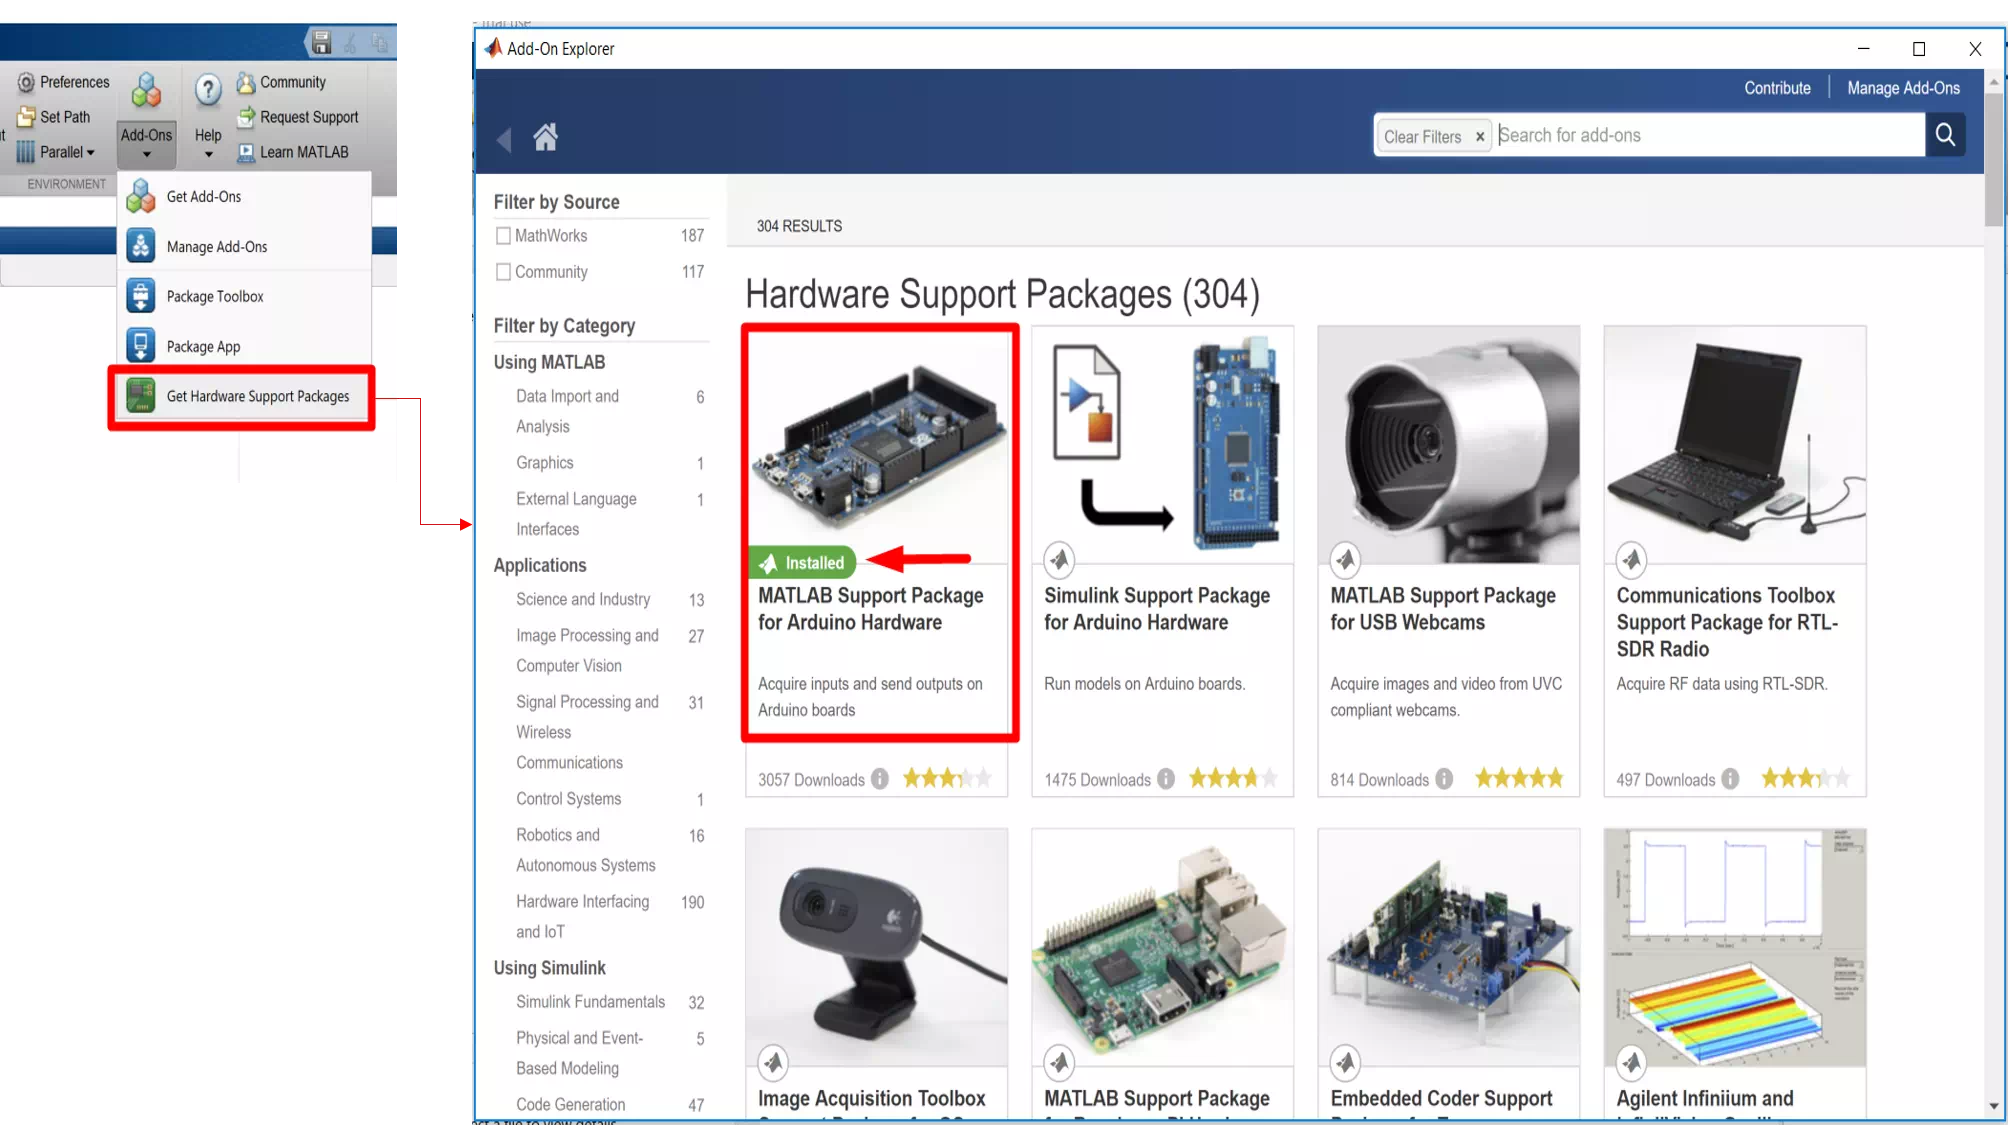
Well, there are two steps in this stage. First, I installed a package for Arduino to enables me to make a connection between the hardware and software as shown in the figure below.
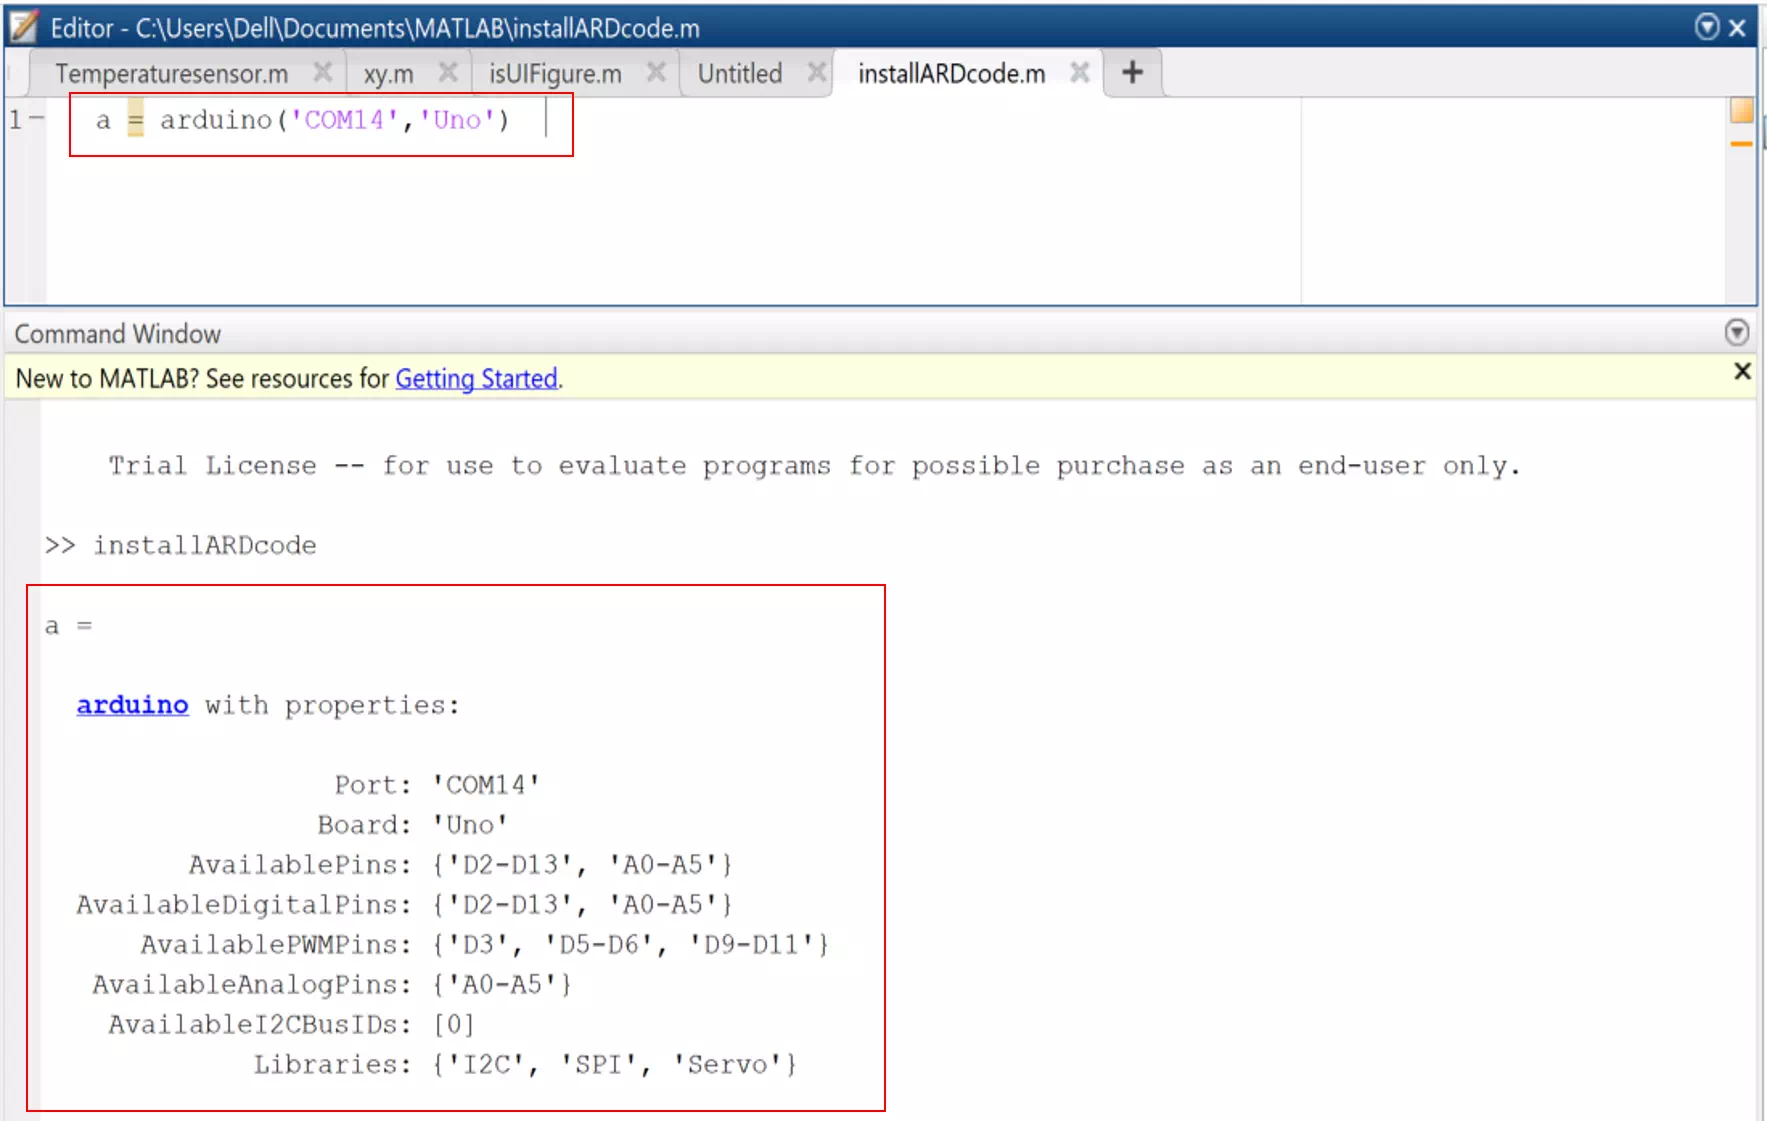
Next, is connecting the board before sending the codes by writing the following:
a = arduino('COM14','Uno')
Temperature code in MATLAB
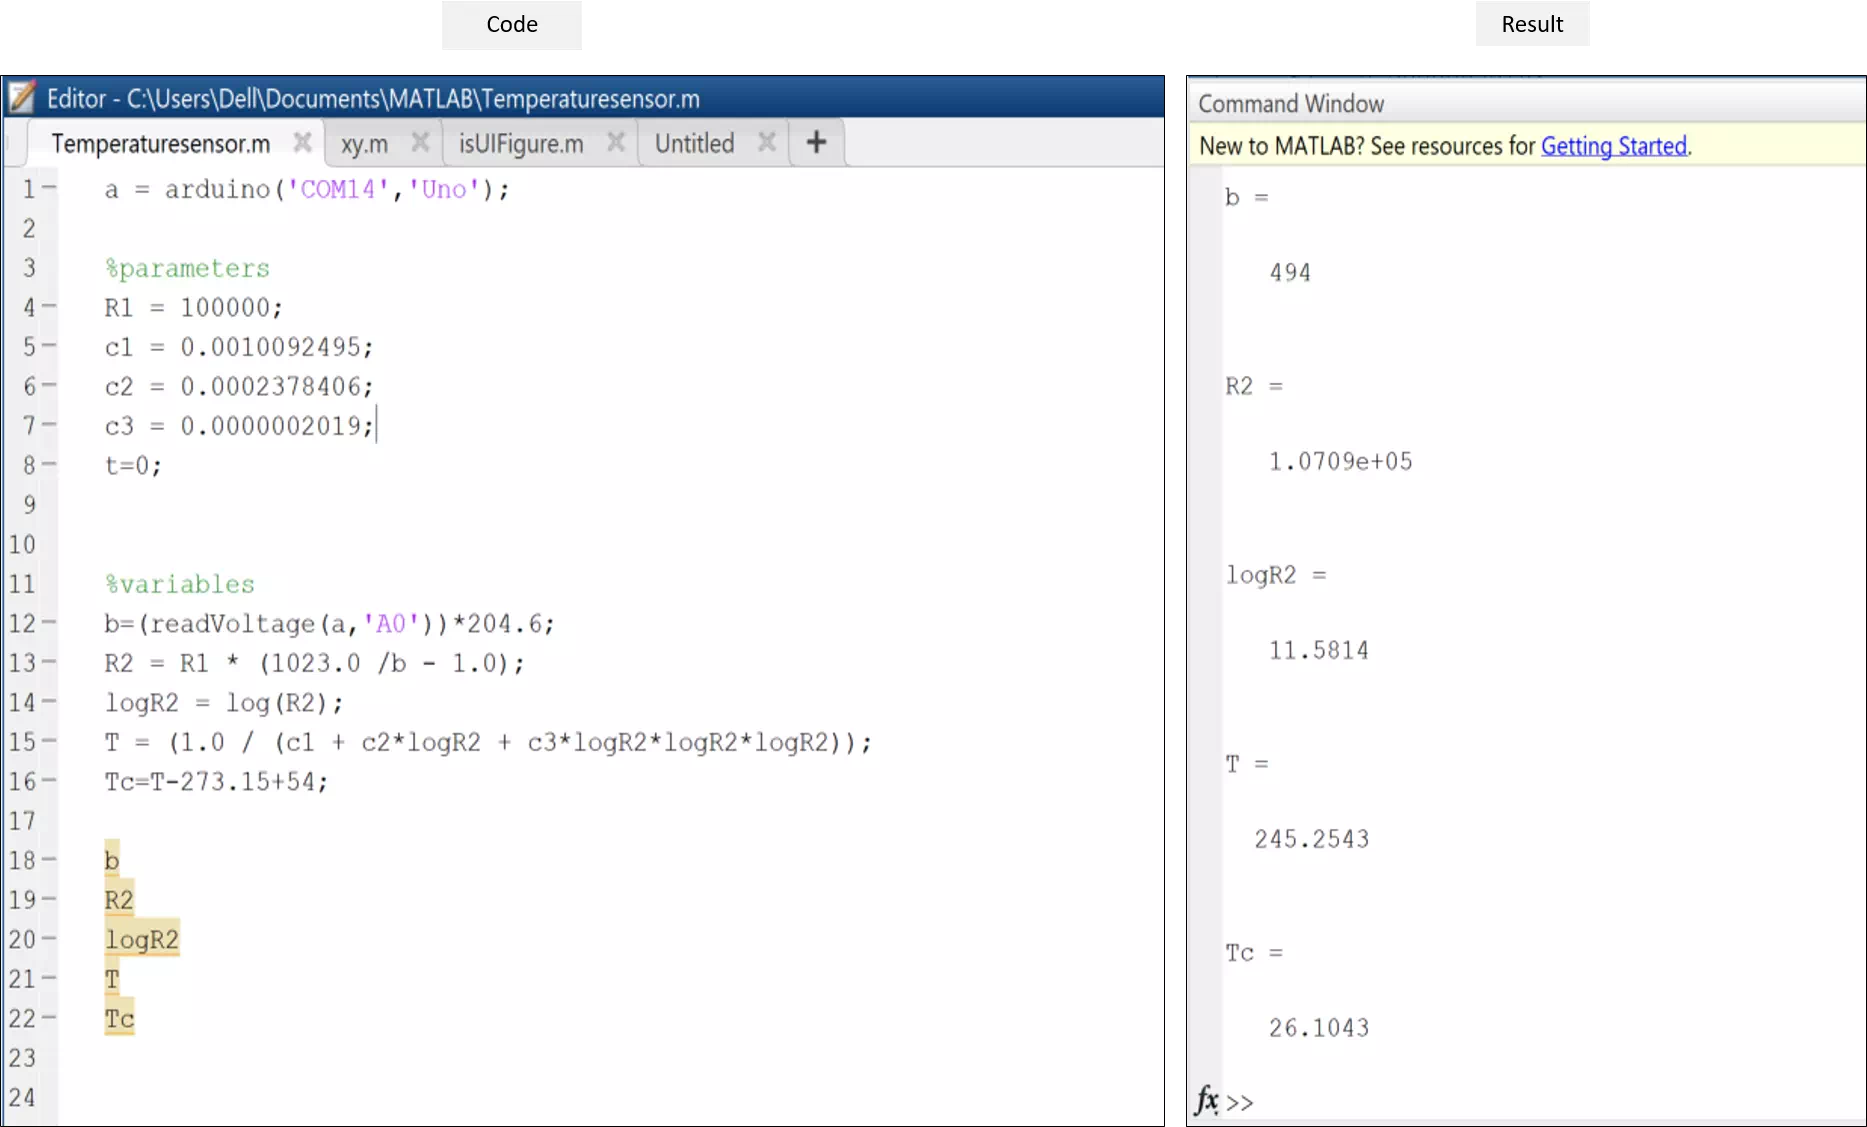
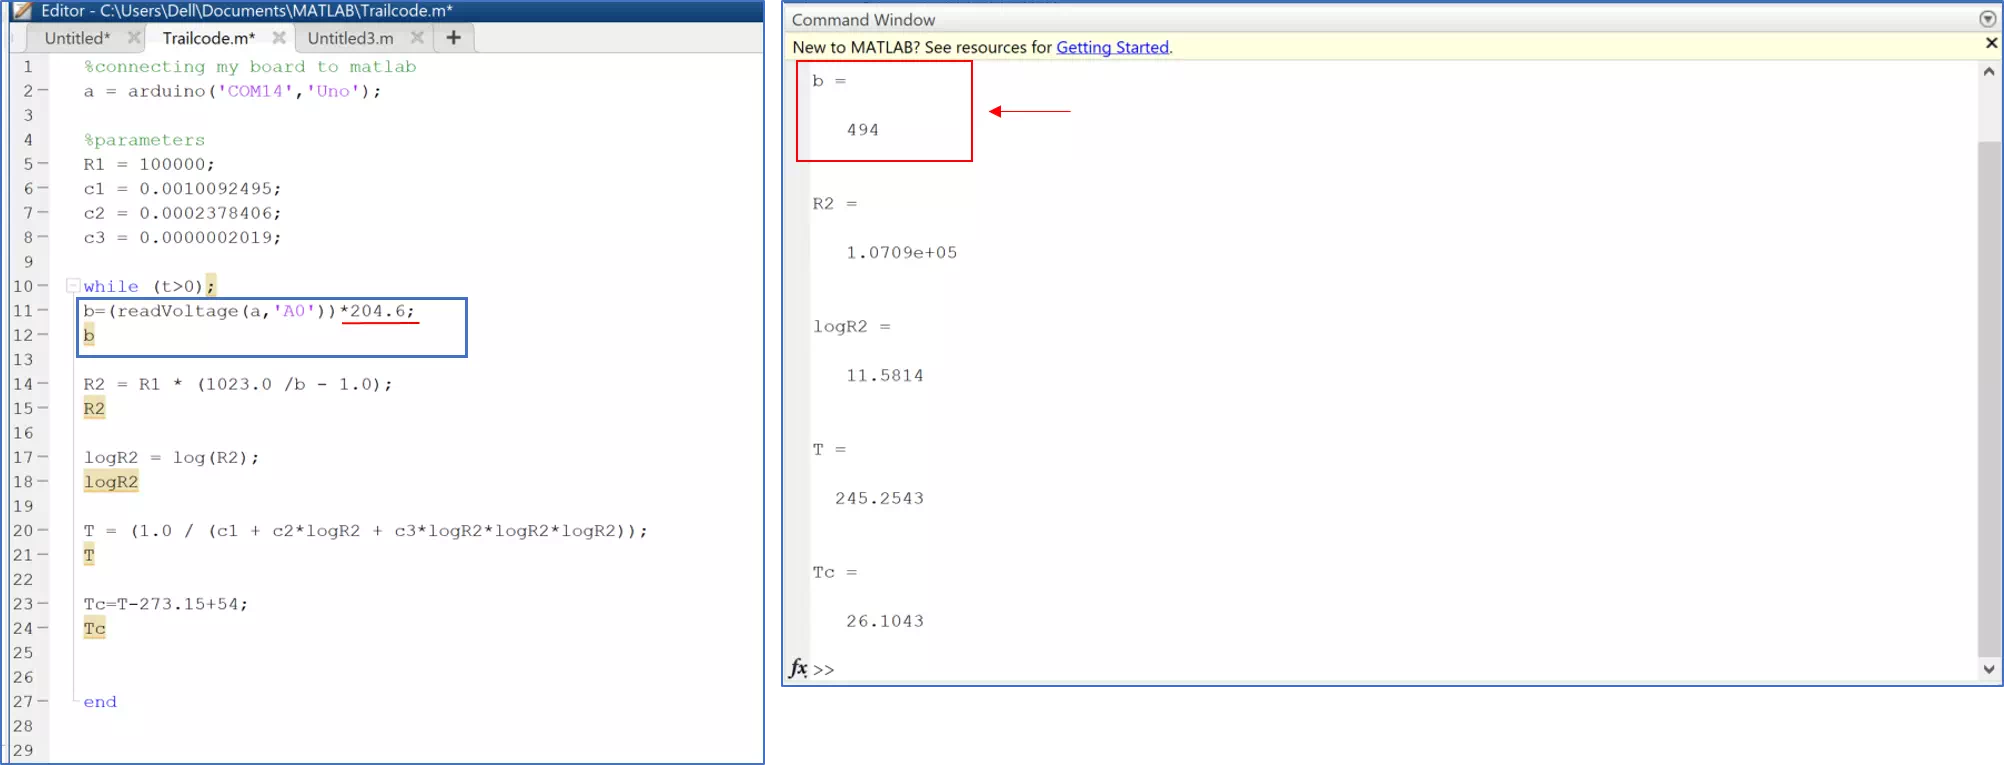
After connecting my board with MATLAB. I reviewed the code that I made in week11 with Arduino and started converting the formulas to MATLAB forms. The figure below present the code I used to find the valus.
Solved problem
Before plotting the data I compared the readings between MATLAB and Arduino to double check that my code in MATLAB is correct. Therefore, as shown in the figure below there was a huge difference between the voltage value in MATLAB and Arduino.
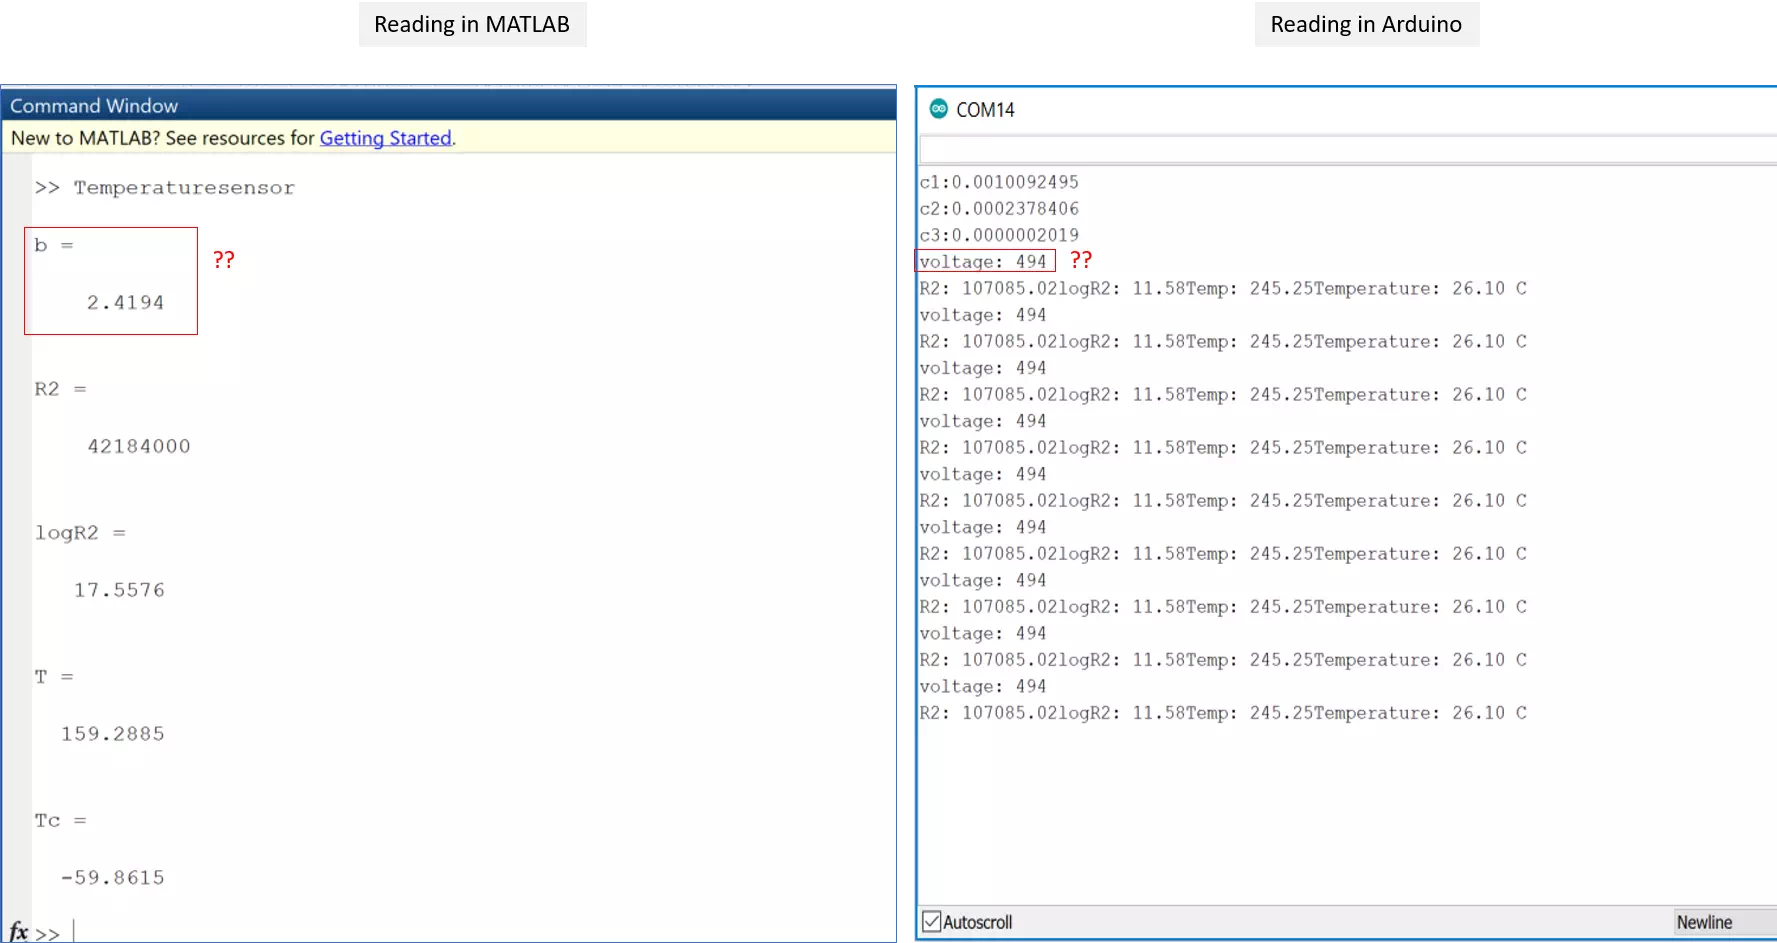
I know that the Arduino Uno can read 5 voltage as maximum input. Therefore, out great instructor Daniele supported me to figure out the problem and with reference to the guide , I understood that the analog input readings are returned as 10-bit integer values. The maximum numerical value for an (unsigned) 10-bit number is 1023. So, when the maximum input of 5 V is applied to one of the input pins, the maximum numerical value for an analog reading is 1023. To convert a numerical value returned by the analogRead function to a voltage should make the scaling 5V/1023=204.6. If I run my Arduino on 5 V, then 1023 = 5 V. But if I run my Arduino on 3.3 V, then 1023 = 3.3 V. Now, in order to get correct results in MATLAB I should use the coefficient 2.4V*(5/1023)=204.6V
Graph
Finally, after getting the correct readings now I finalized the code to plot temperature sensor readings varied with time as presented below. Notice, I used a heater to apply hot air on the sensor and observe the changing in the graph. The video below shows the overall connections and simulation.
a = arduino('COM14','Uno');

%parameters
R1 = 100000;
c1 = 0.0010092495;
c2 = 0.0002378406;
c3 = 0.0000002019;
t=0;


%variables
while (true)

b=(readVoltage(a,'A0'))*204.6;
R2 = R1 * (1023.0 /b - 1.0);
logR2 = log(R2);
T = (1.0 / (c1 + c2*logR2 + c3*logR2*logR2*logR2));
Tc=T-273.15+54;

pause(0.01);
t=[t,Tc];
plot(t);

xlabel('Seconds (sec)');
ylabel('Temperature (C)');
title('Real-Time Temperature Graph');

grid;
drawnow;


end