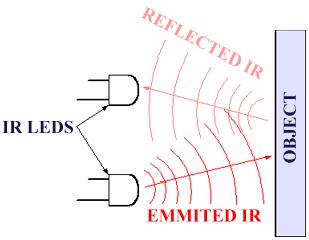
 The exact functionality depends greatly on the positioning and aiming of the emitter and detector with respect to the eye.
My final project is a dispositive that codifies and transmits NON CONSCIOUS body information such as: sweat, heart rate and eye blinking. The project seeks the augmentation of human experience through wearable physiological technology. It wishes to bring something private, namely our thoughts and emotions, and broadcast them to the world, through a screen placed in the chest:

Especially as much of our daily communication is moving away from face-to-face contact, we need new ways of expressing and transmitting our emotions to our peers. The project also relates to the work of Antonio Damasio who states that "The emotions come before feelings": Emotions are based on internal body environment which act as inputs into the brain, just as visual or auditory information is an input to the brain from the external environment. So the project will try to gather this previous-conscious world to interact with it, in ways yet not developed. Which might go from self-psicoanalisis to performance or visualizations.

Teletubbies have this square in the chest, wich could be seen as a window to their unconcious status, like an X-ray image of their feelings... this information could be screened locally in the chest or broadcasted to the internet.
This project have three inputs that gather this unconcious status: Eye blinking, galvanic skin response and heart rate:
This board is based in the hello.button hello.button example made in class, but the button is replaced by my eyelash. The idea is to close the circuit when the eyes are closed, with the contact of the copper eyelash. When the eye is closed a 1 is sent through the serial and while it remains open a 0 is sent.
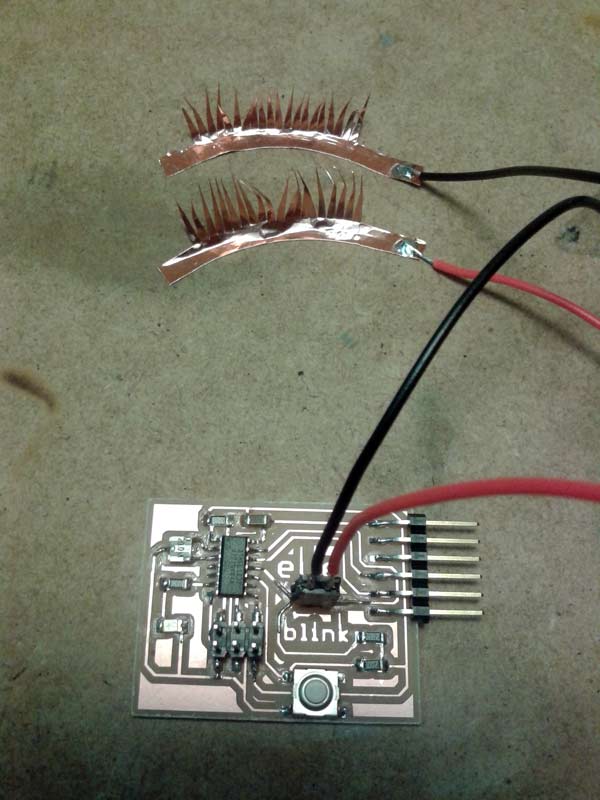
In week 12 I designed a code to visualize the rhythm of the pulses coming from the eye blinks. The idea is to draw black squares in each blink, and a line when not. This creates an easy way to visualize the rhythm involved:
The code also prints the current time when the drawing reaches the beginning of a new row. One screen is completed each 15 minutes with this configuration. With this easy visualization you can analize in wich time you have been blinking more constantly, faster or slower; even when your blinks were longer or shorter, in a concrete period of time.

Another nice approach works by illuminating the eye and/or eyelid area with infrared light, then monitoring the
changes in the reflected light using a phototransistor.
 The exact functionality depends greatly on the positioning and aiming of the emitter and detector with respect to the eye.
This is an scheme used in this
paper
to detect the eye blink of a rabbit:
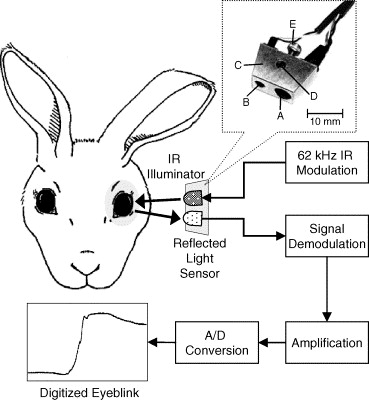
These are the kind of visualizations used in a scientific approaches:
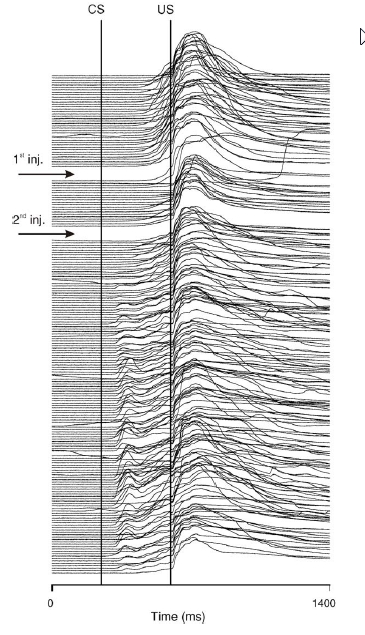 This reminded me to the JOY DIVISION "Unknown Pleasures" cover, wich could be a fantastic way of visualize
this kind of data:

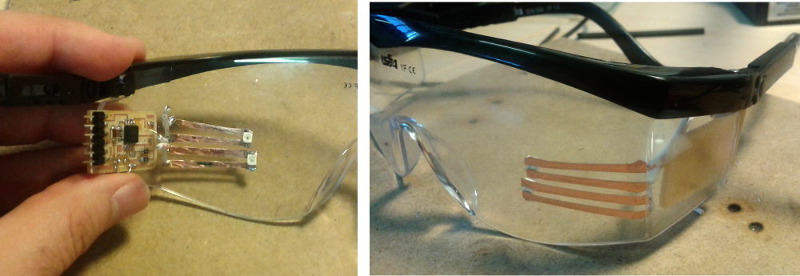
I used the hello.reflect board that I made in week 10 as input device. I replaced the LED with an infrared LED, so that there is no visible light going towards the eye. I used the OP280 Infrared Light Emitting Diode that we have in the inventory that works fine with the OP580 Phototransistor, placed in the hello.reflect board. The idea is to place both sensors in the glasses projected towards the eye, more or less in front of it.

Using Neil´s python script for hello.reflect , I get a substantial difference in the bottom red-marked value, wich meassures the difference between the values of the phototransistor when the LED is on and off:

Bellow you find a video with the sensor working in the Neil´s python script:
Skin conductance is known to be correlated with an individual's emotional state. It is often used in psychology for quantifying a person's reaction to different stimulus. It is also often implemented in a traditional lie detectors. The current theory is that a person under arousal generates sweat at the skin that changes the skin's electrical properties.
These are the best links that I found in the web about this issue: GSR reader Galvanic skin response And this is the link where I took from the final schematic and the list of components needed.
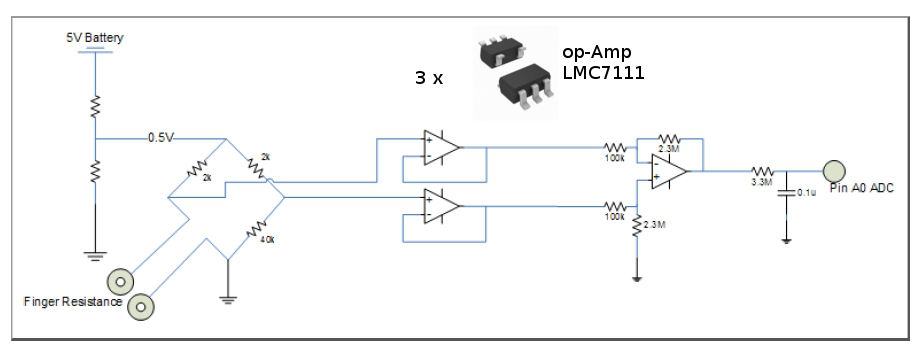
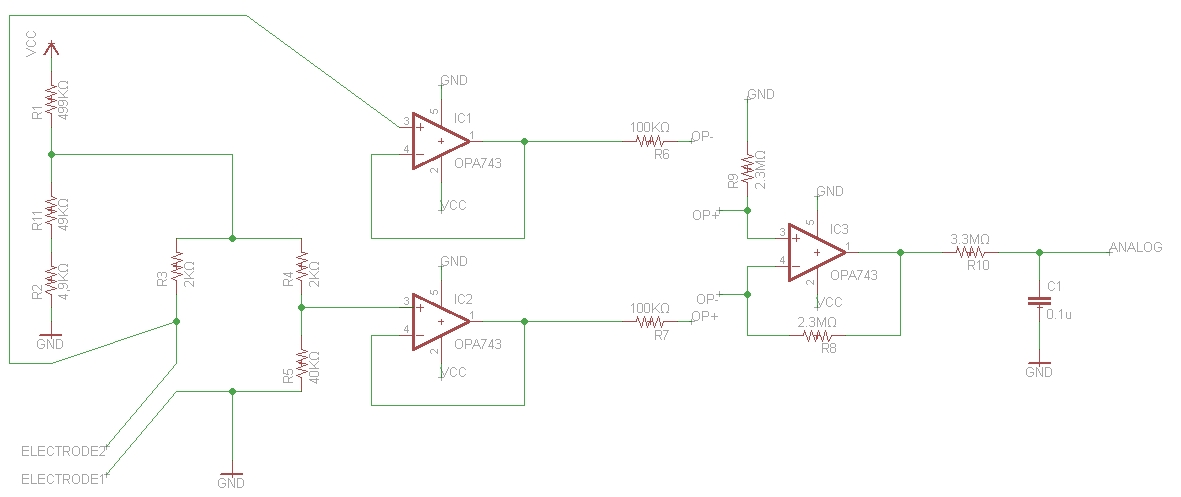
I made the schematic in eagle:
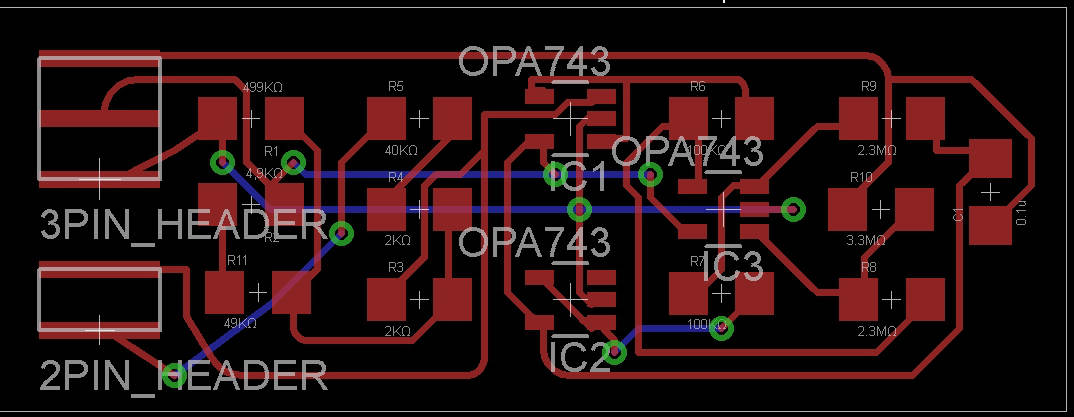
And routed the traces:
And here the .png files generated to mill a double sided board: In the order I milled them in the Roland Modela. The holes and the 0,0 marks:

The front side traces:
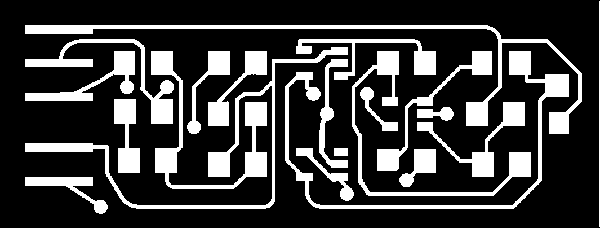
The back side traces:

The cut:

Bellow a picture, showing the two milled sides of the board:

After soldering the components I´ve tried to reuse several codes, but without much sucess.

So I tried a much simpler approach, I basically have 300k worth of resistors between the lead going to analog (0) and ground. So I have 5 volts going to one lead soldered to a film copper square. The other copper square and lead splits to two wires. One wire goes to analog(0) and the other goes through a 500k potentiometer and then to ground. What’s read in analog(0) is the change in resistance of the voltage going through your body.
This is the breadboard mounted:
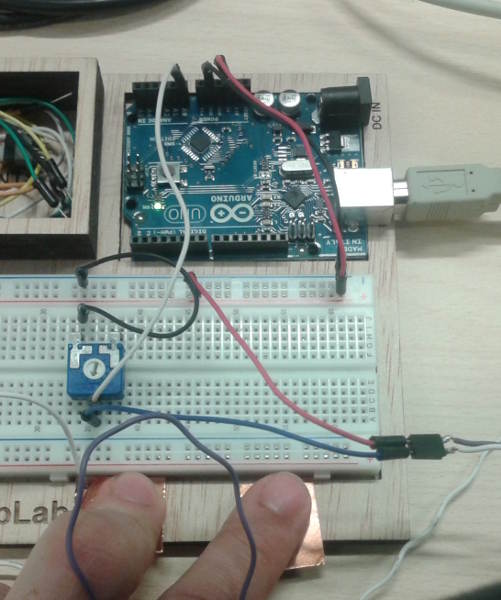
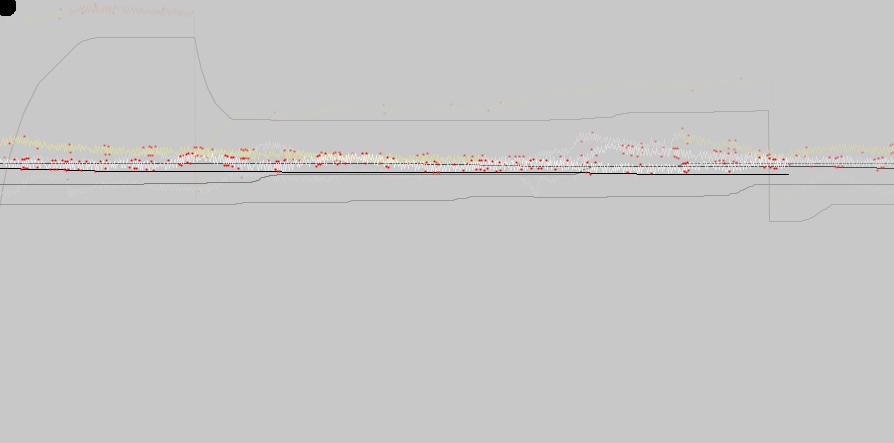
This is the link with the Arduino and Processing files used in this GSR sensor Bellow a screenshot of the visualization obtained after several minutes:
This sensor is based on the principle of photoplethysmography (PPG) which is a non-invasive method of measuring the variation in blood volume in tissues using a light source and a detector. Since the change in blood volume is synchronous to the heart beat, this technique can be used to calculate the heart rate. the light source and the light detector are both placed on the same side of a body part. The light is emitted into the tissue and the reflected light is measured by the detector.
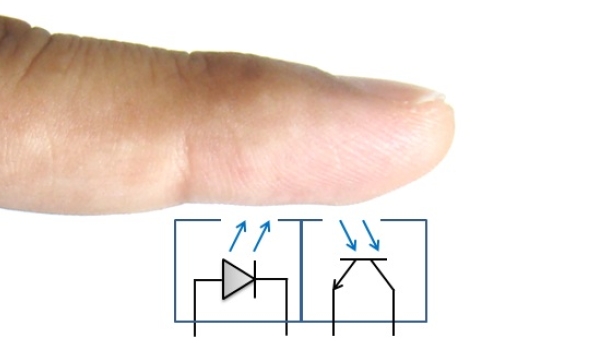
The detected light reflected from or transmitted through the body part will fluctuate according to the pulsatile blood flow caused by the beating of the heart.
These are the best links that I found in the web about this issue: Pulsesensor Easy pulse sensor
The PPG signal has two components, frequently referred to as AC and DC. The AC component is mainly caused by pulsatile changes in arterial blood volume, which is synchronous with the heart beat. So, the AC component can be used as a source of heart rate information. This AC component is superimposed onto a large DC component that relates to the tissues and to the average blood volume. The DC component must be removed to measure the AC waveform with a high signal-to-noise ratio. Since the useful AC signal is only a very small portion of the whole signal, an effective amplification circuit is also required to extract desired information from it.
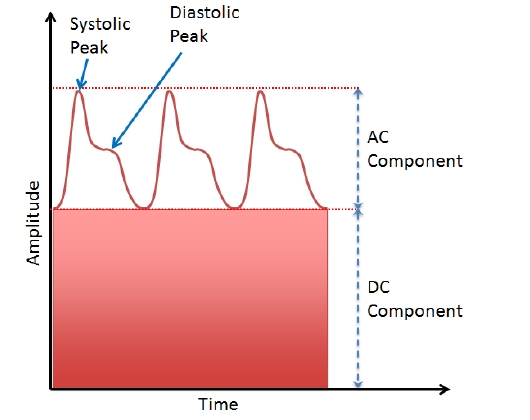
The sensor used in this board is TCRT1000, which is a reflective optical sensor with both the infrared light emitter and phototransistor placed side by side and are enclosed inside a leaded package so that there is minimum effect of surrounding visible light. The circuit diagram below shows the external biasing circuit for the TCRT1000 sensor. Pulling the Enable pin high will turn the IR emitter LED on and activate the sensor. A fingertip placed over the sensor will act as a reflector of the incident light. The amount of light reflected back from the fingertip is monitored by the phototransistor.

I also hacked the Pulsesensor following their open hardware link. Using Design Spark software, I was able to print the pdf files of the front and back traces of the board:

This how the .png files look like in order of usage: 1.- Perimeter marks and BIAS holes 2.- Front side traces 3.- Back side traces 4.- Cut
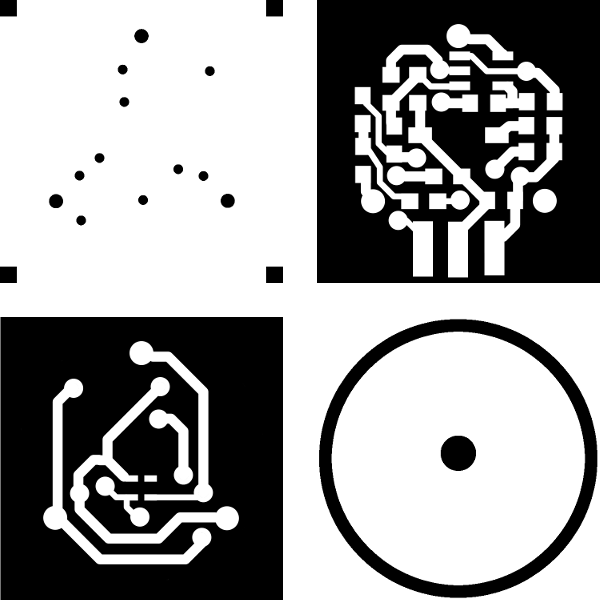
This is a very small board with 0603 components, so to achieve this size of routing I had to use a 0,01 inches mill:
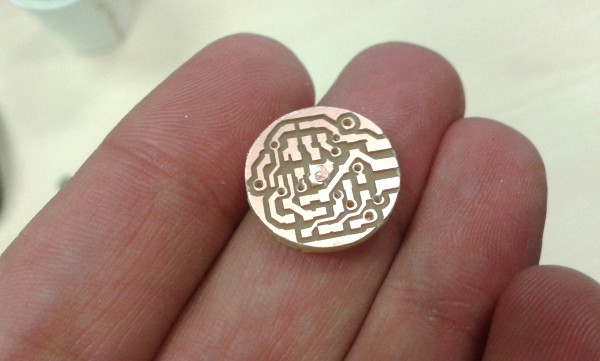
And this is the front side of the board with the components:
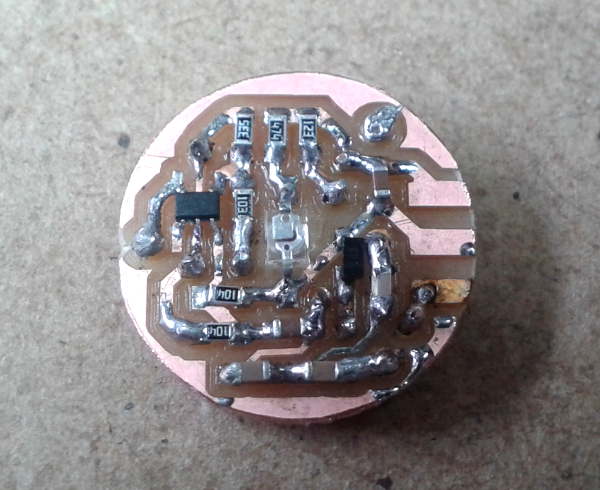
And this is the video of the sensor working, attached to the ANALOG 0 input of an ARDUINO
The final interface modifying the pulsesensor one:
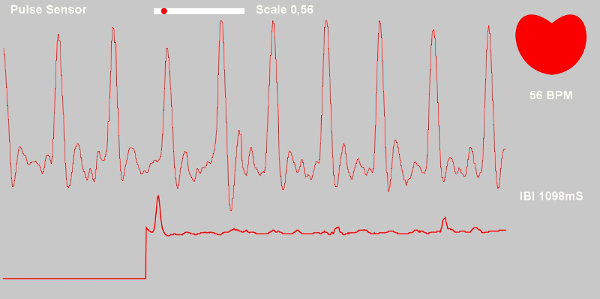
This is the link with all the files needed to reproduce this sensor and interface.
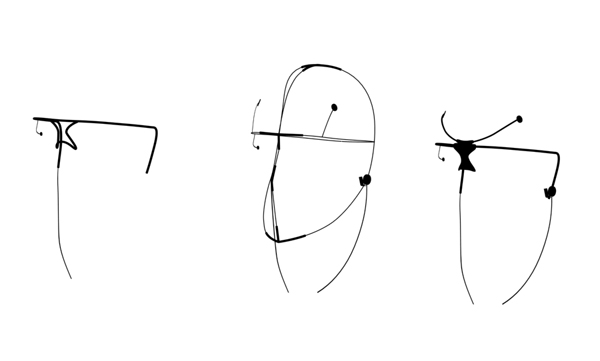
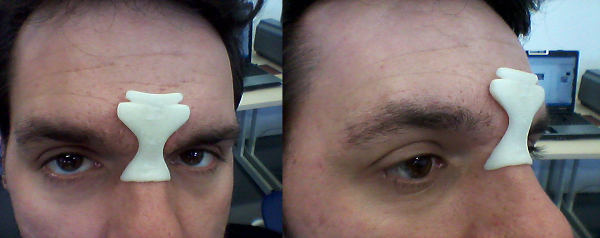
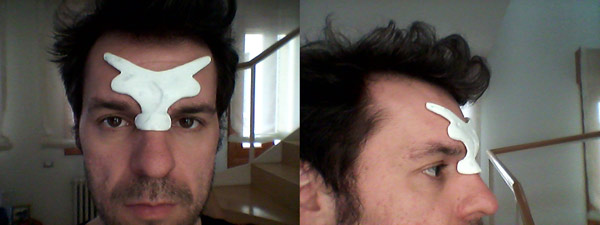
The physical part of the project has been evolving since the very begining, right now as shown in this page first scheme, it will be displaced to one side of the head, between the eye and the ear. This new enclosure has not been developed yet. I leave here som pics with the evolution:
To make the enclosure I will follow the same steps and materials used in molding and casting week.