Week 10 Input Devices
Welcome to my page about input devices! In the summary below, you can jump directly to topics.
Summary
Input devices are important in many electronics projects. They can measure a variety of things, including environmental parameters, touch, sound and light to name a few.
Assignments
Group project:
- Probe an input device(s)’s analog and digital signals
- Document your work (in a group or individually)
Individual project:
- Measure something: add a sensor to a microcontroller board that you have designed and read it.
Learning outcomes:
- Demonstrate workflows used in sensing something with input device(s) and MCU board
Project management
This week’s planning:
| Spiral | Tasks | Time |
|---|---|---|
| 1 | Group assignment | 8 hours |
| 2 | Design PCB schematics | 16 hours |
| 3 | Mill PCB boards | 4 hours |
| 4 | Soldering PCB boards | 1 hour |
| 5 | Programming the boards | 8 hours |
| 6 | Researching data sheets | 8 hours |
| 7 | Documentation | 8 hours |
Let’s get started!
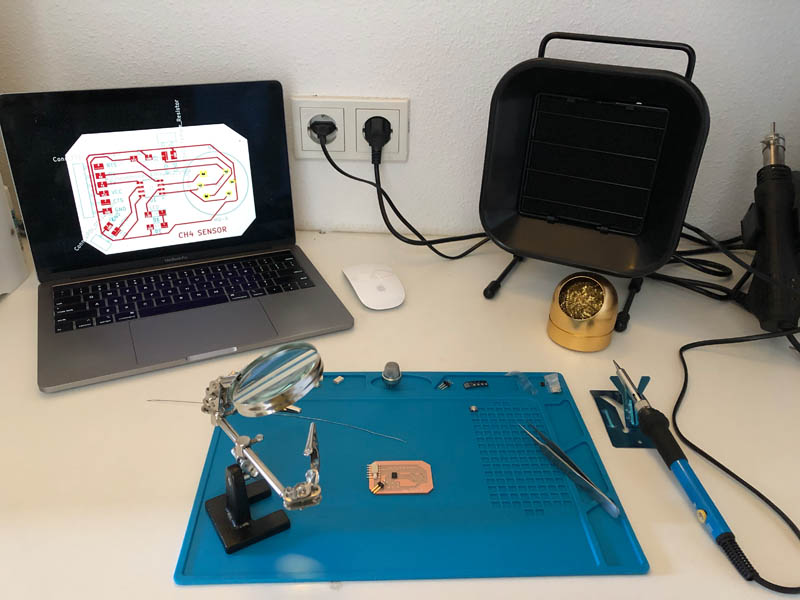
This week’s results
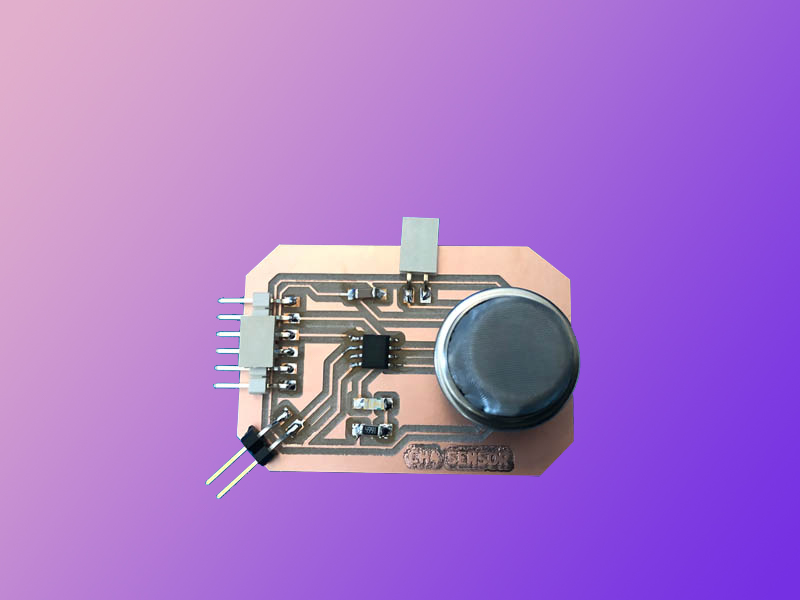
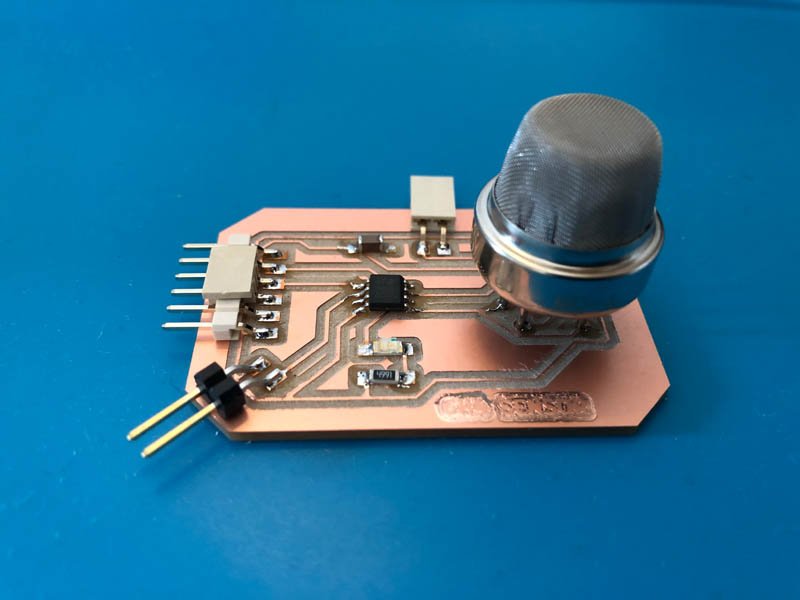
Circuit board with methane sensor: unfortunately this one didn’t show any data.
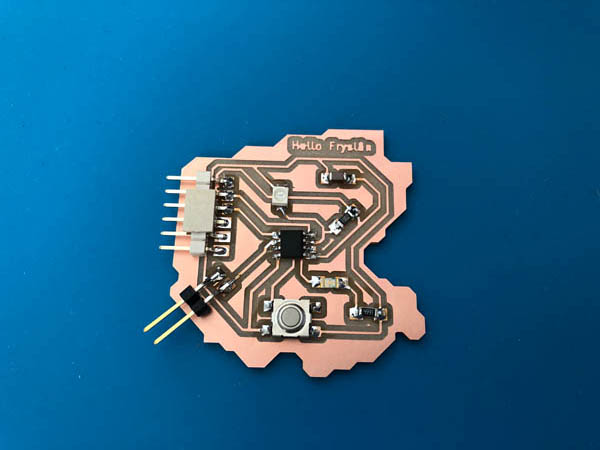
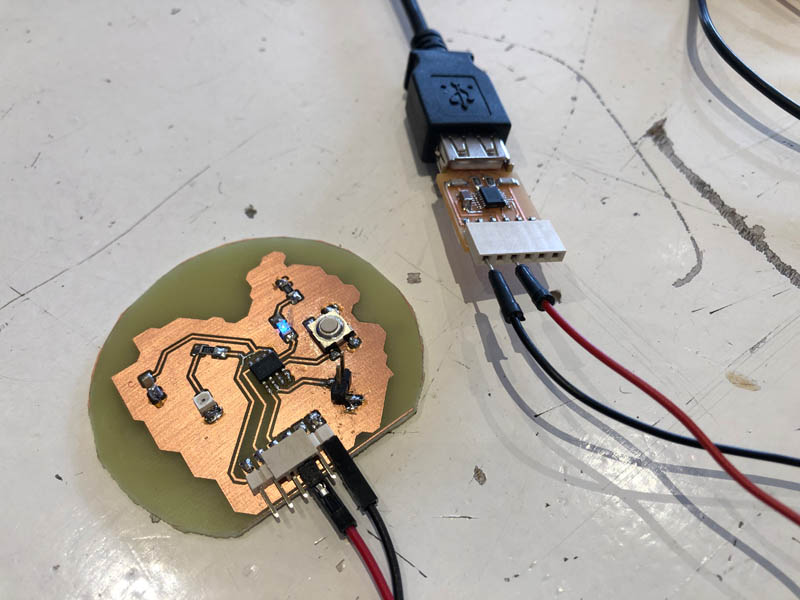
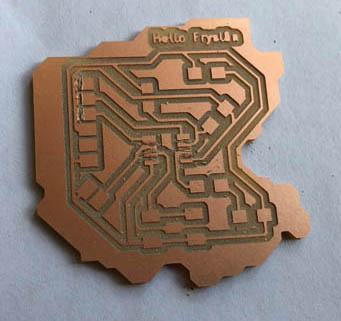
PCB with phototransistor and button.
Here is the hero video:
CNC3-3018Pro machine building process
The HRC60 milling bits finally arrived this week! So I can continue with building out my CNC milling machine.
To do:
- Design and lasercut acrylic bed protection (done)
- Assemble acrylic bed to CNC (done)
- Glue/assemble second acrylic layer to the acrylic bed
- Add a sacrificial layer with double-sided tape
- Install software (mods) and operate XYZ axis
- Perform Z-leveling with end-stop
- Test milling line traces and cut
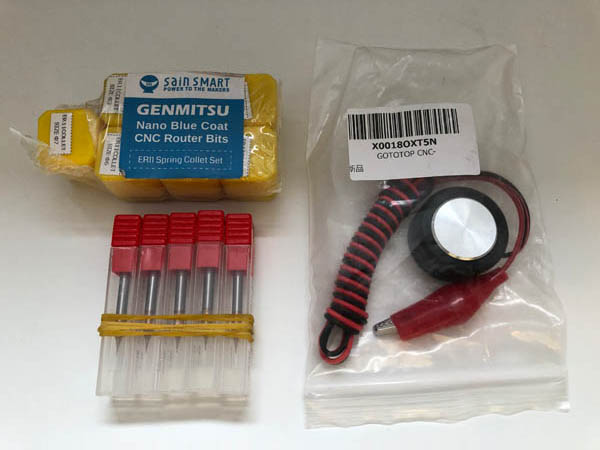
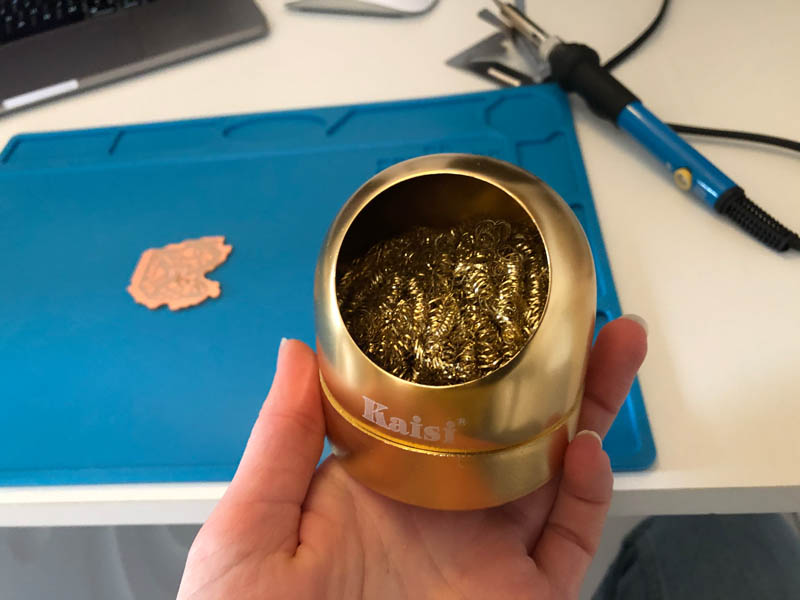
Finally, the components arrived! Here we see the CNC router bits, HRC2019 mill bits, end-stop and solder tip cleaner.
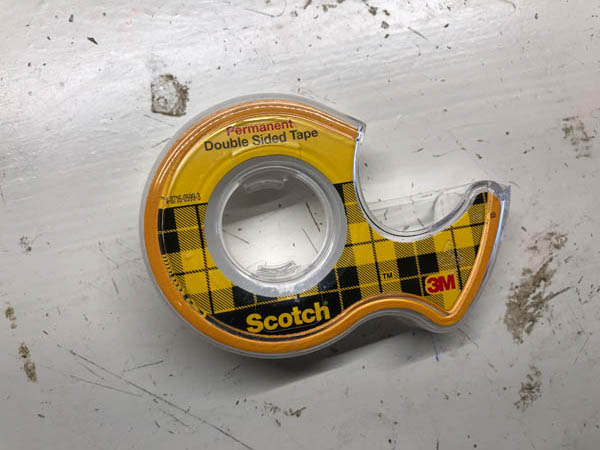
This is the double-sided tape I also need to order. I recommend to add these items to the Fab Electronics kit!
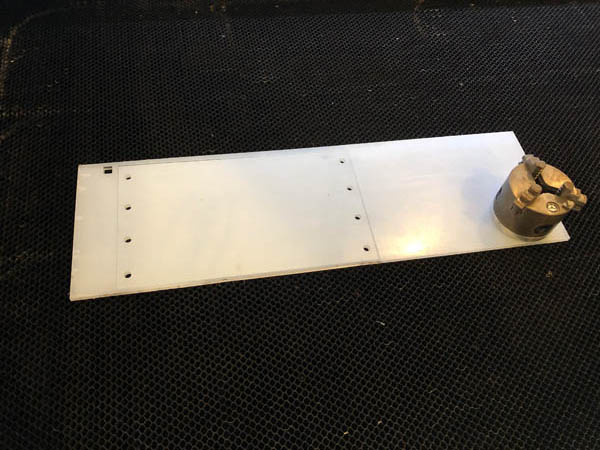
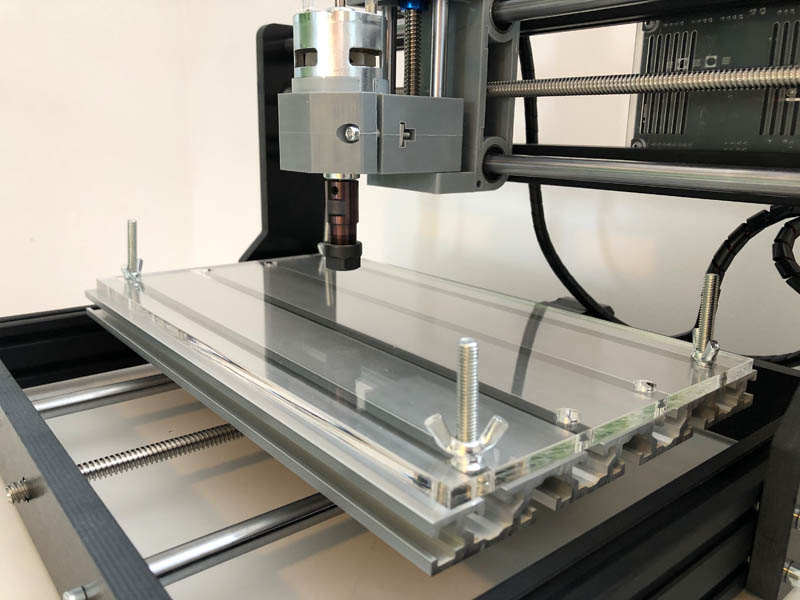
Based on this example from Henk’s CNC3-3018Pro at Waag I made an acrylic addition for the CNC bed.
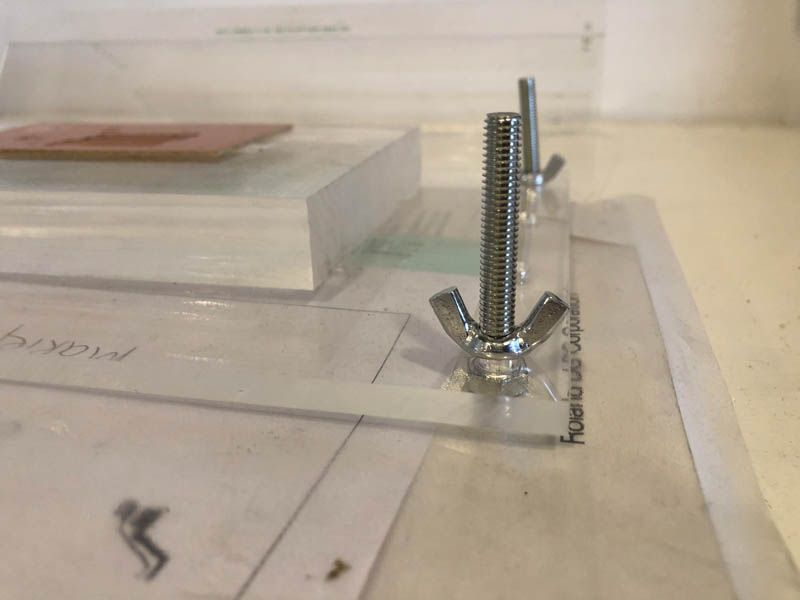
I measured the dimensions and designed it in Rhino. Then, I sent the file to the laser cutter for manufacturing the part on 6mm thick acrylic. The settings are:
- Speed: 10
- Power: 100
- Corner power: 10
- Kerf of circles: 0.25
It came out nicely and fits well. If you also want this for your CNC3-3018Pro you can download the .dxf file here.

Group assignment
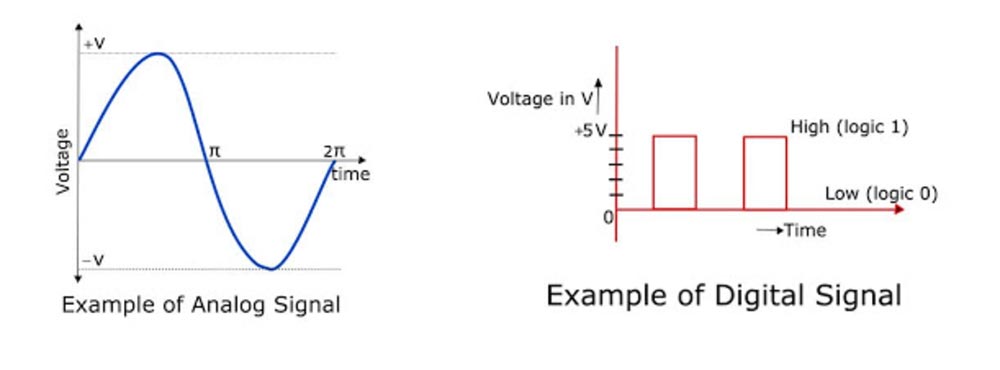
This week’s group assignment is to probe an input device’s analog and digital signals. Probing is the act of measuring the structure and duration of a pulse. This can be done with test probes. The major difference between analog and digital signals, is that analog signals have continuous electrical signals, while digital signals have non-continuous electrical signals. A visual example is provided by Schoolelectronic:
What did I learn today?
- Work with a multimeter
- Work with an oscilloscope to read signals
- Work with a logic analyzer. Unfortunately mine couldn’t connect due to usb cable timeout
- Connect a light sensor and temperature/humidity sensor to an Arduino board, load a program, and measure signals with an oscilloscope
- One step further in debugging my hello world board
Logic Analyzer
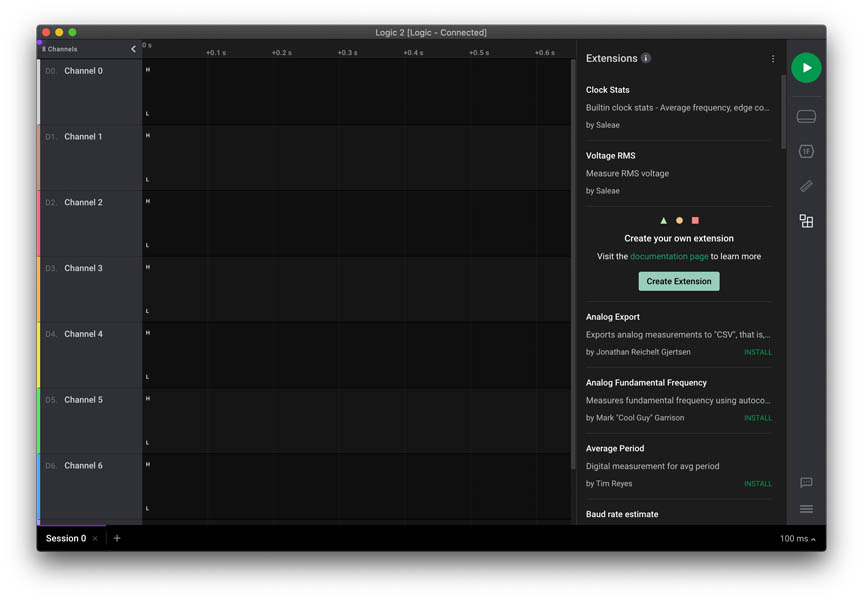
A logic analyzer is a debugging tool used to record and view digital signals. It checks if the bits arrive. The device in the Fab Academy Electronics Kit is from AZ delivery. The datasheet can be found here.
These devices are great for debugging embedded applications. In the mostcommon case, a developer working on firmware for a microcontroller will write acode to communicate with another component, possibly using protocols likeOne-Wire, UART (USART), I2C (TWI) or SPI. To verify the functionality or todiagnose errors in the firmware, a logic analyzer is connected to the digital I/Opins used for communication and records the activity during testing. Therecording is then show on the PC so the user can view the actual behavior ofthe firmware, and compare that with the expected behavior to narrow down andidentify the source of the issue, or to verify that the operation is correct.
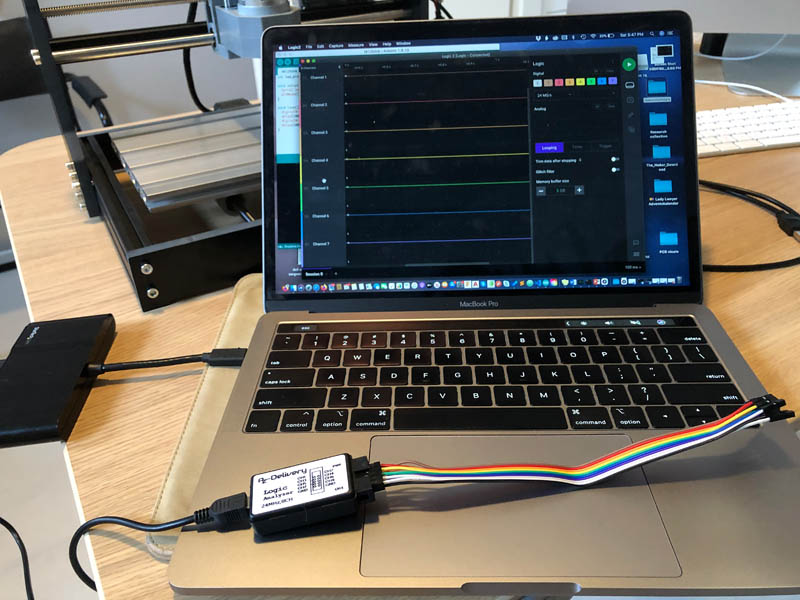
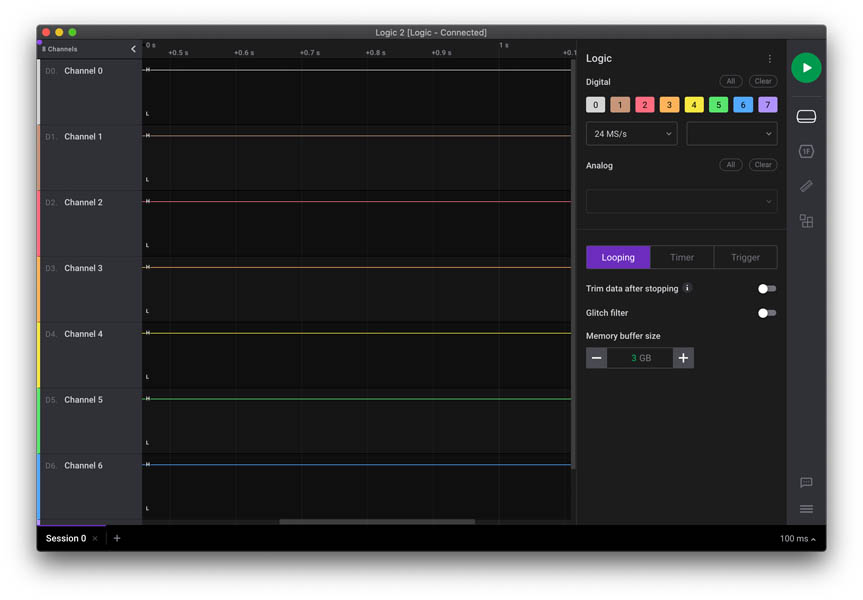
Software: Saleae Logic 2 app and/or Pulseview. Software interface:
Other resources:
- User guide & videos provided by Saleae
- Logic analyzer tutorial on Youtube
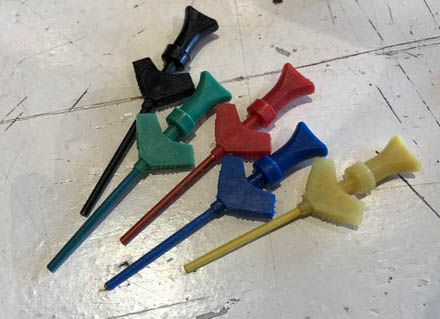
In preparation of the group assignment, Nadieh brought these hook clips. They are useful for connecting the logic analyzer to small pins on a board.
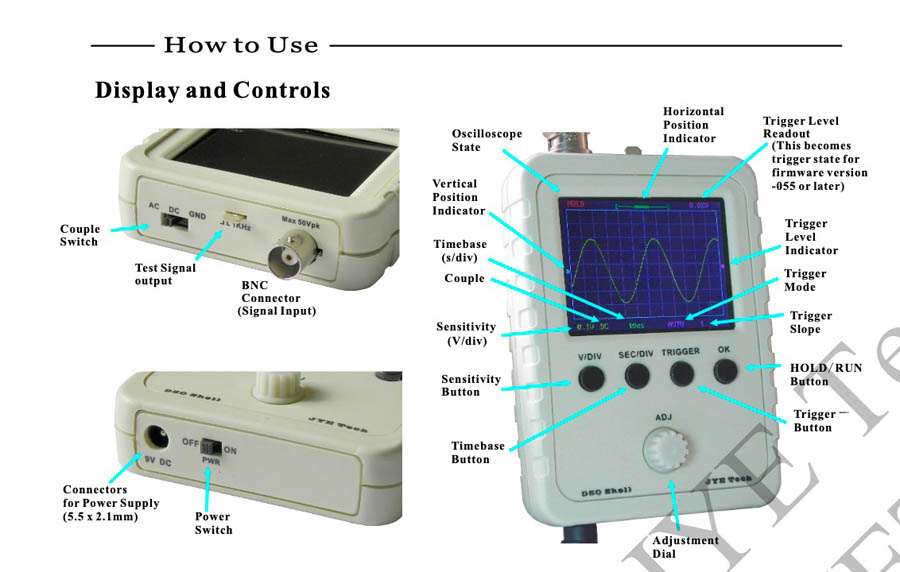
Oscilloscope
A user manual of the oscilloscope that came in the Fab Academy pack can be found here, provided by a Dutch vendor. This overview is pretty self-explanatory:
Light sensor
The first signal to measure is from a simple light sensor available at the Waag FabLab.
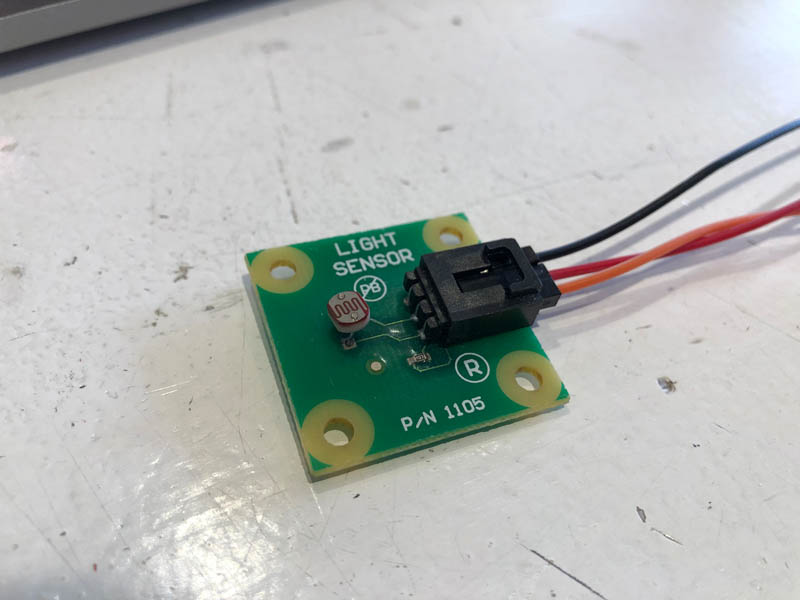
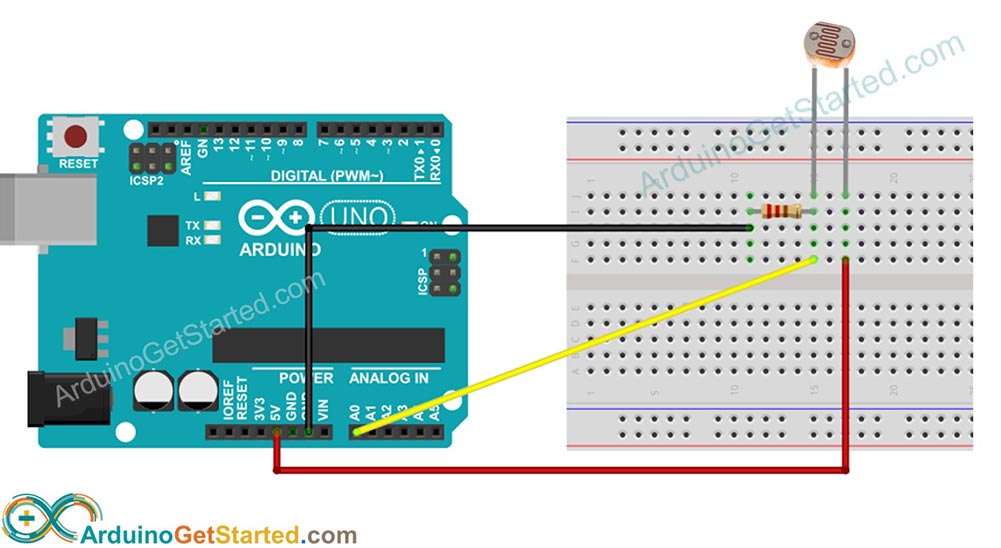
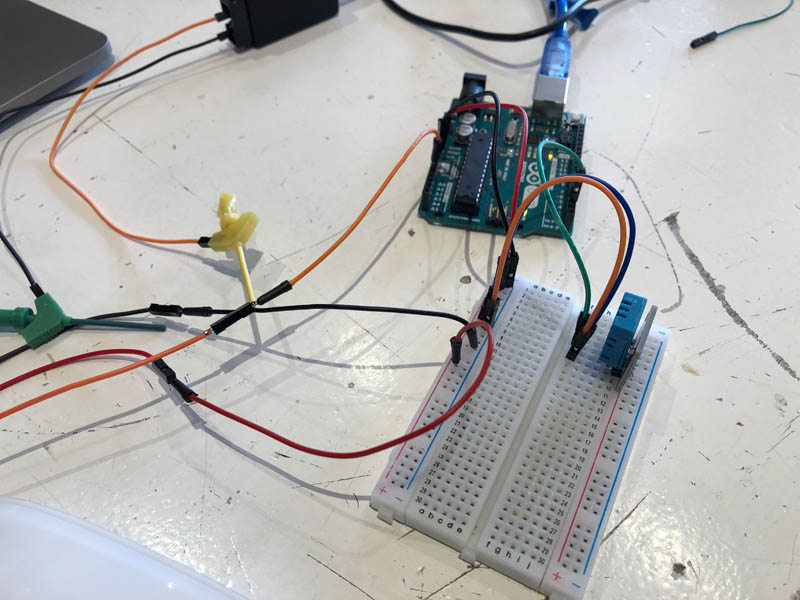
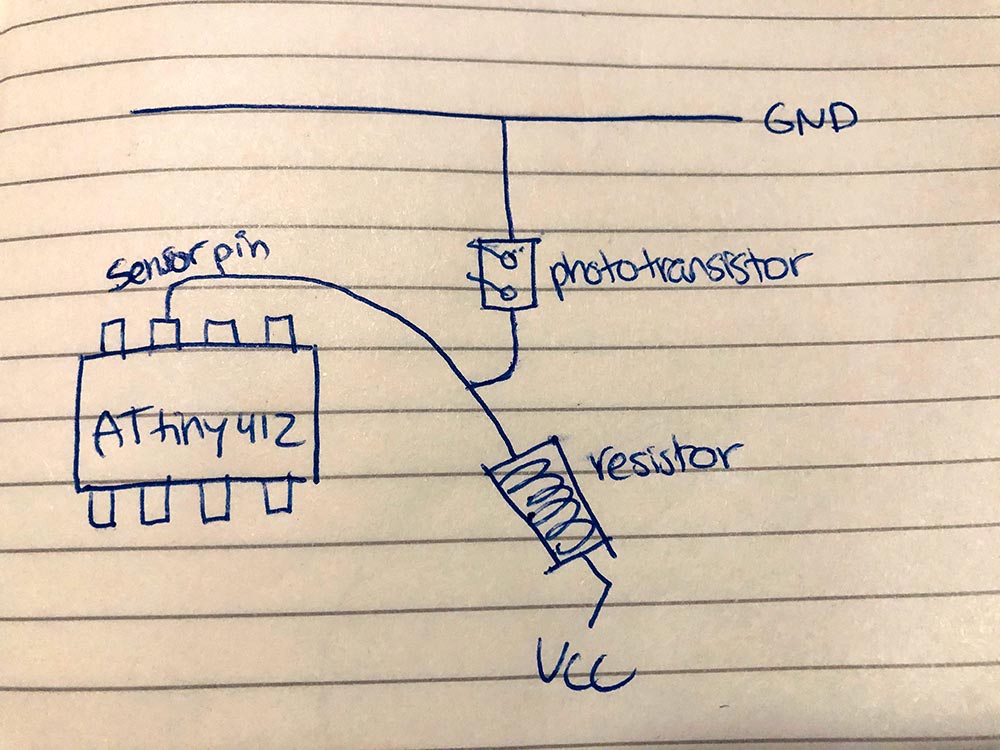
I connected this to an Arduino board with the help of this Arduino Light Sensor tutorial by Arduino Get Started. This is the wiring diagram:
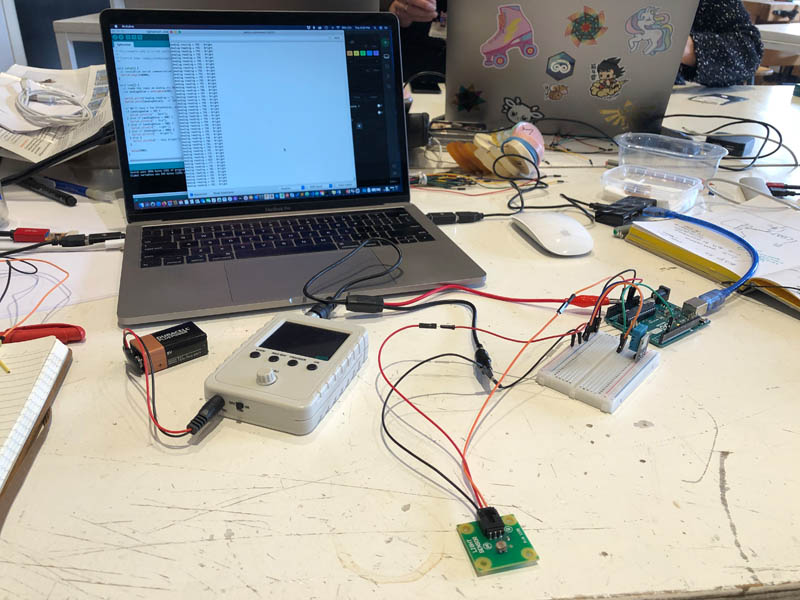
And the setup all connected:
I programmed it with the code provided in the tutorial:
/*
 * Created by ArduinoGetStarted.com
 *
 * This example code is in the public domain
 *
 * Tutorial page: https://arduinogetstarted.com/tutorials/arduino-light-sensor
 */

void setup() {
  // initialize serial communication at 9600 bits per second:
  Serial.begin(9600);
}

void loop() {
  // reads the input on analog pin A0 (value between 0 and 1023)
  int analogValue = analogRead(A0);

  Serial.print("Analog reading = ");
  Serial.print(analogValue);   // the raw analog reading

  // We'll have a few threshholds, qualitatively determined
  if (analogValue < 10) {
    Serial.println(" - Dark");
  } else if (analogValue < 200) {
    Serial.println(" - Dim");
  } else if (analogValue < 500) {
    Serial.println(" - Light");
  } else if (analogValue < 800) {
    Serial.println(" - Bright");
  } else {
    Serial.println(" - Very bright");
  }

  delay(500);
}
Here we see the program run successfully:
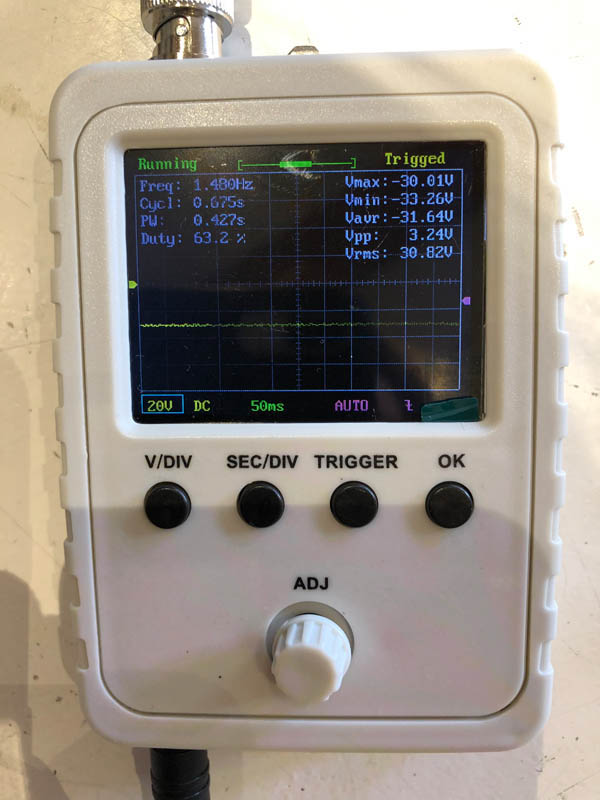
This is the oscilloscope from the Fab Electronics Kit. With the left knob (or actually, potentiometer, as we have learned in previous weeks) labeled V/DIV you can regulate the sensitivity. Turn this up and down to change the range of your measurement on the y-axis. In the example below, it is set at 20V. This is too high because the signal should be somewhere in between 1-5 Volts. With the second knob SEC/DIV you can change the time interval, thus the horizontal axis.
In this video the sensitivity of the oscilloscope is set at 1V and the time interval at 0.1 seconds. Now we can clearly observe a signal. It shows the response of the signal when my hand blocks and unblocks the light sensor by moving down and up respectively.
Here is a picture of the moment when the light is blocked. Shortly after, the signal moves downward.
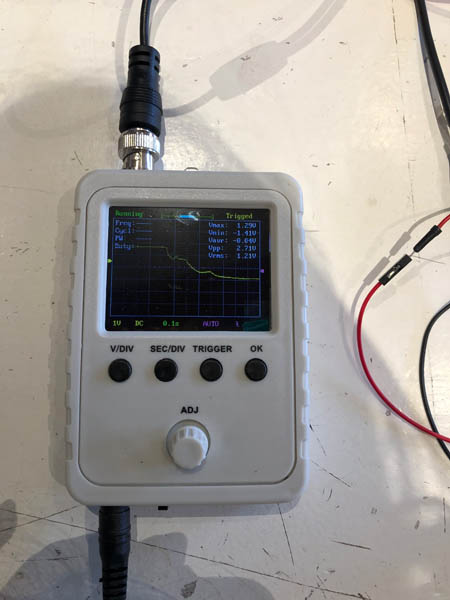
Based on its shape and behavior, we can confirm it is an analog signal.
Temperature and humidity sensor
The second sensor measures temperature and humidity. This is the wiring:
And here is the code:
// Example testing sketch for various DHT humidity/temperature sensors
// Written by ladyada, public domain

// REQUIRES the following Arduino libraries:
// - DHT Sensor Library: https://github.com/adafruit/DHT-sensor-library
// - Adafruit Unified Sensor Lib: https://github.com/adafruit/Adafruit_Sensor

#include "DHT.h"

#define DHTPIN 2     // Digital pin connected to the DHT sensor
// Feather HUZZAH ESP8266 note: use pins 3, 4, 5, 12, 13 or 14 --
// Pin 15 can work but DHT must be disconnected during program upload.

// Uncomment whatever type you're using!
#define DHTTYPE DHT11   // DHT 11
//#define DHTTYPE DHT22   // DHT 22  (AM2302), AM2321
//#define DHTTYPE DHT21   // DHT 21 (AM2301)

// Connect pin 1 (on the left) of the sensor to +5V
// NOTE: If using a board with 3.3V logic like an Arduino Due connect pin 1
// to 3.3V instead of 5V!
// Connect pin 2 of the sensor to whatever your DHTPIN is
// Connect pin 4 (on the right) of the sensor to GROUND
// Connect a 10K resistor from pin 2 (data) to pin 1 (power) of the sensor

// Initialize DHT sensor.
// Note that older versions of this library took an optional third parameter to
// tweak the timings for faster processors.  This parameter is no longer needed
// as the current DHT reading algorithm adjusts itself to work on faster procs.
DHT dht(DHTPIN, DHTTYPE);

void setup() {
  Serial.begin(9600);
  Serial.println(F("DHTxx test!"));

  dht.begin();
}

void loop() {
  // Wait a few seconds between measurements.
  delay(2000);

  // Reading temperature or humidity takes about 250 milliseconds!
  // Sensor readings may also be up to 2 seconds 'old' (its a very slow sensor)
  float h = dht.readHumidity();
  // Read temperature as Celsius (the default)
  float t = dht.readTemperature();
  // Read temperature as Fahrenheit (isFahrenheit = true)
  float f = dht.readTemperature(true);

  // Check if any reads failed and exit early (to try again).
  if (isnan(h) || isnan(t) || isnan(f)) {
    Serial.println(F("Failed to read from DHT sensor!"));
    return;
  }

  // Compute heat index in Fahrenheit (the default)
  float hif = dht.computeHeatIndex(f, h);
  // Compute heat index in Celsius (isFahreheit = false)
  float hic = dht.computeHeatIndex(t, h, false);

  Serial.print(F("Humidity: "));
  Serial.print(h);
  Serial.print(F("%  Temperature: "));
  Serial.print(t);
  Serial.print(F("°C "));
  Serial.print(f);
  Serial.print(F("°F  Heat index: "));
  Serial.print(hic);
  Serial.print(F("°C "));
  Serial.print(hif);
  Serial.println(F("°F"));
}
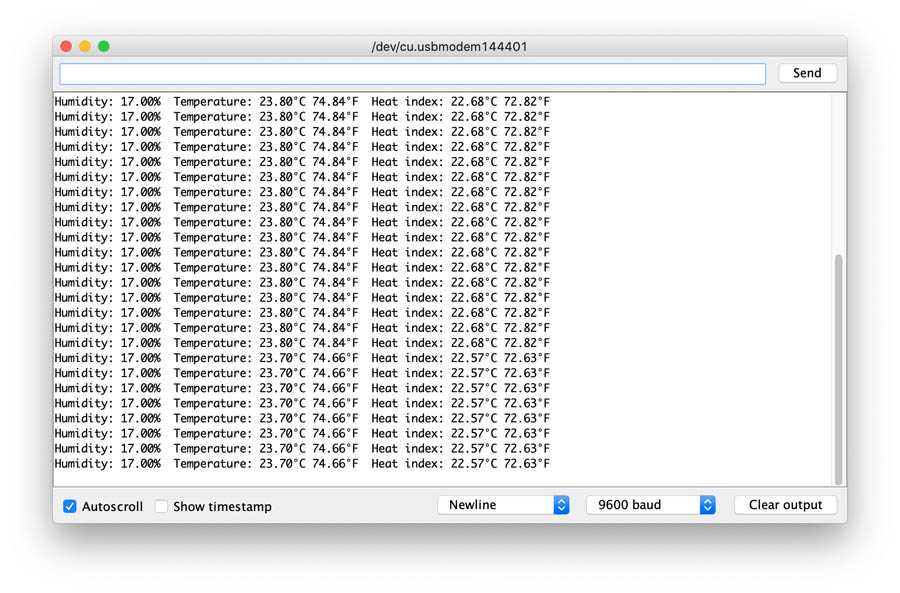
Under Arduino IDE’s Tools you can find the Serial Monitor. This will print the measurements.
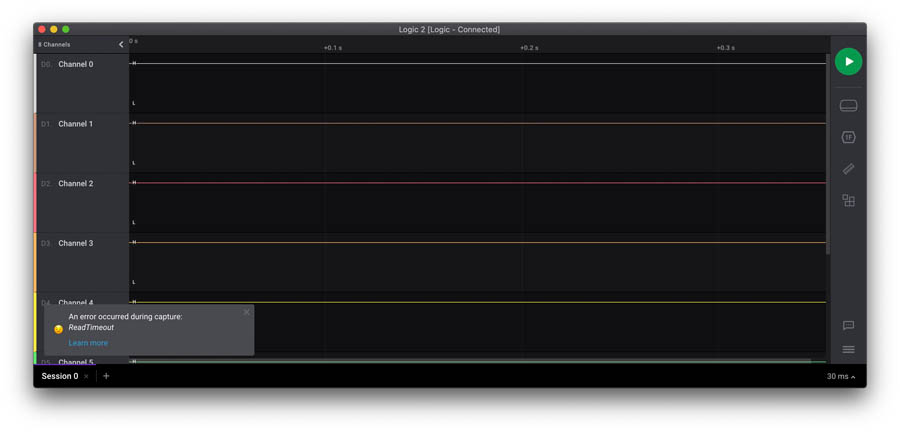
Now we can measure the signals with a logic analyzer. Unfortunately, I kept getting this error:
ReadTimeout: This error message appears when the device side buffer has run out of memory caused by delays on the USB line during data capture.
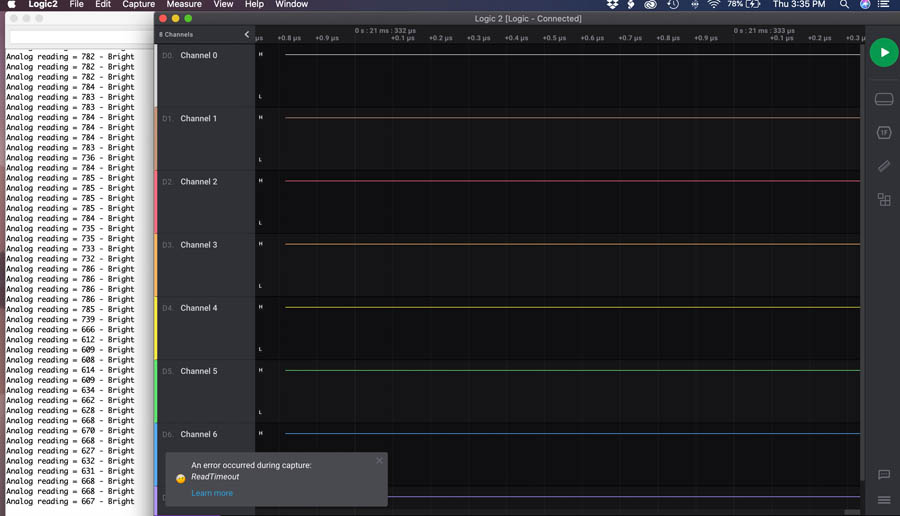
In their troubleshooting section Saleae is mentioning that the device is not able to keep up, with the following reason:
The Saleae Logic produces data at a fixed rate and can’t tolerate periodic delays between read requests because the device side buffer space is limited. This error message shows up when the device side buffer has run out of memory caused by delays on the USB line during data capture.
Other students in our group had this problem occasionally, but their devices generally worked. We tested this setup on their laptops and it showed a signal. So it might be my USB to USB-C hub that’s causing trouble.
Lecture notes about Input Devices
New ATTiny412's have a clock on board.

Temperature
- NTC: temp down --> resistor down --> Voltage down
- RTD: temp down --> resistor up --> Voltage up

They are resistors which are sensitive to temperature. Depending on the type you need to

1. Simplest way: only measures temperature
2. Neil's way: you measure the difference between the two pins (reference number and temperature that's constant over the sensor - Vref - VT) and doing gain (20x)

Light
- Phototransistor:
  - It has orientation: collector + emittor
  - When there is light --> there is current --> and voltage
- Light/Proximity:
  - It has orientation

Magnetic field
- Hall Effect Sensor

Step response
- Fun: play with the touch pad / copper pad
- https://playground.arduino.cc/Main/CapacitiveSensor/
- = Neil's favorite sensor :)

Distance
- Ultrasonic

Hc-sr04 explained
- sends 8 signals
- receives more echo's than the pin
- put echo pin high, measure microseconds by waiting for pulse in to come high

Serial monitor communication
- Adjust the bit, character look like garbage.
- Take oscilloscope or look at duration of bits, look at the bit timing.

Push button
- signal coming across. rattling is that it doesn't make
- you have to do 'debouncing': recognize that there are quick transitions.
- wait for the delay

Pyroelectric: DIYmall RCWL microwave signal / radar. Measures incoming signal motion. = good sensor for proximity

Optical reflectivity
Project ideas for Input Devices
This week, we’re designing and making a new board with input devices. Three project ideas include: a CNC screw detector, an environmental sensor for measuring methane and a remake of the Hello World board with phototransistor and button.
Project idea 1: CNC screw detector
Material recognition device to prevent fire hazards at the Waag Fab Lab. What does it do? It distinguishes metal from wood, and alerts when a student doesn’t take out broken screws from the bed. Here is a blog by Keller Technology on sensors for object detection. What sensor to use?
Possibilities from lecture:
- Magnetic field sensor: hall effect: Neil: ordinary sensor, maybe centimeters distance.
- Optical temperature
- Thermocouple - recognize variety of metals
- Light sensor
- Inductive proximity sensors: Features by Keyence
- Step response
After presenting this idea with a lot of enthusiasm to Henk, he discouraged me to do this because there are also metal screws in the board to attach it to the machine bed. It would be very hard to keep them apart with the sensors available for us this week. So unfortunately I had to let this idea go. But I still think it’s possible to find a way to work around this, either in the type of sensor or by programming the software to ignore selected regions. This is my first experience with input devices, so for the sake of time management let’s keep this in mind for when I have more experience.
Project idea 2: environmental sensors
For my work in sustainability I’m interested in environmental sensors for measuring CO2, methane - the second largest greenhouse gas (GHG) -, PM2.5, and Volatile Organic Components (VOC). During lecture, Neil shows the vendors of two categories of sensor types:
- Particle dust sensors on DigiKey
- Gas sensors on Polulu Robotics & Electronics
The CO2 sensors are very expensive, and not available in the lab. There is a methane sensor however. This is interesting because I’m working for a waste treatment company that produces biogas from municipal organic waste, and a company that provides Bio-CNG refueling infrastructure for road transport. Last year, I helped to set up an agreement between the two and they now provide 100% locally produced Bio-CNG at all gas stations in Friesland. So my car is fueled by my own waste! This is a unique innovation in the circular economy.
To further investigate and reduce emissions in the supply chain of these and other sectors, such as construction (central heating system) and agriculture, I’m interested in creating a methane sensor.
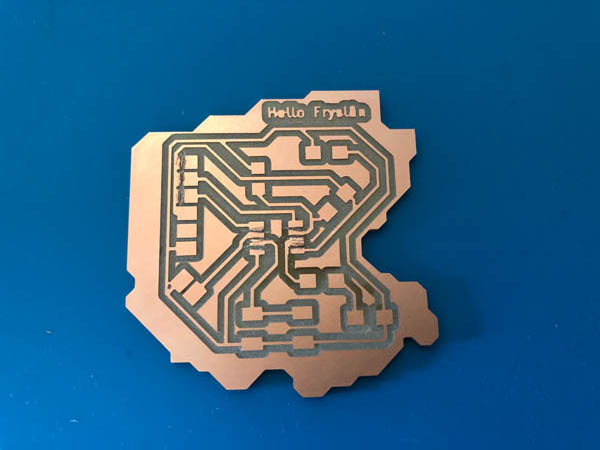
Project idea 3: remake Hello Fryslân board
The third idea is to remake the Hello Fryslân board from week 6 Electronics Design. During Embedded Programming in week 8 I found out that the board is not working. We added a phototransistor and a button: both input devices. So if the methane sensor fails, this new board can be a back-up.
Hello Fryslân board
With the newly obtained knowledge about debugging with a multimeter I found out that my board from week 6 is not working properly. Therefore, I decided to redo the Hello Fryslân board with a regular milling method instead of UV printing. There are two input devices on this board: a phototransistor and a button.
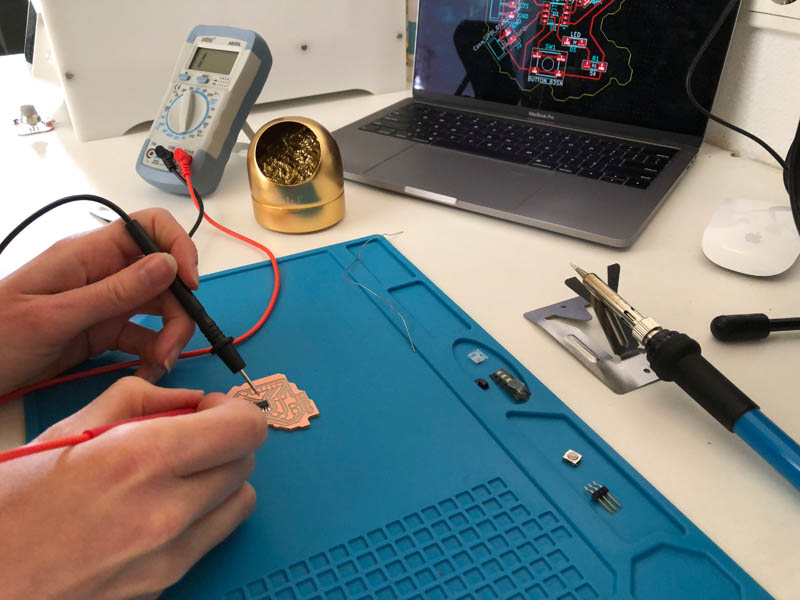
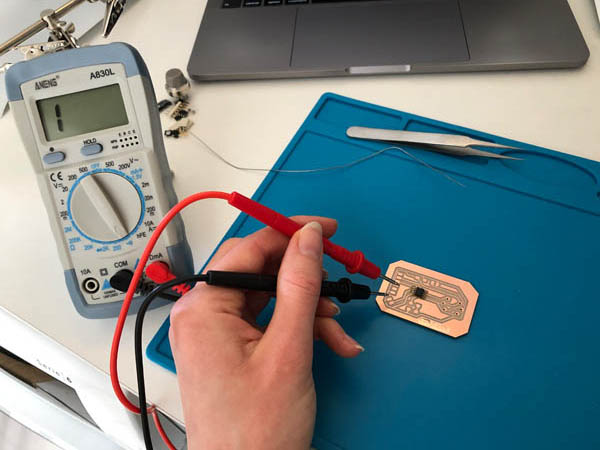
Board debugging
During the group assignment, Lucia taught me to work with a multimeter to debug a PCB. This was super useful! Set the multimeter to resistance with sound. There are two steps:
- Test if the pins make a connection where they should. If so, the multimeter beeps. This is a confirmation that the connection is made.
- Test where the pins make a connection where they shouldn’t. This is short circuit. Again, test all pins and if they beep you’re in trouble.
Next, we tested the UPDI and FTDI to rule out that they cause the problems. Both work. This also works with an alternative power source.
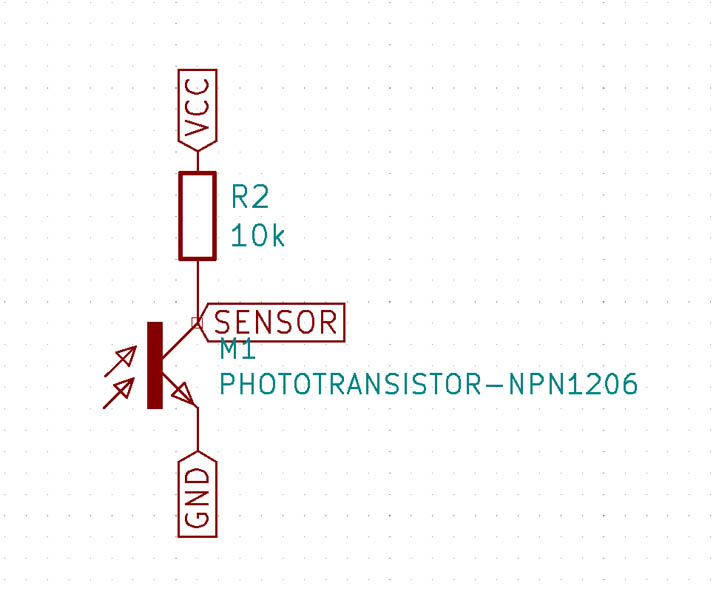
Then Lucia noticed that the phototransistor is not wired properly. There should be a connection to the ATtiny, in addition to VCC and GND.
Lucia also recommended to always check if you have selected the correct programmer in the Arduino IDE: Serial Port and 4.7k (pyupdi style). After setting up the software exactly as her working board, mine still caused errors.
Then we continued to test the pins with the logic analyzer.
Unfortunately my logic analyzer timed out all the time. No signals here.
There could be one option: a broken ATtiny412. I decided to remake the Hello Fryslân board and make this with a regular milling process instead of UV printing.
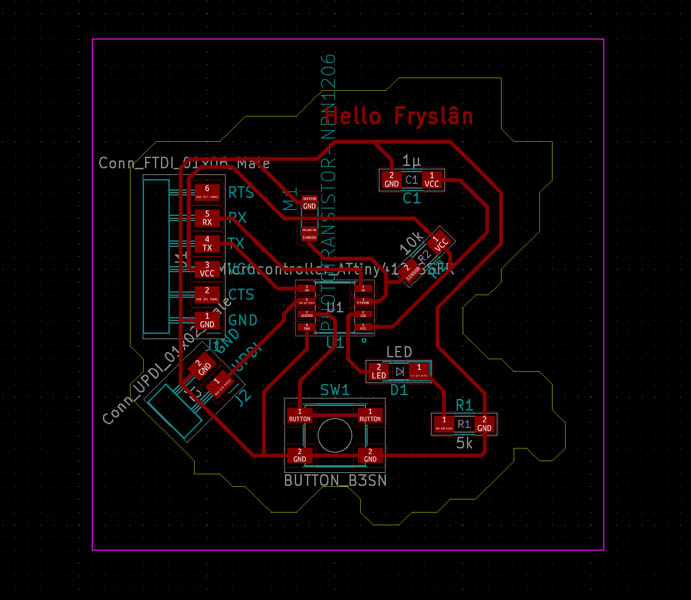
Redraw the board in KiCAD
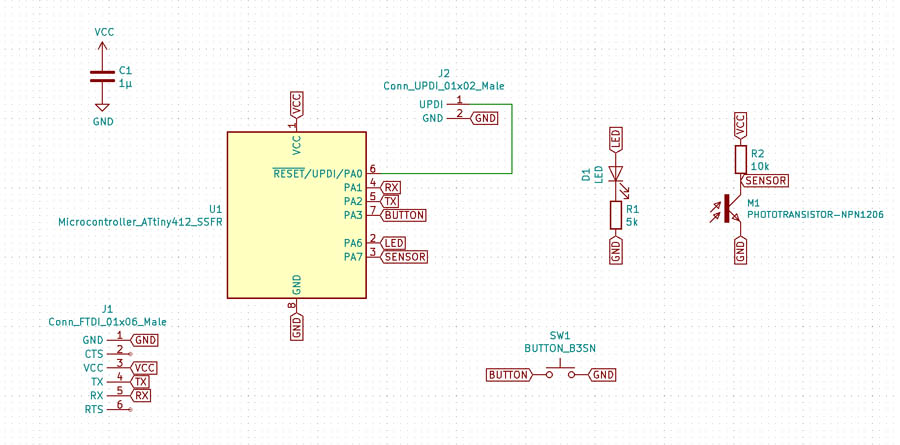
As a starting point, I took the first KiCad drawing from the electronics design week and deleted all ground plane. Before and after.
I also decided to replace the vertical UPDI pin with a horizontal one in the new design, because a vertical one is too fragile.
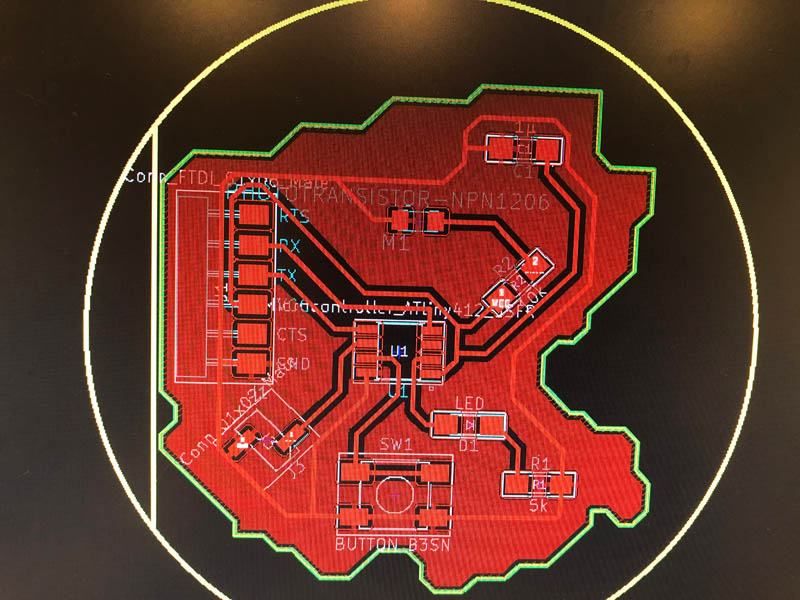
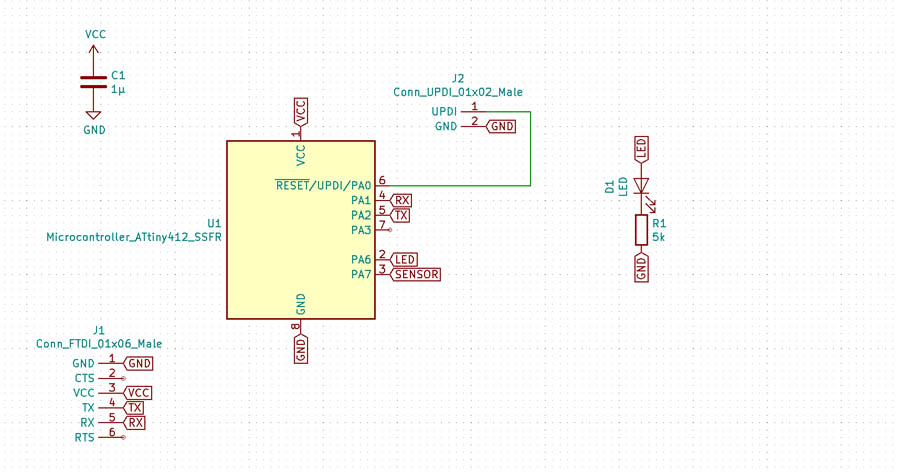
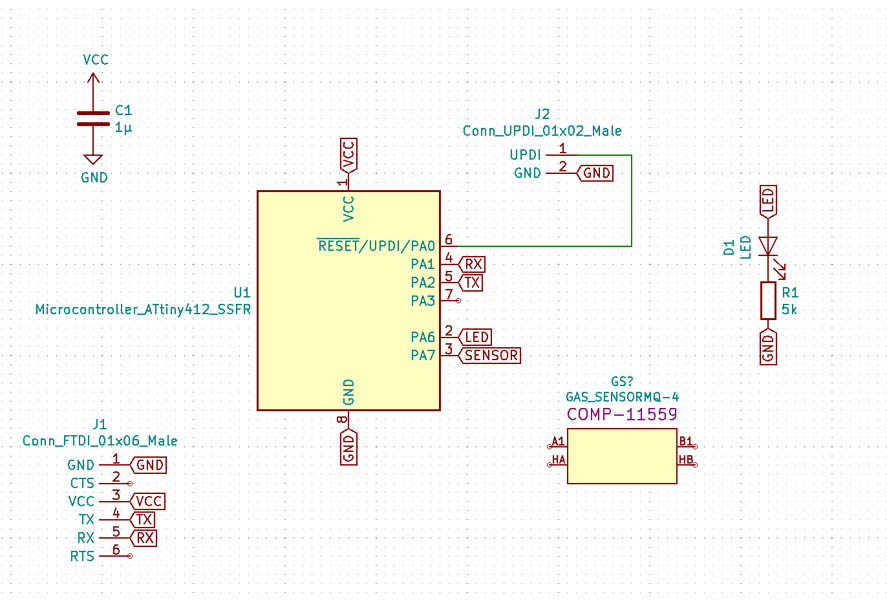
Then I fixed the problem with the sensor pin. This didn’t make a good connection on my board. It turned out to be a glitch in Eeschema. If you place the label a bit higher, it shows up in the PCB Editor. Left image is before, right is after.
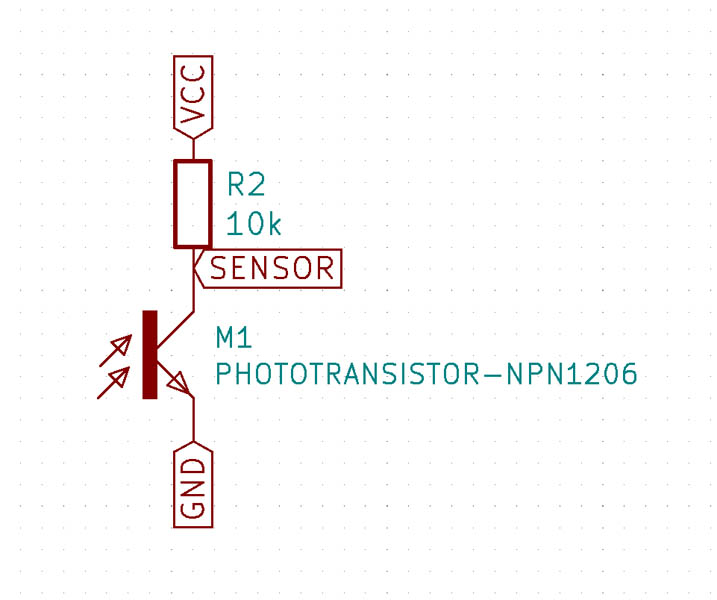
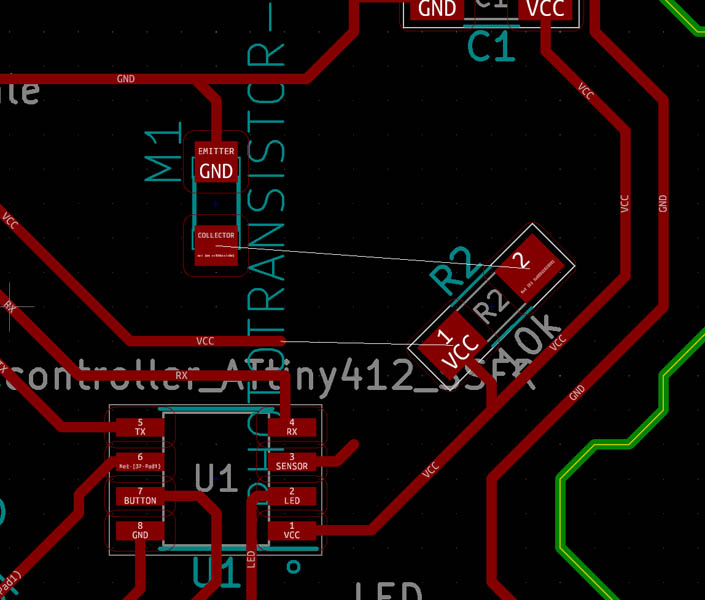
As you can see in the image below, the phototransistor doesn’t connect to pin 3 of the ATtiny.
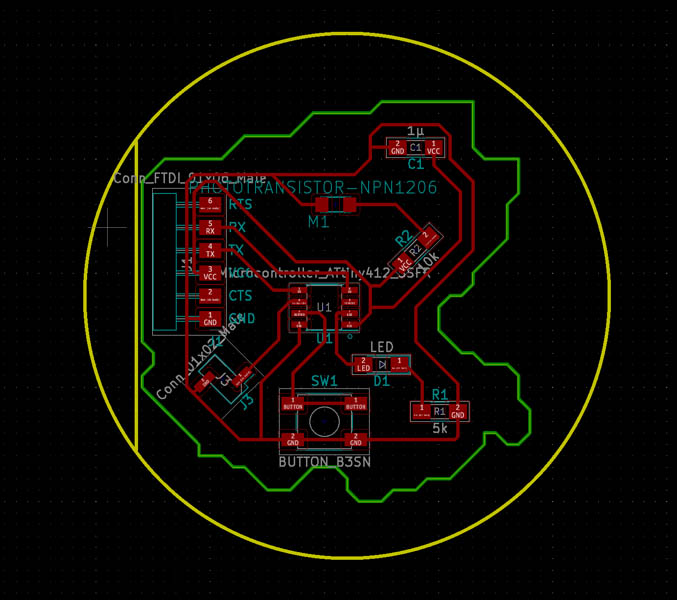
Update the PCB from Schematic.
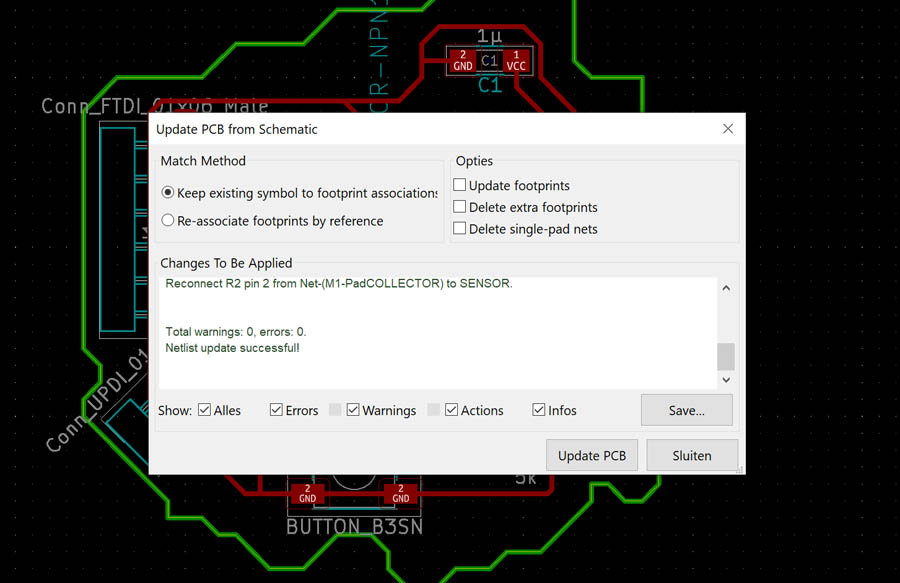
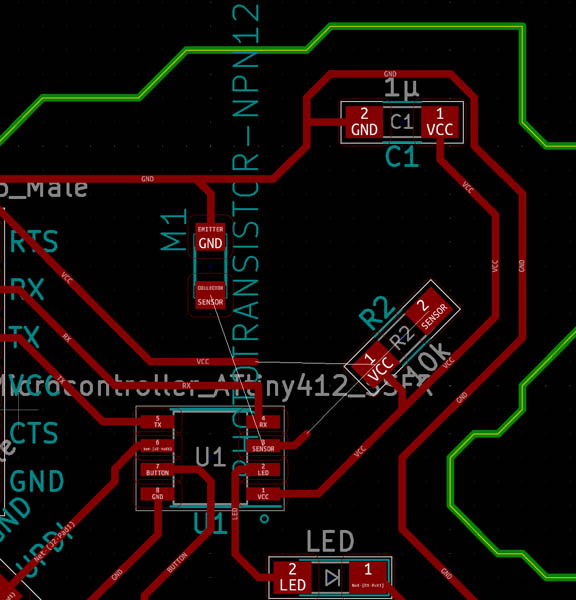
Now it makes a proper connection with the resistor and the pin.
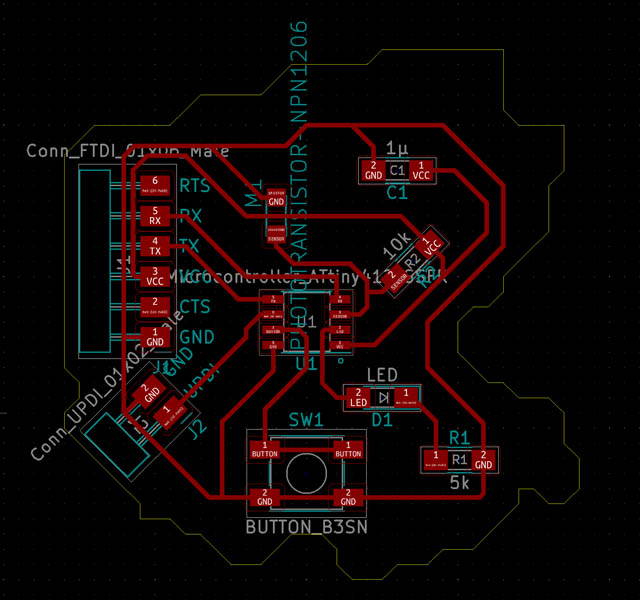
Then I changed the outer line from B.Cu to Edge.Cuts layer. You can move all of them to edge.Cuts by using Edit -> Move and swap layer.
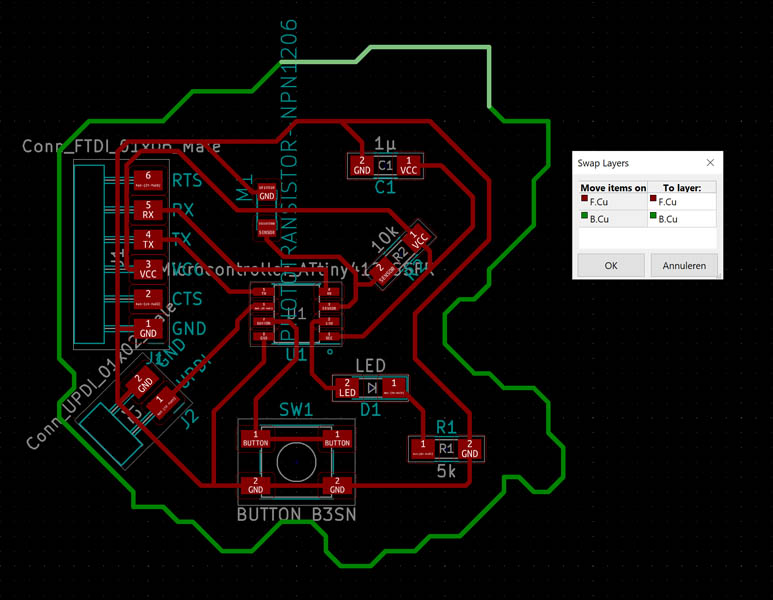
This is after changing layers.
Adding text can be done with the T icon.
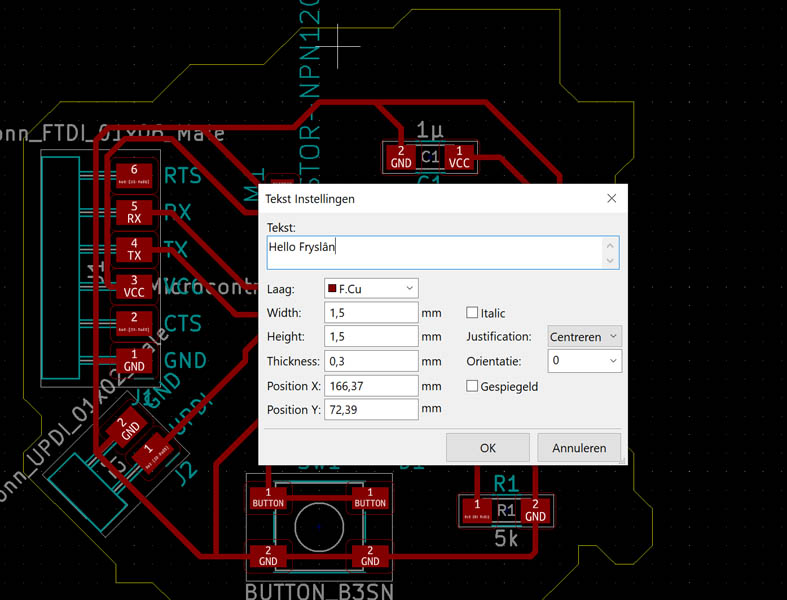
I added ‘Hello Fryslân’ to the board.
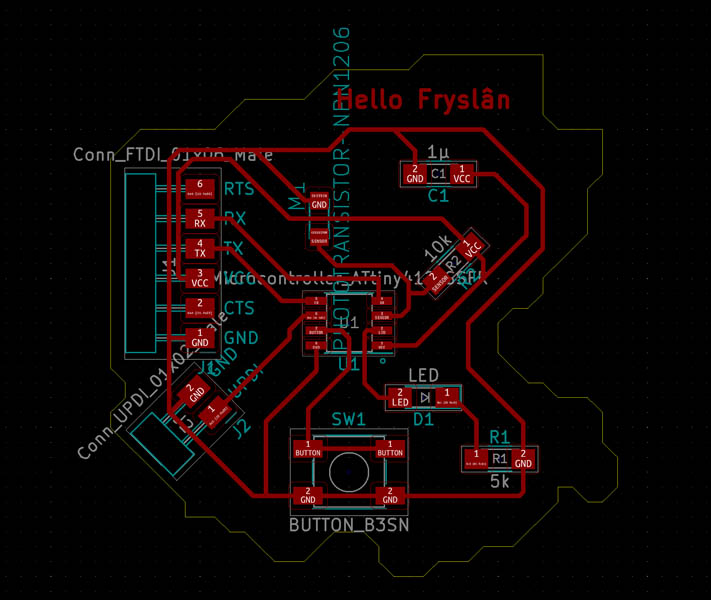
Finally, adding a margin helps mods with recognizing the position on the file better.
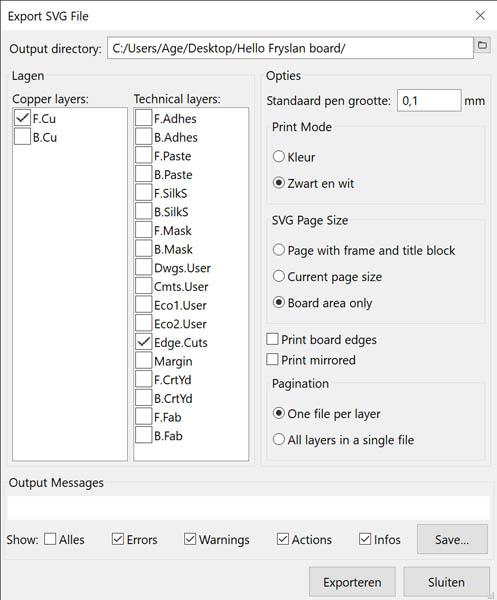
The file is now ready for exporting:
- Export as SVG
- Select
F.Cuin Copper Layers andEdge.Cutsin Technical Layers - Black and white
- Board area only
- Deselect ‘Print board edges’
- Select one file per layer
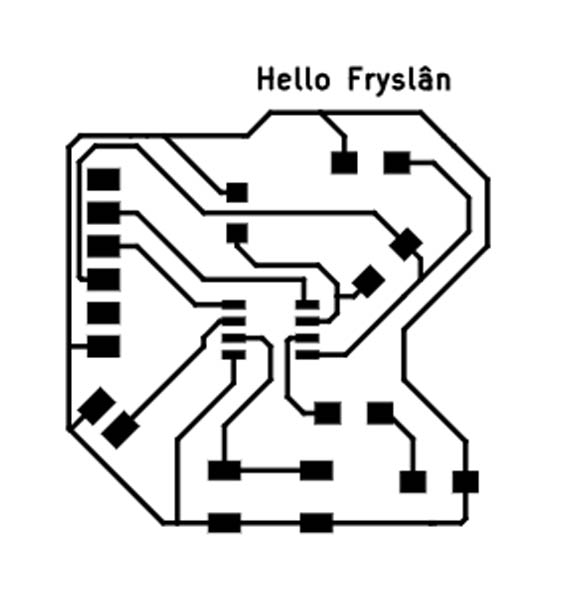
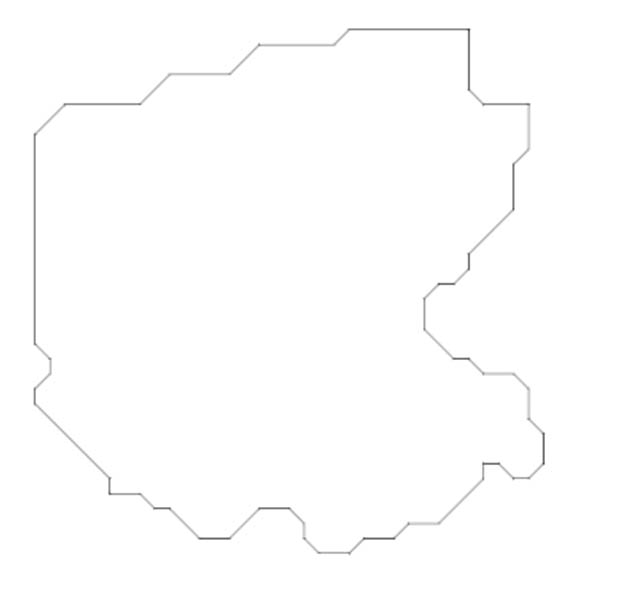
Resulting .svg files for milling:
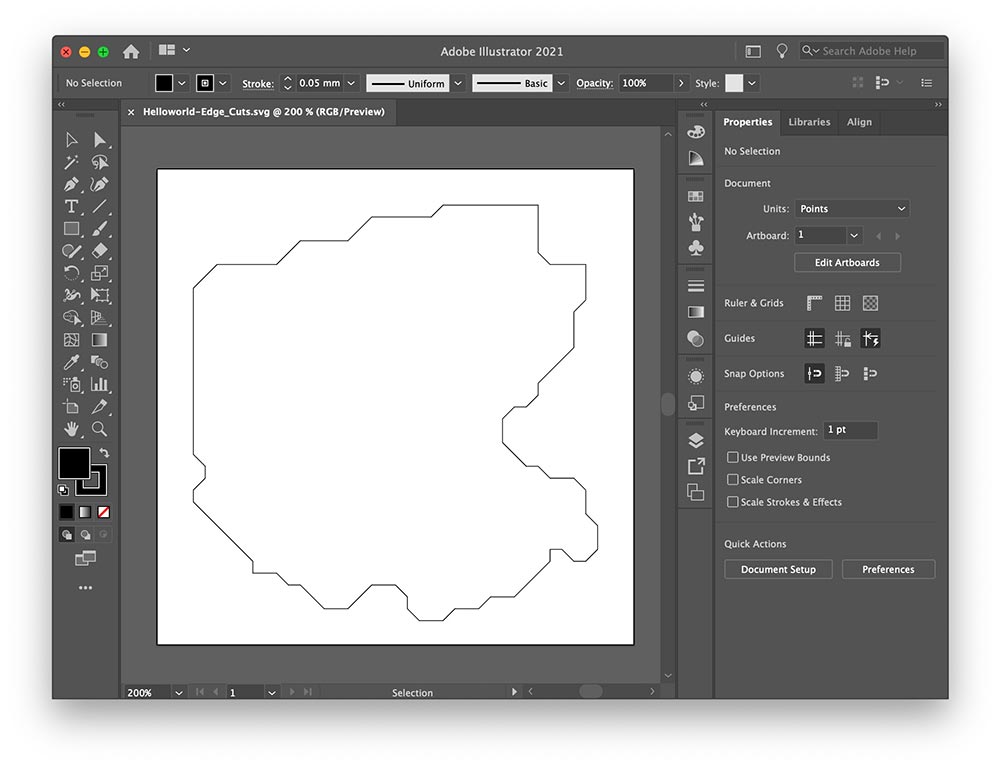
File preparation in Illustrator
Before I started with milling, I tested my .svg file in mods. Unfortunately it didn’t show the lines correctly. I opened the .svg in Illustrator to save it as .png file with 1000 dpi. This file format should be recognized better by mods.
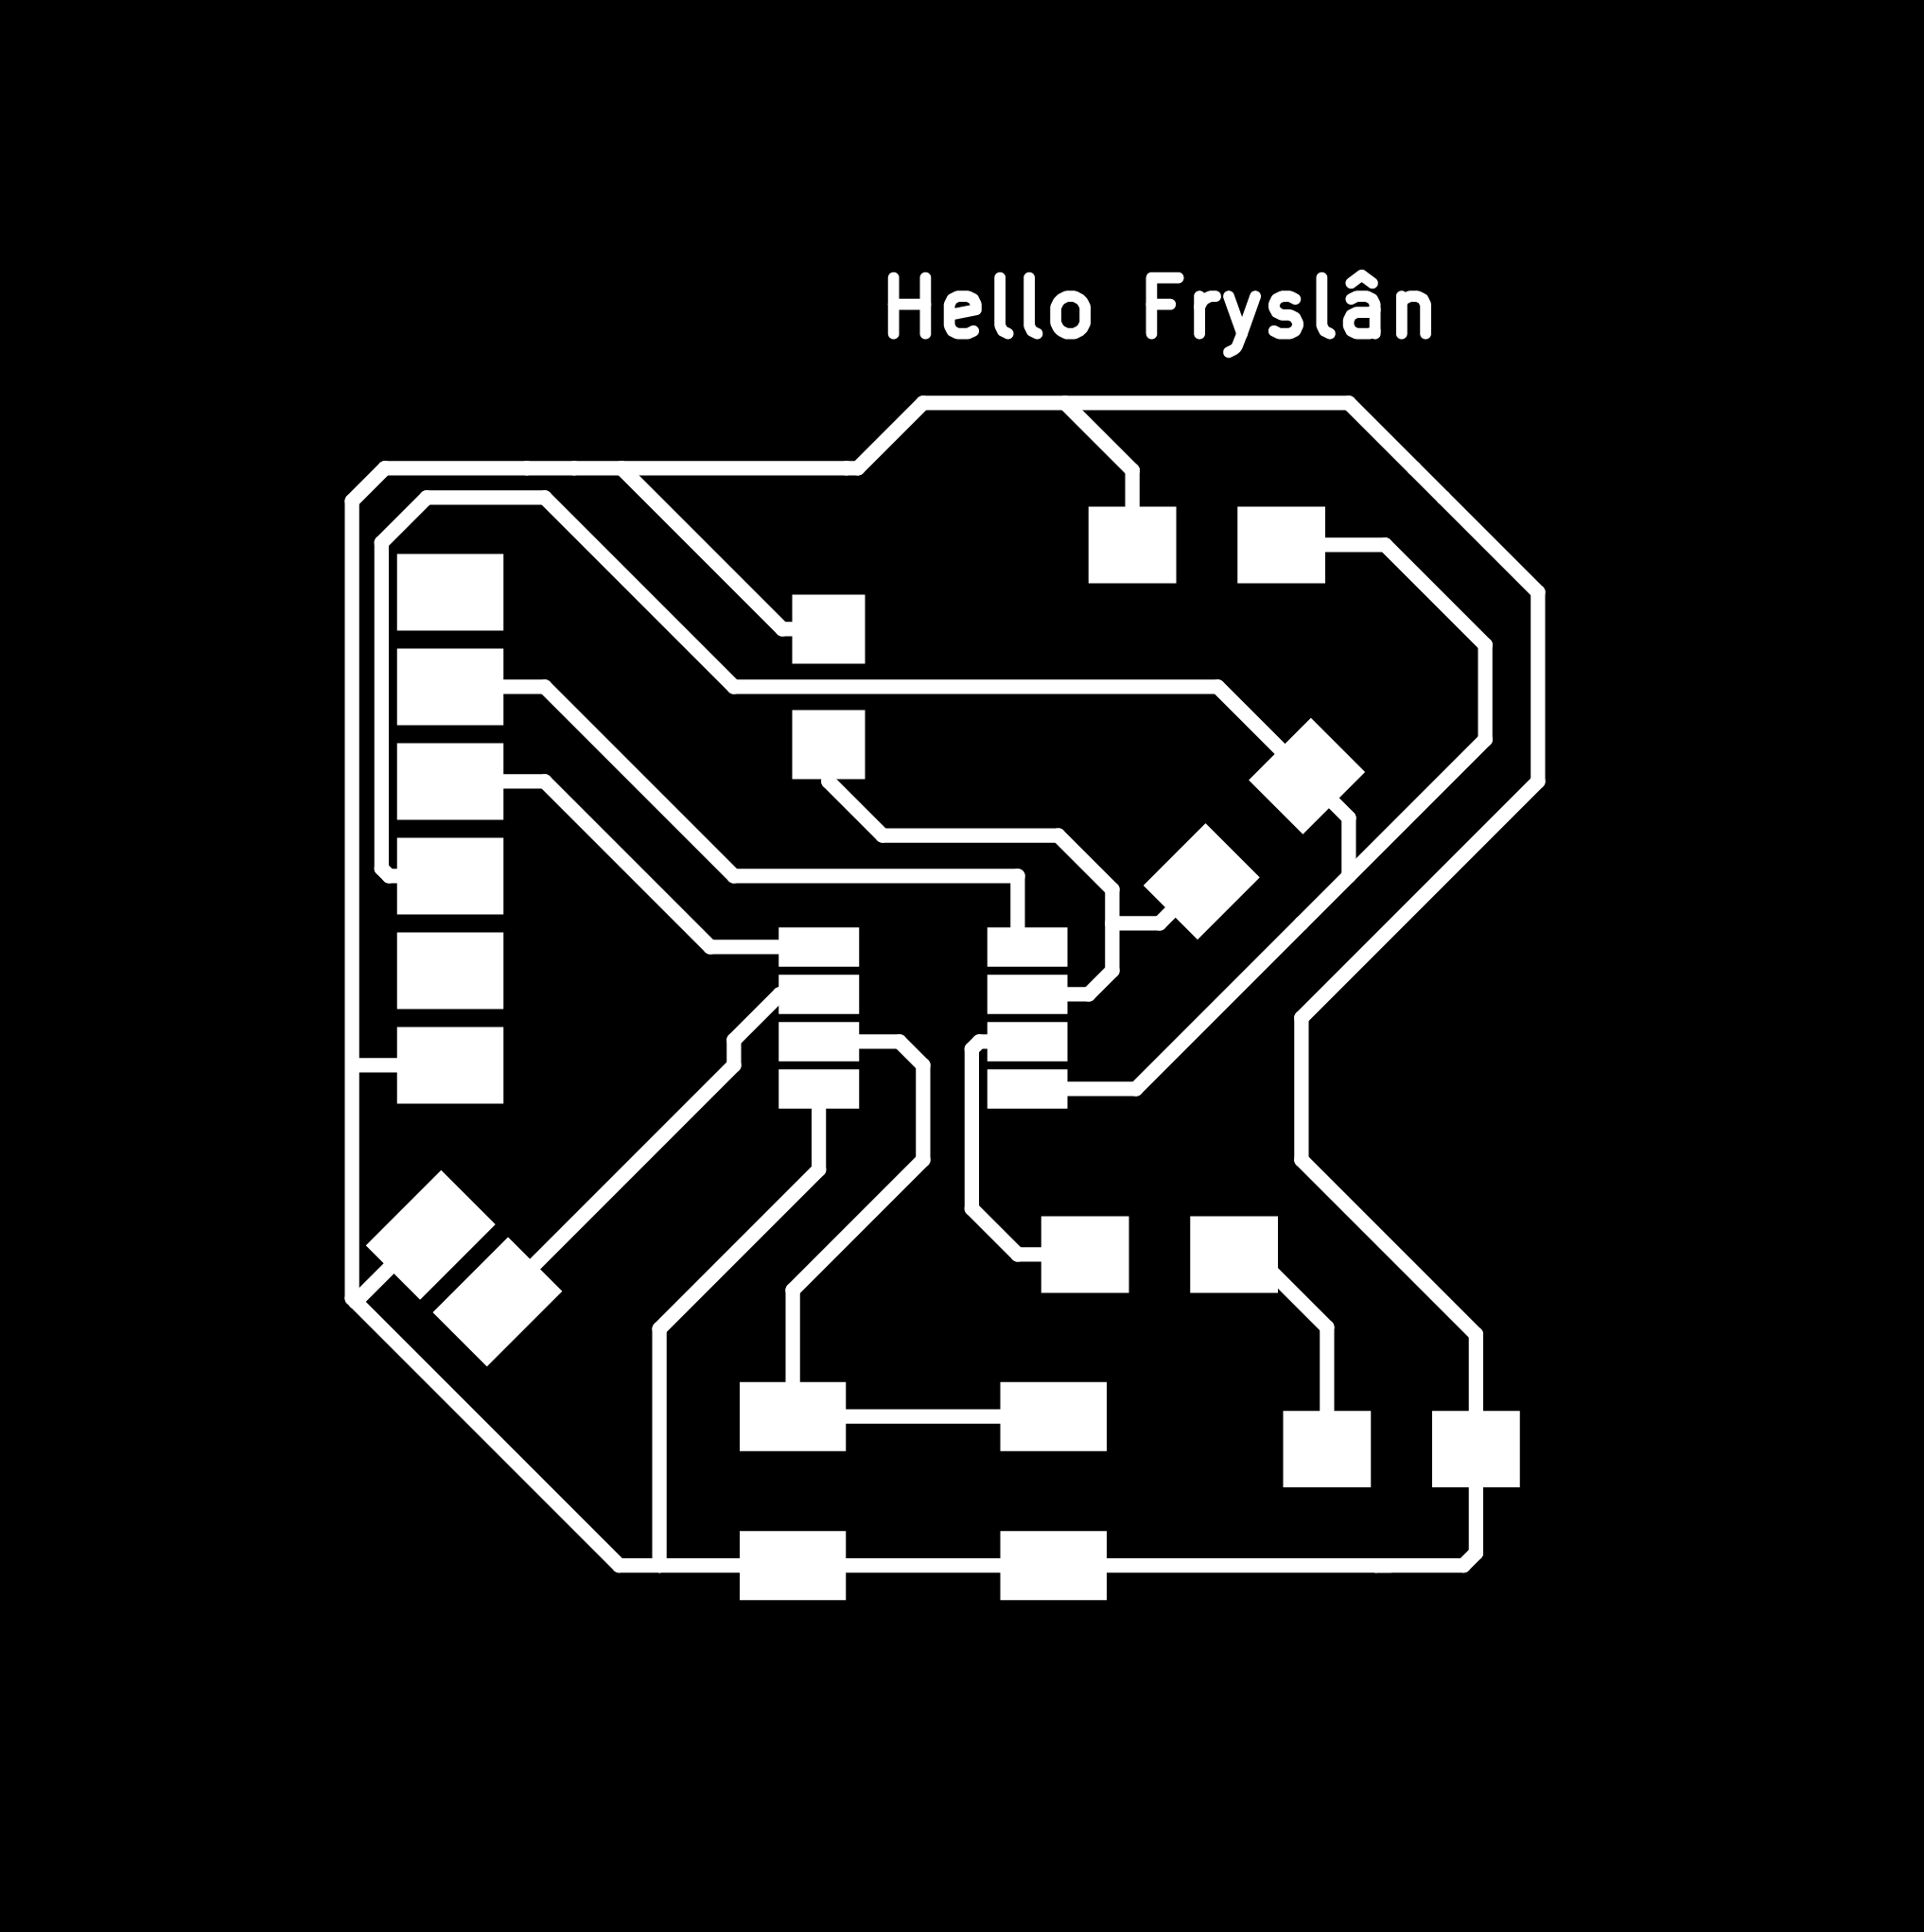
First, I ungrouped the files, and joined the lines with merge. Then I created a new layer and make this black. The black parts will be milled, white parts remain copper.
Here are the traces:
And the cuts:

Export as png with minimum of 500 dpi > preferably 1000 ppi.
Milling
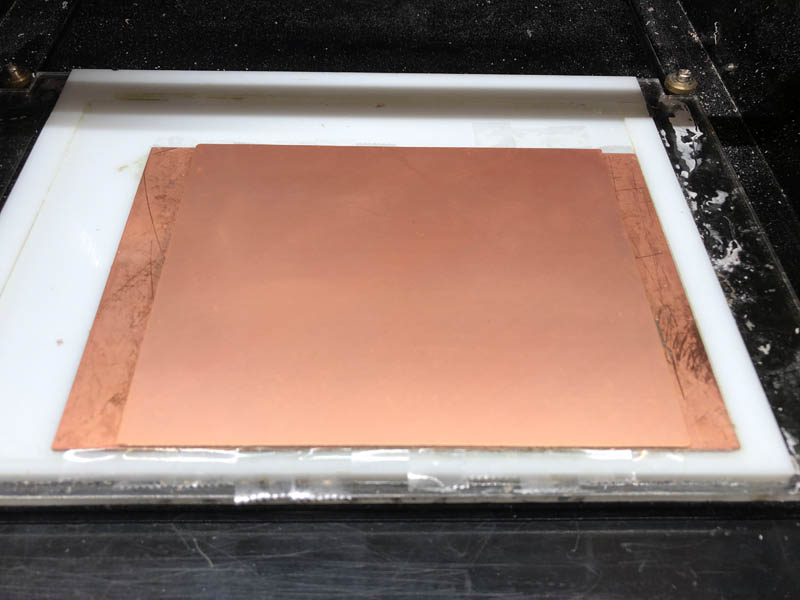
First, I needed to remove the remainders of a copper plate and add a new one.
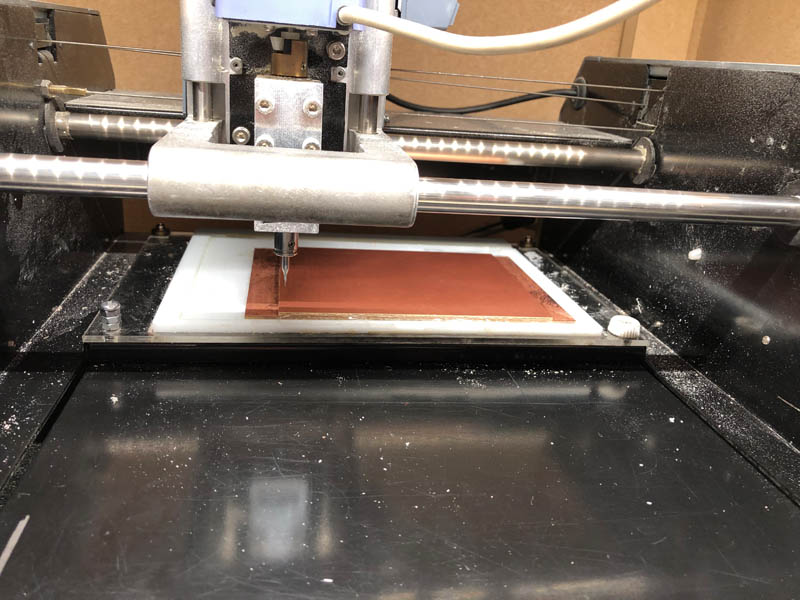
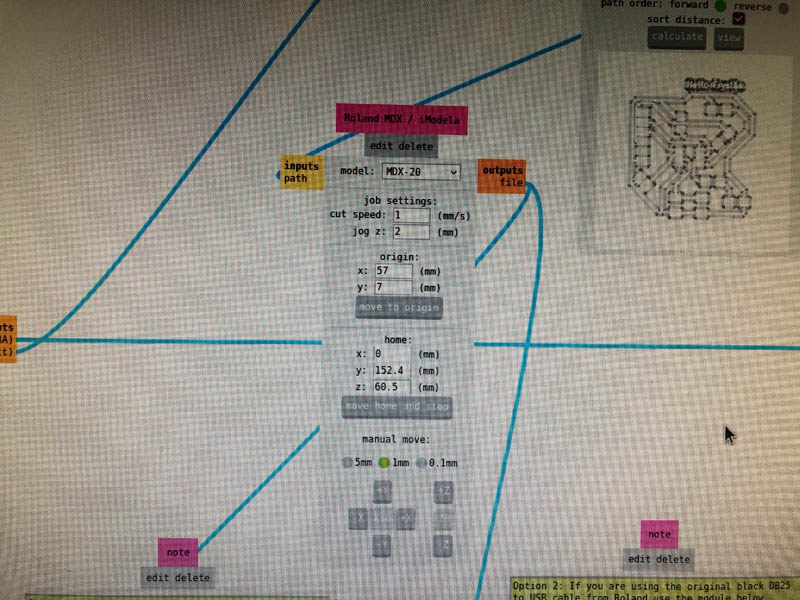
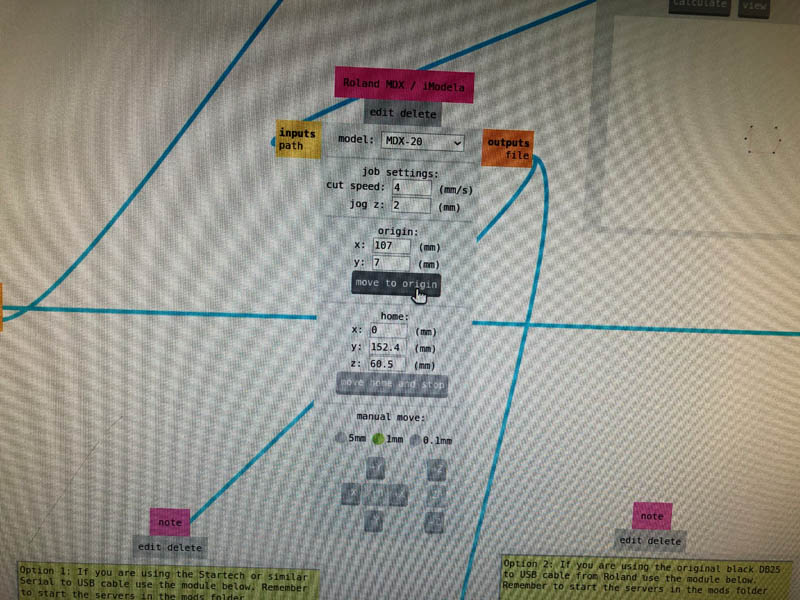
Setting the origin and leveling the Z-axis. In mods: the origin is in left corner below! So your design will mill to the right.
Take a picture of the origin.
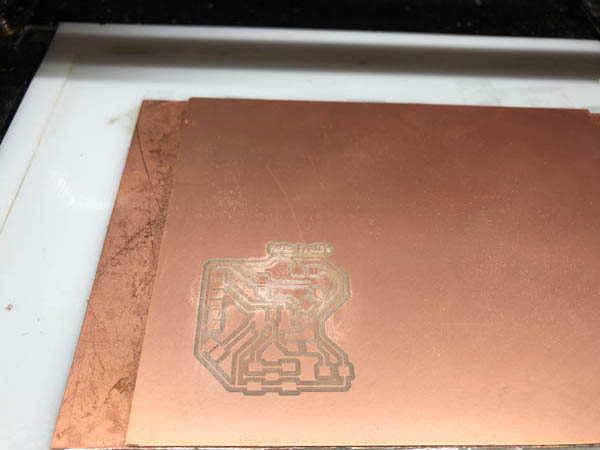
After milling the the traces.
After milling the outline.
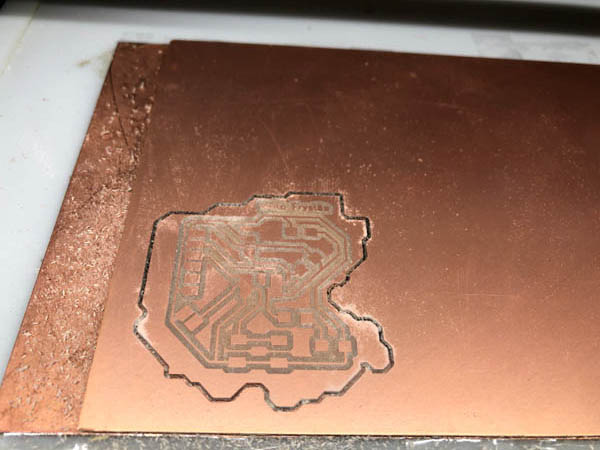
Resulting PCB. I cleaned it afterwards with soap and water. Then I found an issue: some traces were not milled.
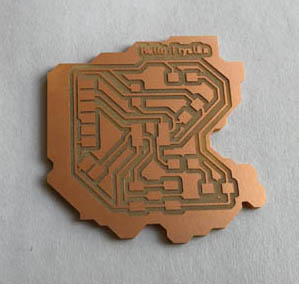
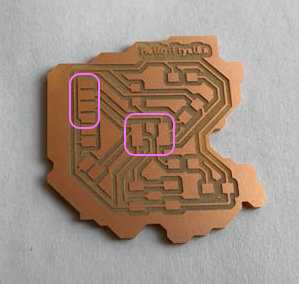
I took a knife and carefully cut them out.
Soldering
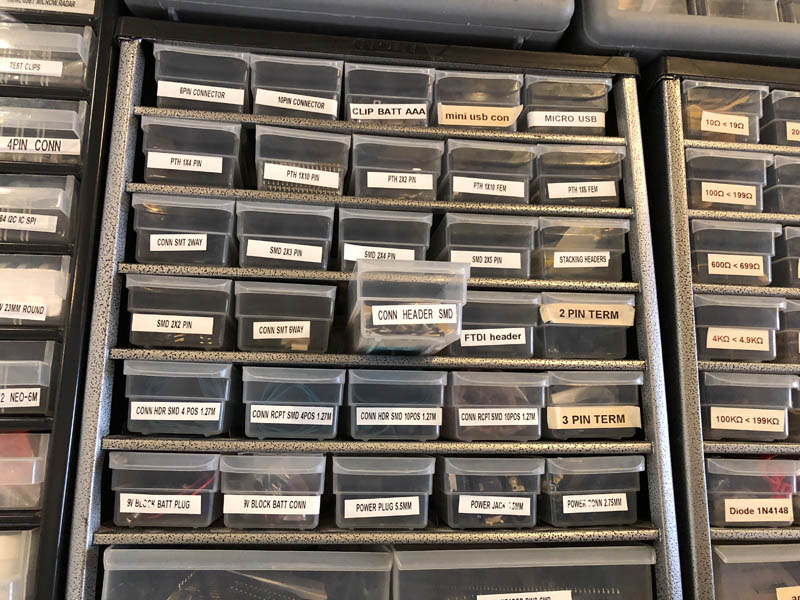
Collecting components at Waag. I couldn’t find the UPDI, it’s this box.
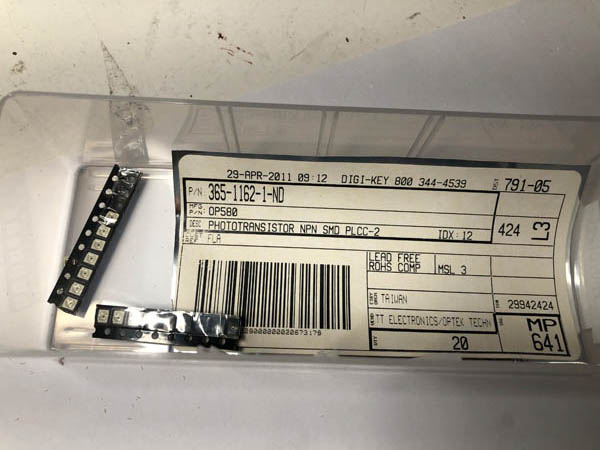
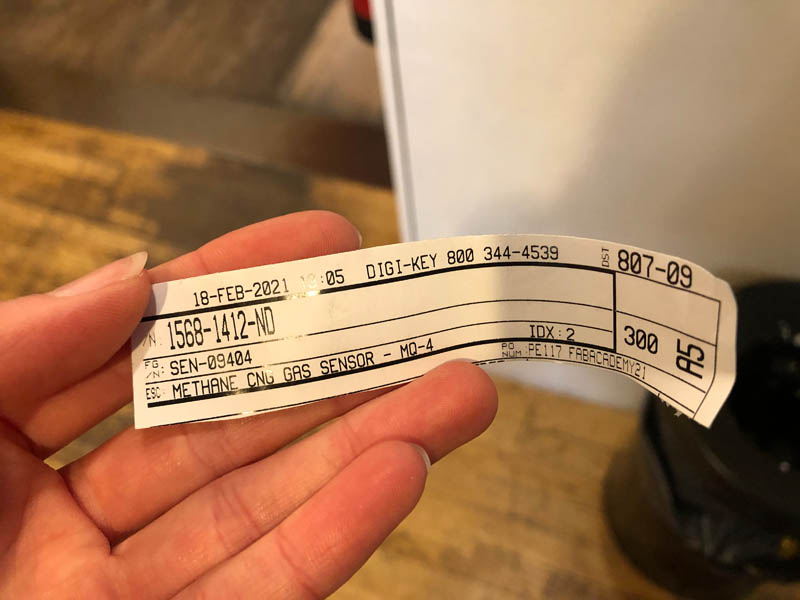
And this is the product code of the phototransistor.
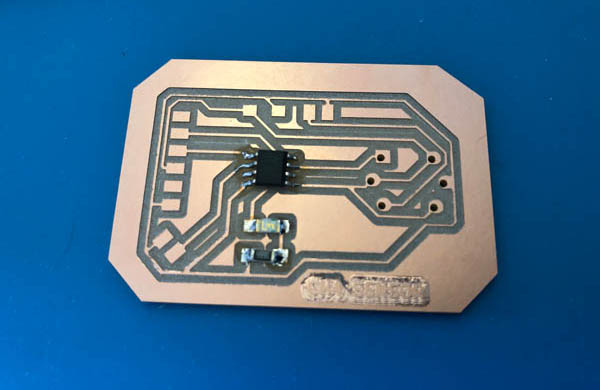
My board ready for soldering.
Before and after soldering the ATtiny412 I worked with the multimeter to check if the pins didn’t make a connection with each other.
The board after soldering. Again, I checked the pins and traces with a multimeter and they should work.
Programming
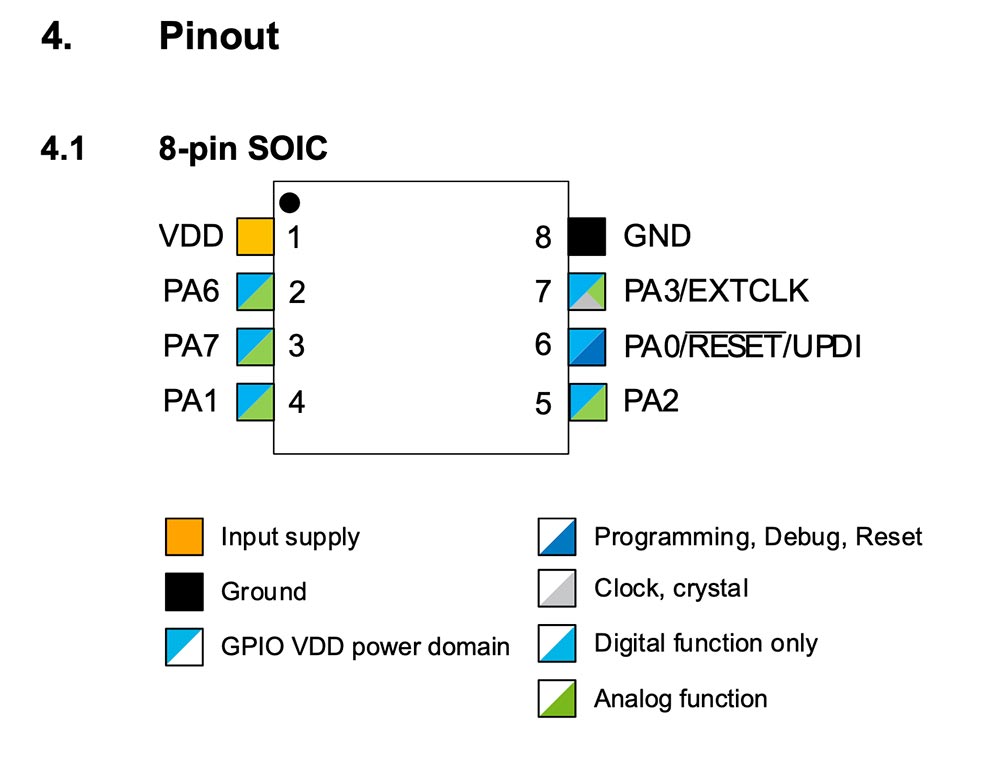
Before programming the ATtiny412 with a simple Blink-the-LED program, I consulted page 13 of the datasheet. This shows that the physical pin 2 is named PA6.
Then I uploaded the code from Neil’s Blink example:
#define LED A6

void setup() {
   pinMode(LED,OUTPUT);
   }

void loop() {
   digitalWrite(LED,HIGH);
   delay(100);
   digitalWrite(LED,LOW);
   delay(100);
   }

// hello.t412.blink.3.ino
// tiny412 blink hello-world, 3-pin UPDI+VCC header
// Neil Gershenfeld 1/10/21
//
// This work may be reproduced, modified, distributed,
// performed, and displayed for any purpose, but must
// acknowledge this project. Copyright is retained and
// must be preserved. The work is provided as is; no
// warranty is provided, and users accept all liability.
//
It loaded successfully.
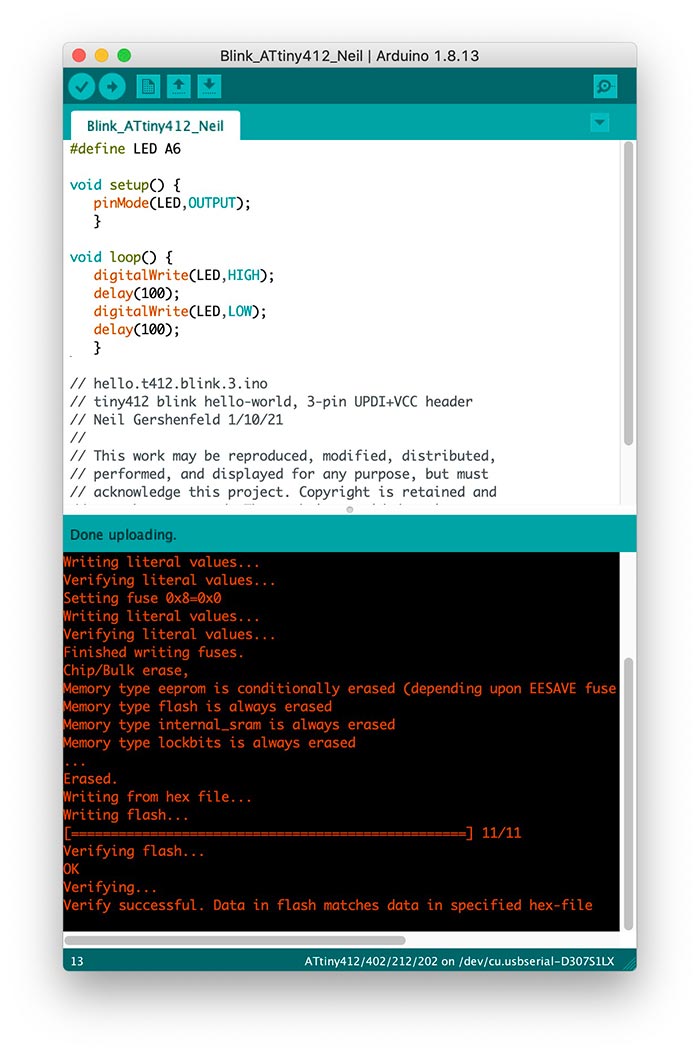
And my board responds!
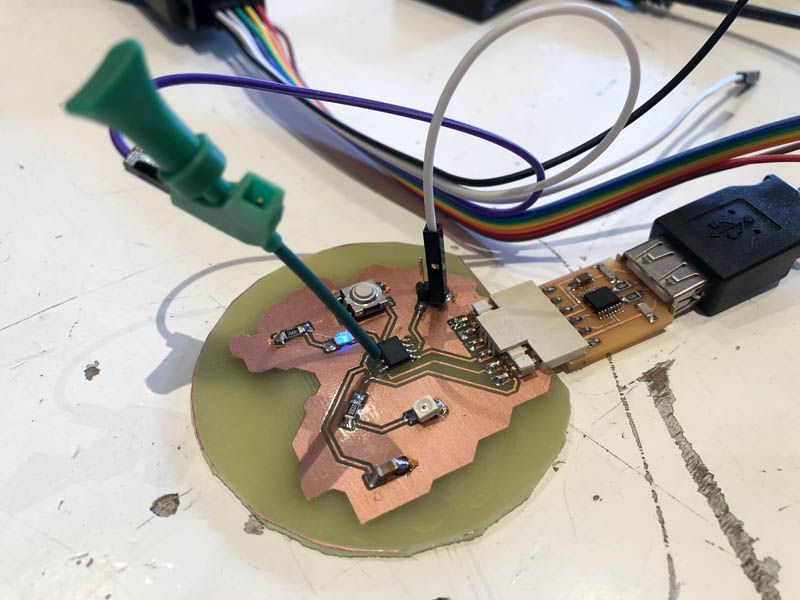
Next, test the button. This is an input device. I adapted the code from Lucia’s documentation on embedded programming.
int button = A3
int LED = A6

void setup() {
   pinMode(LED, OUTPUT);
   pinMode(button, INPUT_PULLUP);
   }

void loop() {
  if (digitalRead(button) == LOW){
     digitalWrite(LED, HIGH);
   }

  else { digitalWrite(LED, LOW);
  }
}
Succesfully sending it to the device.
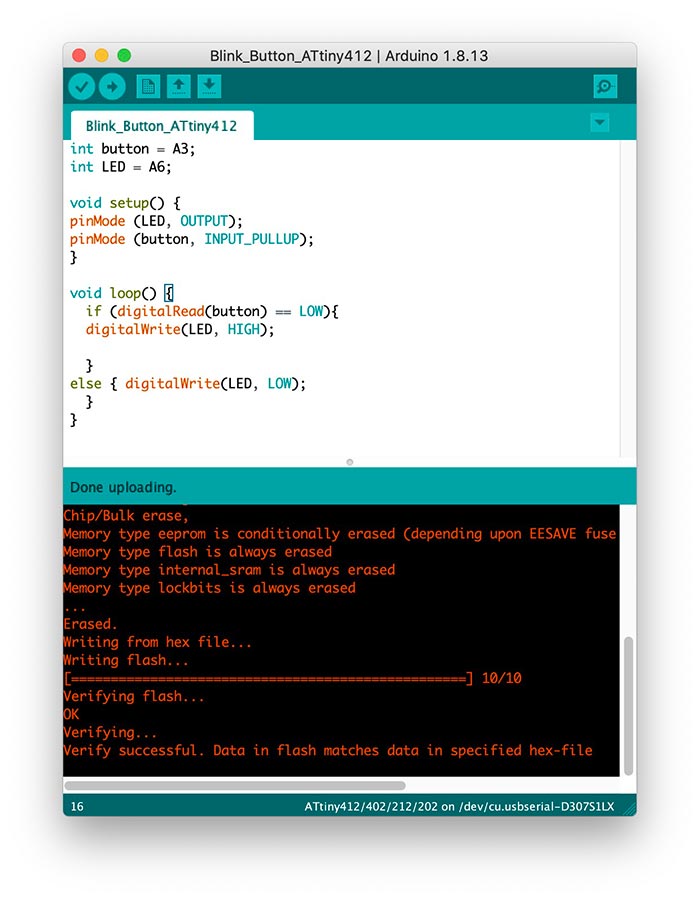
And it works!
On to the last component on this board: the phototransistor. This was programmed with Nadieh’s code during Embedded Programming week.
#define led_pin 0 // ATtiny PA6
#define photo_pin 1 //ATtiny PA7

int sensor_value = 0;

void setup() {
  // Initialize digital pin led_pin as an output
  pinMode(led_pin, OUTPUT);
  // Initialize the phototransistor pin as an input
  pinMode(photo_pin, INPUT);
}//void setup

void loop() {
  // Read the analog value coming in from the phototransistor
  // The input is 10-bit (2^10) which gives 1024 values -> between 0 - 1023
  sensor_value = analogRead(photo_pin);

  //If the sensor value is greater than 500, have the LED on
  if(sensor_value > 500) {
    digitalWrite(led_pin, HIGH);
  } else {
    digitalWrite(led_pin, LOW);
  }//else
}//void loop
After loading the code I found out that the phototransistor was not working. Guess what, it was soldered in the wrong direction! It has a collector and emitter side. The mark is on the collector side. So the emitter should be connected to ground. I desoldered it and placed it in the right direction. Unfortunately, the sensor still didn’t respond to changes in light intensity. So I went back to the soldering area at Waag and checked the components. Then I noticed that there was another sensor, named Visible 940nm. That should be it! It also has a collector mark, this is green and should be directed to the ATtiny side. With the new sensor soldered on the board, I loaded the program.
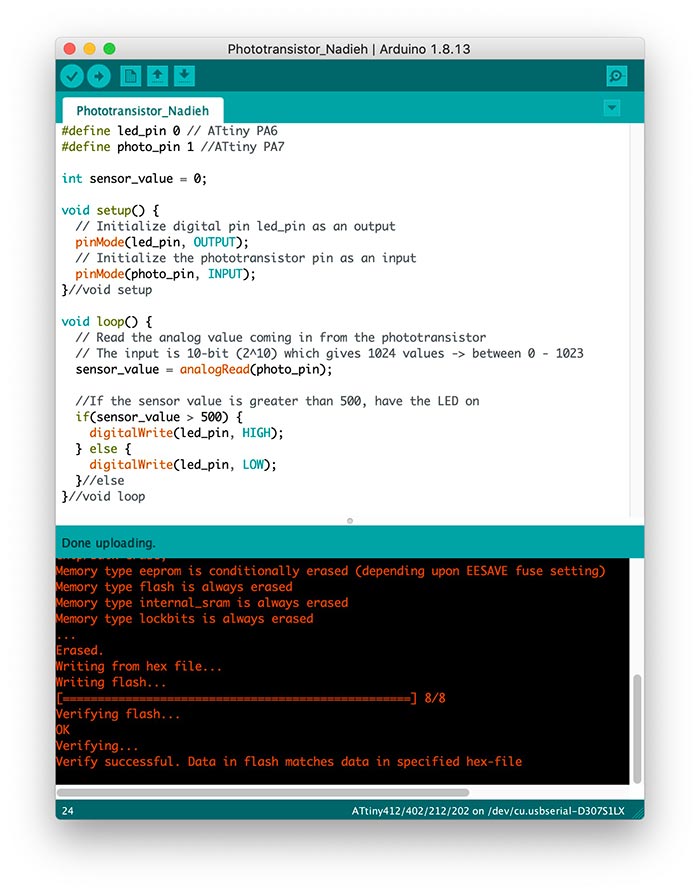
And it works!
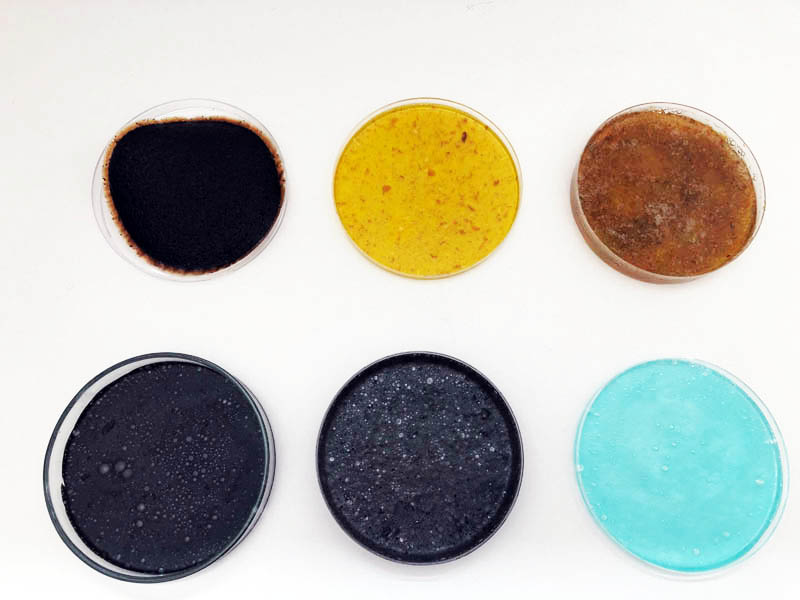
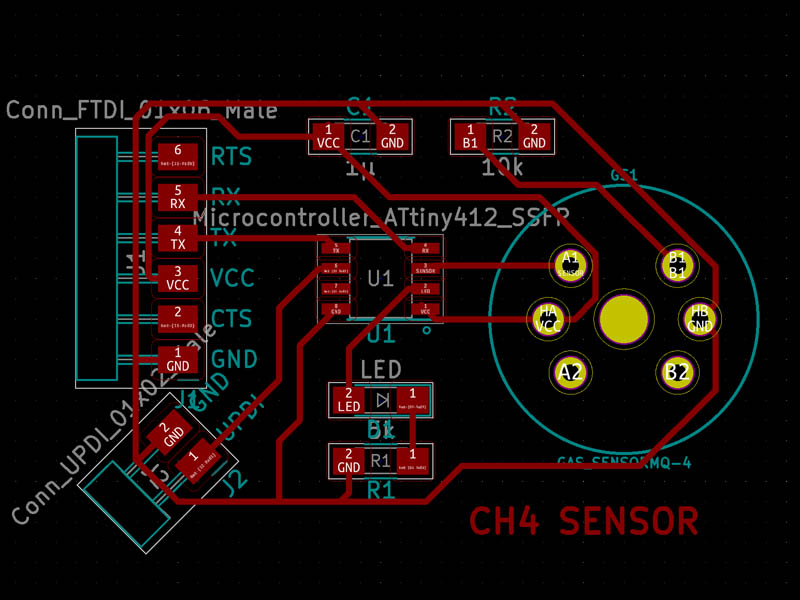
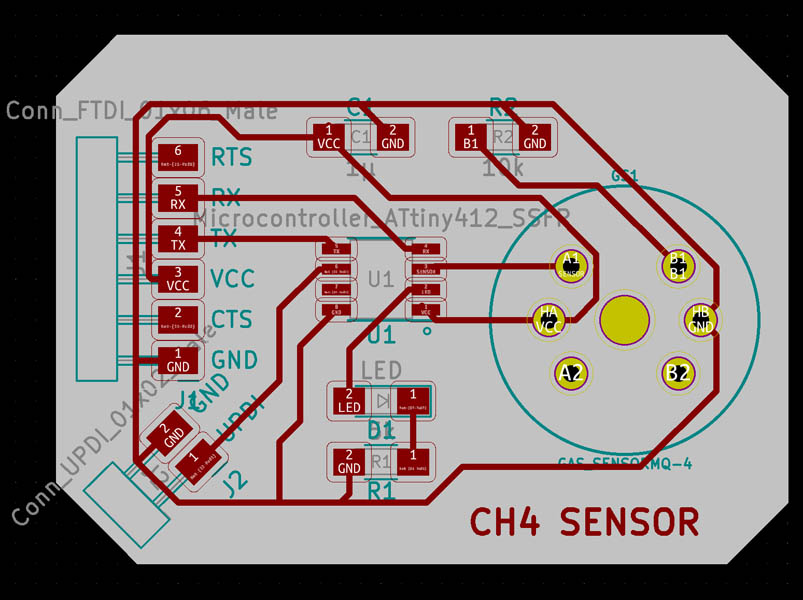
Methane sensor
The second PCB board I’m making is for a methane sensor. Here is the section with most sensors:
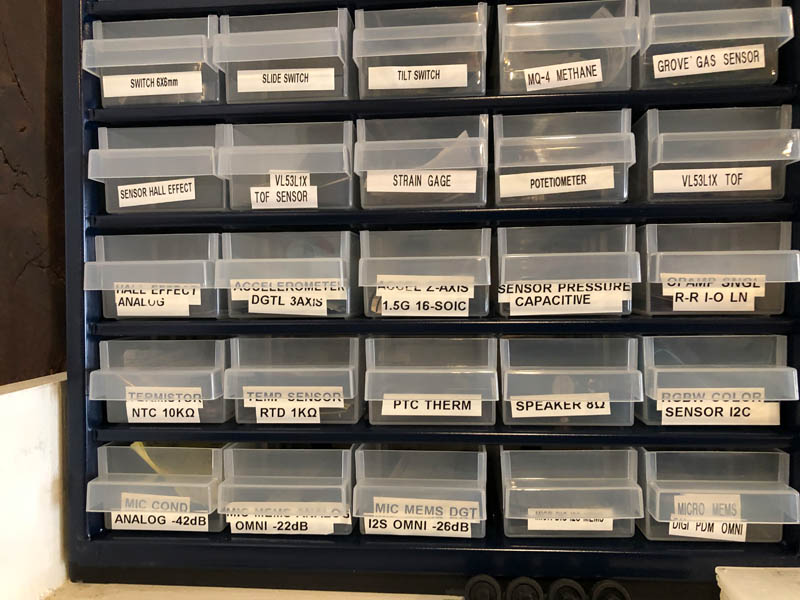
There are two environmental sensors at Waag: methane and grove gas.
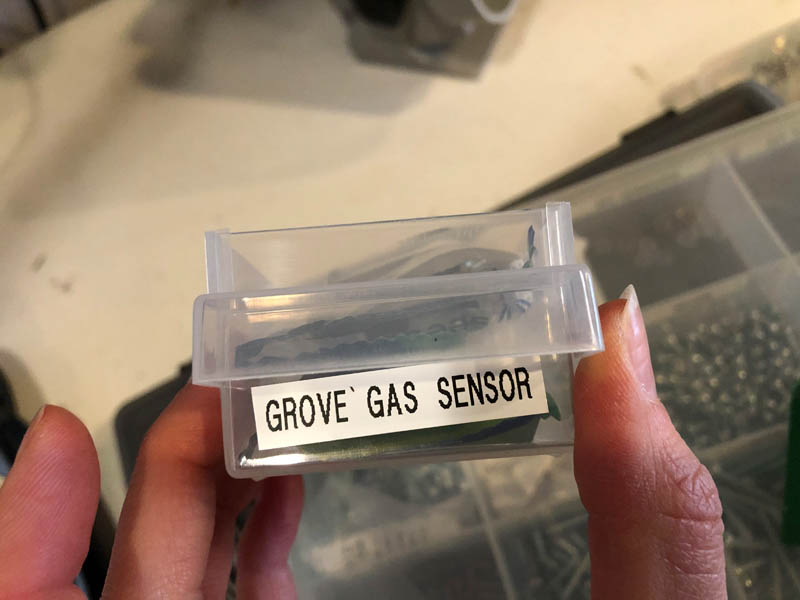
I don’t know what grove gas is, so let’s find out first. The Seeed Studio’s Grove Gas MQ9 sensor is available. Its datasheet can be found here. The types of gas it measures is carbon mono-oxide, coal gas and liquefied gas. The MQ-5 is for LPG, CNG and town gas. This is the one I want!
Background research
Before starting, I looked up the Fab Archive to see if other students implemented this sensor before. There are three projects:
- Siddharth Arya’s final project proposal for a wet compostable waste collection bin with sensors in 2017. His actual final project didn’t contain the methane sensor.
- Mennatallah Moustapha from Fab Lab Egypt in 2020.
- Sara Falcone’s final project idea for How to Grow (Almost) Anything in 2019
- Tin Valetic’s final project idea at Fab Lab Bottrop in 2019
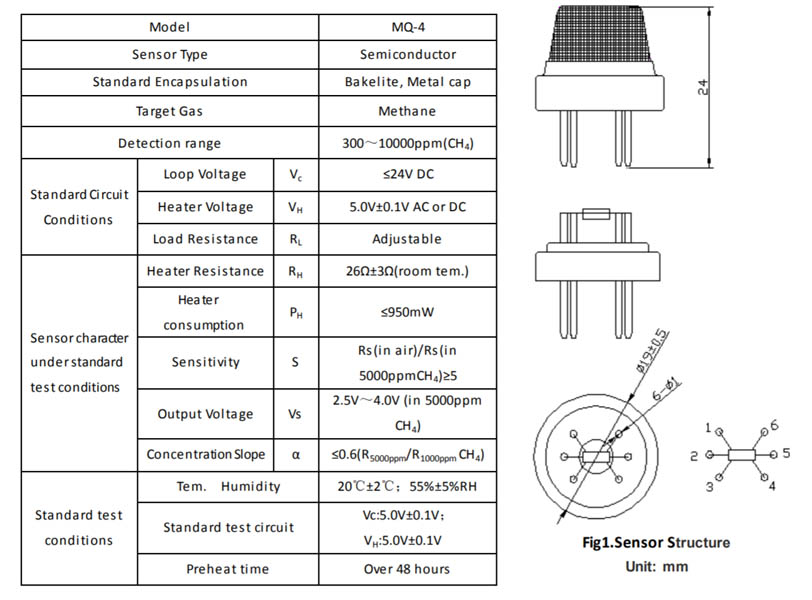
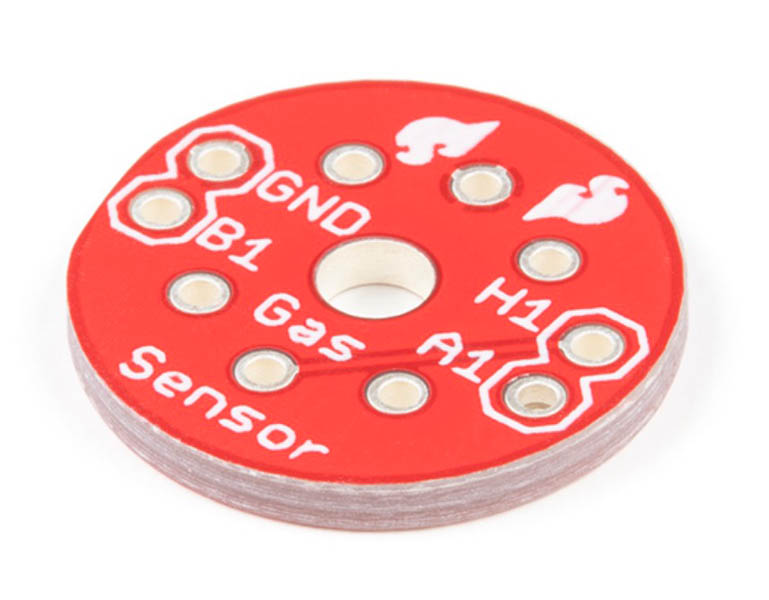
DigiKey Methane CNG Gas Sensor shows that the manufacturer is SparkFun. This is their product page and user manual. SparkFun mentions that this sensor requires another product in order to function properly: the SparkFun Gas Sensor Breakout. Specs: Its detection range is 300~10000ppm(CH4).
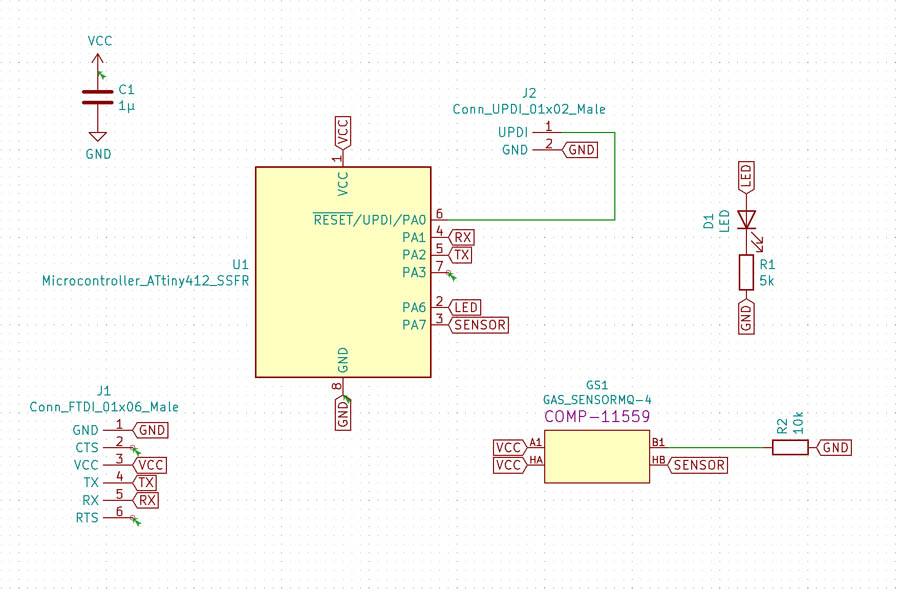
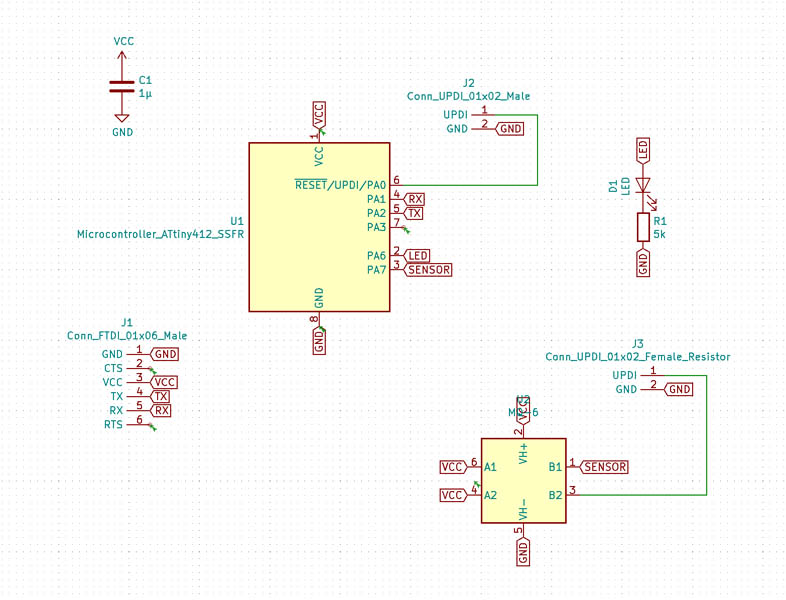
KiCAD design
- Open KiCAD file from electronics design and delete button and phototransistor sensor.
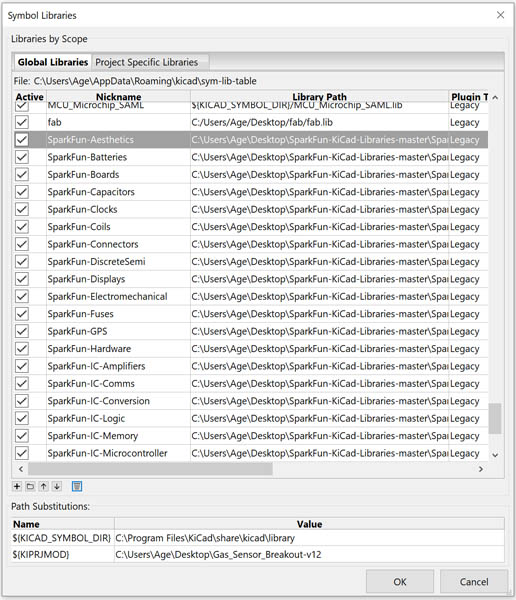
- Add SparkFun Electronics KiCad Libraries to KiCad.
- Find MQ-4 sensor and place in eeschema
- Consult data sheet: sensor has six pins. On Eeschema, there are four: A1, HA, B1 and HB.
Starting point from Hello World board example.
After removing the button and phototransistor.
Finding the right methane gas sensor.
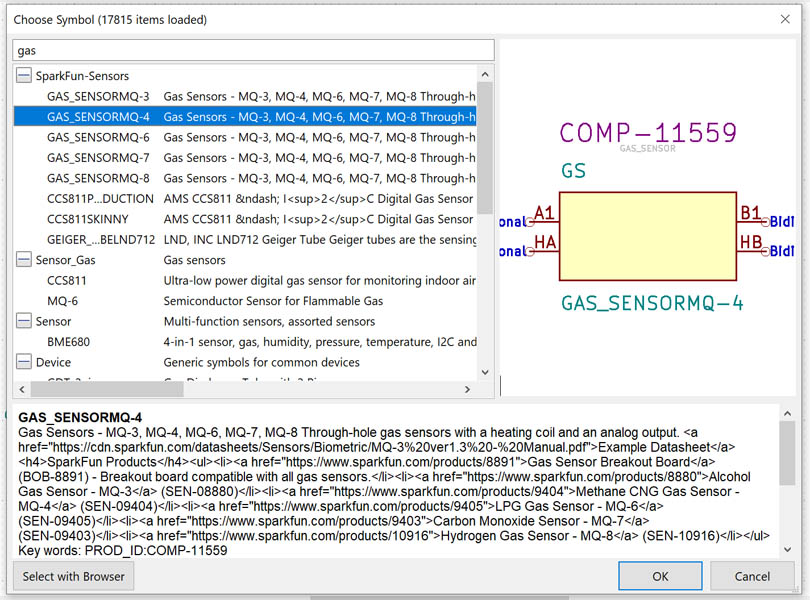
And placing this on the canvas.
To find out what these four pins are and how to connect them, I start with the datasheet. On page 3 it shows six pins. This doesn’t tell us anything about which pin is what.
A basic circuit is drawn on page 4. Here, the numbering of pins 2-5 is different than on the previous page, which is confusing.
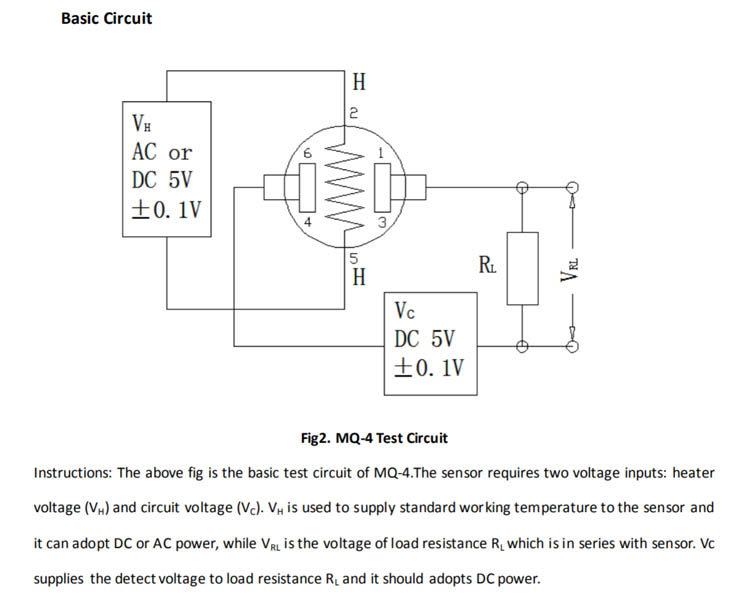
Then on page 6 there is another sketch with a warning about pins 2 and 5.
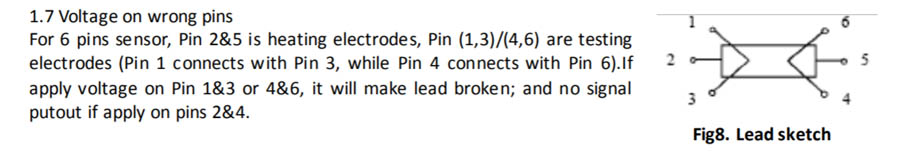
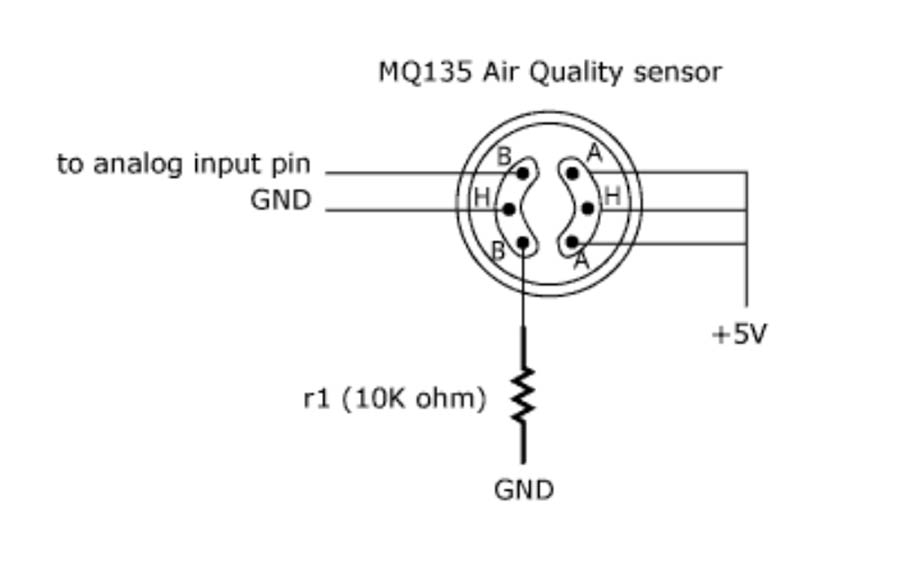
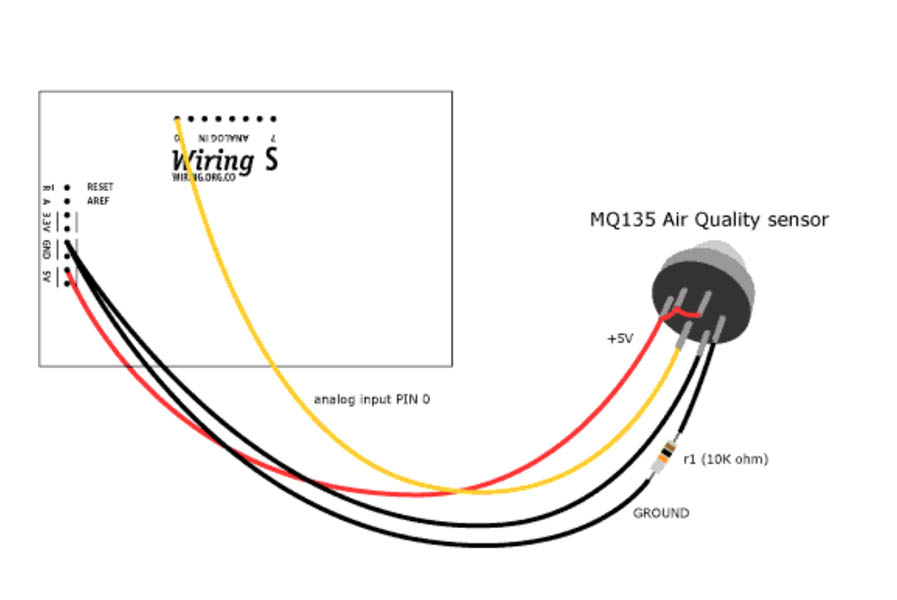
The page contains two links, a datasheet and wiring example. This is for an MQ135 air quality sensor and uses different names.
Corresponding code, perhaps useful for later.
int sensorValue;

void setup()
{
  Serial.begin(9600);      // sets the serial port to 9600
}

void loop()
{
  sensorValue = analogRead(0);       // read analog input pin 0
  Serial.println(sensorValue, DEC);  // prints the value read
  delay(100);                        // wait 100ms for next reading
}
And a Hazardous Gas Monitor Tutorial with examples. Here I found information that might be useful:
For each sensor:
- Connect H1 and A1 to the output of one of the voltage regulators (recommended to use an electrical connector).
- Connect GND to ground.
- Connect B1 to Photon analog pin (LPG goes to A0, Methane to A1)
- Connect A 4.7 kΩ resistor from B1 to ground.
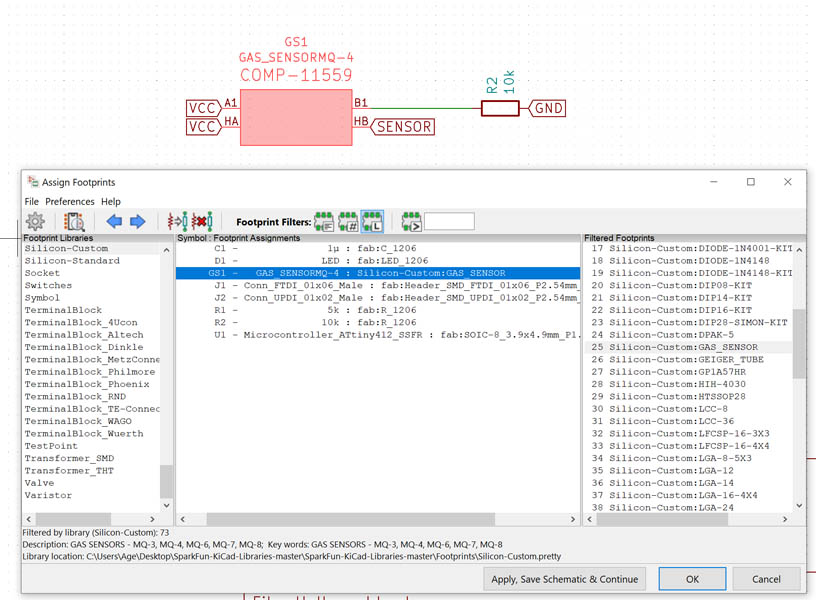
Let’s draw this in Eeschema
Assign footprints.
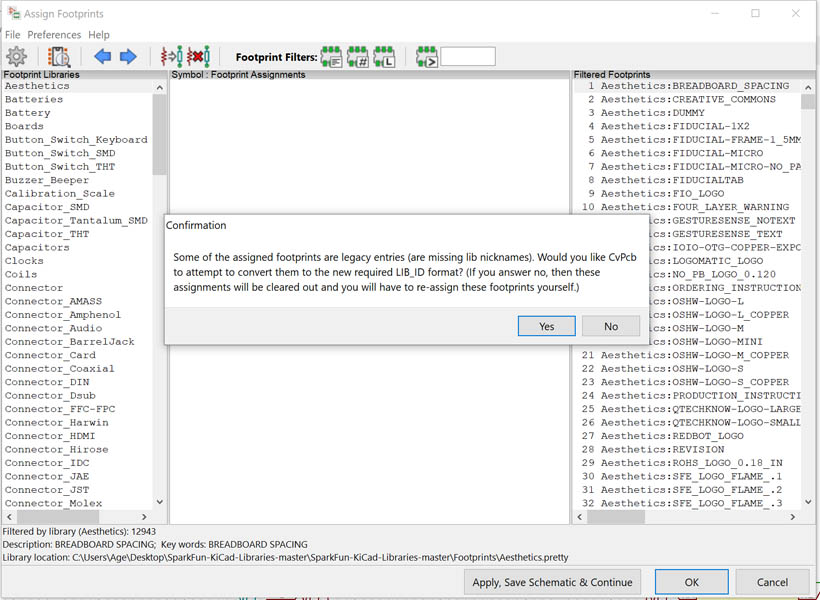
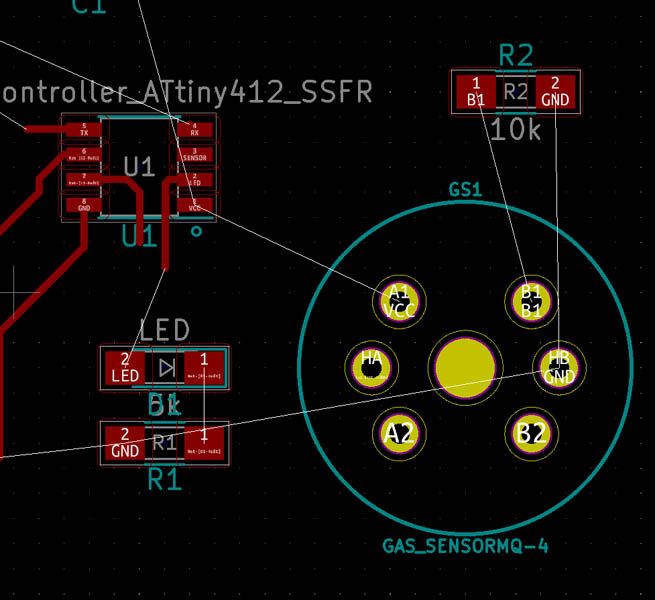
Manually check if the components are correct.
The gas sensor has 6 pins in PCB Editor!
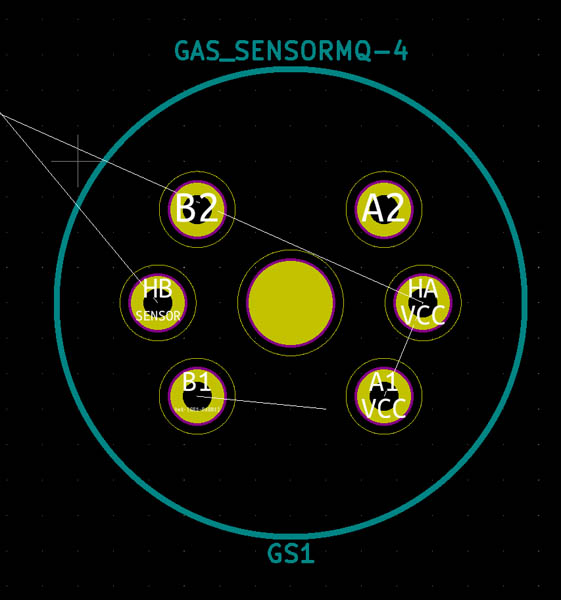
However, they don’t connect to the resistor…
Then I found this image from SparkFun.
With a pinout. This is what we need!
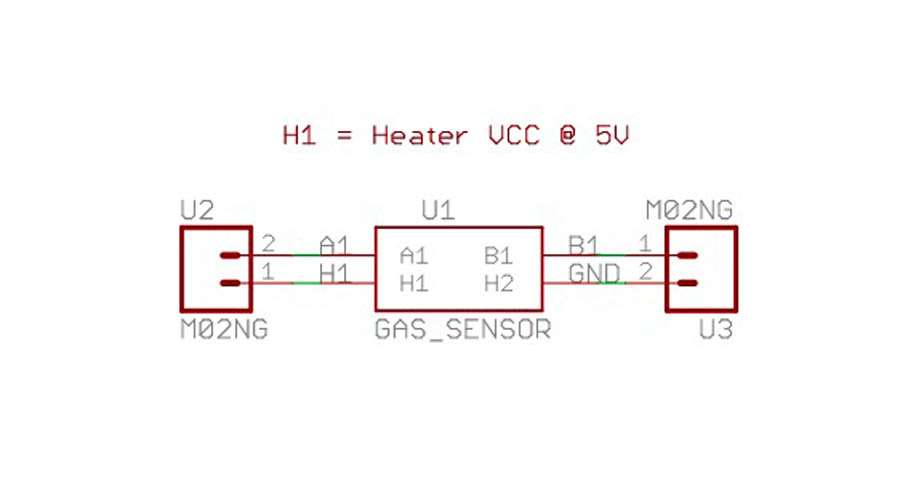
Then I wondered, is it really necessary to buy this addition for the sensor to work? Henk said no, because we can make the internal connections on our own board. I went back to KiCad and attempted to recreate the methane component based on the example from SparkFun.
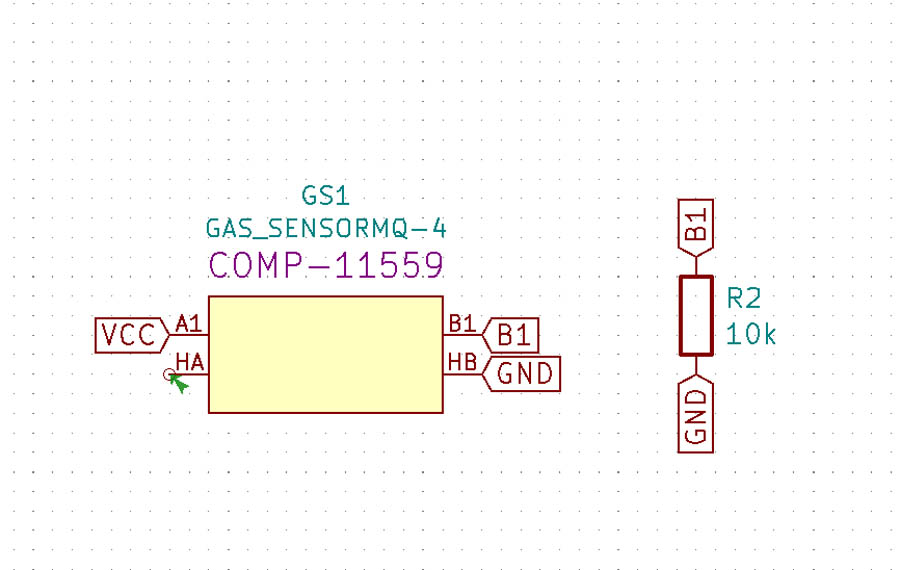
This seems to work because in the PCB Editor, the resistor is now connected!
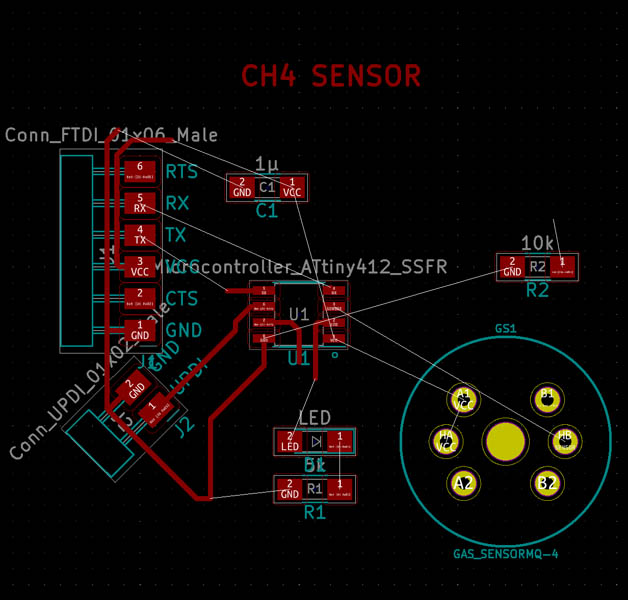
Then I made the rest of the wiring.
And added the cut layer. This time I made the outline with Add graphic polygon in the Dwgs.User layer. The file is now ready for milling at Waag tomorrow.
The next day when I was ready to mill the board, I talked with Henk and decided to go back to Eeschema and replace the resistor with a female UPDI pin. This makes it possible to change resistance during measurements. Then I talked with Paula, who’s also making an environmental sensor this week. She used the standard gas component, and got six pins. That’s what I was looking for! Now, finally it’s clear what pins to use, as they correspond with the sketch. So the conclusion is that the SparkFun library is outdated..
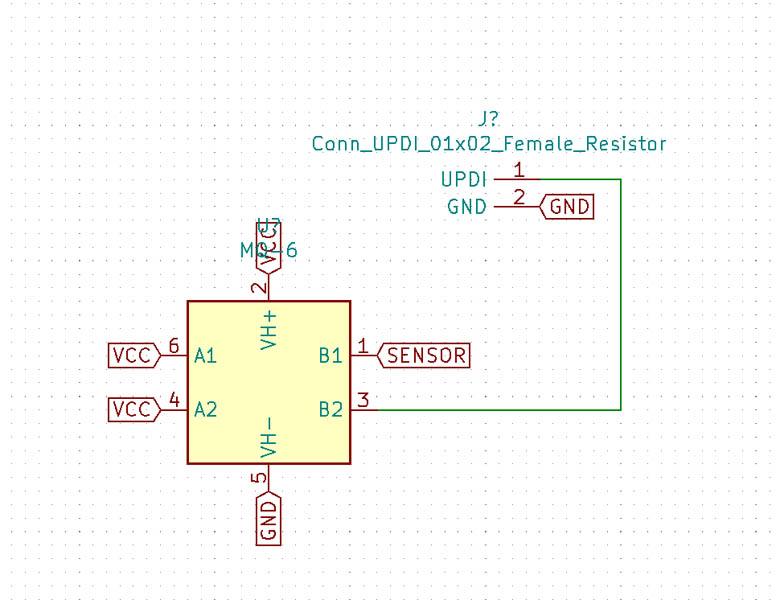
This is the new Eeschema sketch:
Unfortunately, the new component is much bigger.. I really hope this will go well.
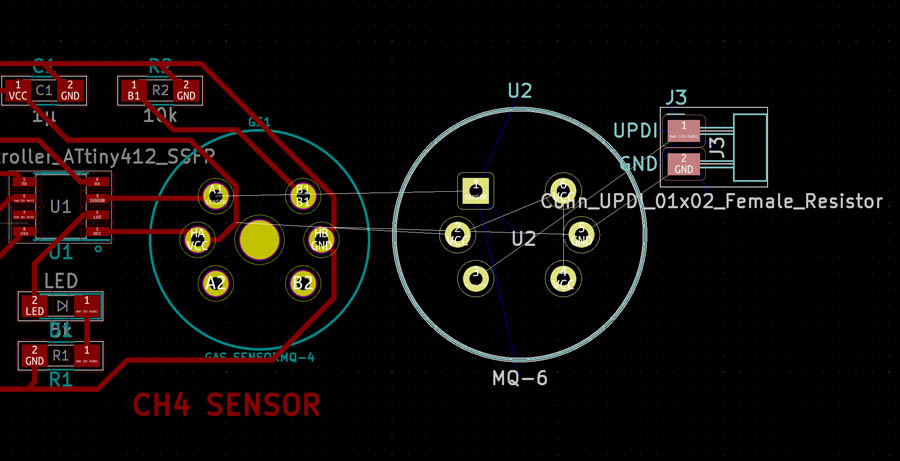
Then I recreated the traces based on the new sensor.
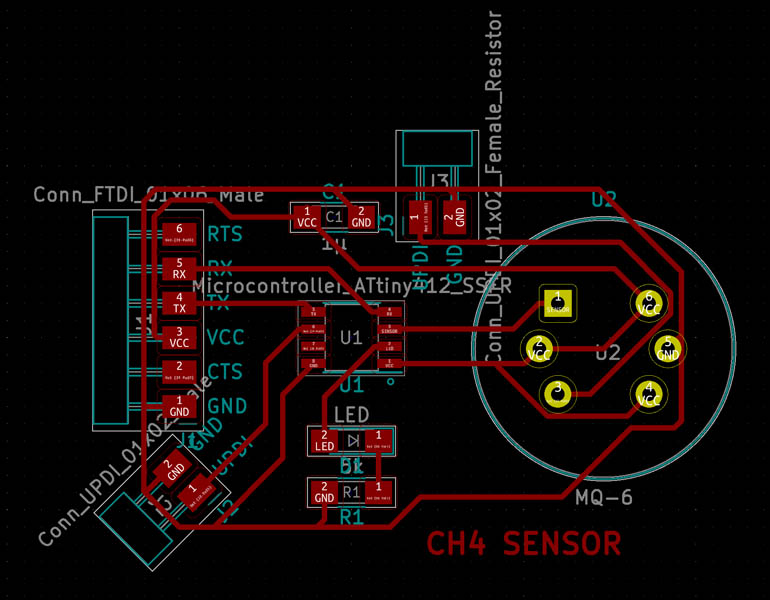
Adjusted the graphic polygon in the Dwgs.User layer to match the new board size.
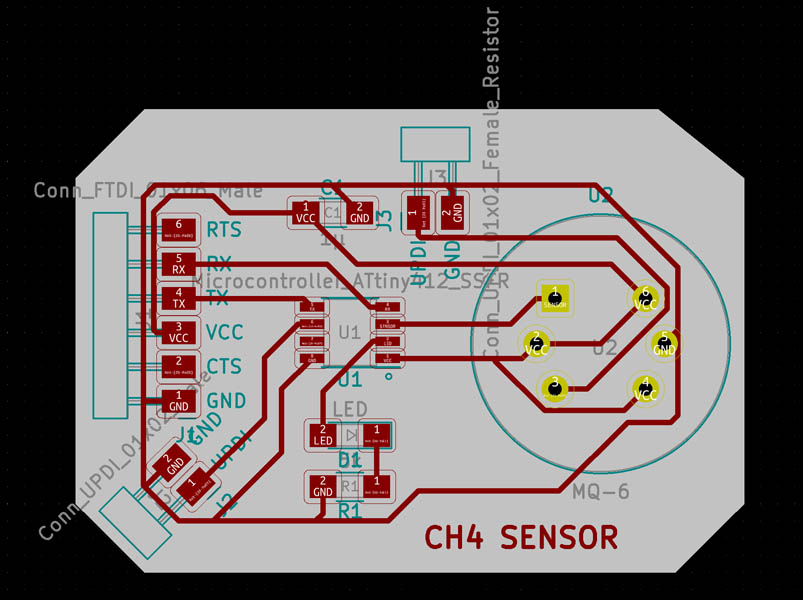
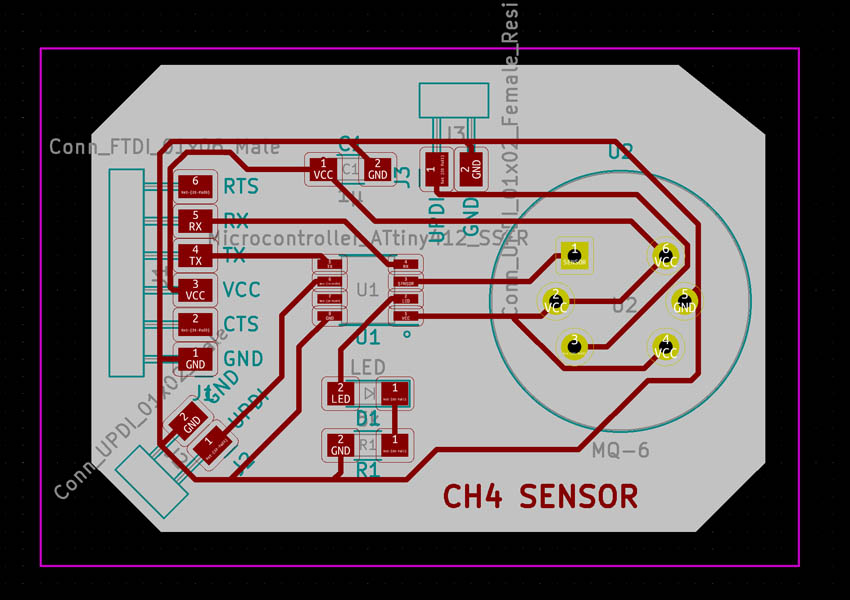
And added an outline in the Margin layer to make it easier for mods to recognize the project.
File preparation in Illustrator
With the same procedure as before, I made two files ready for milling. Its outline:

And traces.
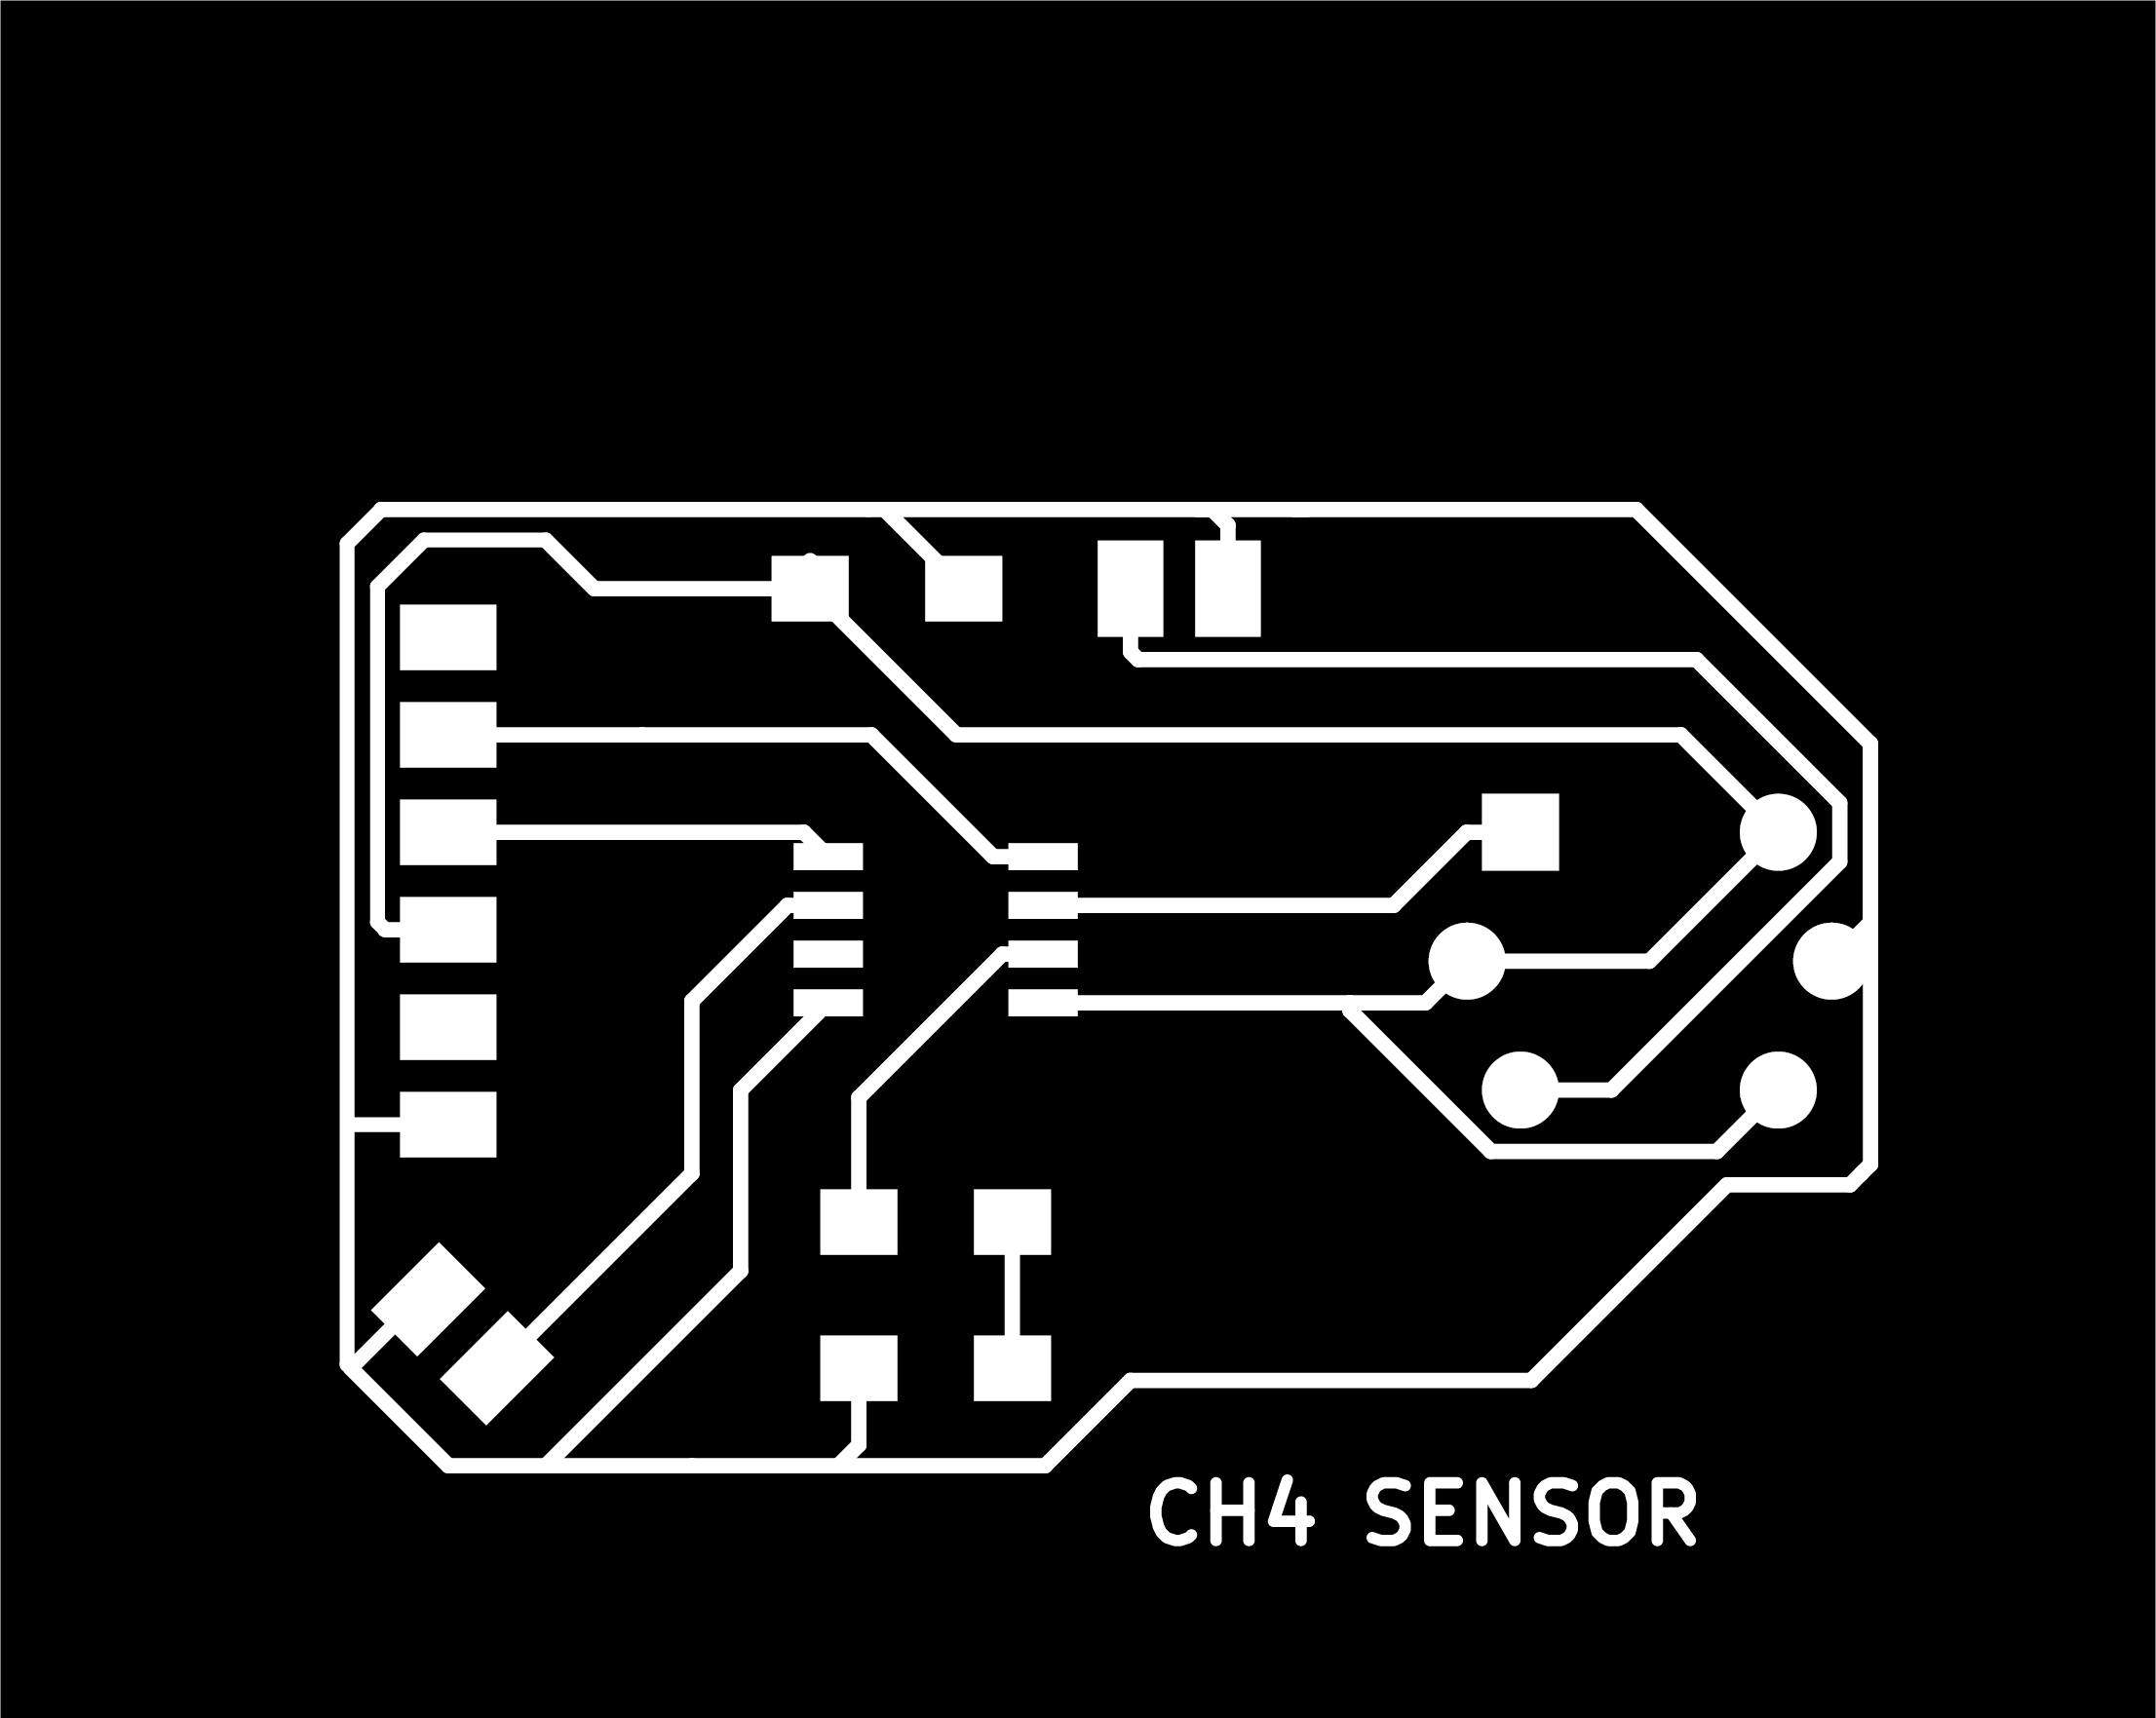
For this board, I also made a third file with through-holes for the CH4 sensor. Open the interior file in Illustrator. You can select the small white circles in between the CH4-sensor’s touch points. It is important to make them black, and color the outside all white. The CNC will mill out the black part.

Milling
For the second board, I changed the origin of the milling machine.
And calibrated the Z-axis.
First file: milling of the holes for the methane sensor.
Then the second file: the traces. I noticed an issue in the 3D viewer.
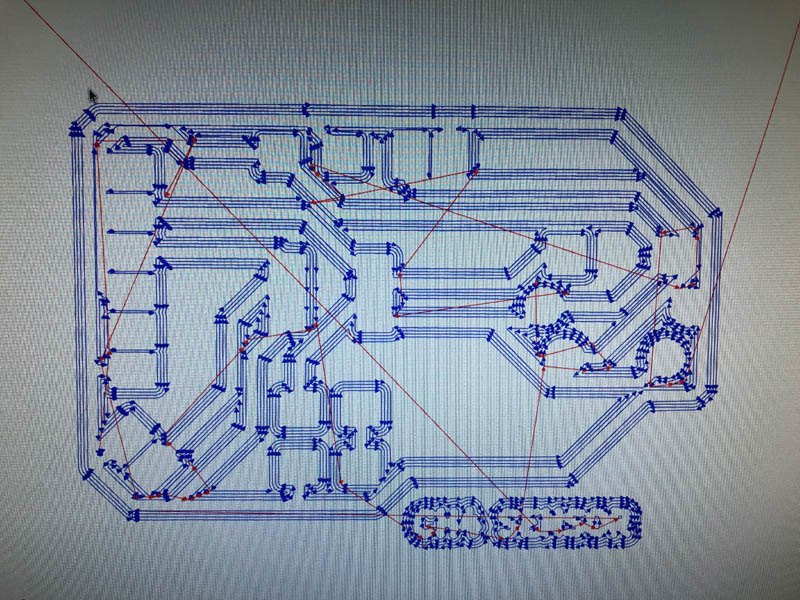
In KiCad, dPair Width should be set at 0.39 mm.
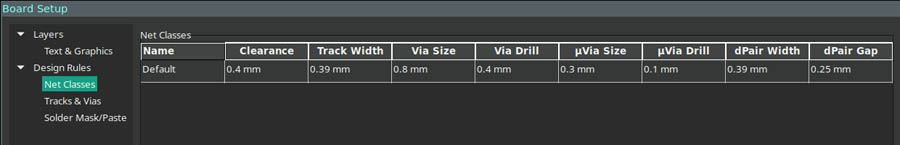
Mine was set at 0.2 mm.
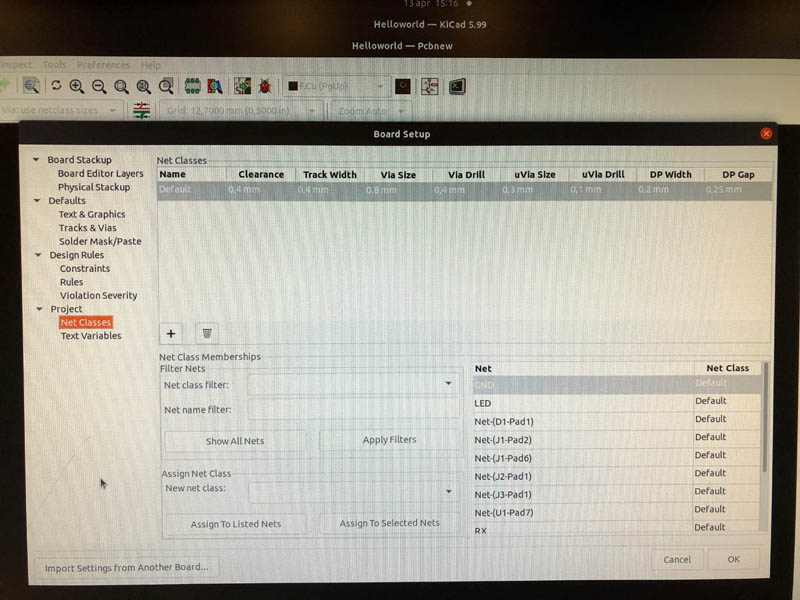
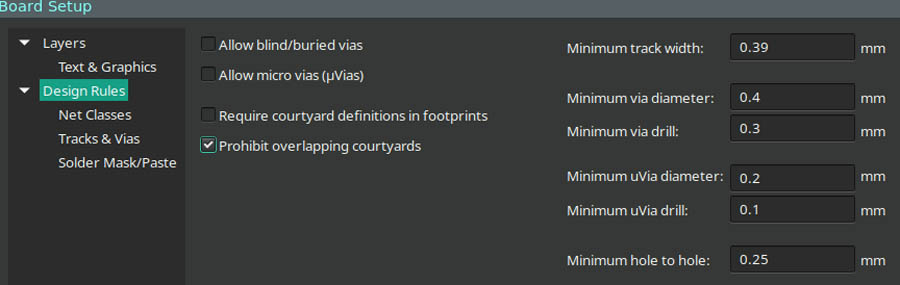
Also check the design rules here, just to be sure.
That solved the problem.

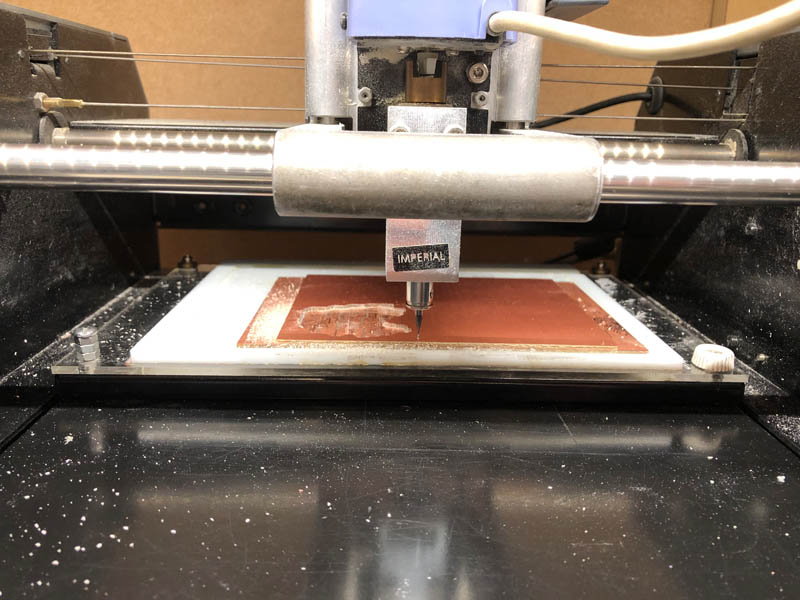
Now we can start the milling process:
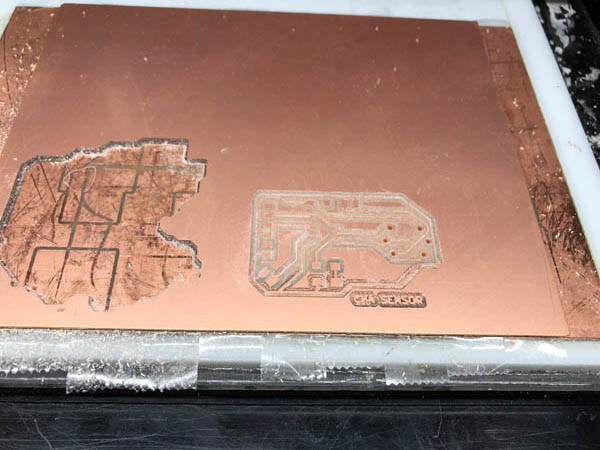
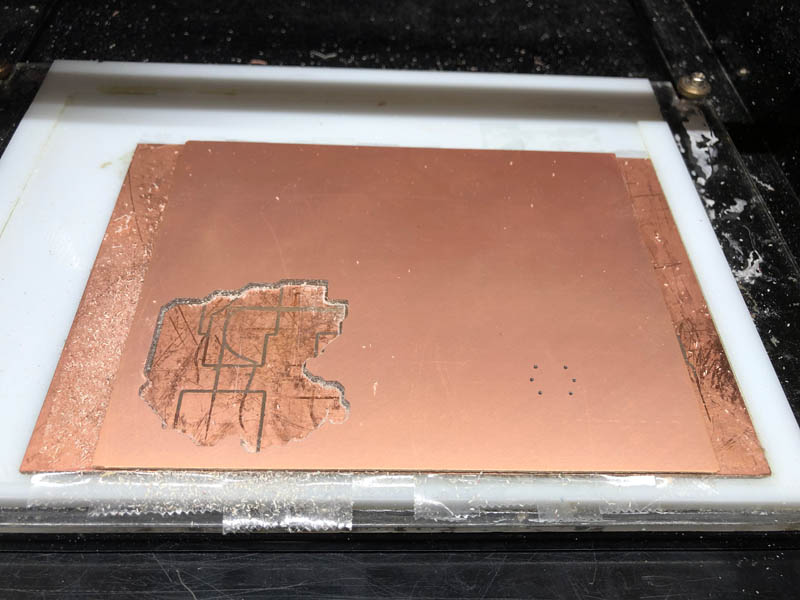
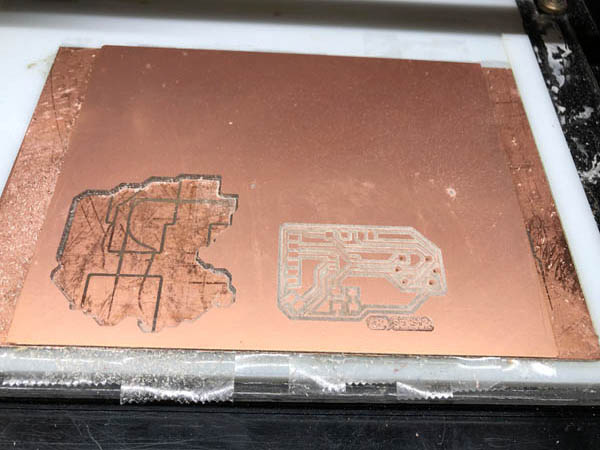
Unfortunately, the surface was not flat. So half of the traces weren’t milled deep enough. The bed is not leveled in the right position. Turned out that I set the screws of the bed too tight after reloading. The second try went well.
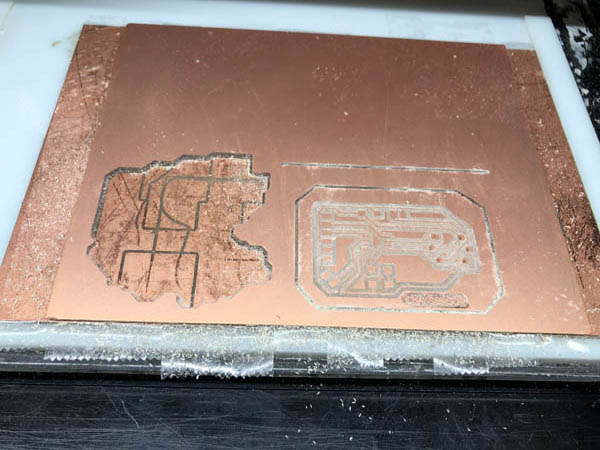
After milling the outline. Again, this didn’t went deep enough. But now there was another reason. I didn’t do the Z-axis leveling correctly.

To level the Z-axis correctly, navigate to your origin in mods. On the Roland, push the Down button maximum, until it stops by itself. The mill bit doesn’t touch the copper layer because we inserted it as high as possible when we changed bits. Now move the mill Up a tiny bit. You can then take the small tool, hold the milling bit with your left finger and turn the screw on the green side. With the guidance of your left hand, softly drop the milling bit on the copper layer.
The mistake I made was that I lowered the bit and left it there, instead of moving it up a bit. The second try went well.
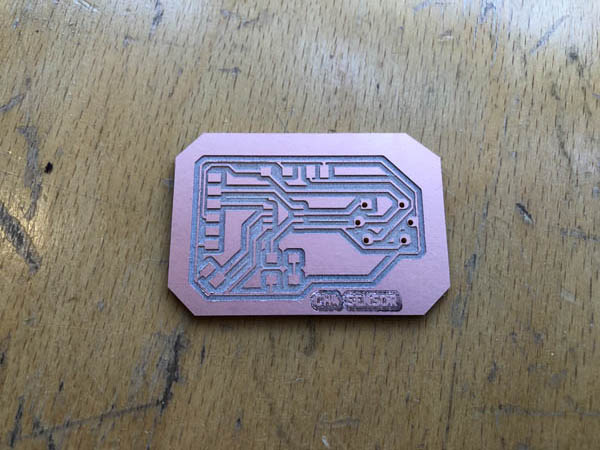
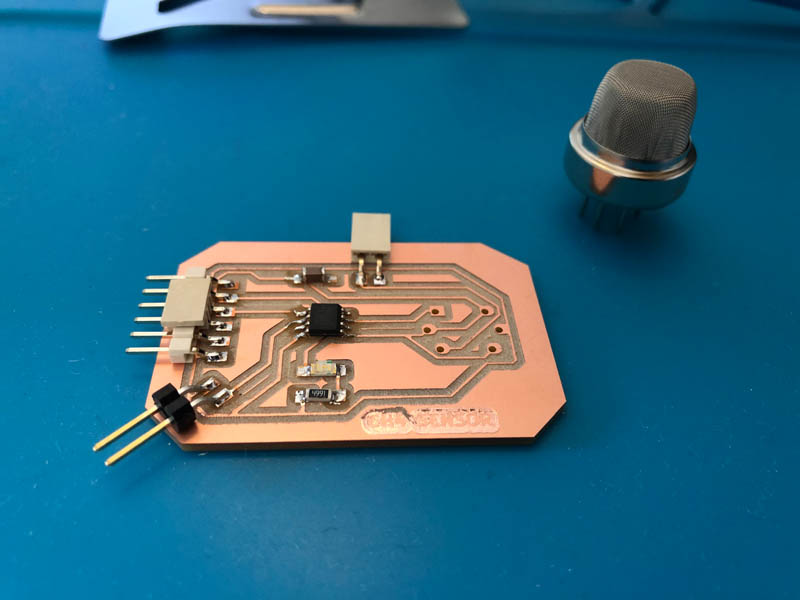
Board ready for cleaning with soap and soldering!
Soldering
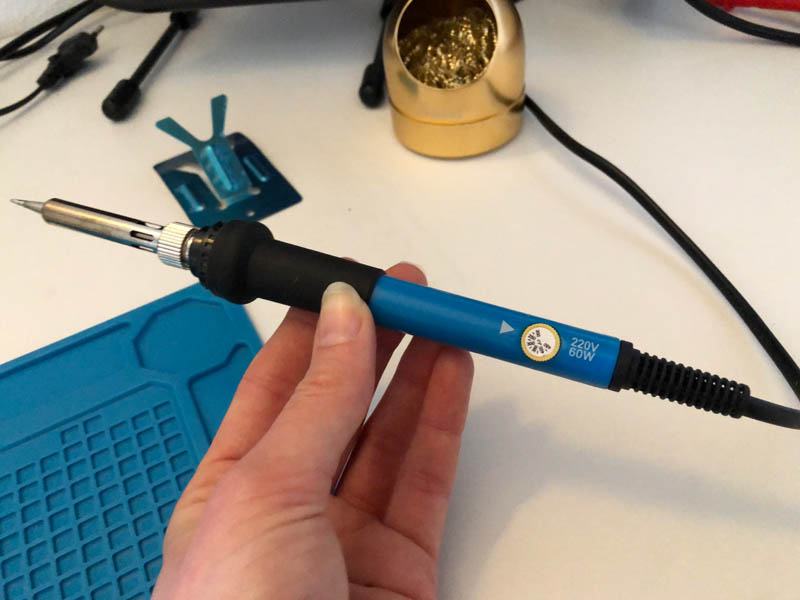
This is the setup for soldering.
I set the temperature of the soldering iron to 250 degrees Celsius.
After soldering the ATtiny412 I checked all traces with a multimeter.
Some more soldering of regular components.
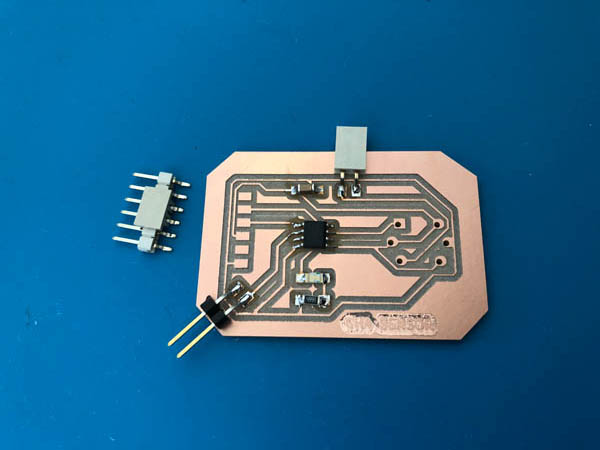
Now it’s time for the CH4 sensor to be added to the board.
I tried to look for directionality.

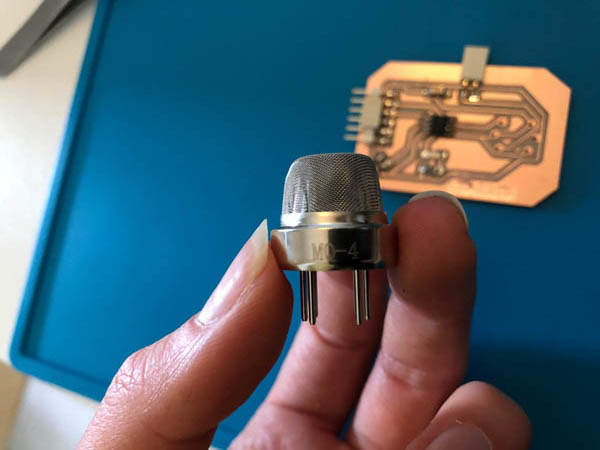
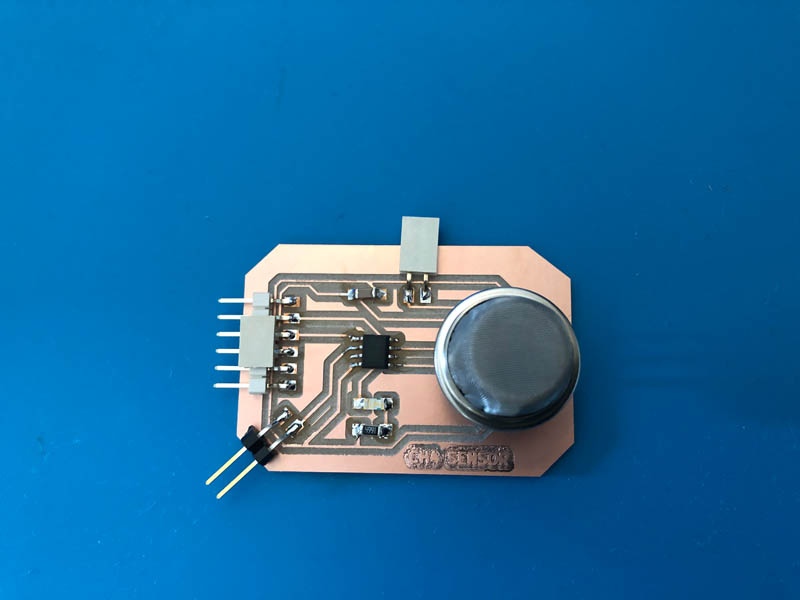
The sensor placed on top of the board.
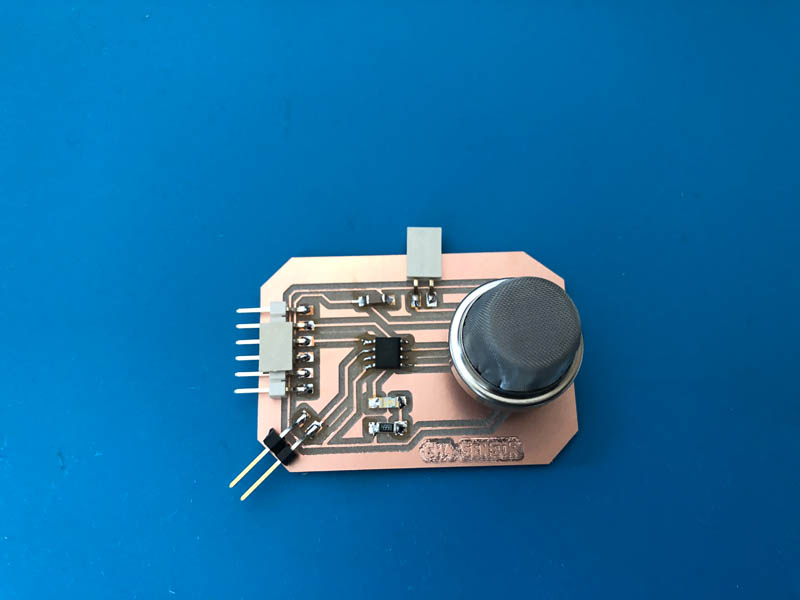
This fits exactly in the perforations. Before and after soldering.
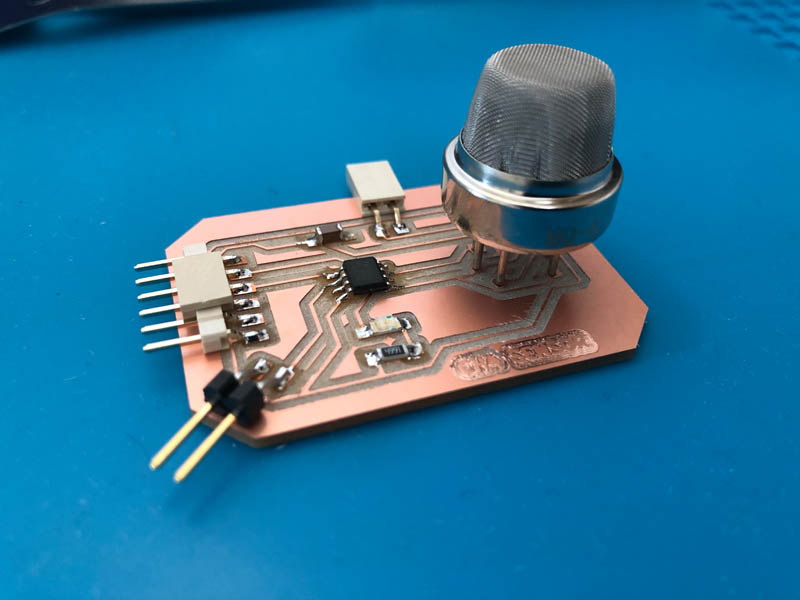
Final result! The board is now ready for programming.
What did I learn about milling today:
- In mods: the origin is in left corner below! So your design will mill to the right.
dPair width= 0.2 mm, this should be 0.39 mm.- Large sensors like CH4 need through-holes that will be milled separately, otherwise the connection will be too fragile and break off quickly.
- Workflow from KiCad’s
.svgoutput to.pngin Illustrator - How to create PCB’s with through-holes
- Repeating the Z-axis leveling procedure of the smal mill, with guidance from Henk
- Another way to design exterior outlines in KiCad: with the
Dwgs.Userlayer - Where to find the copper plates when they run out
Programming
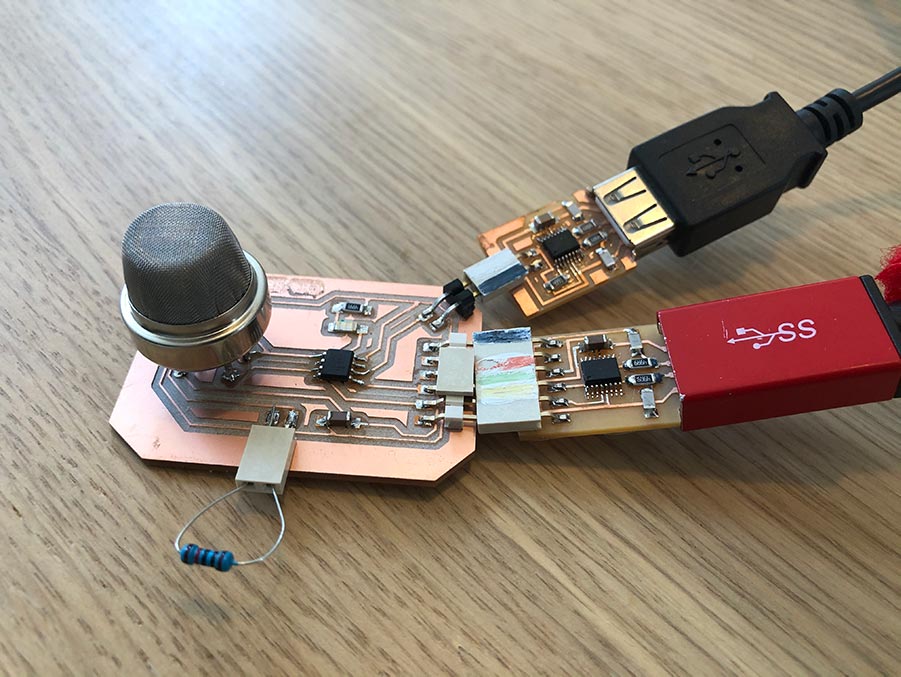
During the regional session, someone at AgriLab mentioned that you need to preheat the sensor for a long time for it to work. Secondly, it is also very difficult to calibrate. We will follow-up on this. For programming the sensor I added a 10k adjustable resistor and connected the FTDI and UPDI.
This is the code from the wiring example I first tried:
int sensorValue;

void setup()
{
  Serial.begin(9600);      // sets the serial port to 9600
}

void loop()
{
  sensorValue = analogRead(0);       // read analog input pin 0
  Serial.println(sensorValue, DEC);  // prints the value read
  delay(100);                        // wait 100ms for next reading
}
After connecting the FTDI and uploading the program the sensor becomes really hot. You can still touch it, but not too long. The serial monitor does not show any data. Next, I followed a tutorial on understanding a gas sensor, and learned more about the importance of finding out the sensitivity characteristics of this sensor. It tells us the concentration of a gas in part per million (ppm) according to the resistance ratio of the sensor (RS/R0).
RS is the resistance of the sensor that changes depending on the concentration of gas, and R0 is the resistance of the sensor at a known concentration without the presence of other gases, or in fresh air.
The code provided to calculate R0:
Code to Calculate R0
void setup() {
  Serial.begin(9600); //Baud rate
}

void loop() {
  float sensor_volt; //Define variable for sensor voltage
  float RS_air; //Define variable for sensor resistance
  float R0; //Define variable for R0
  float sensorValue; //Define variable for analog readings
  for(int x = 0 ; x < 500 ; x++) //Start for loop
  {
    sensorValue = sensorValue + analogRead(A0); //Add analog values of sensor 500 times
  }
  sensorValue = sensorValue/500.0; //Take average of readings
  sensor_volt = sensorValue*(5.0/1023.0); //Convert average to voltage
  RS_air = ((5.0*10.0)/sensor_volt)-10.0; //Calculate RS in fresh air
  R0 = RS_air/4.4; //Calculate R0

  Serial.print("R0 = "); //Display "R0"
  Serial.println(R0); //Display value of R0
  delay(1000); //Wait 1 second
}
Nothing happened. Next, I removed the buzzer from Paula’s code that she modified from the same source about understanding a gas sensor.
int led = 10; //LED pin
int gas_sensor = A0; //Sensor pin
float m = -0.318; //Slope
float b = 1.133; //Y-Intercept
float R0 = 11.820; //Sensor Resistance in fresh air from previous code

void setup() {
  Serial.begin(9600); //Baud rate
  pinMode(led, OUTPUT); //Set LED as output
  digitalWrite(led, LOW); //Turn LED off
  pinMode(buzzer, OUTPUT); //Set buzzer as output
  digitalWrite(buzzer, LOW); // Turn buzzer off
  pinMode(gas_sensor, INPUT); //Set gas sensor as input
}

void loop() {
  float sensor_volt; //Define variable for sensor voltage
  float RS_gas; //Define variable for sensor resistance
  float ratio; //Define variable for ratio
  float sensorValue = analogRead(gas_sensor); //Read analog values of sensor
  sensor_volt = sensorValue*(5.0/1023.0); //Convert analog values to voltage
  RS_gas = ((5.0*10.0)/sensor_volt)-10.0; //Get value of RS in a gas
  ratio = RS_gas/R0;  // Get ratio RS_gas/RS_air

  double ppm_log = (log10(ratio)-b)/m; //Get ppm value in linear scale according to the the ratio value
  double ppm = pow(10, ppm_log); //Convert ppm value to log scale
  double percentage = ppm/10000; //Convert to percentage


  if(ppm>2000){ //Check if ppm value is greater than 2000
    digitalWrite(led, HIGH); //Turn LED on
    digitalWrite(buzzer, HIGH); //Turn buzzer on
   }  else { //Case ppm is not greater than 2000
    digitalWrite(led, LOW); //Turn LED off
    digitalWrite(buzzer, LOW); //Turn buzzer off
    }
   }
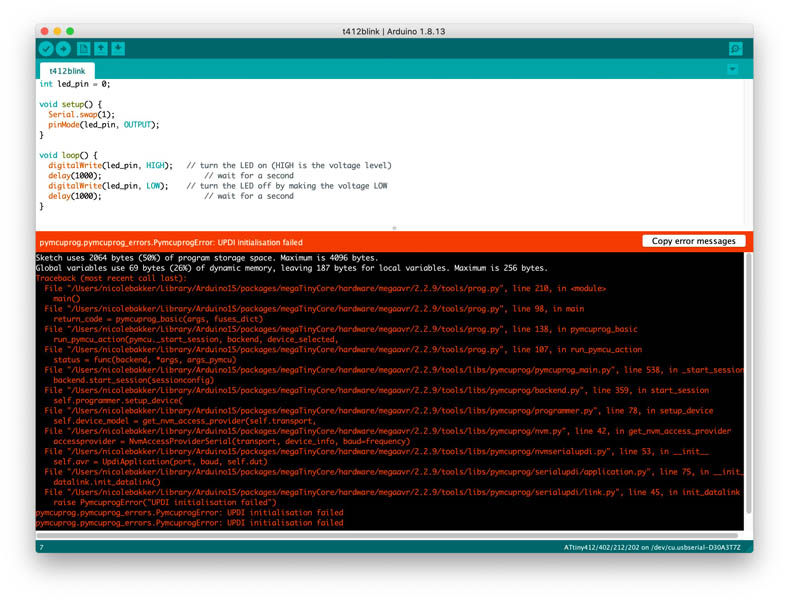
The UPDI initialization failed. I suspect that the ATtiny is not alive anymore because it is also hot. I tested my UPDI with other boards and it works perfectly there. All settings in the Arduino IDE are correct too. Some thoughts: at the time of making this board, I didn’t know yet we had to place the capacitor as close as possible to the microcontroller, in between VCC and GND. The one I placed on this board is quite far away from the microcontroller. Secondly, the external resistor might not have made contact well enough or it might not have provided enough resistance, resulting in a dead microcontroller.
Reflections
This was a busy week, and I learned a lot! I made a board with a phototransistor and button and succesfully programmed it to respond to light. Because my Hello Fryslân board made with the UV printing process somehow didn’t work before, it felt like I missed out on a lot of programming. With my new board I considered this week as an opportunity for a rematch. And honestly it feels like Fab Academy has finally truly started!
Unfortunately the methane sensor did not show any data. After many attempts I asked Henk and he refered to Paula’s documentation on Input Devices for troubleshooting. Paula is a fellow student at Waag and she uses a similar sensor for her final project: a smart campervan. Eventually with a lot of help from Henk she made her propane sensor work during Interface and Application Programming week, as you can read in her documentation. Due to time constraints and little support it was not possible for me to complete this in one week. However I will give this sensor another try later, with Paula’s documentation as a guidance.
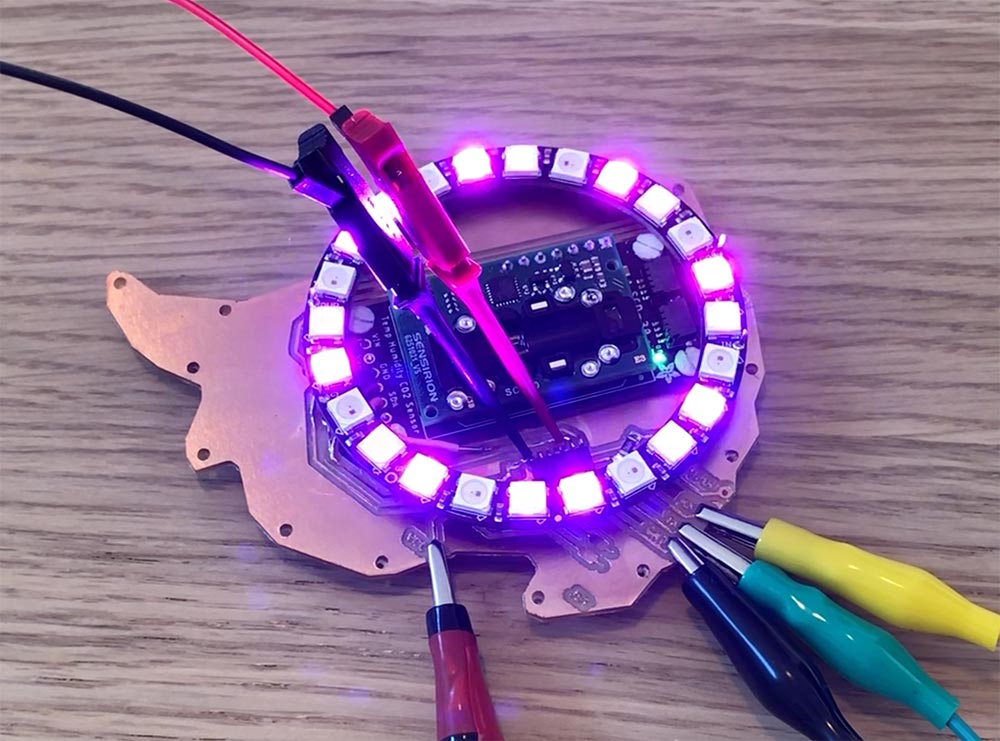
My main objective for the final project is not to measure methane, but CO2. This was a warming-up. Just after this week my SCD-30 sensor for CO2, temperature and humididty arrived. During Output Devices I challenged myself to work with this new sensor as an input device and visualize the data to output devices, including LEDs and an OLED display. The lessons learned with this week’s methane sensor provided a solid foundation.
Downloads
CNC 2018 Pro
Hello Fryslân board
- HelloFryslan-F_Cu_1000dpi (png)
- HelloFryslan-Edge_Cuts1000ppi (png)
- KiCad folder Hello Fryslân board (zip)
Methane sensor
Explore more like this
Week 17 Invention, Intellectual Property and Business Models
After acing through the technical assignments of Fab Academy, the last two weeks have a lighter load so we can focus on the final project. But this does not mean...
Week 16 Applications and Implications
Propose a final project masterpiece that integrates the range of units covered, answering: