Week 12
Interface and
Application Programming
assignment
Group Assignment
1- compare as many tool options as possible
Individual Assignment
1- write an application that interfaces with an input and/or output device that you made


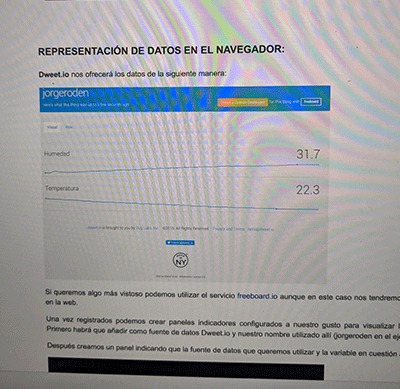
Data Visualization in the cloud Internet of Things
Arduino Sensor Code DHT11 Sensor code Arduino .INO Download
For my individual assignment, I had already built and used the DHT11 humidity displayed on an LCD screen (see also: Week 10 and Week 11) Input and Output devices.
I really wanted to be able to monitor this information from anywhere from my cellphone or another computer. That way if there was a problem I could notify someone. I also wanted to visualize the temperature information in a format other than numbers.
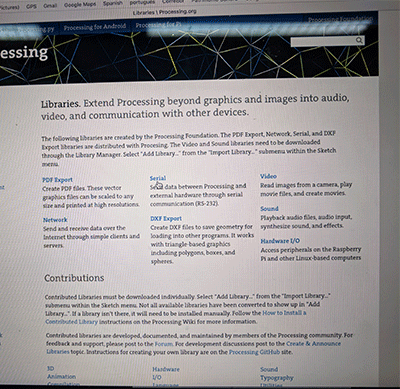
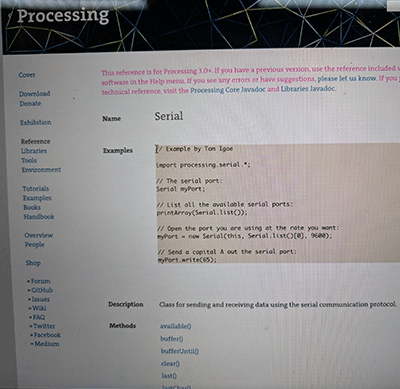
The interface I decided to use to create an application is open source, it is called Processing.
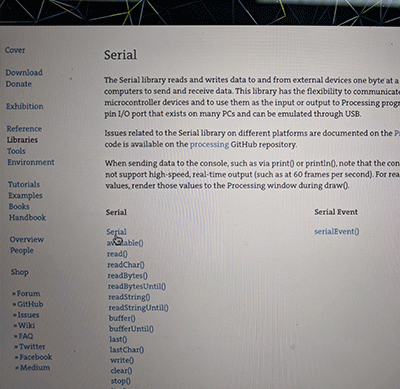
I connected my board to my PC and made sure the input was displaying properly. I downloaded processing and explored the libraries to find one for temperature and humidity.
I imported the serial library and paired the ports.
I opened my board and processing windows simultaneously.
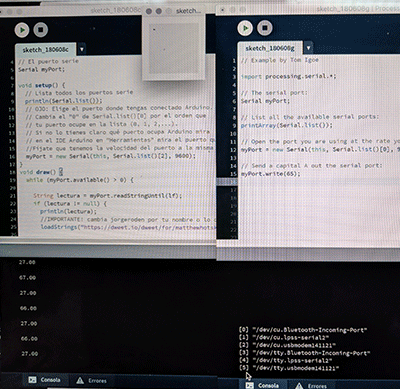
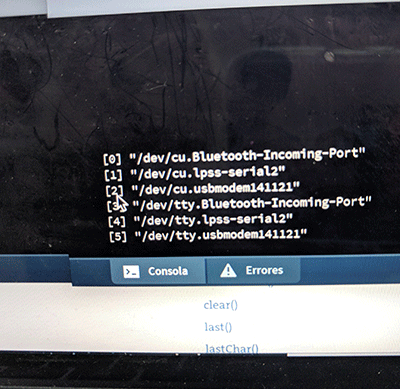
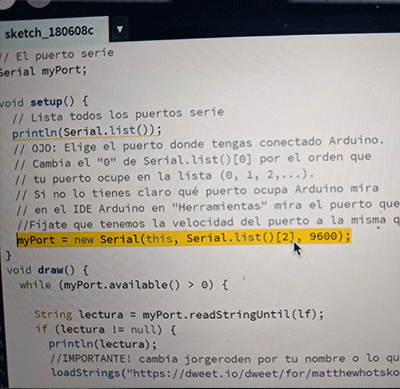
I listed my port and copied the data. I placed the data in the processing window to match the data being read.
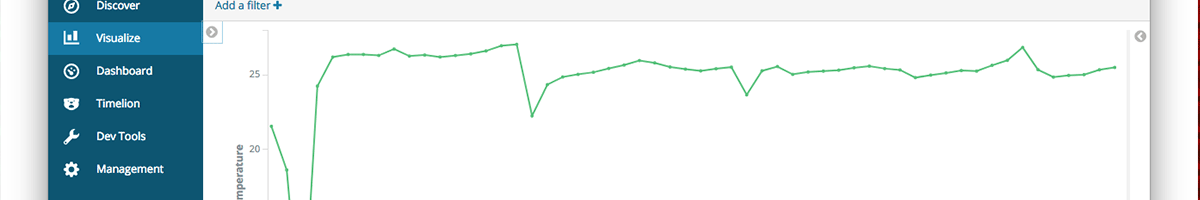
I selected the data visualizer that would show a live timeline of the temperature and humidity being read.
Every 5 seconds, the sensor was measuring the temperature and humidity in the room. This was being sent to my computer which was being displayed simultaneously in the connected processing window. The information was then being visually presented in the form of a line graph.
At first glance the information isn't impressive, because the temperature in a closed room doesn't change much unless there are external factors that change rapidly. To test this and show more visually appealing data, I enclosed the DHT11 sensor in my hands and was able to cause the temperature to raise almost 10 degrees. This data was reproduced and shown on the visual graph.
1- compare as many tool options as possible
Individual Assignment
1- write an application that interfaces with an input and/or output device that you made
Software Used
Processing, Google Chrome, Sublime Text, Photoshop, Git, Arduino
Tutorial Used
Fab Academy Week 12 - Interface and Application ProgrammingData Visualization in the cloud Internet of Things
Files used:
Processing Web File .PDE DownloadArduino Sensor Code DHT11 Sensor code Arduino .INO Download
Walkthrough
As a group we explored different interfaces/programming platforms that we could use to complete this weeks assignment. We looked at MBLOCK (good introductory intuitive tool, scratch based, but limited adaptability), FACILINO, and MIT APP Inventor.For my individual assignment, I had already built and used the DHT11 humidity displayed on an LCD screen (see also: Week 10 and Week 11) Input and Output devices.
I really wanted to be able to monitor this information from anywhere from my cellphone or another computer. That way if there was a problem I could notify someone. I also wanted to visualize the temperature information in a format other than numbers.
The interface I decided to use to create an application is open source, it is called Processing.
I connected my board to my PC and made sure the input was displaying properly. I downloaded processing and explored the libraries to find one for temperature and humidity.
I imported the serial library and paired the ports.
|
 |
I opened my board and processing windows simultaneously.
I listed my port and copied the data. I placed the data in the processing window to match the data being read.
|
 |
I selected the data visualizer that would show a live timeline of the temperature and humidity being read.
Every 5 seconds, the sensor was measuring the temperature and humidity in the room. This was being sent to my computer which was being displayed simultaneously in the connected processing window. The information was then being visually presented in the form of a line graph.
At first glance the information isn't impressive, because the temperature in a closed room doesn't change much unless there are external factors that change rapidly. To test this and show more visually appealing data, I enclosed the DHT11 sensor in my hands and was able to cause the temperature to raise almost 10 degrees. This data was reproduced and shown on the visual graph.