





NODO
Object detection interface for the conveyor belt using XIAO ESP32-C3, HC-SR04, a custom generic board, and Blynk.
The group assignment reviewed interface options and compared how applications communicate with embedded devices. The complete group documentation is available on the lab page.
View Full Group Assignment PageThe individual assignment was to write an application that interfaces a user with an input or output device that I made. For this work I reused the conveyor belt developed in the machine/mechanical design assignment and added an interface to monitor object detection in real time.
The system detects when an object passes through the conveyor belt sensing area. The HC-SR04 measures distance, the XIAO ESP32-C3 processes the signal, and the Blynk web dashboard displays the process data. This turns the conveyor belt into a small monitoring station for counting cycles and measuring how long an object stays in the detection area.
The application was organized as a simple IoT architecture. The embedded system reads the physical process, the firmware transforms the raw distance into process variables, and Blynk works as the user interface layer. This separation helped me debug the project because each layer has a clear responsibility.
| Decision | Reason | Effect on the Interface |
|---|---|---|
| Use Blynk instead of building a custom web app from zero | Blynk already provides IoT widgets, datastreams, device templates, and cloud communication. | The dashboard could be built quickly and focused on process visualization instead of backend development. |
| Use virtual pins for all variables | Virtual pins separate interface data from physical microcontroller pins. | Distance, cycle time, average time, counter, status, and reset were organized clearly. |
| Use gauges, labels, and charts | The interface needed to be readable during a live conveyor test. | The user can quickly see current distance, process status, and historical behavior. |
| Use a dashboard reset button | Testing requires restarting counters without re-uploading firmware. | The user can clear values directly from the application layer. |
| Part | Function |
|---|---|
| Conveyor belt | Moves the object through the detection zone. |
| HC-SR04 ultrasonic sensor | Measures distance and detects whether an object is present. |
| XIAO ESP32-C3 | Reads the sensor, calculates cycle data, and connects to WiFi. |
| Generic custom PCB | Provides organized pin access, power rails, and the voltage divider for the sensor echo signal. |
| Blynk | Works as the application interface for real-time monitoring and reset control. |
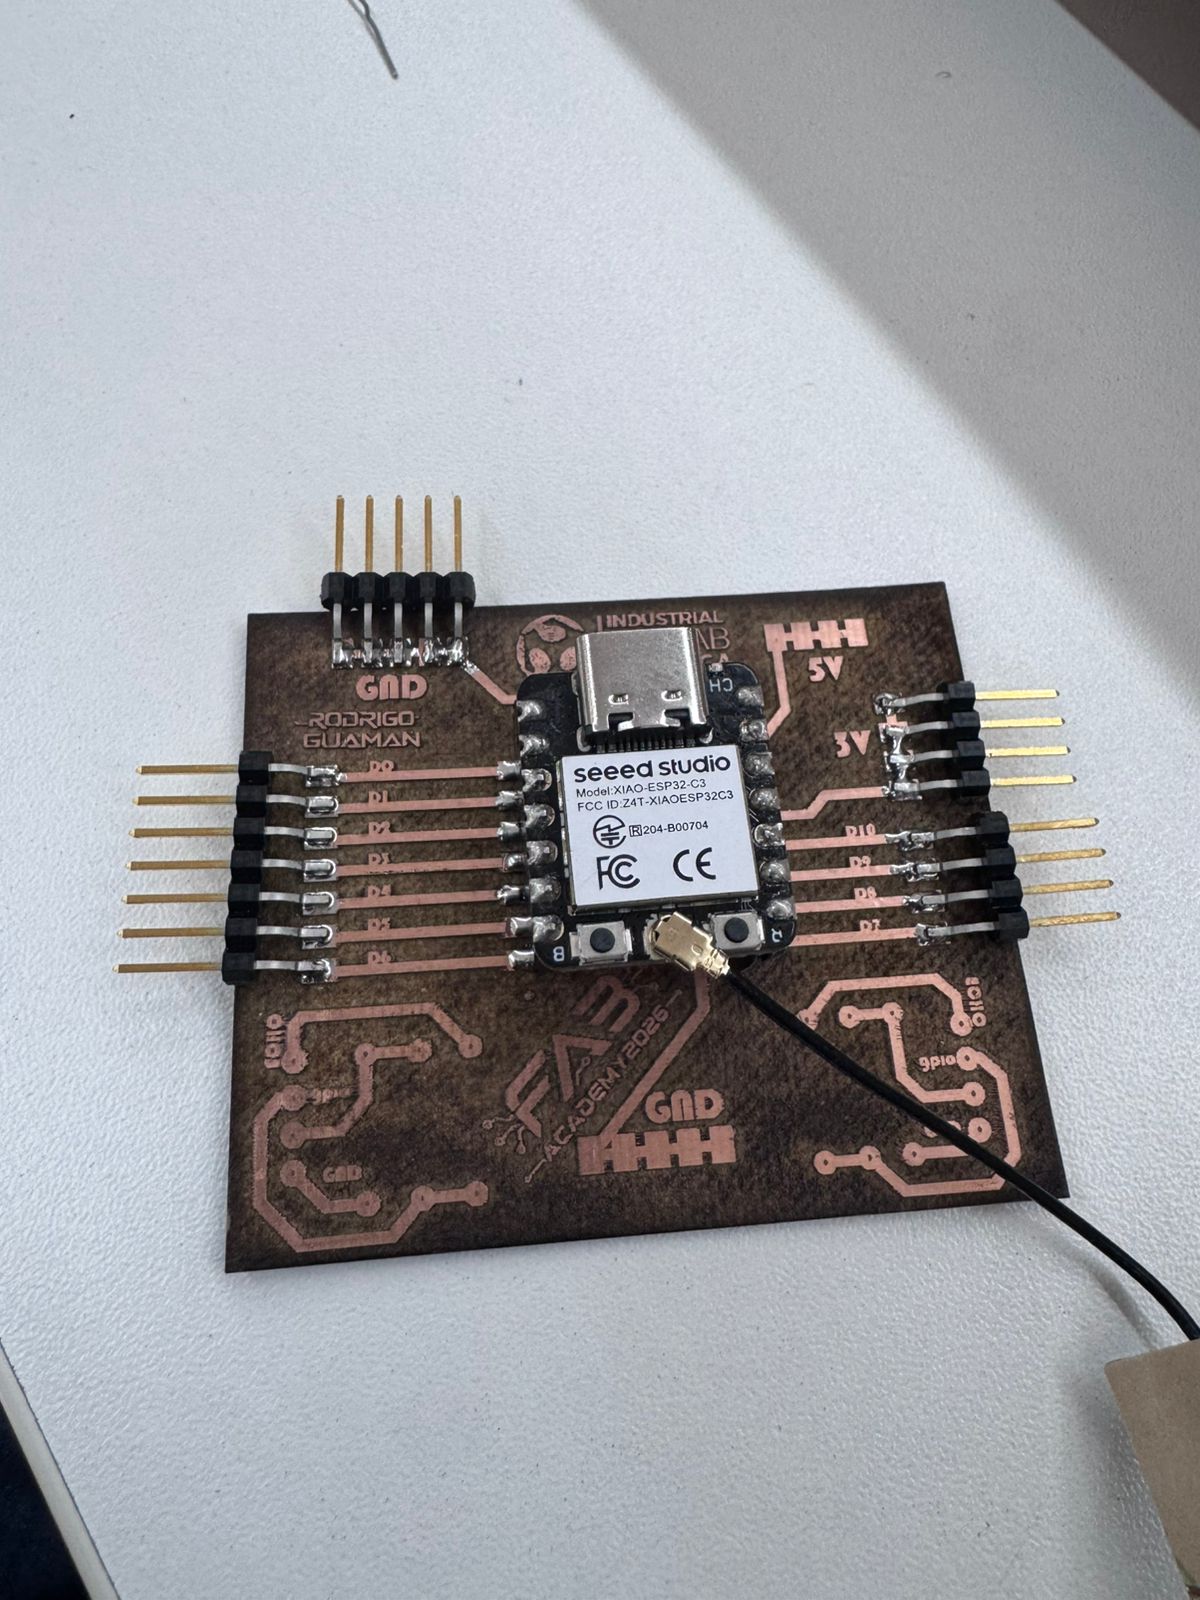
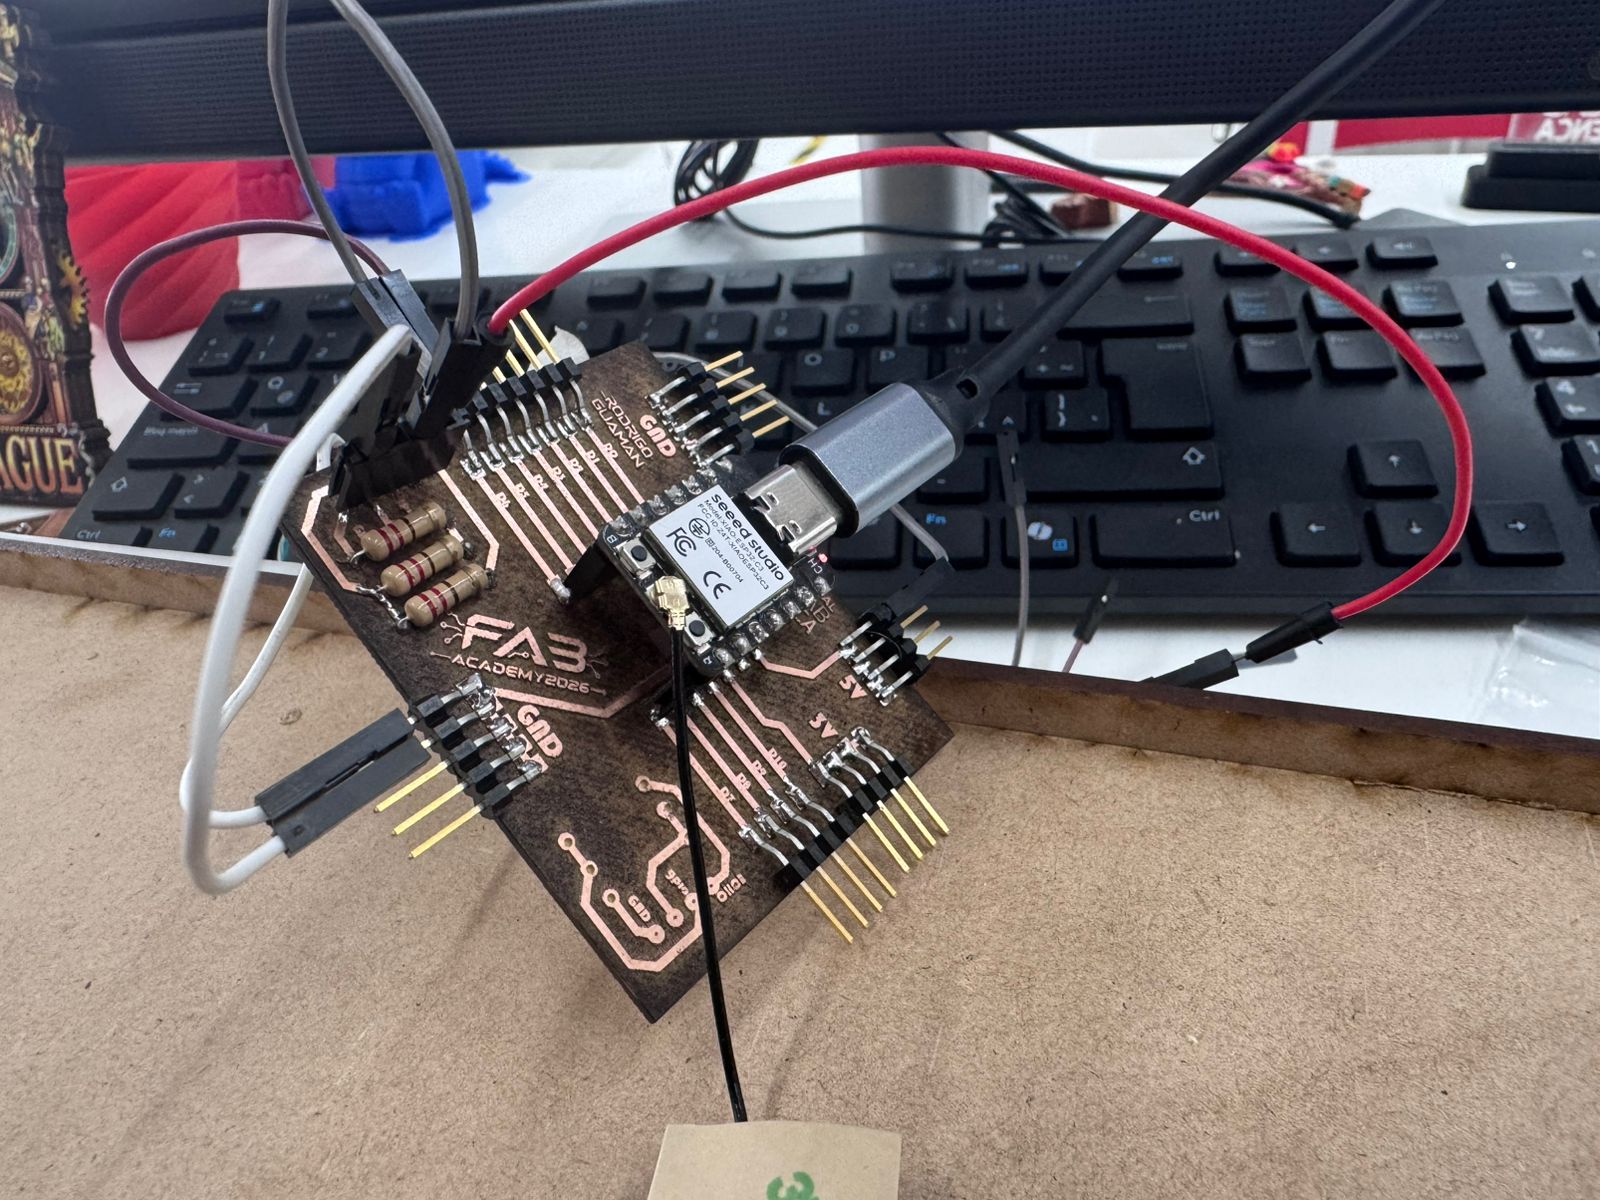
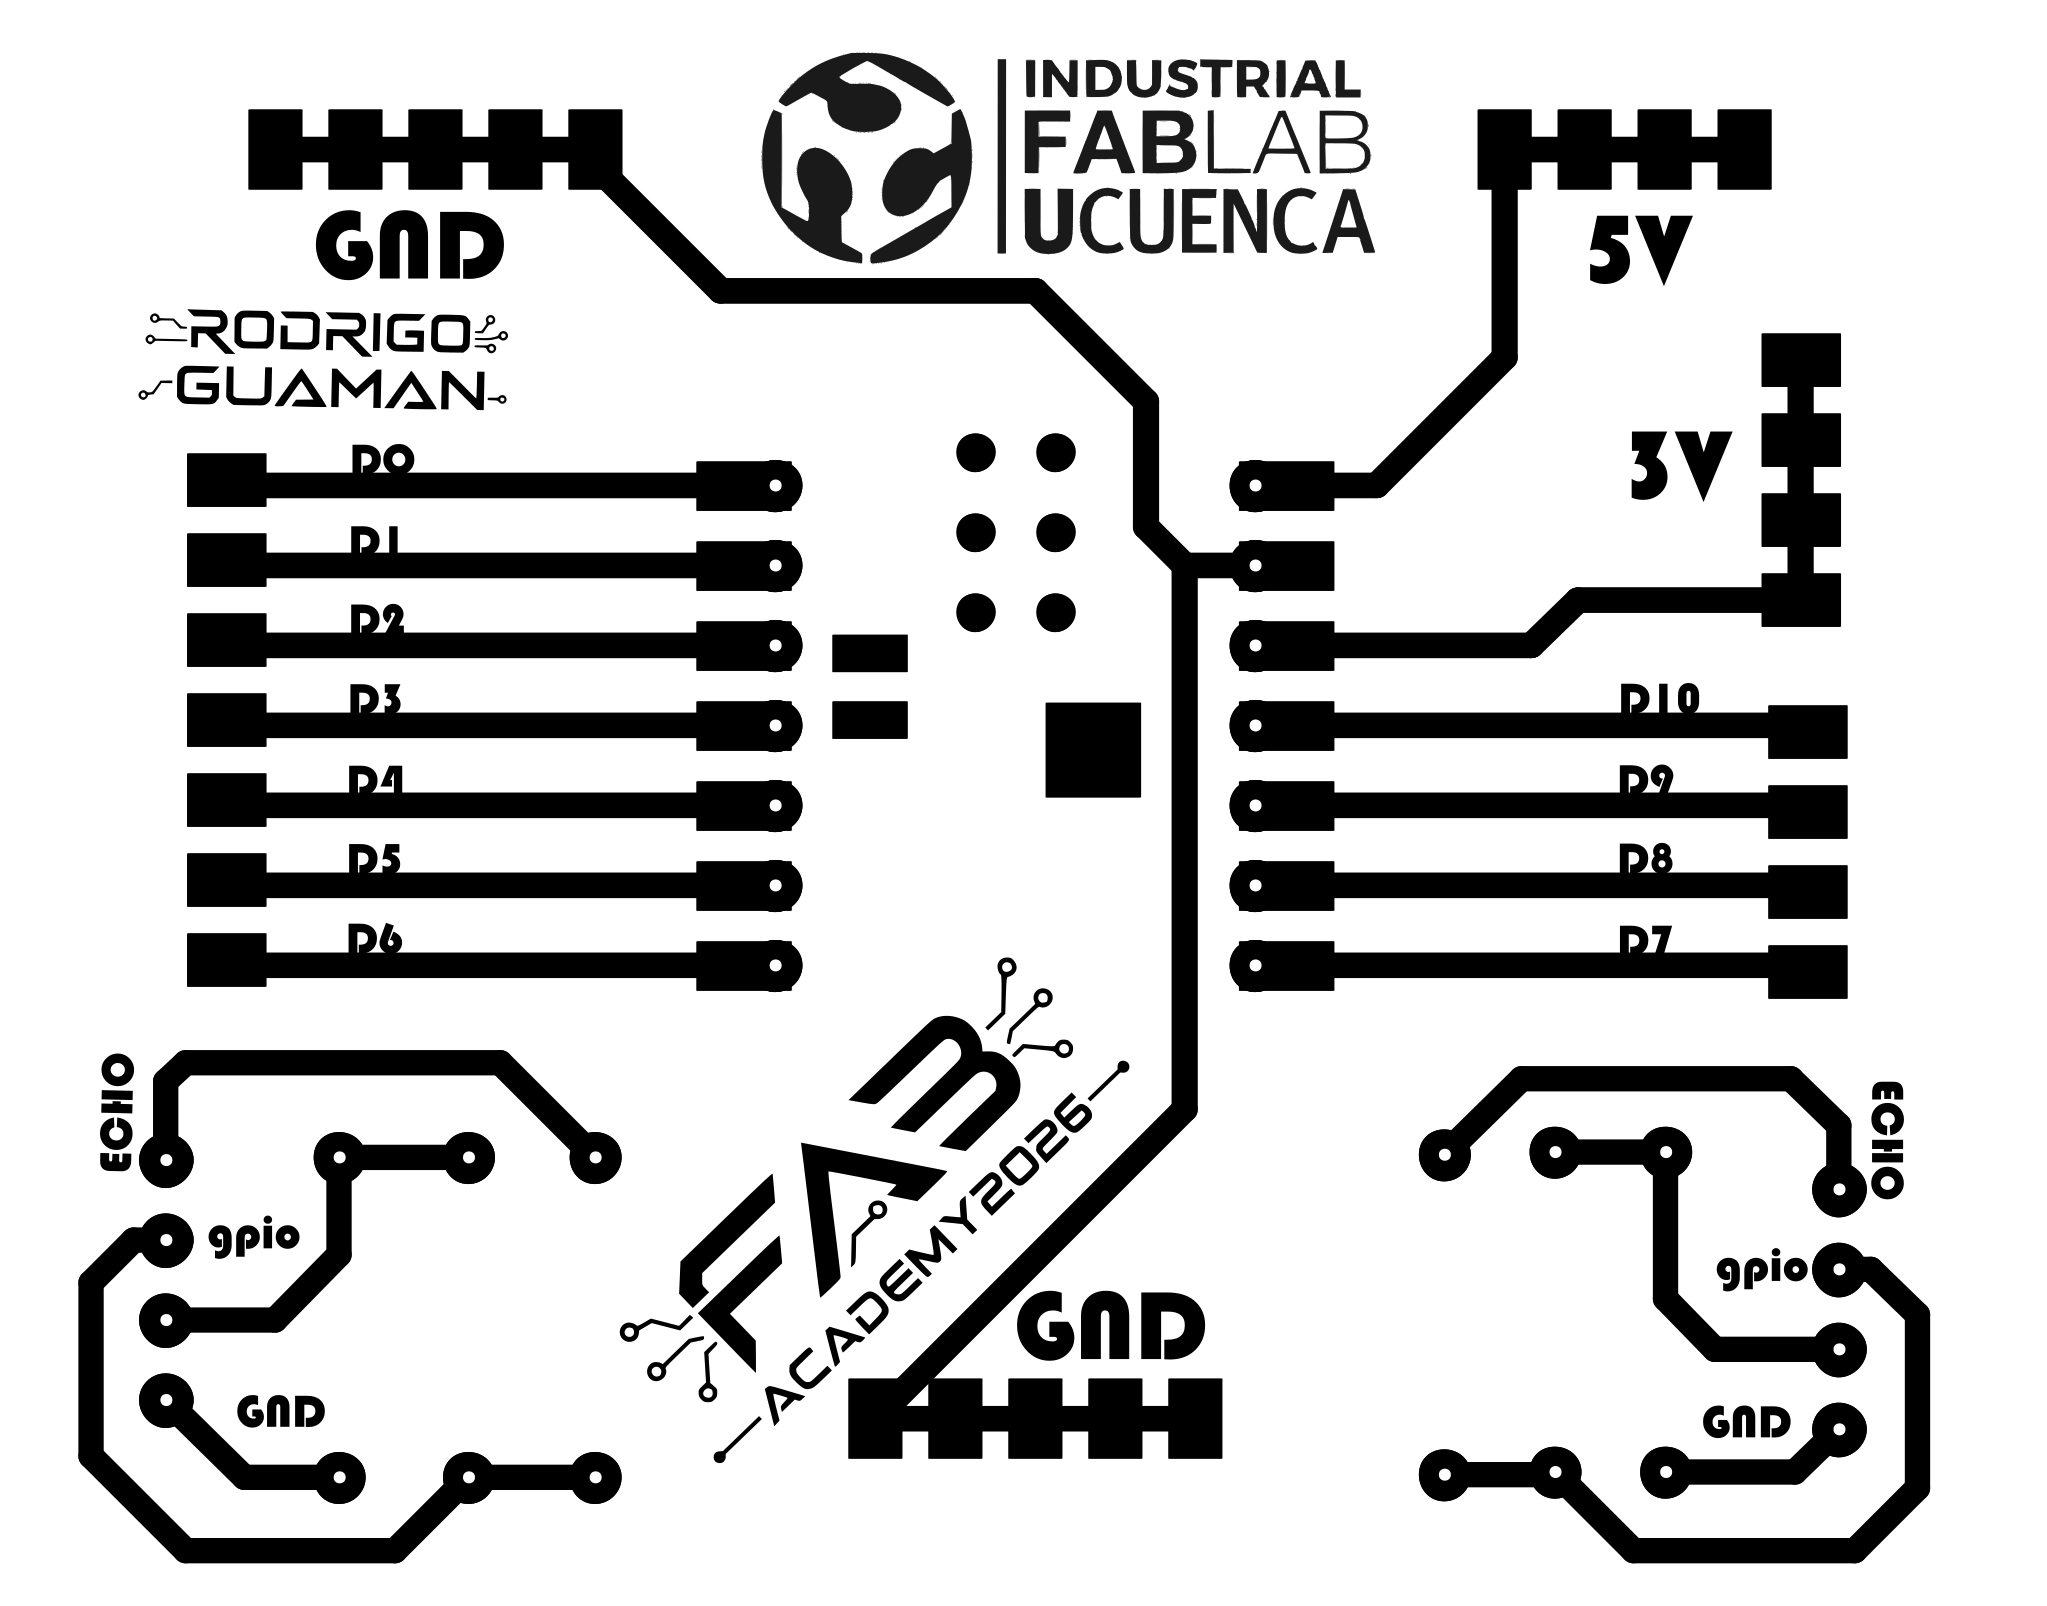
I used the generic board made in the previous input/output work as the electronic base for the interface assignment. The XIAO ESP32-C3 was soldered to the board and the HC-SR04 ultrasonic sensor was connected to the available pins. Since the HC-SR04 echo signal can return 5 V, I used a resistor voltage divider before connecting the echo line to the ESP32-C3 input pin.
| HC-SR04 | XIAO ESP32-C3 / PCB |
|---|---|
| VCC | 5V |
| GND | GND |
| TRIG | D5 |
| ECHO | D6 through voltage divider |
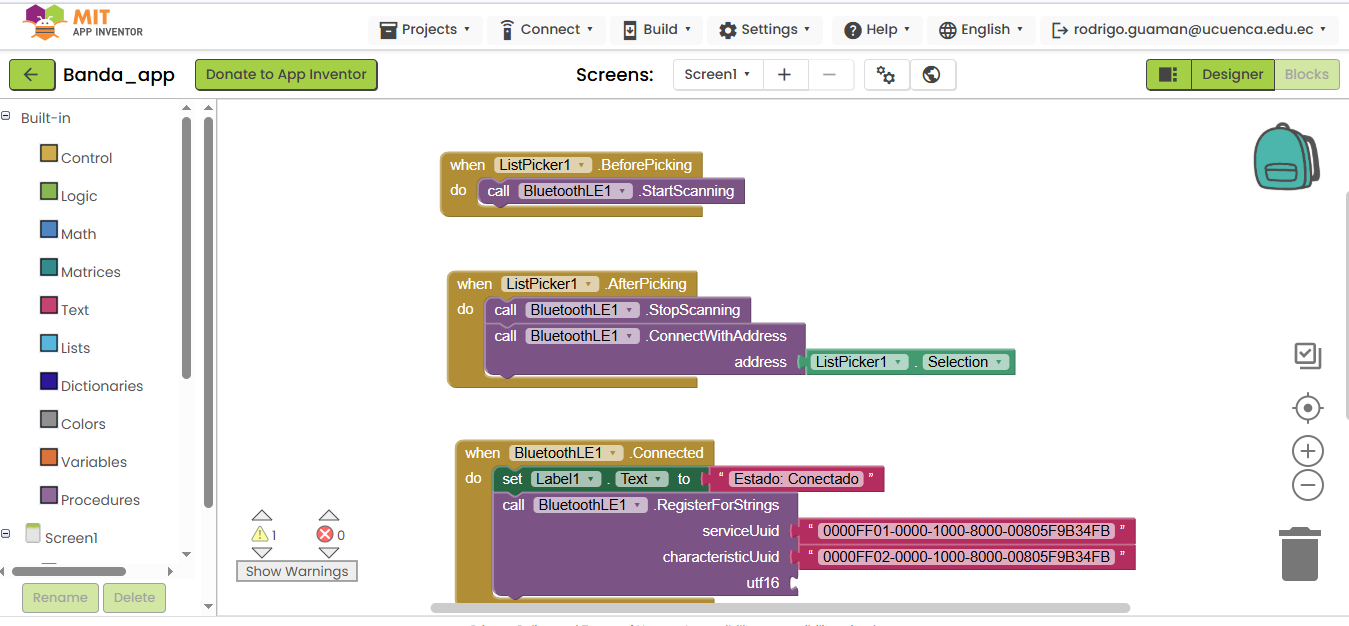
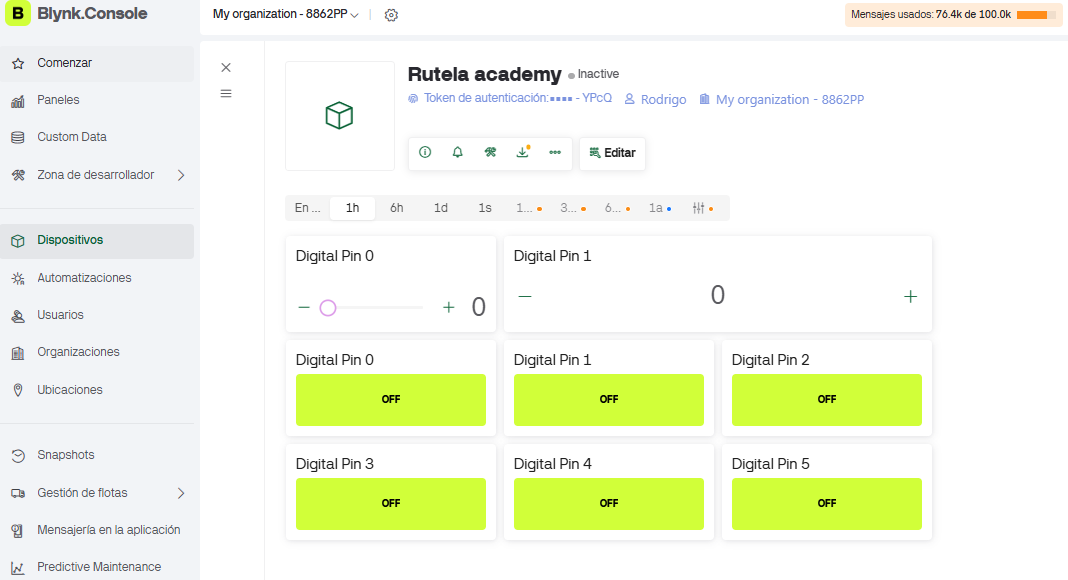
Before choosing the final interface platform, I compared two possible tools for the conveyor monitoring system: MIT App Inventor and Blynk. Both tools can be used to create interfaces for embedded systems, but they solve the problem in different ways. The comparison focused on dashboard creation, real-time data visualization, connection with the XIAO ESP32-C3, development time, and suitability for the final project.
MIT App Inventor is a strong option for building mobile applications with visual blocks, especially when the goal is to create buttons, labels, screens, and phone-based interactions. Blynk, on the other hand, is focused on IoT interfaces and already includes dashboard tools such as datastreams, charts, gauges, labels, switches, and device templates. For this assignment, the interface needed to behave more like an industrial monitoring dashboard than a conventional mobile app.
The following images document the interface environment of each program. App Inventor was evaluated through its block-based logic workspace, while Blynk was evaluated through its dashboard console with native widgets.
| Criteria | MIT App Inventor | Blynk |
|---|---|---|
| Main purpose | Mobile app creation using visual blocks and screen components. | IoT dashboard creation for connected devices and real-time data. |
| Dashboard widgets | Basic interface elements are available, but production-style dashboards usually require external services or custom logic. | Native widgets are available for labels, charts, gauges, buttons, switches, and live status values. |
| Real-time data | Possible, but it needs extra communication setup such as APIs, databases, MQTT, or other external tools. | Real-time values are handled directly through datastreams and virtual pins. |
| Connection with ESP32 | Requires additional communication design between the ESP32 and the app. | The ESP32 can connect directly using the Blynk library and authentication token. |
| Charts and indicators | Not native as an IoT dashboard workflow; chart visualization would need extra development. | Charts, gauges, labels, and device status are native dashboard elements. |
| Development speed | Fast for simple mobile screens, but slower for a complete cloud dashboard. | Faster for this project because the dashboard structure already exists. |
| Limitations | The interface would depend on external tools to store, process, or visualize dashboard data. | It depends on the Blynk platform and requires careful protection of authentication credentials. |
| Fit for this assignment | Good for learning app logic, but less direct for the required monitoring dashboard. | Strong fit because the project needs real-time conveyor monitoring, charts, status labels, and reset control. |
I decided to use Blynk because the assignment required an interface that could display live sensor values and process information without building a complete dashboard infrastructure from zero. In MIT App Inventor, I would have needed external tools to create the dashboard behavior, such as a database, web service, or communication layer for real-time visualization. Blynk already provides these dashboard functions natively.
| Reason | Impact on the Project |
|---|---|
| Native dashboard widgets | I could create labels, charts, gauges, and reset controls directly inside the platform. |
| Direct ESP32 integration | The XIAO ESP32-C3 can send values to the dashboard using the Blynk library and virtual pins. |
| Less external infrastructure | I did not need to build or connect a separate database, broker, or custom web dashboard. |
| Better fit for final project monitoring | The conveyor system needs distance, cycle count, cycle time, average time, process status, and reset control in one interface. |
Blynk was selected because it allows a fast IoT dashboard without building a complete web server from zero. The XIAO ESP32-C3 sends data to Blynk using virtual pins, and the web panel becomes the user interface.
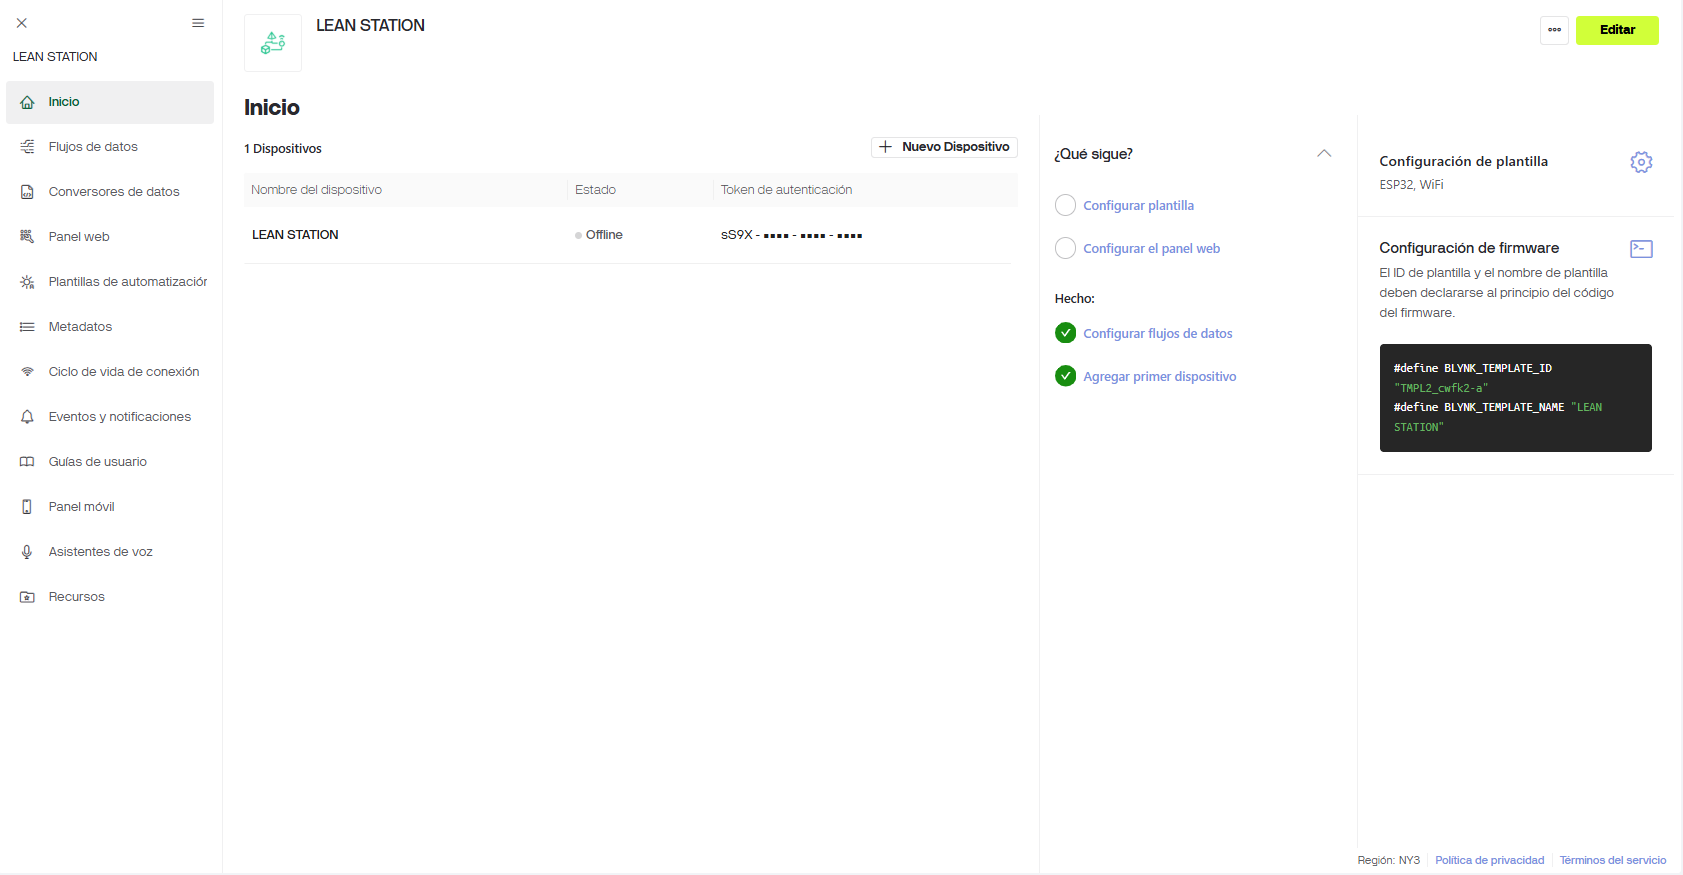
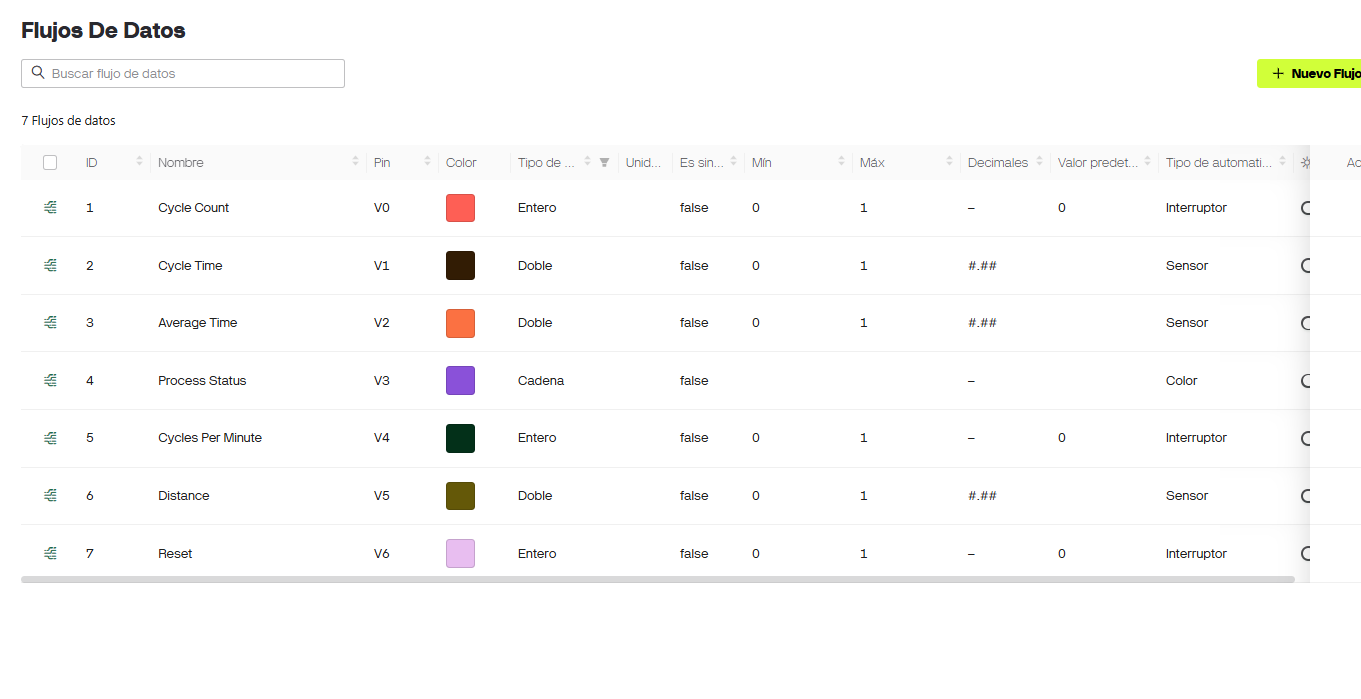
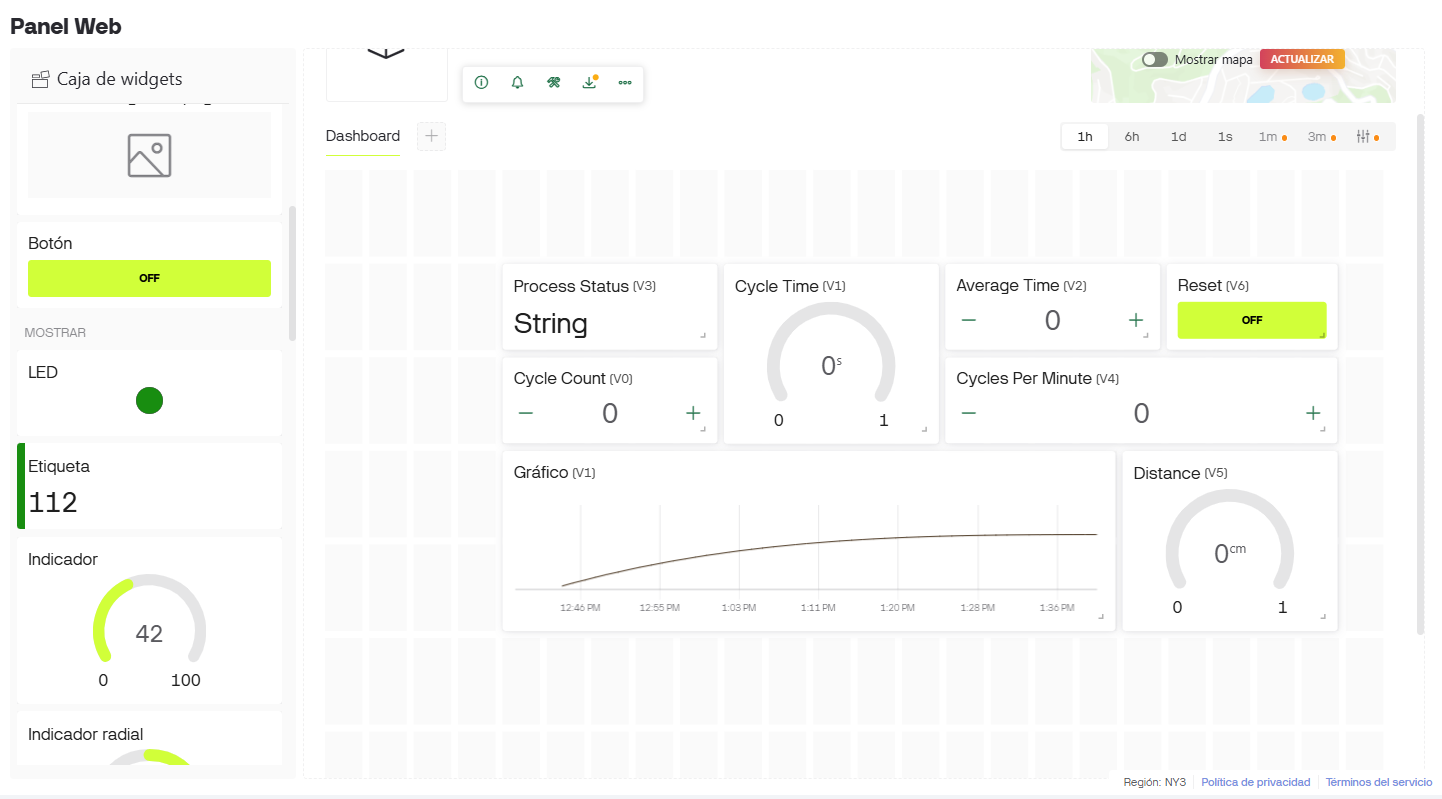
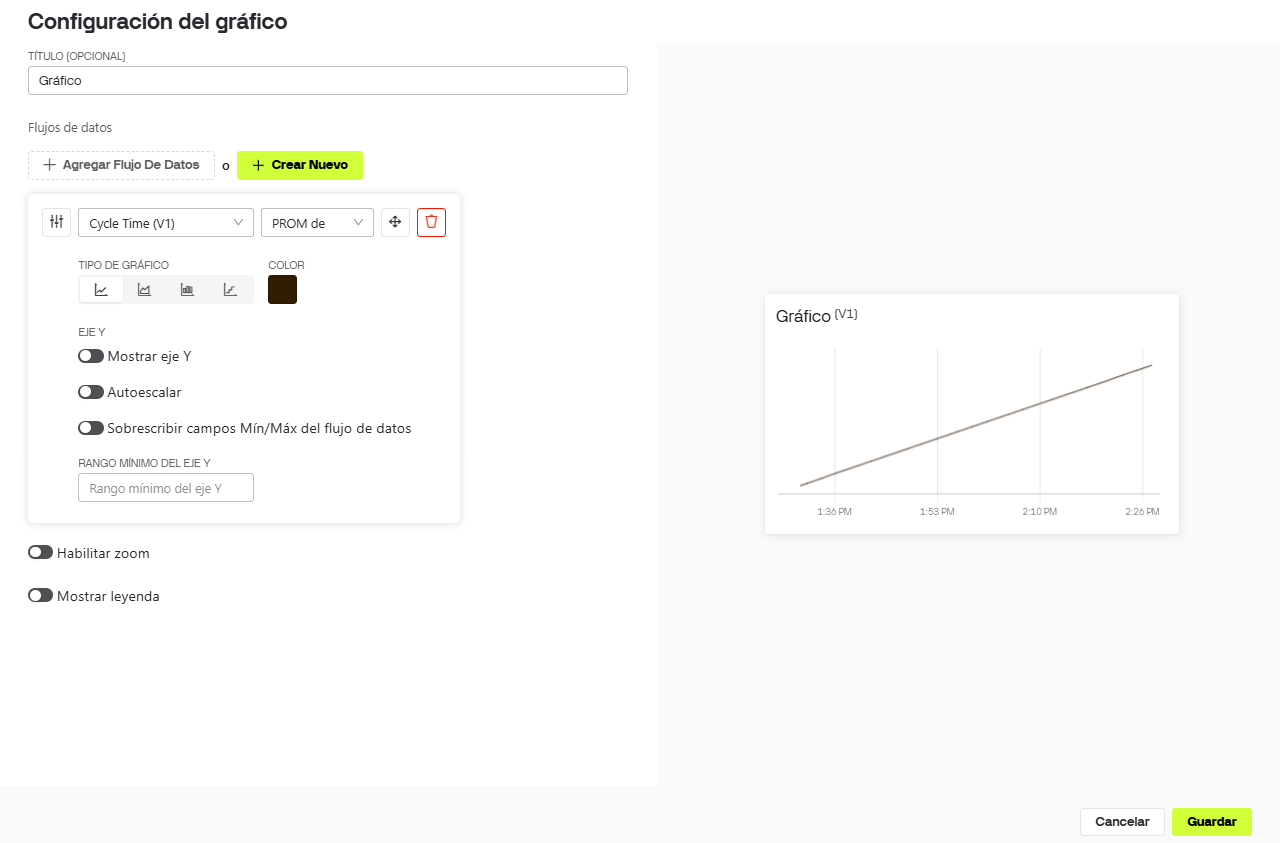
Each value from the firmware was mapped to a Blynk virtual pin. This structure made the interface easier to debug because each widget had a specific role in the monitoring system.
| Virtual Pin | Datastream | Purpose |
|---|---|---|
| V0 | Cycle Count | Total number of objects detected by the station. |
| V1 | Cycle Time | Time that an object remains in the sensor detection area. |
| V2 | Average Time | Average cycle time calculated from the detected cycles. |
| V3 | Process Status | Text status: Object detected, Area free, or Data reset. |
| V4 | Cycles Per Minute | Production rate calculated over a one-minute window. |
| V5 | Distance | Real-time distance measured by the HC-SR04. |
| V6 | Reset | Button used to clear counters and timing values from the dashboard. |
The firmware reads the ultrasonic sensor every 300 ms. When the measured distance is below the threshold, the system changes to Object detected and starts timing. When the object leaves the area, the program calculates the cycle time, updates the counter, sends the new values to Blynk, and changes the status to Area free.
#define BLYNK_TEMPLATE_ID "TMPL2_cwfk2-a"
#define BLYNK_TEMPLATE_NAME "LEAN STATION"
#define BLYNK_AUTH_TOKEN "PASTE_YOUR_BLYNK_AUTH_TOKEN_HERE"

#include <WiFi.h>
#include <BlynkSimpleEsp32.h>

#define TRIG_PIN D5
#define ECHO_PIN D6

float detectionThreshold = 15.0;

void monitorProcess() {
  distanceCM = readDistance();
  Blynk.virtualWrite(V5, distanceCM);

  objectDetected = distanceCM <= detectionThreshold;

  if (objectDetected && !previousState) {
    startTime = millis();
    Blynk.virtualWrite(V3, "Object detected");
  }

  if (!objectDetected && previousState) {
    cycleTime = (millis() - startTime) / 1000.0;
    cycleCount++;
    totalTime += cycleTime;
    averageTime = totalTime / cycleCount;

    Blynk.virtualWrite(V0, cycleCount);
    Blynk.virtualWrite(V1, cycleTime);
    Blynk.virtualWrite(V2, averageTime);
    Blynk.virtualWrite(V3, "Area free");
  }

  previousState = objectDetected;
}
The public code file uses placeholders for the WiFi credentials and Blynk token. This avoids publishing private access information while keeping the logic reproducible.
Firmware TXTThe program is divided into small sections so the interface logic is easier to understand and debug. The same code uploaded to the XIAO ESP32-C3 is available in the downloads section in Arduino IDE format and TXT format.
This block defines the Blynk template ID, template name, and authentication token. In the public version, the token and WiFi credentials are replaced with placeholders, so each user must paste their own values before uploading.
#define BLYNK_TEMPLATE_ID "TMPL2_cwfk2-a"
#define BLYNK_TEMPLATE_NAME "LEAN STATION"
#define BLYNK_AUTH_TOKEN "PASTE_YOUR_BLYNK_AUTH_TOKEN_HERE"

char ssid[] = "YOUR_WIFI_SSID";
char pass[] = "YOUR_WIFI_PASSWORD";The HC-SR04 trigger and echo pins are assigned to D5 and D6. The detection threshold defines the distance where an object is considered present in the conveyor belt sensing area.
#define TRIG_PIN D5
#define ECHO_PIN D6

float detectionThreshold = 15.0;
float distanceCM = 0;
bool objectDetected = false;
bool previousState = false;
The function sends the ultrasonic pulse, measures the return time with pulseIn(), and converts the
duration into centimeters. If no pulse is received, the function returns a large value to avoid a false detection.
float readDistance() {
  digitalWrite(TRIG_PIN, LOW);
  delayMicroseconds(2);
  digitalWrite(TRIG_PIN, HIGH);
  delayMicroseconds(10);
  digitalWrite(TRIG_PIN, LOW);

  long duration = pulseIn(ECHO_PIN, HIGH, 30000);
  if (duration == 0) return 999;

  return duration * 0.0343 / 2.0;
}The main monitoring function reads the distance, sends it to Blynk on V5, detects transitions between free area and object present, and calculates the cycle time when the object leaves the sensor area.
if (objectDetected == true && previousState == false) {
  startTime = millis();
  Blynk.virtualWrite(V3, "Object detected");
}

if (objectDetected == false && previousState == true) {
  cycleTime = (millis() - startTime) / 1000.0;
  cycleCount++;
  totalTime += cycleTime;
  averageTime = totalTime / cycleCount;

  Blynk.virtualWrite(V0, cycleCount);
  Blynk.virtualWrite(V1, cycleTime);
  Blynk.virtualWrite(V2, averageTime);
  Blynk.virtualWrite(V3, "Area free");
}The reset button uses virtual pin V6. When the button sends a value of 1, the counters and timing variables are cleared and the dashboard values are updated.
BLYNK_WRITE(V6) {
  if (param.asInt() == 1) {
    cycleCount = 0;
    cyclesPerMinute = 0;
    totalTime = 0;
    averageTime = 0;
    cycleTime = 0;
    Blynk.virtualWrite(V3, "Data reset");
  }
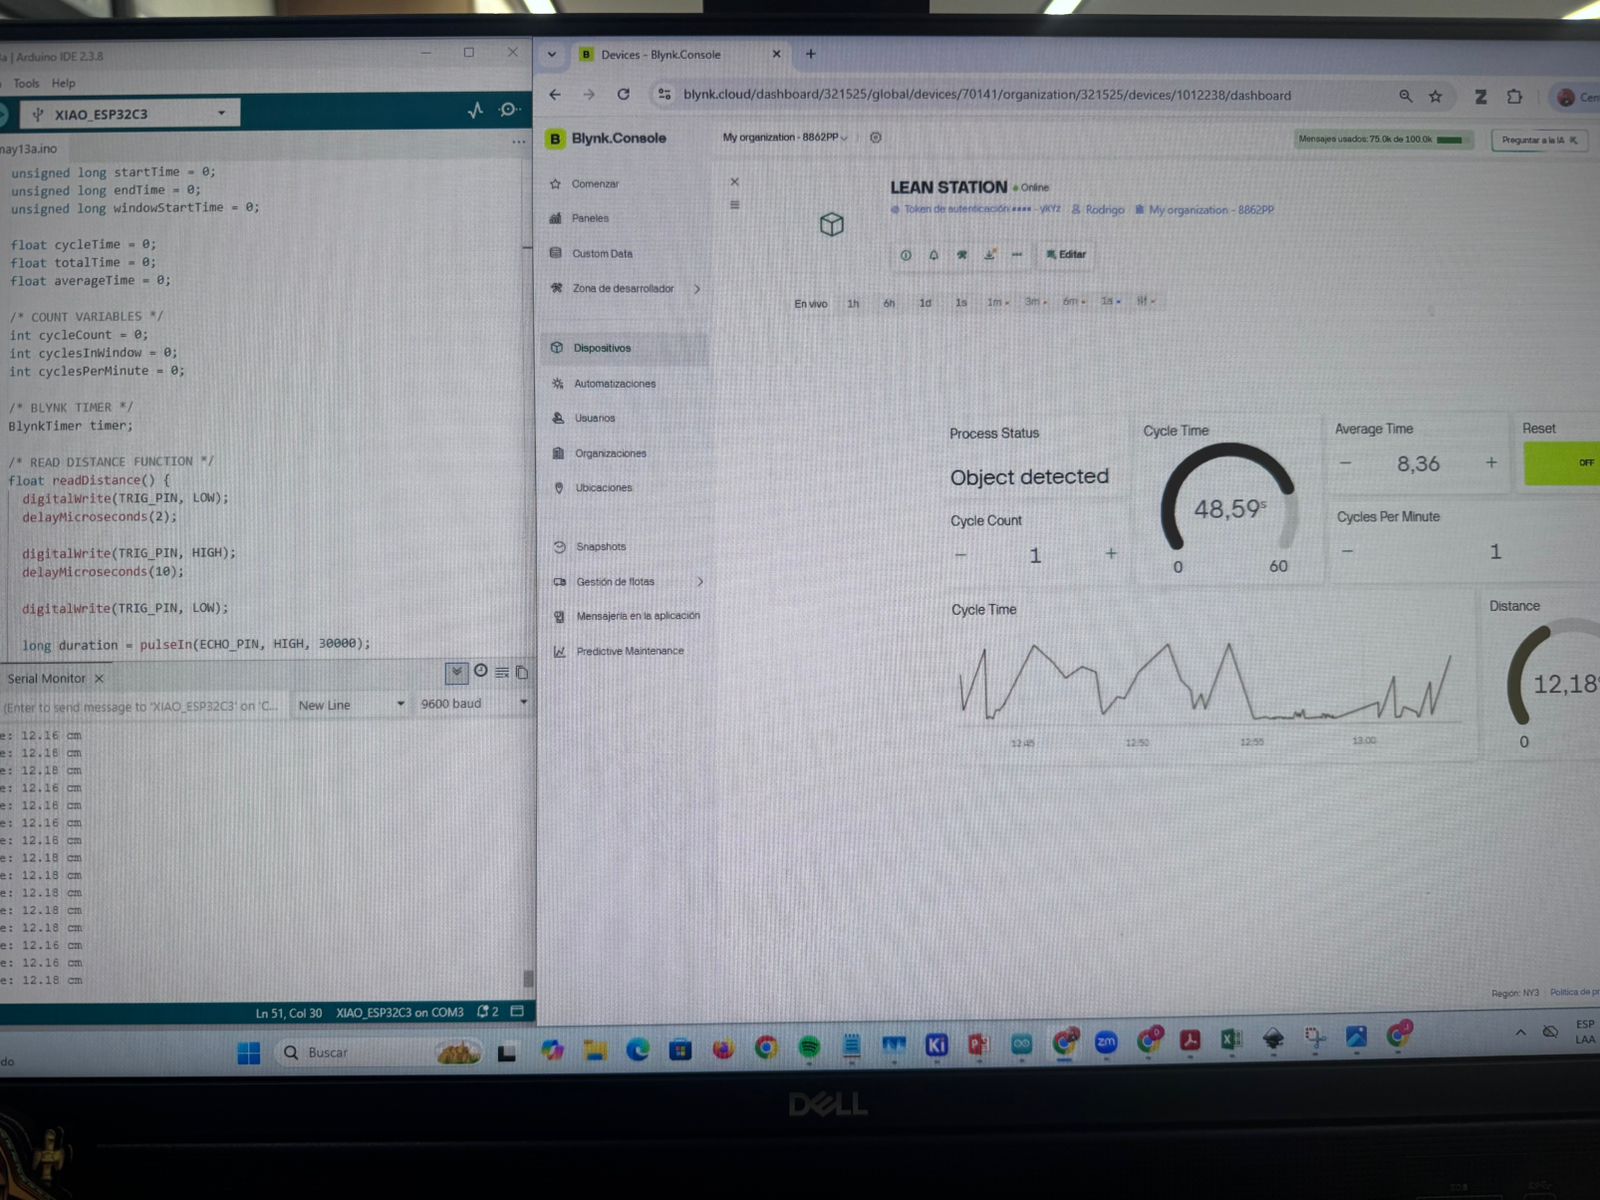
}After uploading the firmware, I verified the readings in the Arduino Serial Monitor and compared them with the Blynk dashboard. When the ultrasonic sensor detected an object on the conveyor belt, the status changed to Object detected, the distance gauge updated, and the cycle measurements were plotted in the chart.
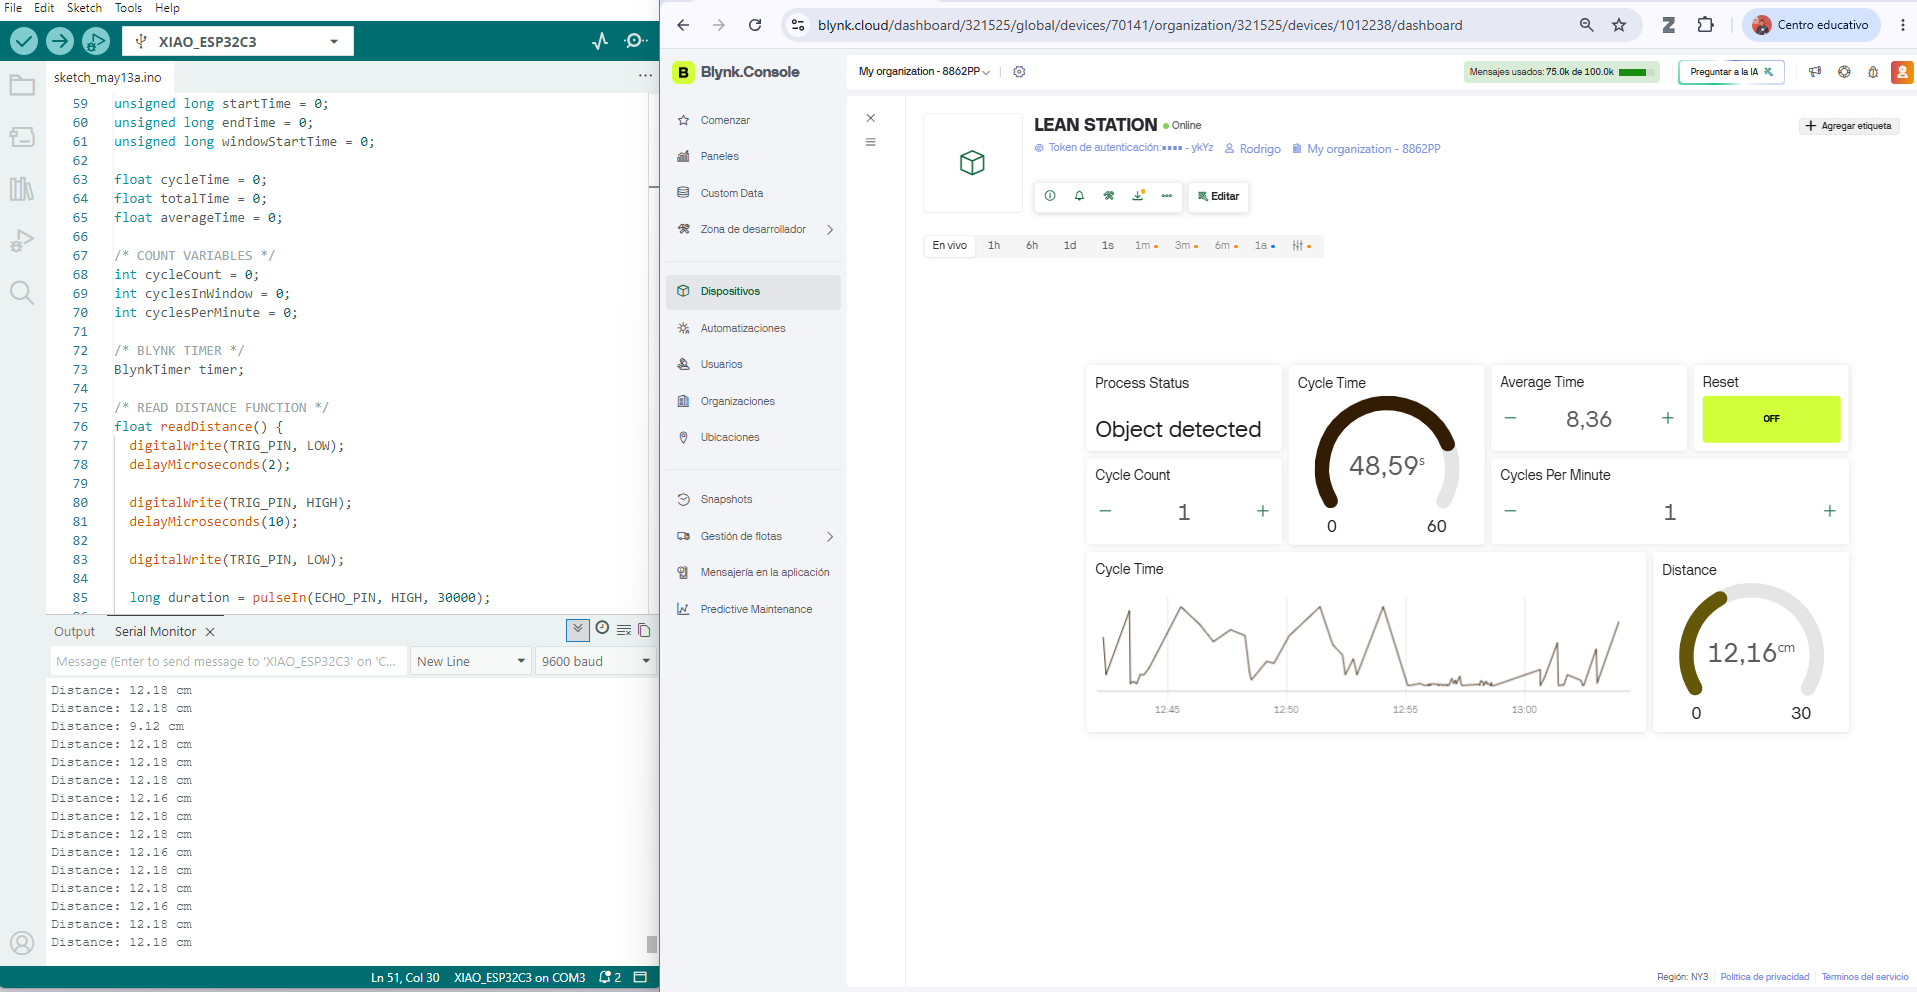
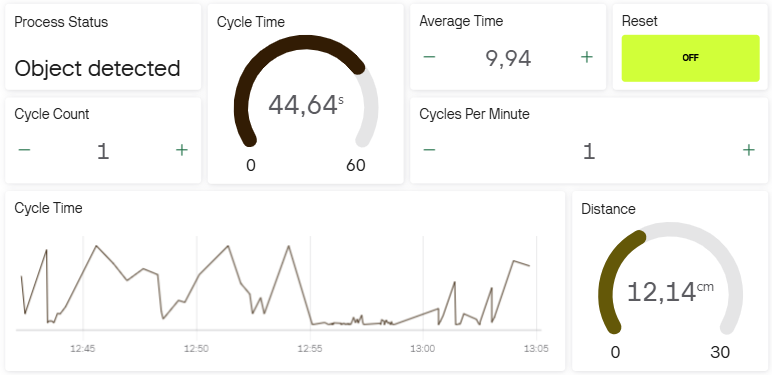
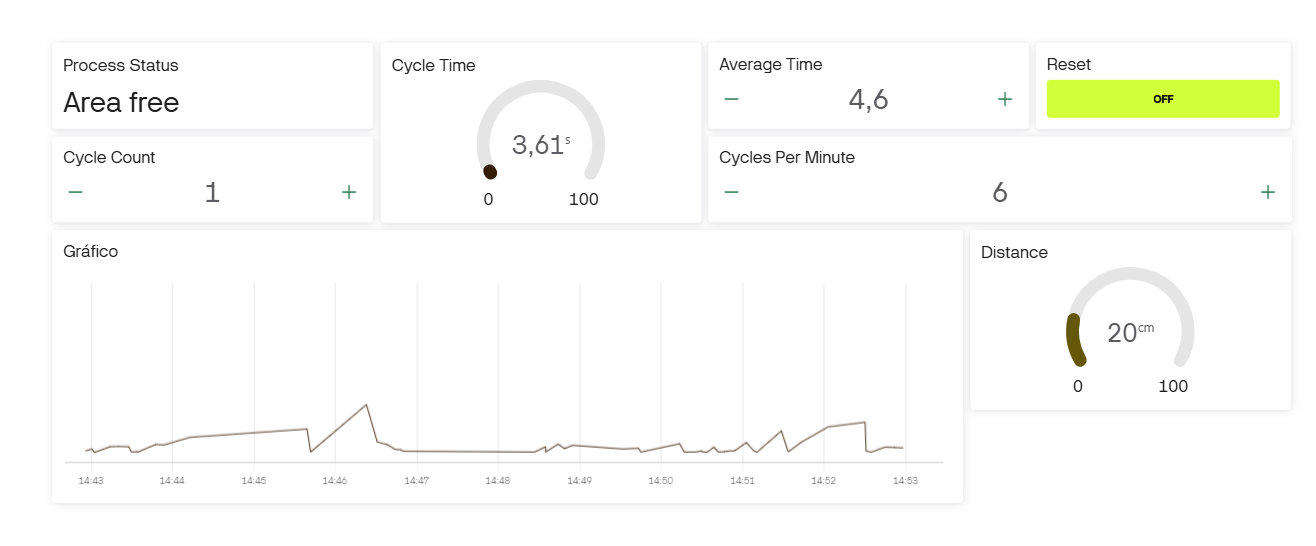
The final test connected the electronic interface to the conveyor belt. The ultrasonic sensor was positioned so it could detect an object passing over the belt. This connected the physical machine from the previous assignment with the application layer from this week.
The HC-SR04 sensor can output a 5 V echo signal, while the XIAO ESP32-C3 input pins work at 3.3 V logic. Connecting the echo pin directly could damage or stress the microcontroller input.
I used the generic PCB with a voltage divider so the echo signal is reduced before entering D6. This made the sensor safer to use with the ESP32-C3.
During testing, the ultrasonic distance changed quickly when the object was moving on the conveyor belt. This could create false readings or short detection events.
I used a detection threshold and detected only state transitions: when the object enters the area and when it leaves. This made the cycle count more reliable than counting every distance reading.
At first, some Blynk widgets did not show the expected information because each widget must be connected to the correct virtual pin and datastream type.
I organized the virtual pins from V0 to V6 and assigned one function to each datastream: counter, cycle time, average time, process status, cycles per minute, distance, and reset.
The working sketch contains a Blynk authentication token and WiFi credentials, which should not be published in a public Fab Academy page.
The downloadable files were prepared with placeholders for the private token and WiFi data. The logic remains the same, but the user must insert their own credentials before uploading.
These files document the application code and the generic PCB used to connect the XIAO ESP32-C3 with the ultrasonic sensor. The code files are provided in Arduino IDE format and TXT format.
The interface successfully connected the user with the conveyor belt sensing system. Blynk made it possible to see the process status, distance, cycle count, cycle time, average time, and cycles per minute from a web dashboard. The reset button also allowed the user to clear the measurements without reprogramming the board.
The most important learning was that the interface is part of the machine logic, not only a screen. The dashboard helped me understand the behavior of the sensor and made the conveyor process easier to evaluate. This same workflow can be expanded for the final project by adding more sensors, alerts, and control actions.