Smart Lean Cell
Gamified STEM Learning System for Lean, TPS and Optimization
1. Project Overview
Project Name: Smart Lean Cell
Type: Gamified STEM learning station for Lean Manufacturing and Toyota Production System principles.
Target Audience: Children and young learners who are beginning to explore STEM, making, digital fabrication and basic industrial engineering concepts.
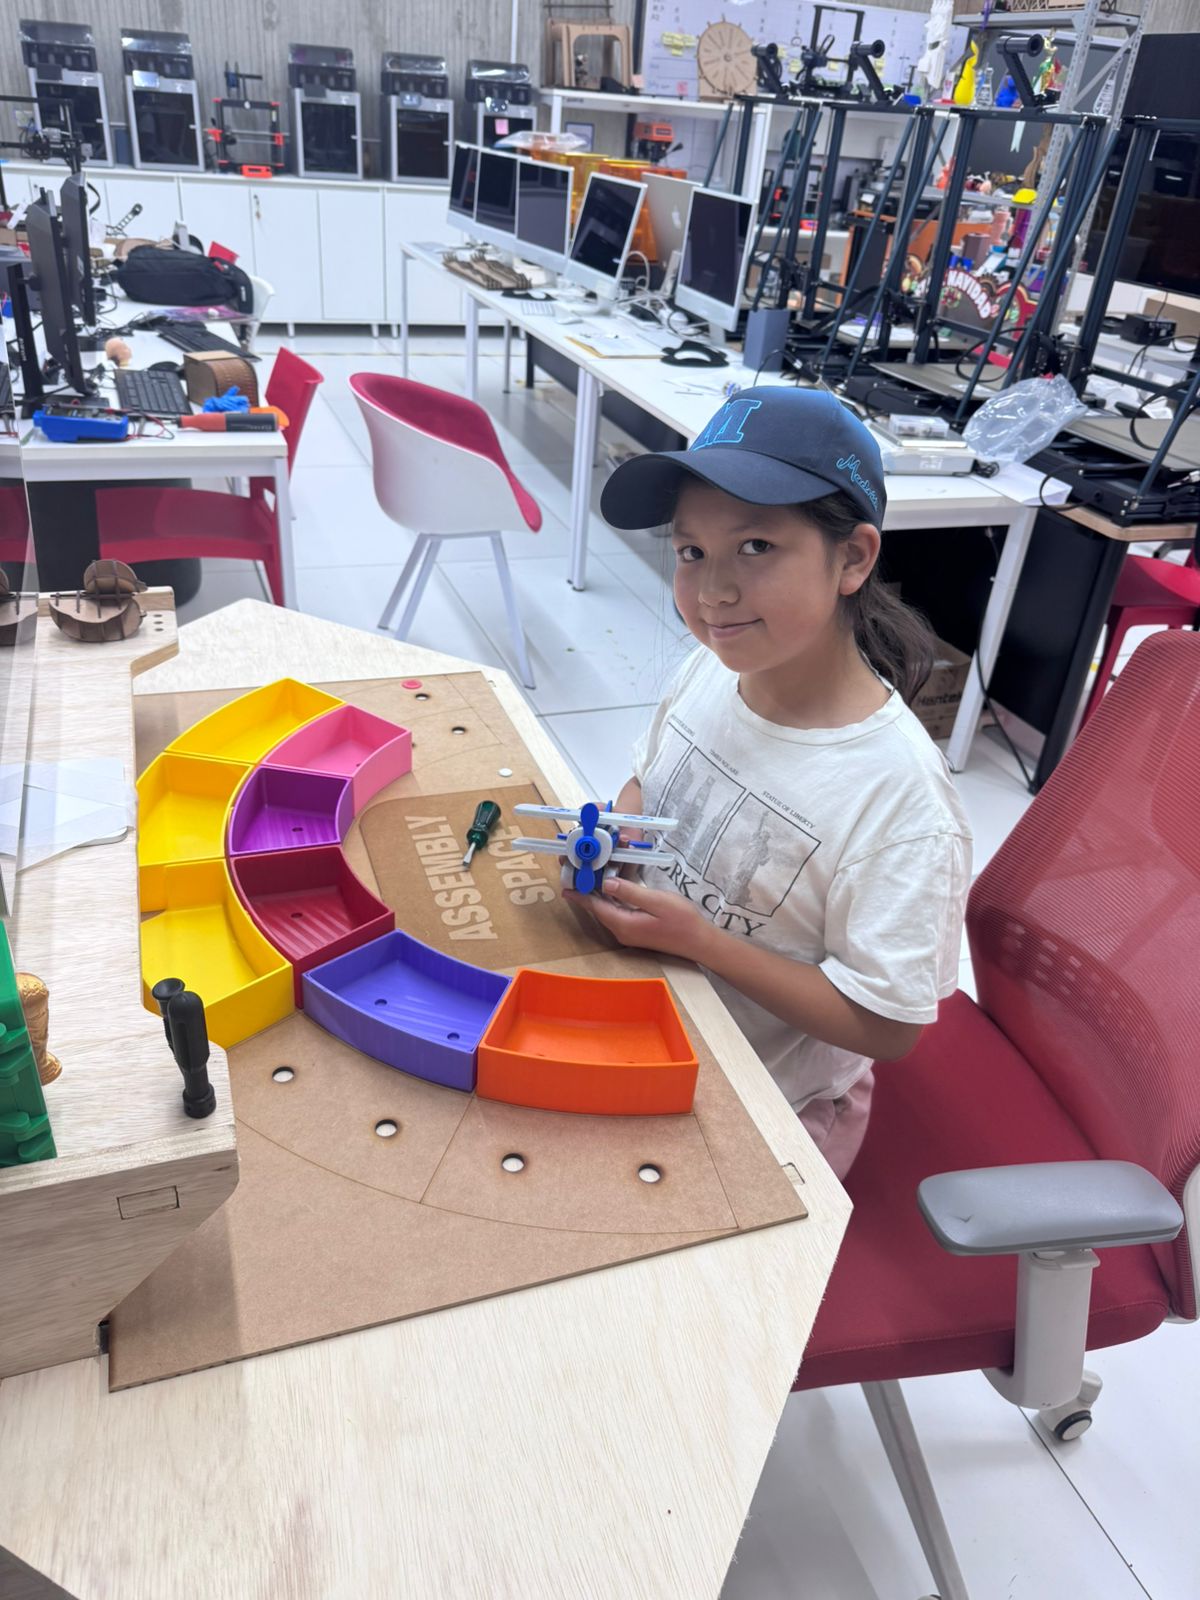
Smart Lean Cell is an educational prototype designed to introduce children to the logic of efficient production through play, assembly and real-time feedback. Instead of explaining Lean Manufacturing only as theory, the project turns the workstation into a hands-on challenge where children assemble a small product, observe visual signals, compare results and discover how organization, flow and continuous improvement affect performance.
The project is framed as a STEM experience because it combines science, technology, engineering and mathematics in one tangible activity. Children interact with fabricated parts, sensors, a custom electronic system, status LEDs and a digital dashboard. The purpose is not to train them as industrial operators, but to make complex ideas such as waste reduction, cycle time, standard work, visual management and optimization understandable through action.
The final presentation evidence, compliance checklist, institutional logos, summary slide and one-minute video are available in the dedicated Final Project Presentation page.
Open Final Project Presentation Open Presentation Slide Open Presentation Video| Project Element | Role in the Learning Experience |
|---|---|
| Assembly station | Provides a physical environment where children can build, test and improve a process. |
| Component bins | Introduce 5S, organization and visual management through color-coded storage areas. |
| HC-SR04 sensors | Detect inventory and finished parts to measure cycle time automatically. |
| Status LEDs | Translate process states into simple visual feedback for children. |
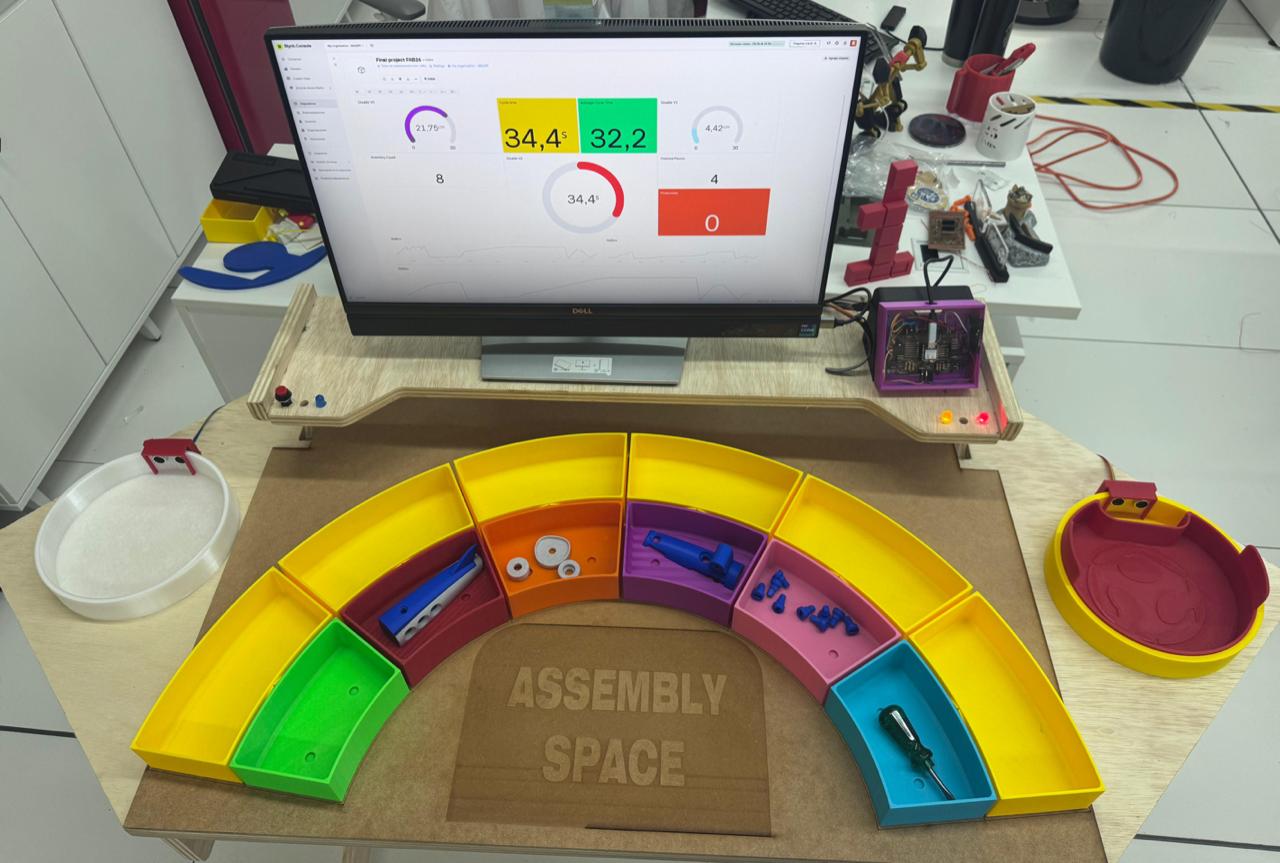
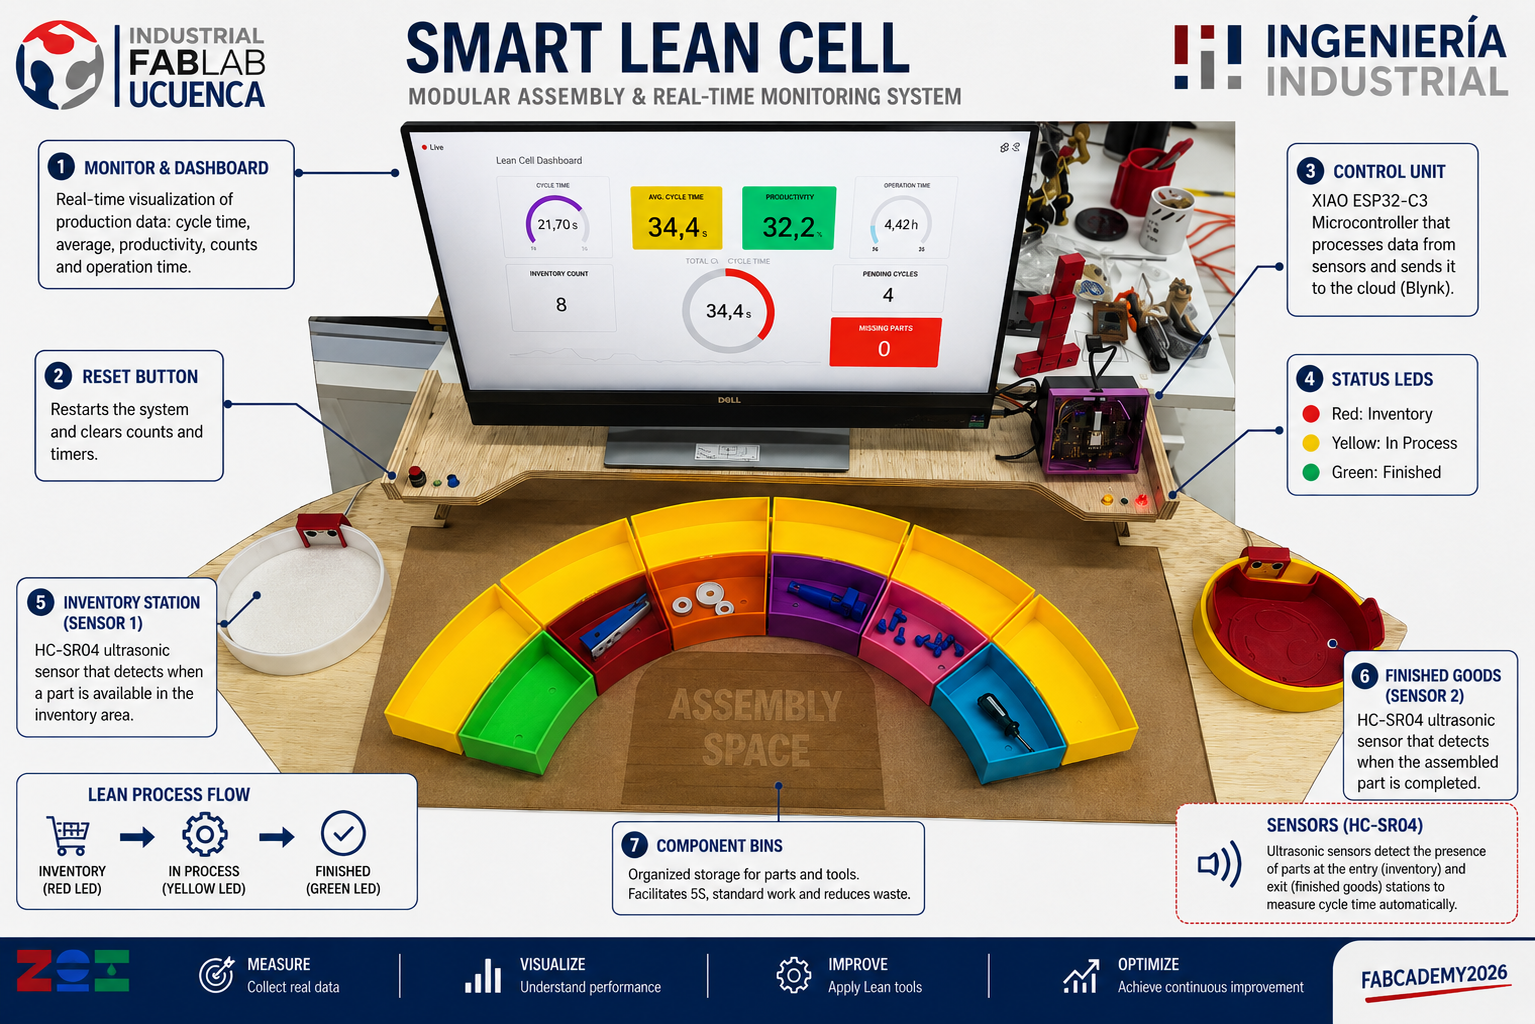
| Blynk dashboard | Shows distance, cycle time, average time, productivity and finished parts in real time. |
| Gamification levels | Guide learners from chaos to synchronization and finally to optimization. |
Extended Literature Review - Smart Lean Cell
1. TPS and Lean Manufacturing as Educational Content
The conceptual base of the project comes from the Toyota Production System (TPS) and Lean Manufacturing. TPS focuses on reducing waste, improving flow, using visual control and developing continuous improvement habits. In Smart Lean Cell, these principles are simplified into observable actions that children can understand: searching for parts takes time, disorganized work creates errors, and a better process can improve results without simply asking the user to work faster.
| Reference Concept | Meaning | Translation for Children |
|---|---|---|
| TPS | A production philosophy based on flow, respect for people and continuous improvement. | A challenge where the learner improves the way the work is done. |
| Lean Manufacturing | Eliminates activities that do not add value. | Find what slows the game down and improve it. |
| Kaizen | Small continuous improvements. | Try again, change one thing, and compare the result. |
| Visual Management | Uses visible signals to understand system status. | LED colors and dashboard values tell what is happening. |
2. STEM Learning Through Making
STEM education becomes stronger when children can touch, assemble, measure and reflect. The Smart Lean Cell uses digital fabrication and electronics as a learning bridge: children see that a fabricated object can become part of a measurable system. The station introduces engineering thinking through questions such as: Where should the parts be placed? What happens if the process is disorganized? How can we reduce movement? How do sensors measure time?
| STEM Area | Project Application |
|---|---|
| Science | Observation of cause and effect in motion, distance sensing and process behavior. |
| Technology | Use of sensors, microcontroller, WiFi dashboard and digital fabrication tools. |
| Engineering | Design of a workstation that solves a real learning and assembly problem. |
| Mathematics | Cycle time, averages, counts, trends and productivity indicators. |
3. Gamification as the Learning Strategy
Gamification is used to make Lean and TPS concepts accessible for children. The activity is divided into levels: first the learner experiences a disorganized process, then applies organization and standard work, and finally uses data to optimize the result. This progression transforms abstract industrial concepts into a game-like learning path with visible improvement.
| Gamification Element | Educational Purpose |
|---|---|
| Levels | Show the evolution from chaos to optimization. |
| Feedback | LEDs and dashboard values show immediate results. |
| Challenge | The learner tries to reduce cycle time and improve organization. |
| Progression | Each round introduces a stronger Lean principle. |
4. Industry 4.0 for a Child-Friendly Learning Context
The project also introduces Industry 4.0 ideas in a simple way. Children do not need to understand every technical detail of IoT or data analytics at the beginning; they can see that a physical action in the station changes a number on the screen. This creates a first connection between physical systems, embedded electronics, cloud dashboards and data-driven improvement.
| Industry 4.0 Concept | Smart Lean Cell Example |
|---|---|
| Cyber-physical system | The physical assembly station is connected to digital information. |
| IoT communication | The ESP32 sends data wirelessly to Blynk. |
| Real-time monitoring | The dashboard updates cycle time, average time and counters. |
| Data-driven decisions | Learners compare rounds and decide how to improve the process. |
Technical Glossary - Smart Lean Cell
| Term | Child-Friendly Explanation | Project Context |
|---|---|---|
| Lean Manufacturing | Making a process easier, cleaner and faster by removing waste. | The central learning idea. |
| TPS | A way of organizing work so people can improve it step by step. | The philosophy behind the three game levels. |
| Muda | Anything that uses time or effort but does not help finish the task. | Searching, waiting or moving too much during assembly. |
| 5S | A method to keep things sorted, ordered and easy to find. | Color bins and organized component areas. |
| Cycle Time | The time it takes to complete one assembly cycle. | Measured from inventory exit to finished-part detection. |
| Visual Management | Using colors, signs or lights to understand what is happening. | Status LEDs and dashboard widgets. |
| Kaizen | Improving a little each time. | Children compare rounds and try a better strategy. |
| Optimization | Finding a better way to do the same task. | The final level of the Lean Challenge. |
| Dashboard | A screen that shows what the system is measuring. | Blynk dashboard with cycle time, counts and productivity. |
| Sensor | An electronic component that detects something from the real world. | HC-SR04 sensors detect inventory and finished pieces. |
| PCB | A board that connects electronic components. | Custom control board for the final project. |
| Gamification | Using game elements to learn something serious in a fun way. | The strategy used to introduce Lean and TPS to children. |
2. Design Thinking Methodology - Smart Lean Cell
1. Empathize - Understanding Children as Learners
The first phase focused on understanding children and young learners as the primary users. The project needed to be safe, visual, modular and intuitive. The activity could not depend on advanced industrial vocabulary; it had to let children discover the meaning of Lean principles through movement, assembly and feedback.
| Variable | Description |
|---|---|
| Primary users | Children and young STEM learners. |
| Motivation | Play, build, compete with themselves and understand how a process improves. |
| Context | Fab Labs, schools, STEM workshops, maker spaces and outreach activities. |
| Main barrier | TPS, Lean and optimization are abstract concepts if they are only explained verbally. |
| Design response | Use color, sensors, dashboard values and gamified levels to make the concepts visible. |
2. Define - Framing the Educational Challenge
The core challenge was to design a physical system that introduces industrial engineering principles to children without making the experience feel like a lecture. The project had to convert TPS and Lean ideas into a playful sequence of actions where improvement could be seen and measured.
Problem statement: How might we create a gamified STEM station that helps children understand Lean, TPS and optimization by assembling, testing and improving a real process?
| Requirement | Design Decision |
|---|---|
| Accessible language | Use simple labels, color cues and observable actions. |
| Hands-on learning | Children assemble a product using physical components. |
| Measurable results | Sensors and dashboard calculate cycle time and production counters. |
| Progressive difficulty | The Lean Challenge moves from chaos to synchronization and optimization. |
3. Ideate - From Industrial Cell to Learning Game
Different ways of teaching Lean were considered: a digital-only simulation, a board game, a classroom explanation and a physical smart station. The Smart Lean Cell was selected because it combines the best parts of each approach: it is tangible like a game, measurable like an industrial system and open-ended like a STEM activity.
| Concept | Strength | Limitation |
|---|---|---|
| Classroom explanation | Easy to deliver | Low interaction for children. |
| Board game | Playful and simple | No real sensing or data feedback. |
| Digital simulation | Easy to repeat | No physical fabrication or assembly experience. |
| Smart Lean Cell | Physical, digital, measurable and gamified | Requires integrated fabrication and electronics. |
4. Prototype - Building the Learning System
The prototype was divided into modules so each part could be fabricated, tested and improved independently. This modular approach also helps children understand the station as a system: one area stores parts, another area is for assembly, sensors detect movement, electronics process information and the dashboard displays results.
| Module | Prototype Focus | Learning Objective |
|---|---|---|
| CNC assembly station | Ergonomics and structure | Create a stable and accessible workspace for children. |
| 3D printed bins | Color and organization | Introduce 5S and visual management. |
| Sensor stations | Inventory and finished-part detection | Connect physical movement with data. |
| Dashboard | Real-time indicators | Make optimization visible through numbers. |
| Gamification sequence | Three progressive levels | Guide children from disorder to improvement. |
5. Test - STEM Validation with Children
Testing focused on whether children could use the station, stay engaged and explain what improved between one level and the next. The project was evaluated by observing interaction, measuring cycle time and checking if the learner could identify concepts such as waste, order, flow and improvement after the activity.
| Indicator | Measurement | Goal |
|---|---|---|
| Engagement | Observation during the activity | The child wants to continue and try another round. |
| Concept understanding | Short explanation after the test | The child can describe why organization improved the result. |
| Cycle time | Dashboard data | The learner sees that process changes affect performance. |
| Usability | Interaction with bins, parts and sensor areas | The system is intuitive and safe for young users. |
3. Learning Product - Modular Assembly Kit
The product assembled inside the Smart Lean Cell is intentionally simple and modular. Its purpose is not to be a commercial product, but to act as a learning object that children can assemble repeatedly while comparing process conditions. This makes it possible to focus on Lean principles: where the parts are placed, how the sequence is followed and how the cycle time changes.
| Component | Fabrication / Source | Learning Function |
|---|---|---|
| Body or base part | Digital fabrication / prepared kit | Defines the main assembly reference. |
| Small components | 3D printed or fabricated pieces | Create a sequence that can be improved with organization. |
| Component bins | 3D printed colored modules | Teach 5S, sorting and visual management. |
| Inventory area | Sensor-monitored station | Starts the cycle when the part leaves inventory. |
| Finished area | Sensor-monitored station | Closes the cycle when the assembled part is completed. |
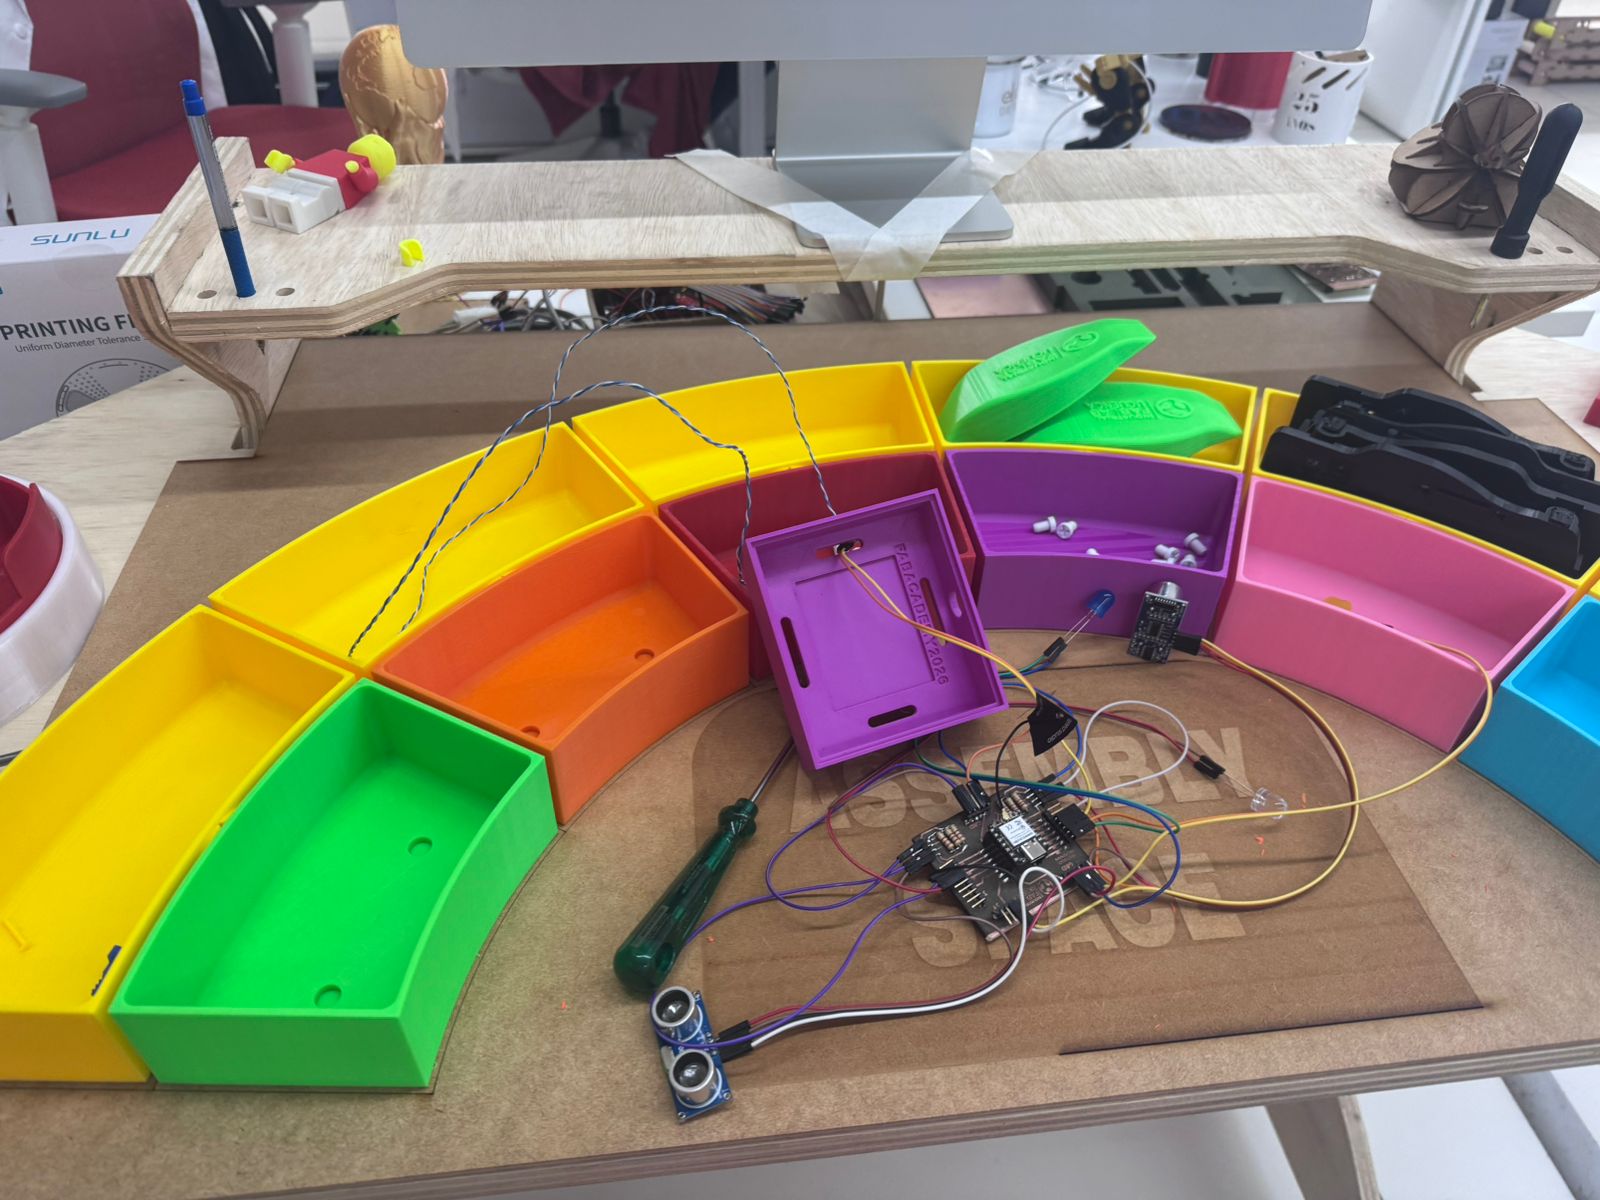
4. Smart Lean Cell Infrastructure
The infrastructure of the Smart Lean Cell was designed as a child-friendly assembly station. The workstation uses a modular layout with a CNC-fabricated base, organized component bins, sensor areas, a screen for the dashboard and a protected electronic control unit. The goal is to make the process readable: children can see where the work starts, where parts are stored, where assembly happens and where the finished product is detected.
- Assembly space: central area where the child performs the task.
- Component bins: color-coded modules that support 5S and visual management.
- Inventory station: Sensor 1 detects when a part is available or leaves the start area.
- Finished goods station: Sensor 2 detects when the assembled part is completed.
- Dashboard: displays performance indicators in real time.
- Control unit: contains the ESP32 PCB, wiring and status feedback.
This infrastructure supports the gamified STEM strategy: the child plays, assembles, observes data, reflects and tries to improve the process in the next round.
Prototyping - Assembly Station Based on TPS (Toyota Production System)
1. Bill of Materials (BOM) Design
The first step consisted in defining the Bill of Materials (BOM) for the assembly station. This stage is critical because it establishes all structural components required for fabrication and ensures modularity and scalability of the system.
The station is composed of:
- 2 lateral panels (main structural support)
- 5 crossbars (structural reinforcement)
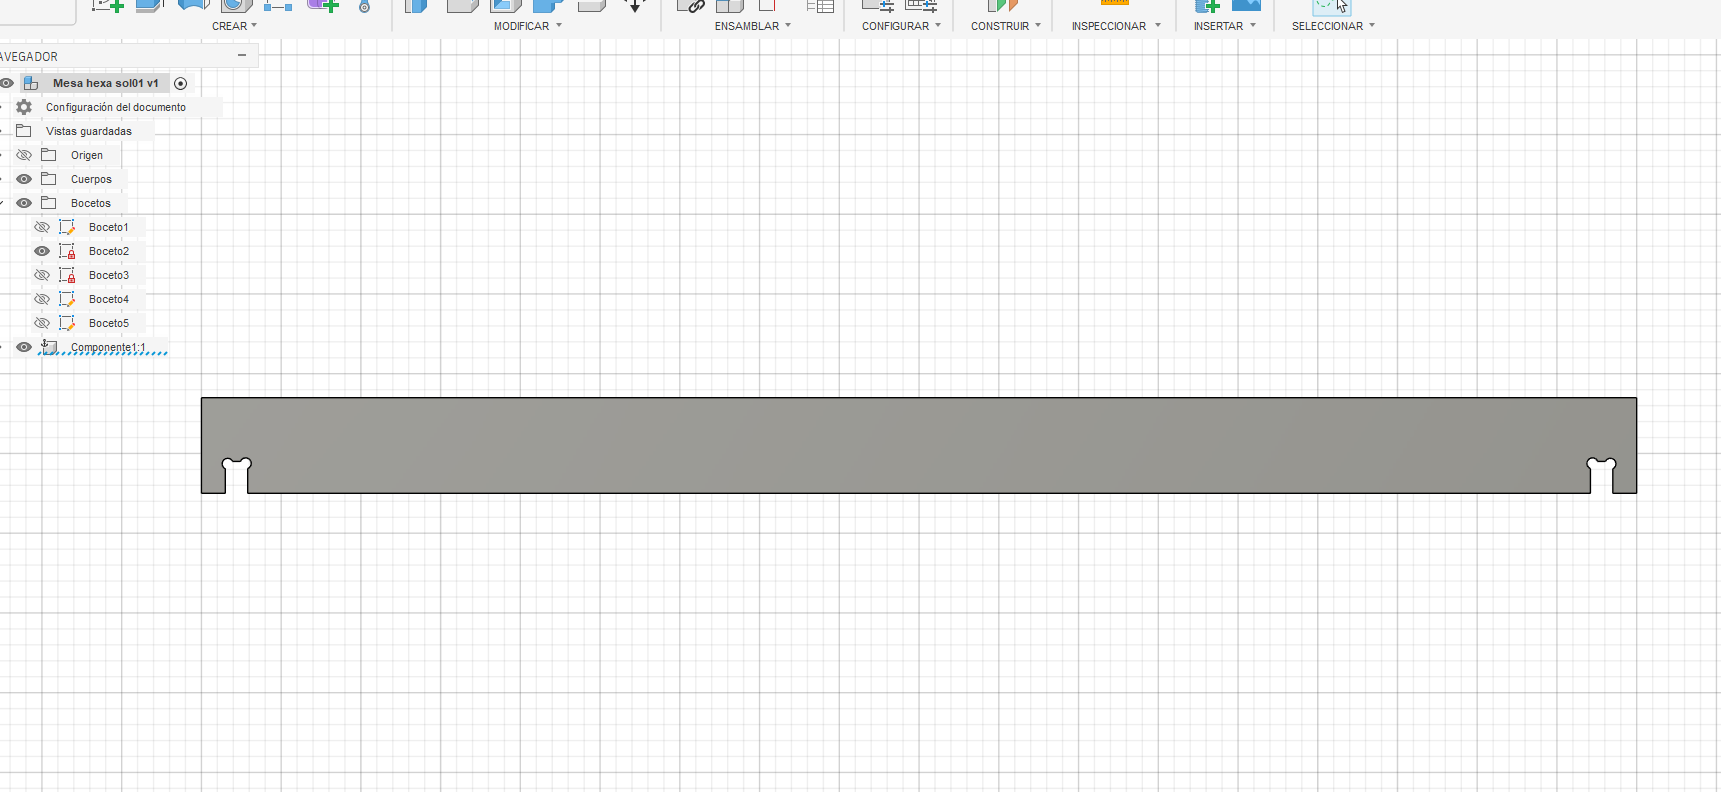
- 1 main working board (assembly surface)
- 1 upper board (support for conveyor system)
This definition follows TPS principles by organizing components to support an efficient, ergonomic, and sequential workflow.
General Bill of Materials - Smart LEAN Cell
The following table summarizes the main materials, components and services used to build the complete Smart LEAN Cell prototype. The cost was calculated using the real amount consumed when available and conservative market references for purchased elements.
| Item | Quantity / used amount | Source / origin | Smart LEAN Cell | Unit or used cost (USD) | Subtotal (USD) |
|---|---|---|---|---|---|
| Plywood board, 15 mm | 1 sheet, 122 x 244 cm | Local wood supplier / Industrial FabLab UCuenca stock | Main structural body of the workstation, CNC-machined support module and physical assembly surface. | $50 | $50 |
| MDF board, 3 mm | 1 panel, 60 x 90 cm | Local material supplier / FabLab stock; reference: 3 mm MDF board | Laser-cut physical organization panel and low-cost learning surfaces for visual management. | $5 | $5 |
| PLA filament | Approximately 2 kg | Bambu Lab / FabLab stock; reference: PLA filament | 3D printed Kanban trays, modular bins, inventory station, finished-goods station and sensor supports. | $40 | $40 |
| Seeed Studio XIAO ESP32-C3 | 1 unit | Seeed Studio / electronics supplier; reference: XIAO ESP32-C3 | Main microcontroller for reading sensors, controlling LEDs and sending data to the Blynk dashboard through Wi-Fi. | $25 | $25 |
| Custom PCB material | 1 board, 10 x 10 cm | FabLab stock; reference: copper-clad PCB board | Custom controller board for XIAO ESP32-C3, pin expansion, sensor wiring and voltage-divider integration. | $2.50 | $2.50 |
| HC-SR04 ultrasonic sensors | 2 units | Electronics supplier / lab stock; reference: HC-SR04 sensors | Sensor 1 detects inventory availability; Sensor 2 detects finished parts and closes the cycle-time measurement. | $5 | $10 |
| 220 ohm resistors | 6 units | Electronics stock; reference: resistor kit | Voltage divider and signal conditioning to adapt the HC-SR04 echo signal to the ESP32-C3 logic level. | $0.05 | $0.30 |
| LEDs | 3 units: red, yellow and green/blue status indicators | Electronics stock; reference: LED assortment | Visual feedback for inventory, in-process status and finished-piece detection during the learning activity. | $1 | $1 |
| Jumper wires and pin headers | 1 connection set | Electronics stock; reference: jumper wires and headers | Modular wiring between the PCB, sensors, LEDs, reset button and physical stations. | $5 | $5 |
| USB-C cable | 1 unit | Lab stock; reference: USB-C data cable | Programming, serial monitoring and power supply for the XIAO ESP32-C3 controller. | $5 | $5 |
| Push buttons | 1 set used | Electronics stock / panel mounting; reference: push buttons | User interaction and reset control for restarting counts, timers and dashboard values during demonstrations. | $4 | $4 |
| Sensor holders and small printed fixtures | Several small printed parts | 3D printed at FabLab; reference: PLA fixture material | Mechanical support for the ultrasonic sensors and small accessories used in the inventory and finished stations. | $1 | $1 |
| Blynk cloud dashboard | 1 simple license / monthly plan | Blynk web platform; reference: Blynk Starter pricing | Real-time visualization of cycle time, average time, productivity, inventory count and finished parts. | $29 | $29 |
| All-in-one PC for control and dashboard | 1 unit | Market reference; example: HP all-in-one desktop on Amazon | Local control, dashboard visualization, programming support and final demonstration monitor. | $490 | $490 |
| Acrylic sheet for PCB case cover | 1 piece, 15 x 15 cm | Local acrylic supplier / FabLab stock; reference: clear acrylic sheet | Transparent cover for the PCB case, allowing the electronic system to be visible and protected. | $2 | $2 |
| Total estimated material cost | Reference total calculated from the used quantity and the current market reference for purchased items. | $669.80 | |||
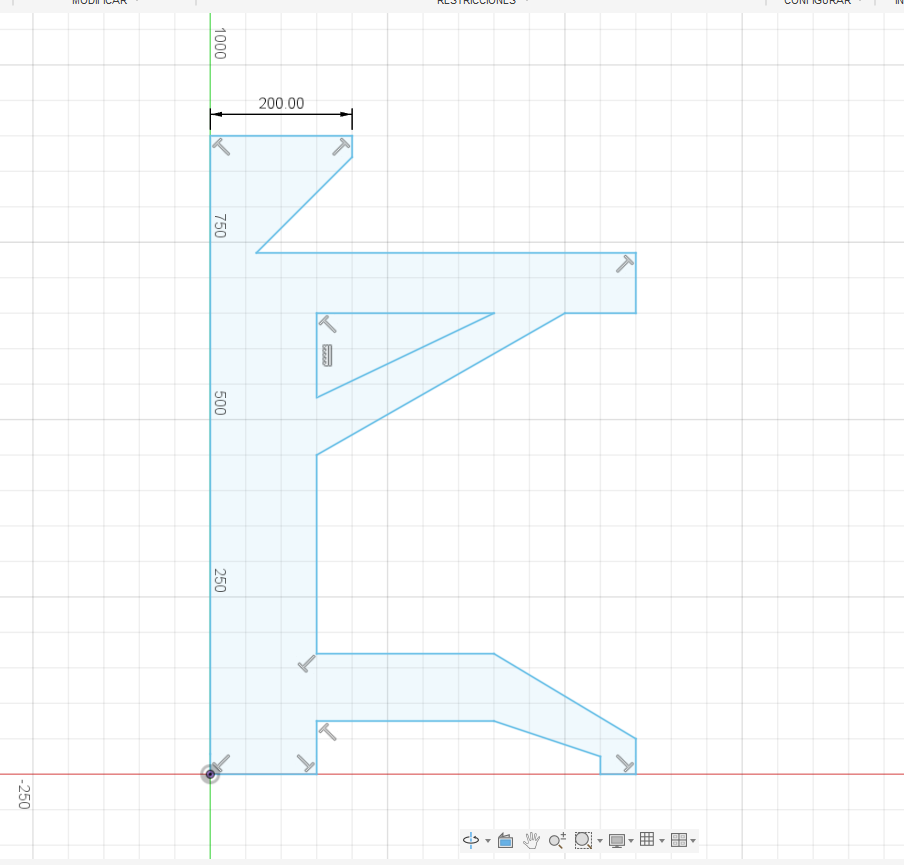
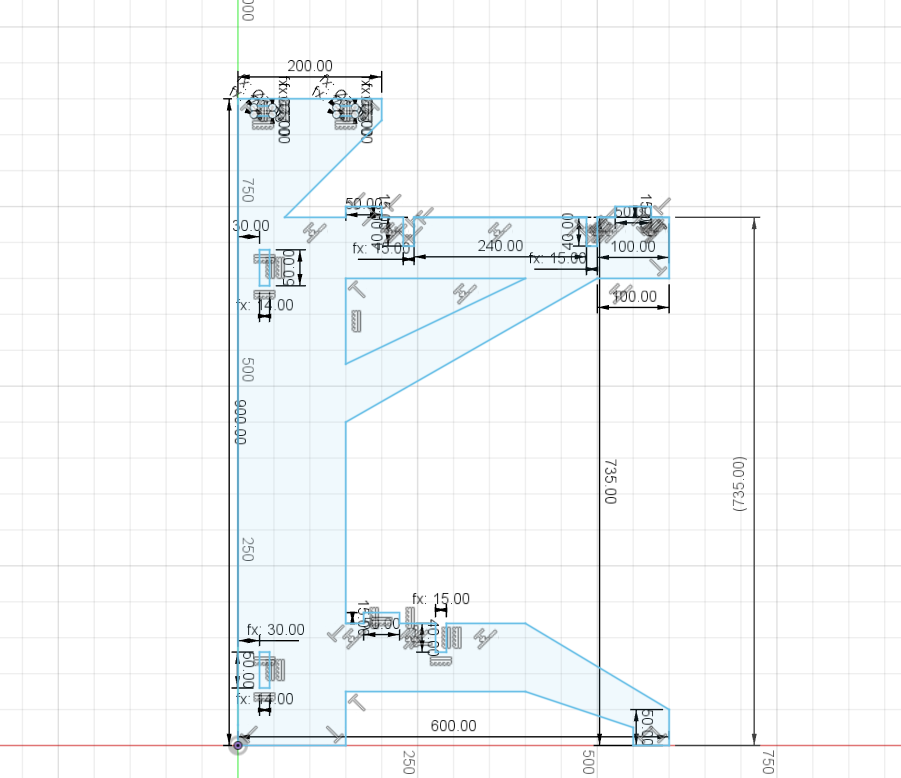
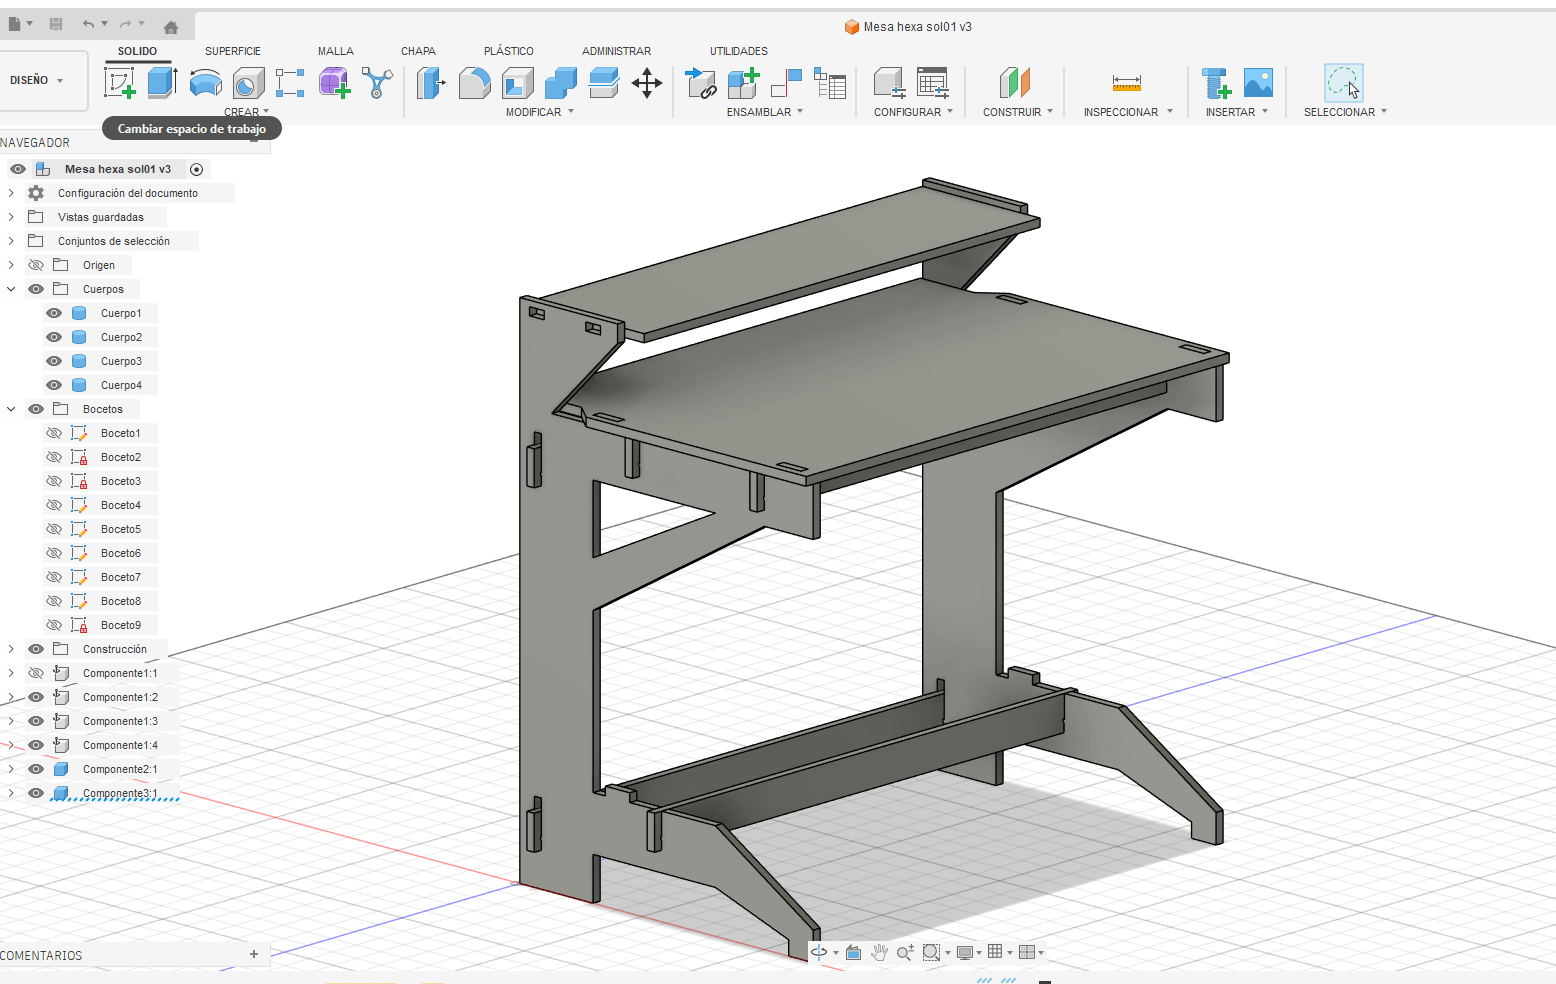
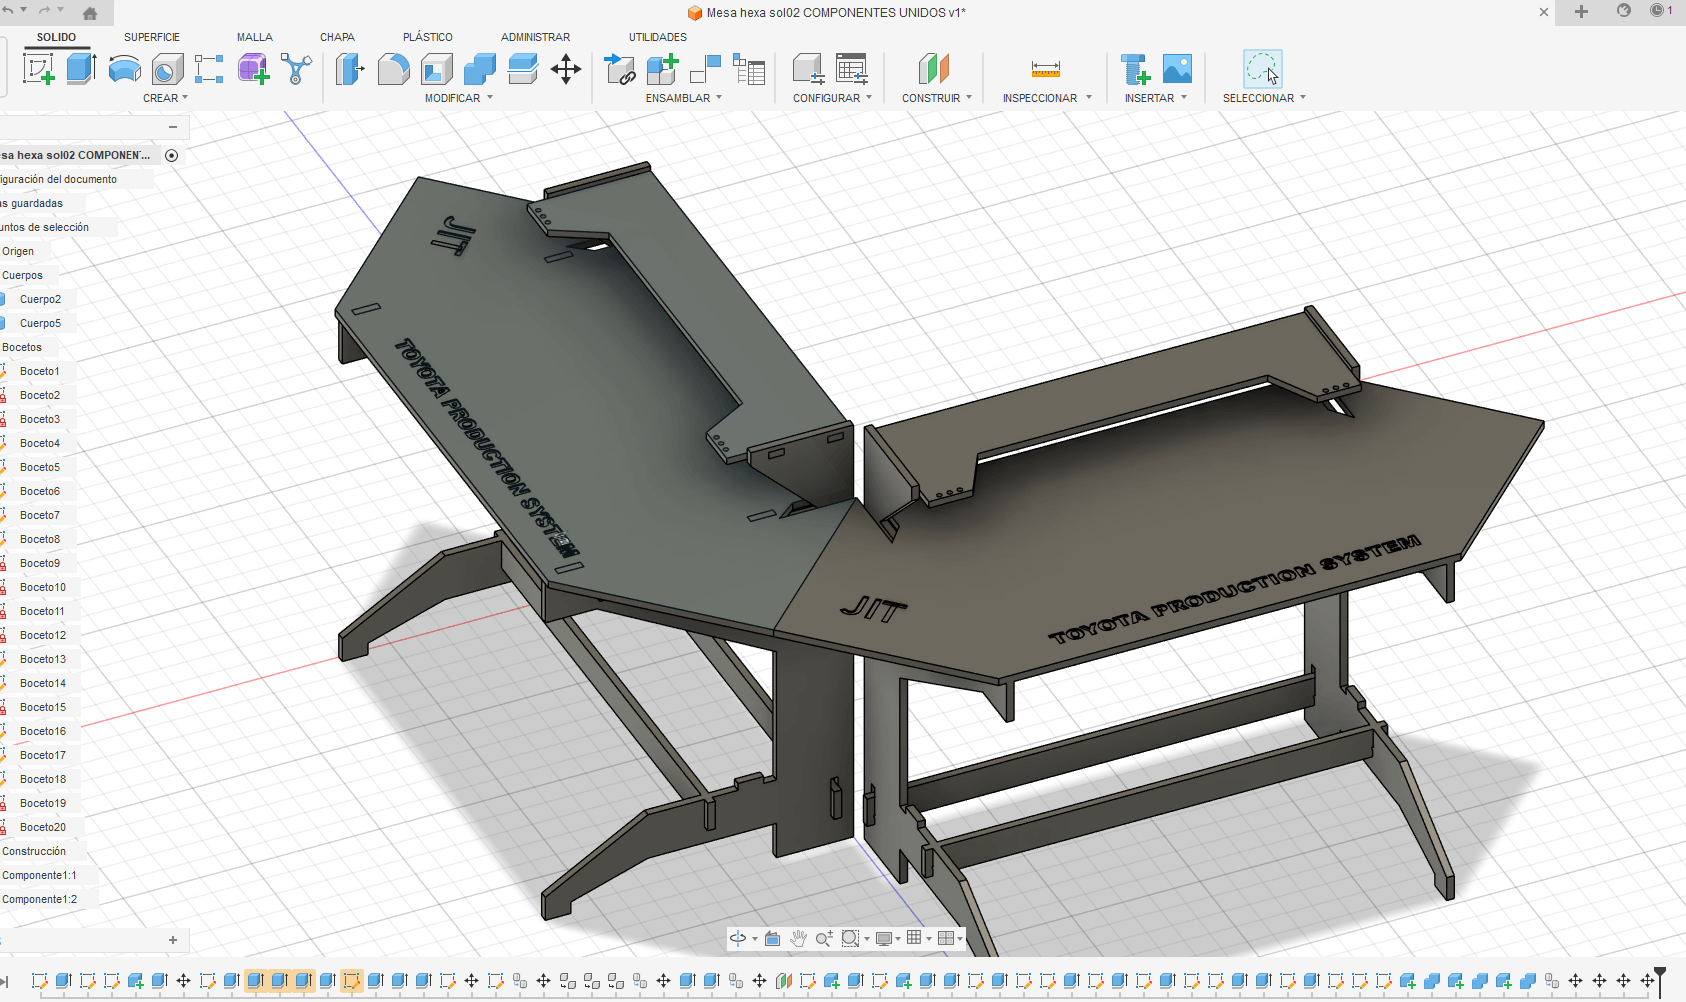
2. Parametric Design and Joinery Development
The structure was designed using parametric modeling in Fusion 360. This approach allows easy modification of dimensions and ensures adaptability of the design.
Key parameters such as material thickness, slot dimensions, and tolerances were defined to guarantee proper press-fit assembly.
Parametric modeling process:
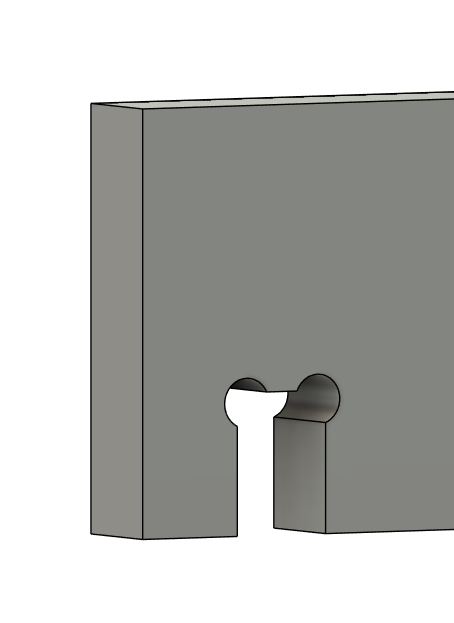
Next, press-fit joints were designed using "dog bone" geometry to compensate for CNC tool radius. This ensures proper fitting between parts.
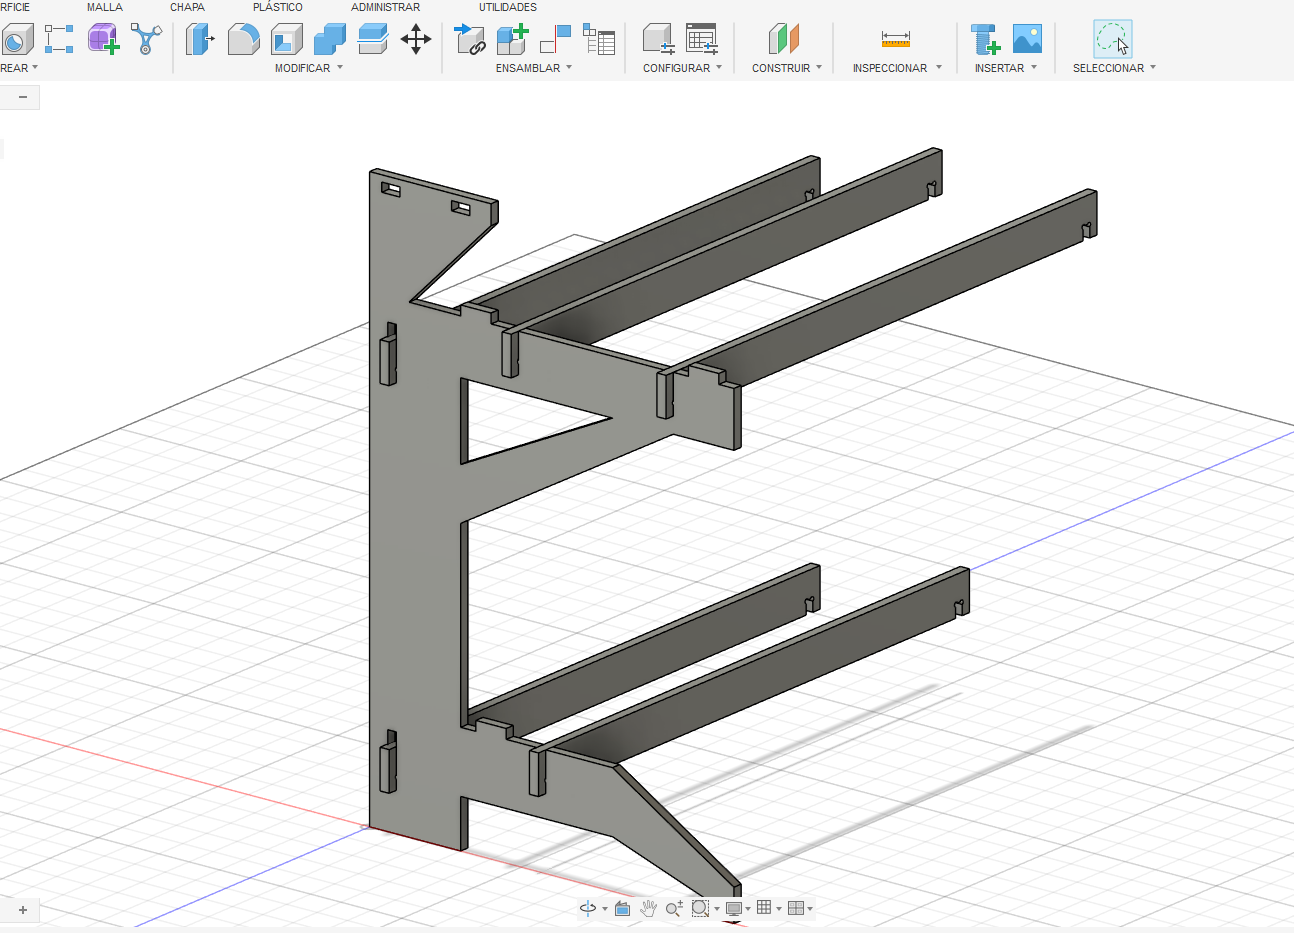
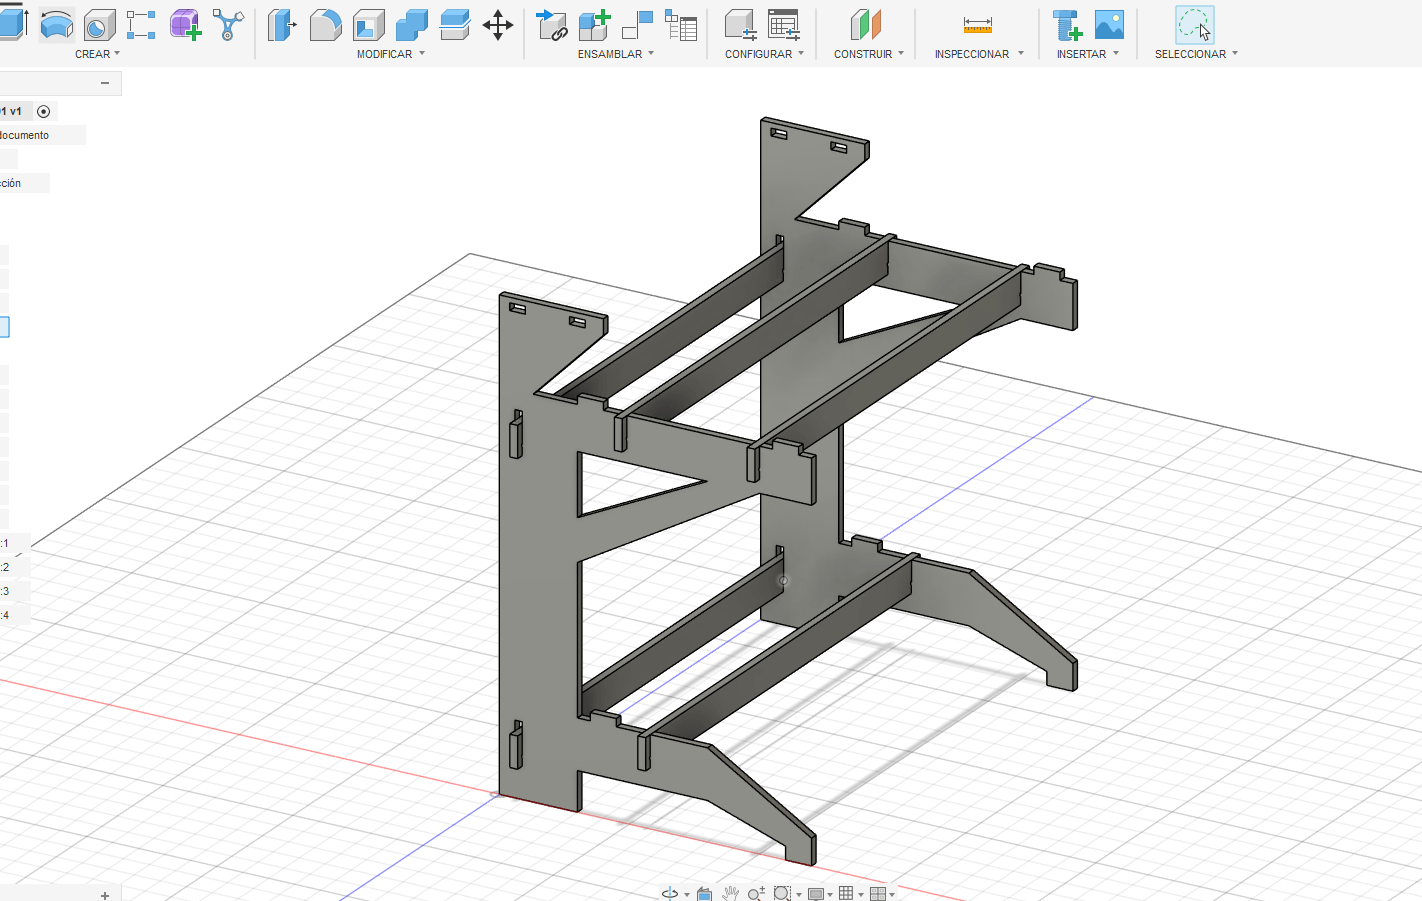
Additionally, lateral panels were modeled in 3D to validate structure, proportions, and assembly logic before fabrication.
3. Board Design and Component Assembly
The working surfaces (boards) were designed considering ergonomics and accessibility for the user during the assembly process.
The integration of structural components was validated through digital assembly, ensuring proper alignment and mechanical stability.
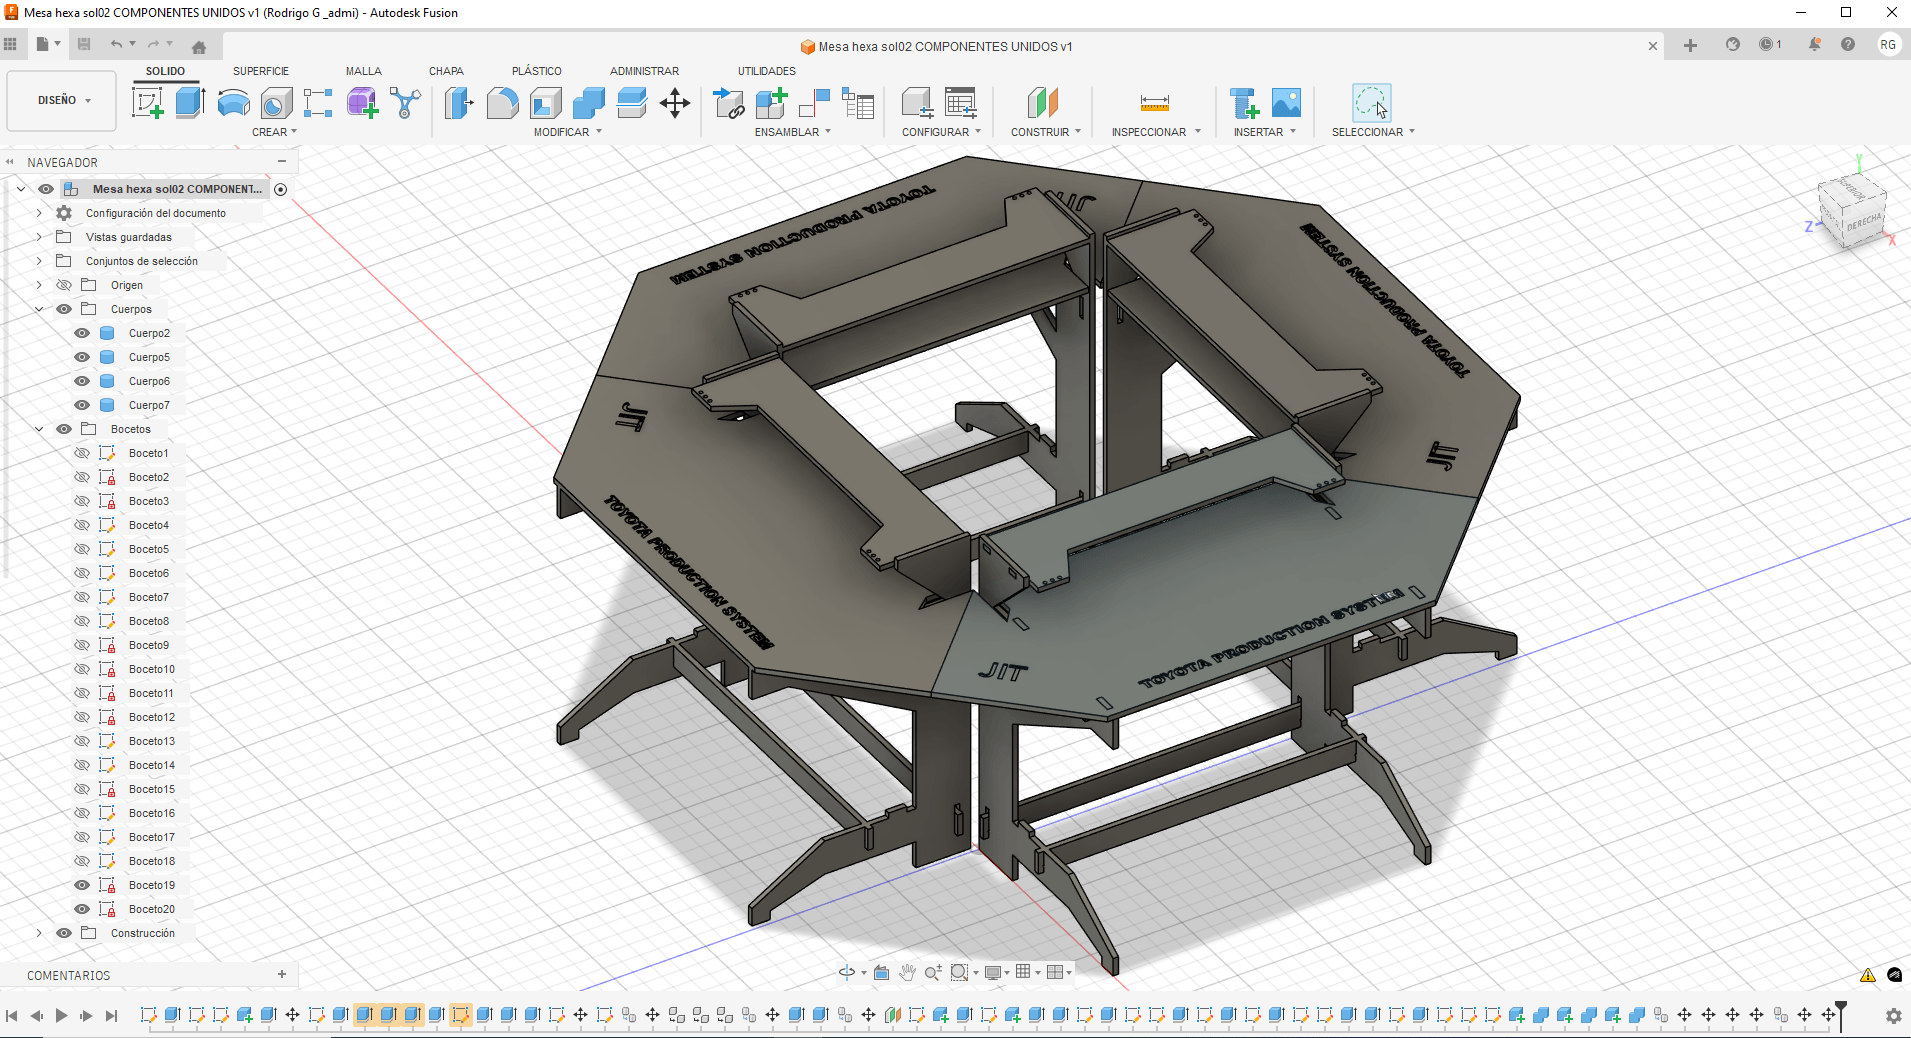
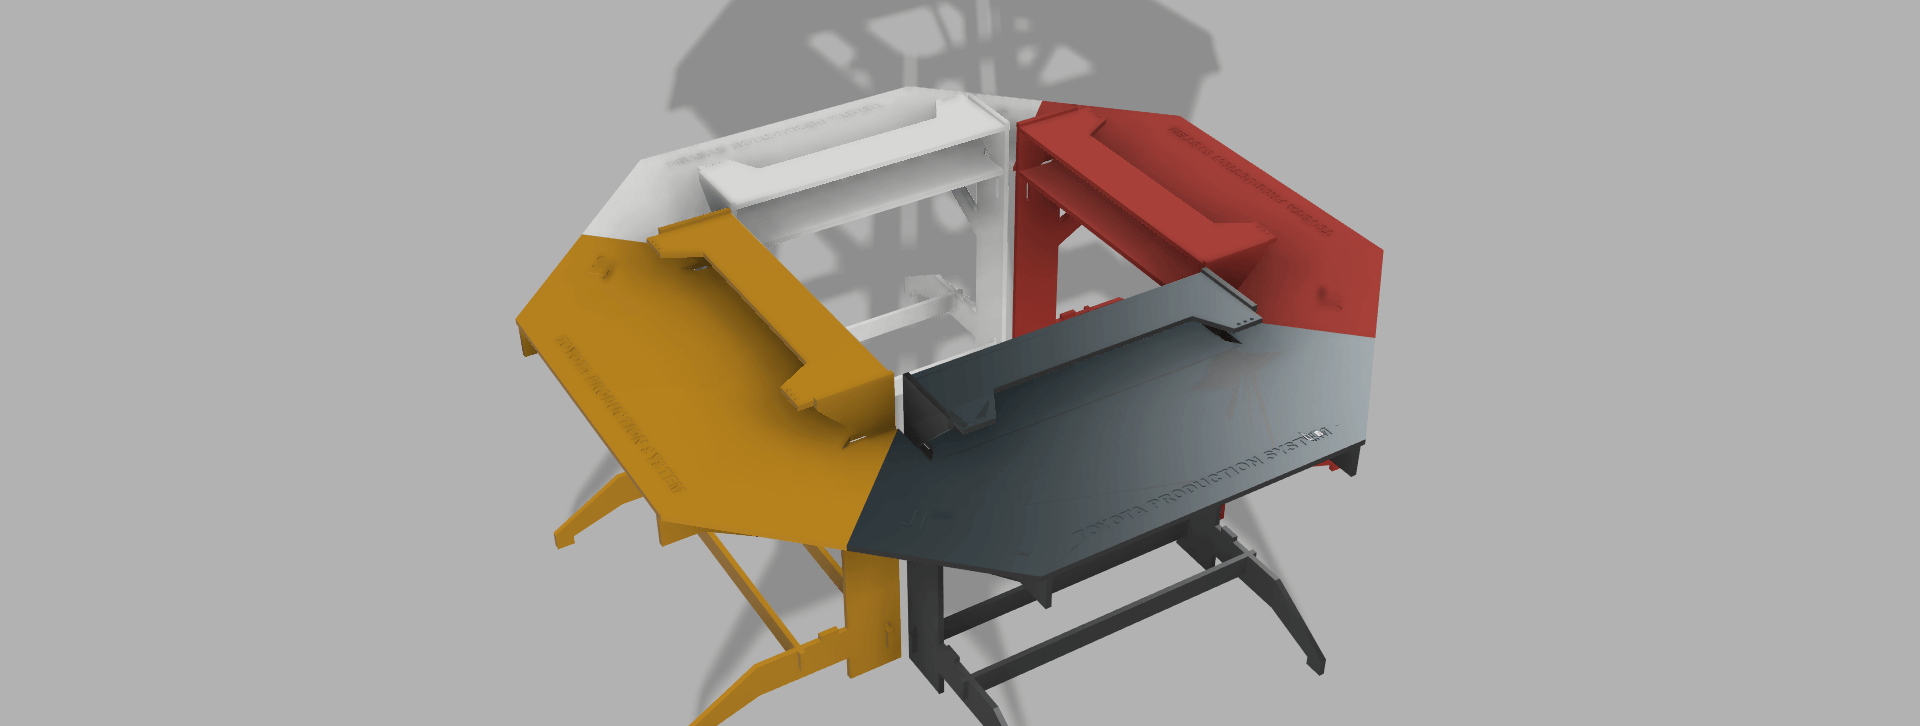
4. Modular Hexagonal Cell Design
A modular design strategy was implemented to create a flexible manufacturing cell. The system is composed of 4 modules that connect through angled edges to form a hexagonal configuration.
This configuration improves workflow distribution, operator interaction, and spatial efficiency.
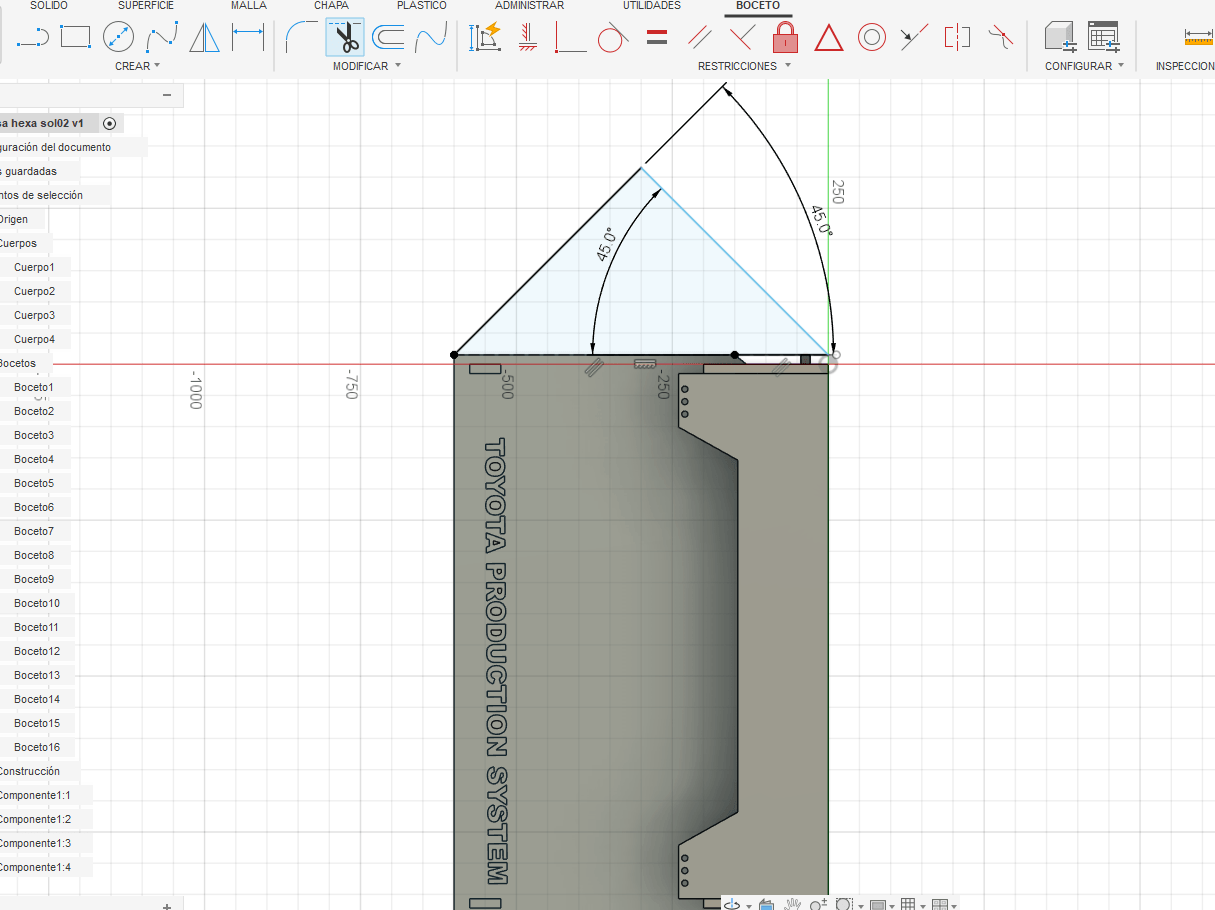
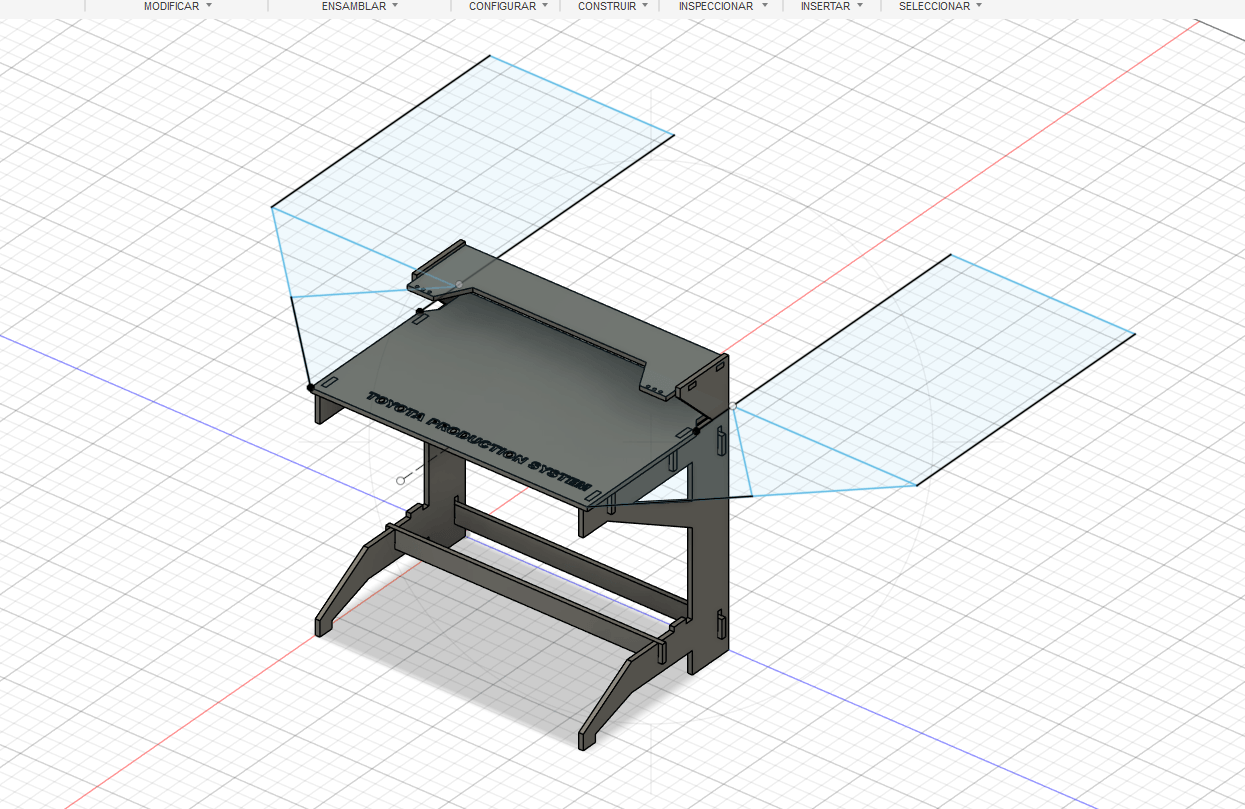
The modular approach allows scalability and reconfiguration depending on the number of users or production requirements.
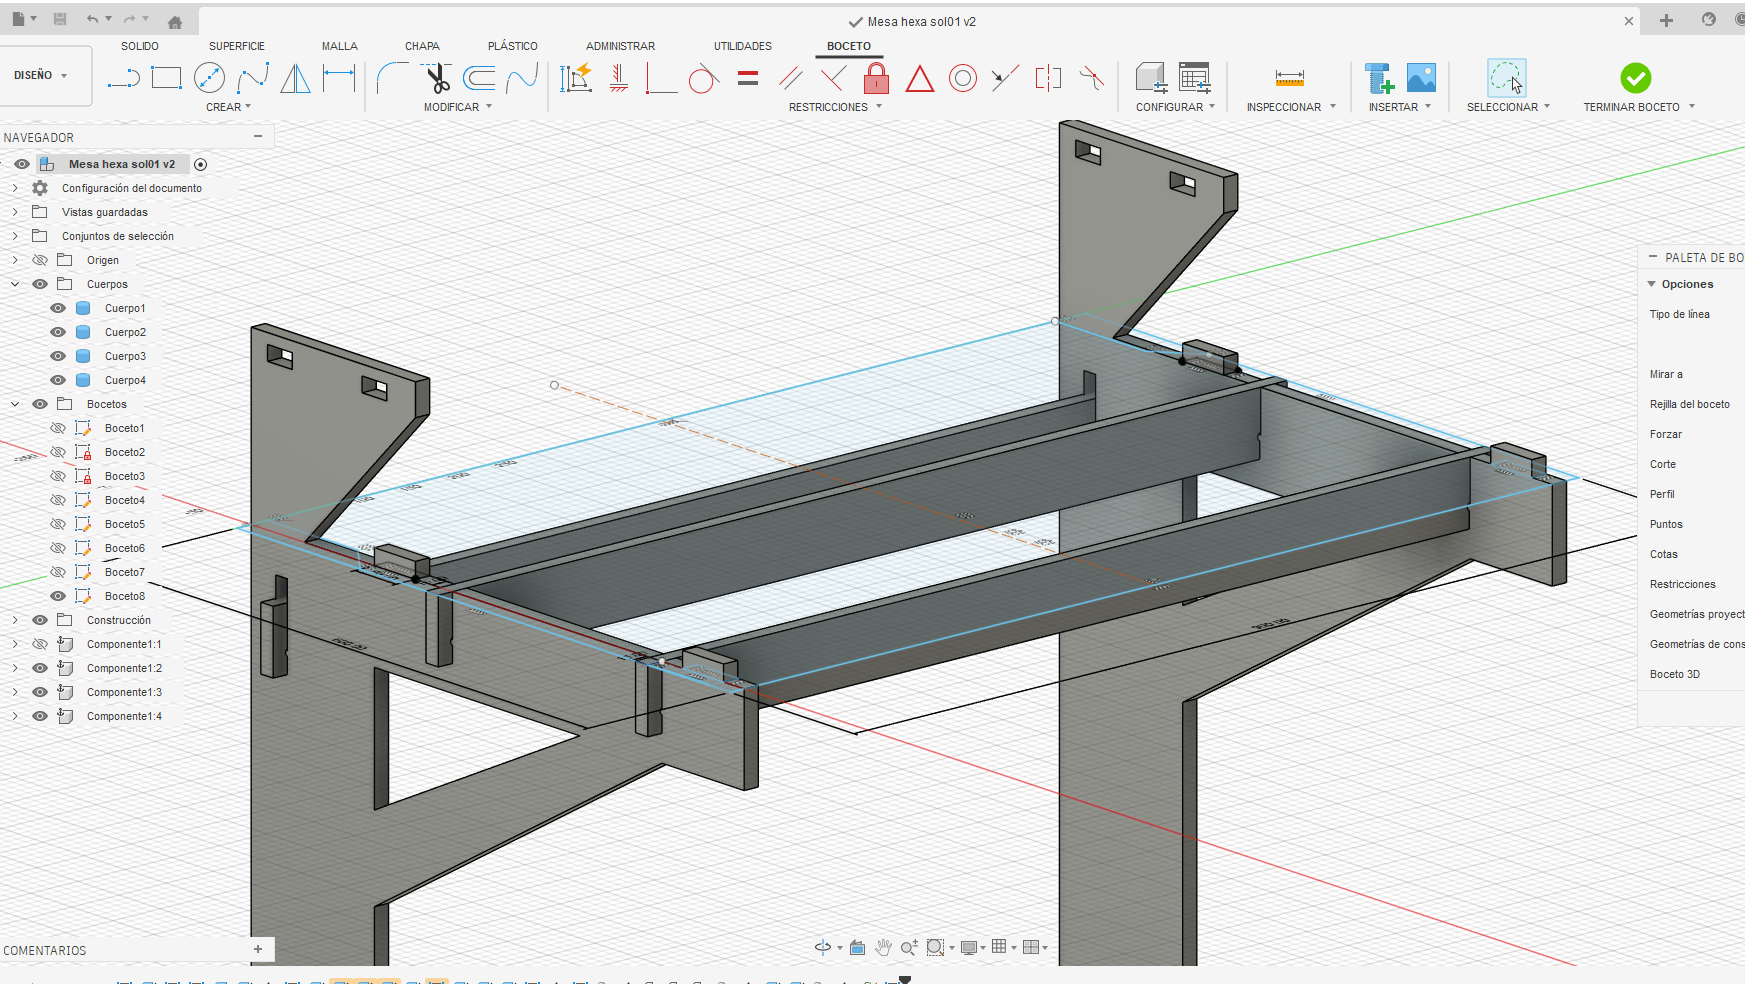
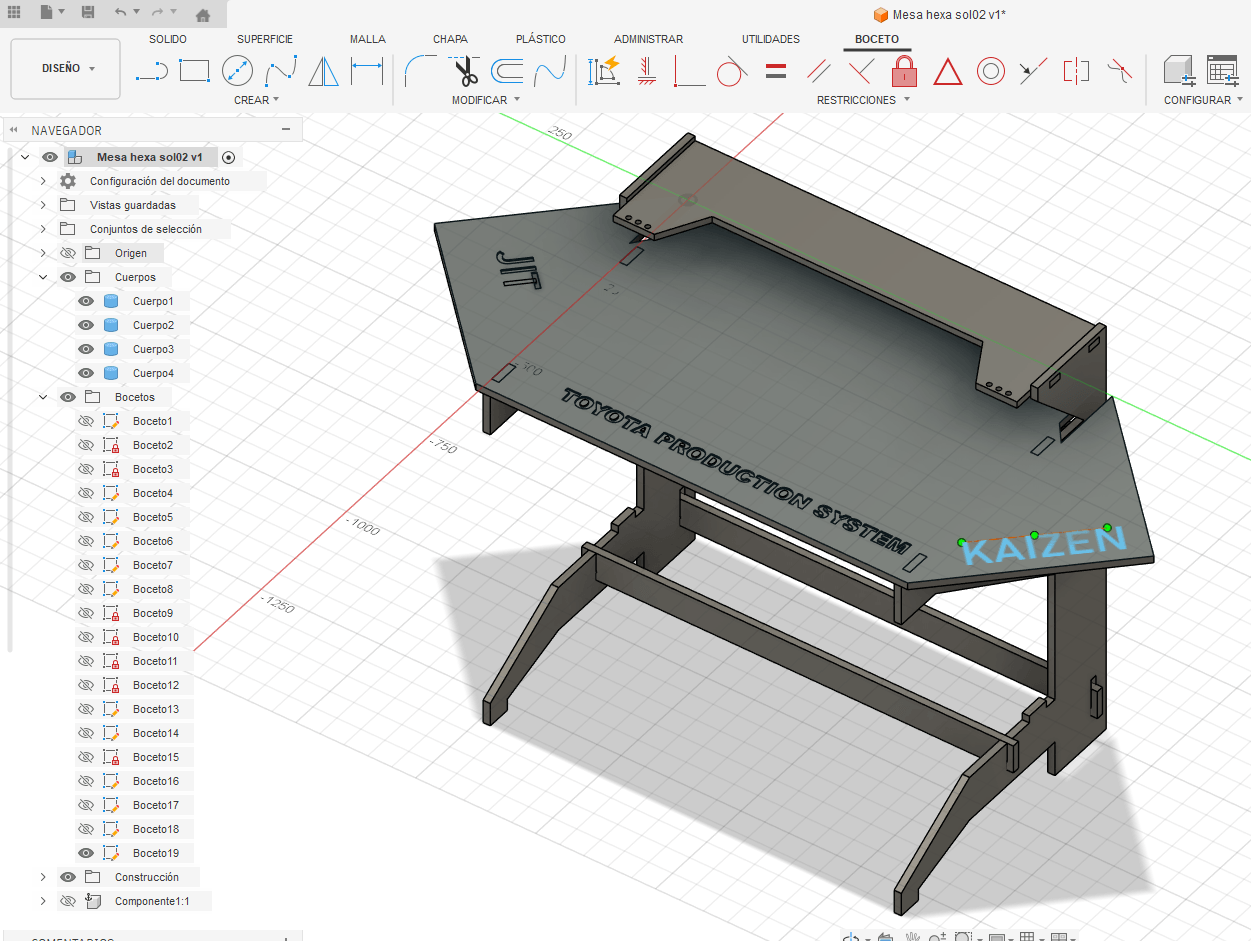
5. Final Assembly – TPS Production Station
The final assembly integrates all components into a functional production station. The system is designed for 4 users working sequentially, simulating a real Toyota Production System (TPS) assembly line.
Each operator performs a specific task, creating a continuous flow of production.
TPS concepts implemented:
- Kaizen (continuous improvement)
- Kanban (visual workflow control)
- Just-In-Time (JIT) production
- Sequential assembly flow
The goal of this system is to demonstrate how an optimized assembly line can improve efficiency, reduce waste, and enhance learning through hands-on interaction.
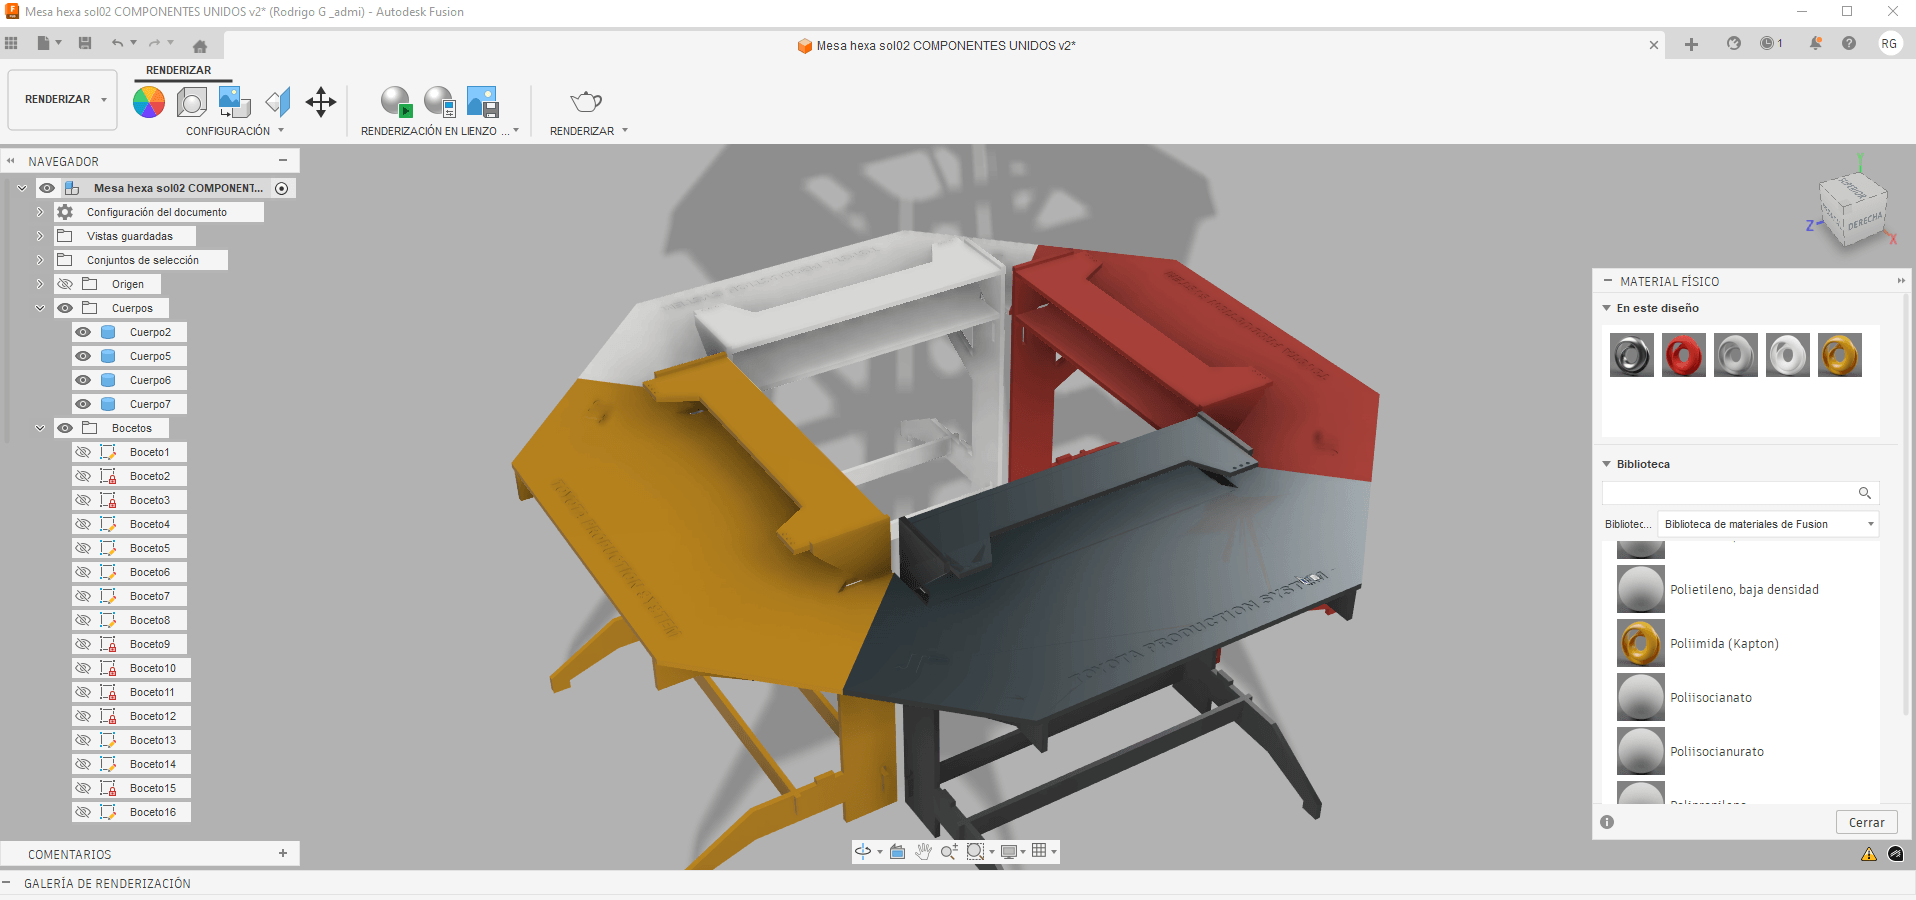
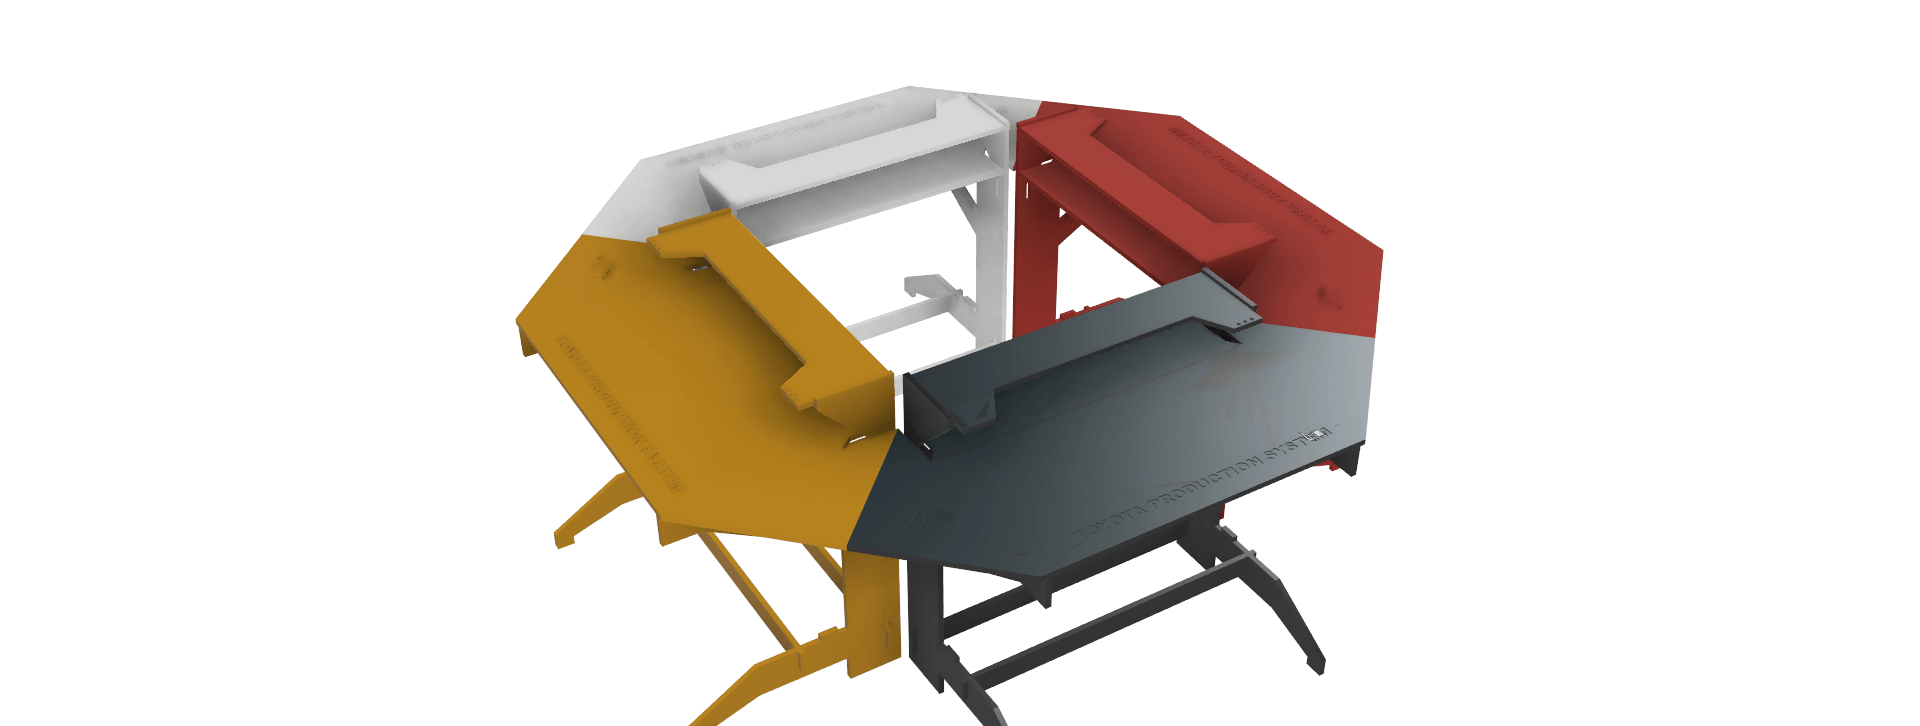
Final Render
The final render shows the complete system with all modules assembled, providing a clear visualization of the final design and its functionality.
5. Mechanical Systems
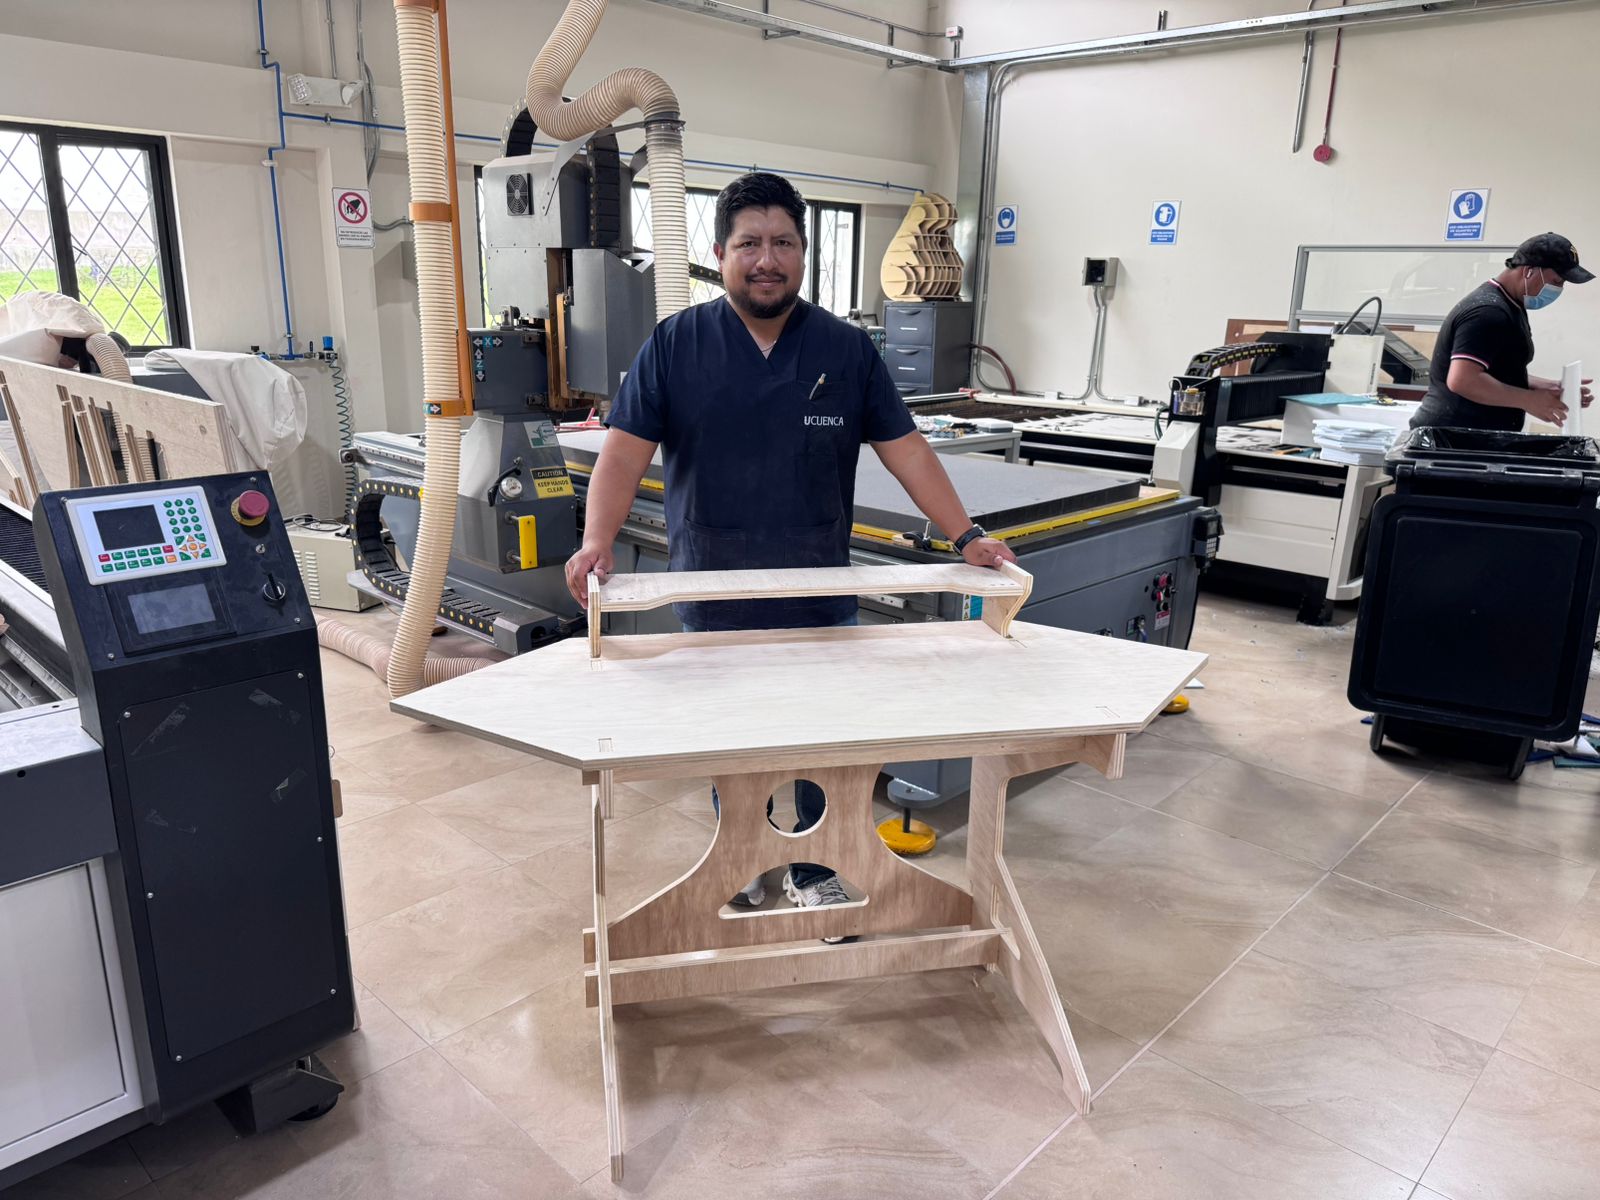
The mechanical system of the Smart Lean Cell is based on the construction of an assembly module fabricated with a CNC milling machine. This module works as the structural support for the workstation: it holds the upper surface, supports the final project elements, and creates a stable base for the modular containers and electronic system.
The module was manufactured on a 122 x 244 cm CNC router. The design was prepared as a 2D cutting file and machined from plywood/MDF sheet material. The most important mechanical decision was to use a press-fit assembly system: the module does not use glue, nails, or screws. Instead, the pieces are joined through accurately machined slots, tabs, and interlocking joints.
Design and CNC Preparation
The geometry of the assembly module was prepared as a DXF file. The file includes the outer profile of each part, the internal openings, and the slots that allow the pieces to lock together. These slots are critical because they define the quality of the final assembly. If the slots are too loose, the structure moves; if they are too tight, the material can break during assembly.
| Mechanical Feature | Purpose |
|---|---|
| Large CNC-cut top surface | Provides the main support area for the Smart Lean Cell. |
| Side supports | Hold the structure at the correct height and stabilize the module. |
| Slots and tabs | Create the press-fit joints used for assembly without glue or screws. |
| Internal lightening cuts | Reduce weight and give visual identity to the module. |
| Upper support piece | Creates a second level for project elements and presentation objects. |
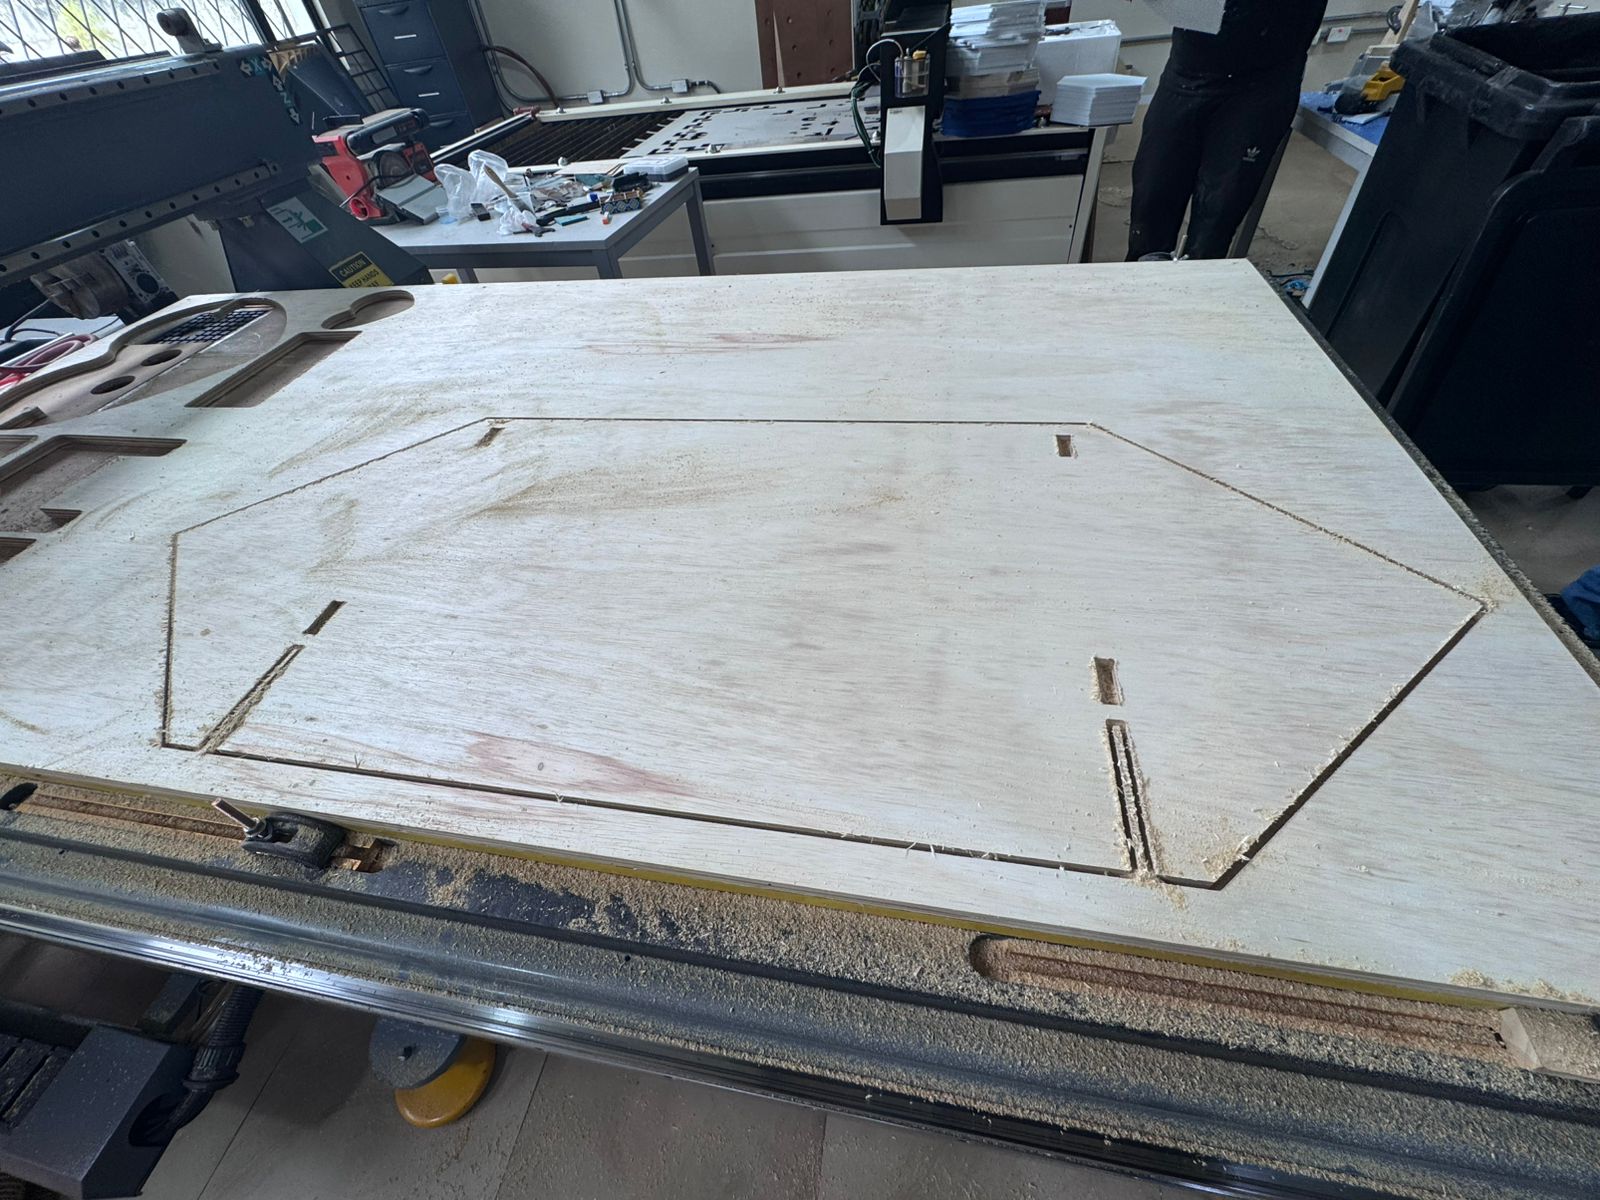
Machining Process
The CNC process started by placing the board on the machine bed and securing it before cutting. The toolpath followed the profiles of the parts and machined the slots for assembly. During machining, the router removed material from the sheet and left the final profiles connected by small holding areas until the cut was complete. After the job finished, the parts were removed from the board and cleaned before assembly.
This process was important because the assembly module depends on dimensional accuracy. The fit between tabs and slots was designed to be tight enough to hold the structure together mechanically. The CNC router allowed repeatable cuts and clean profiles, making the module strong without additional fasteners.
Additional machining evidence showing the cutting process on the CNC router.
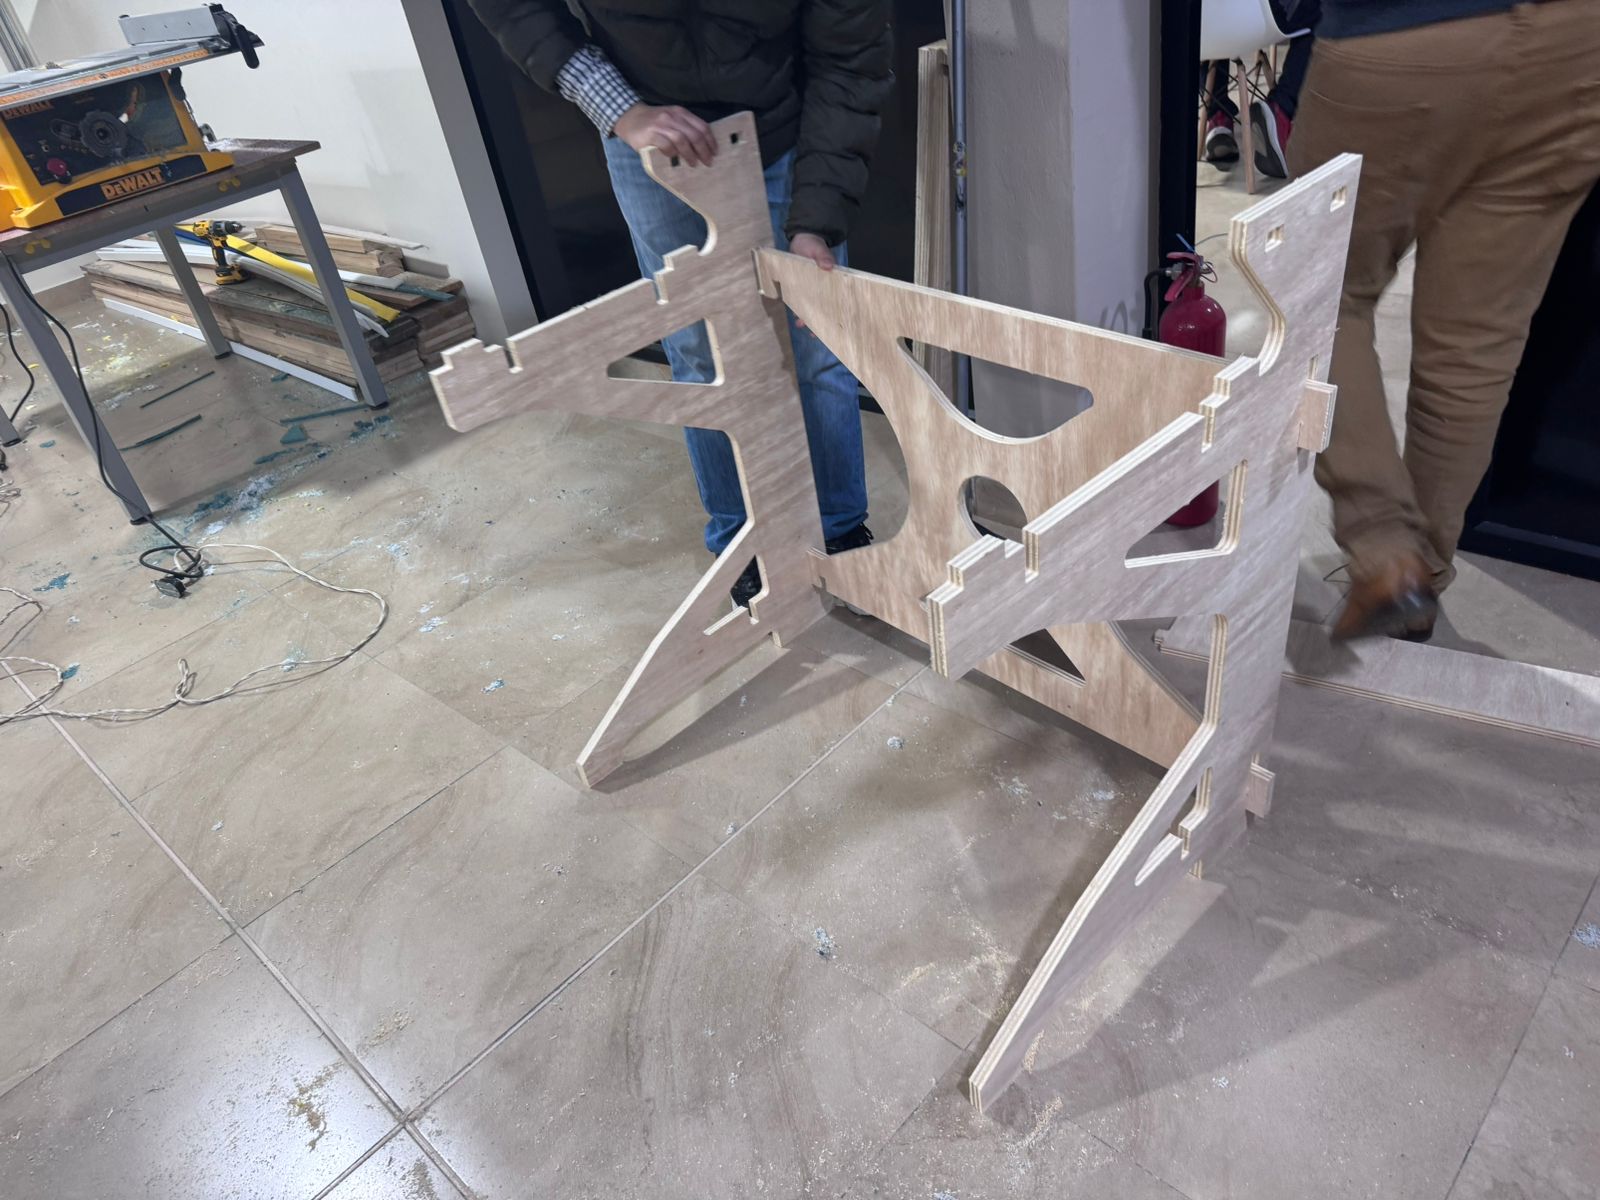
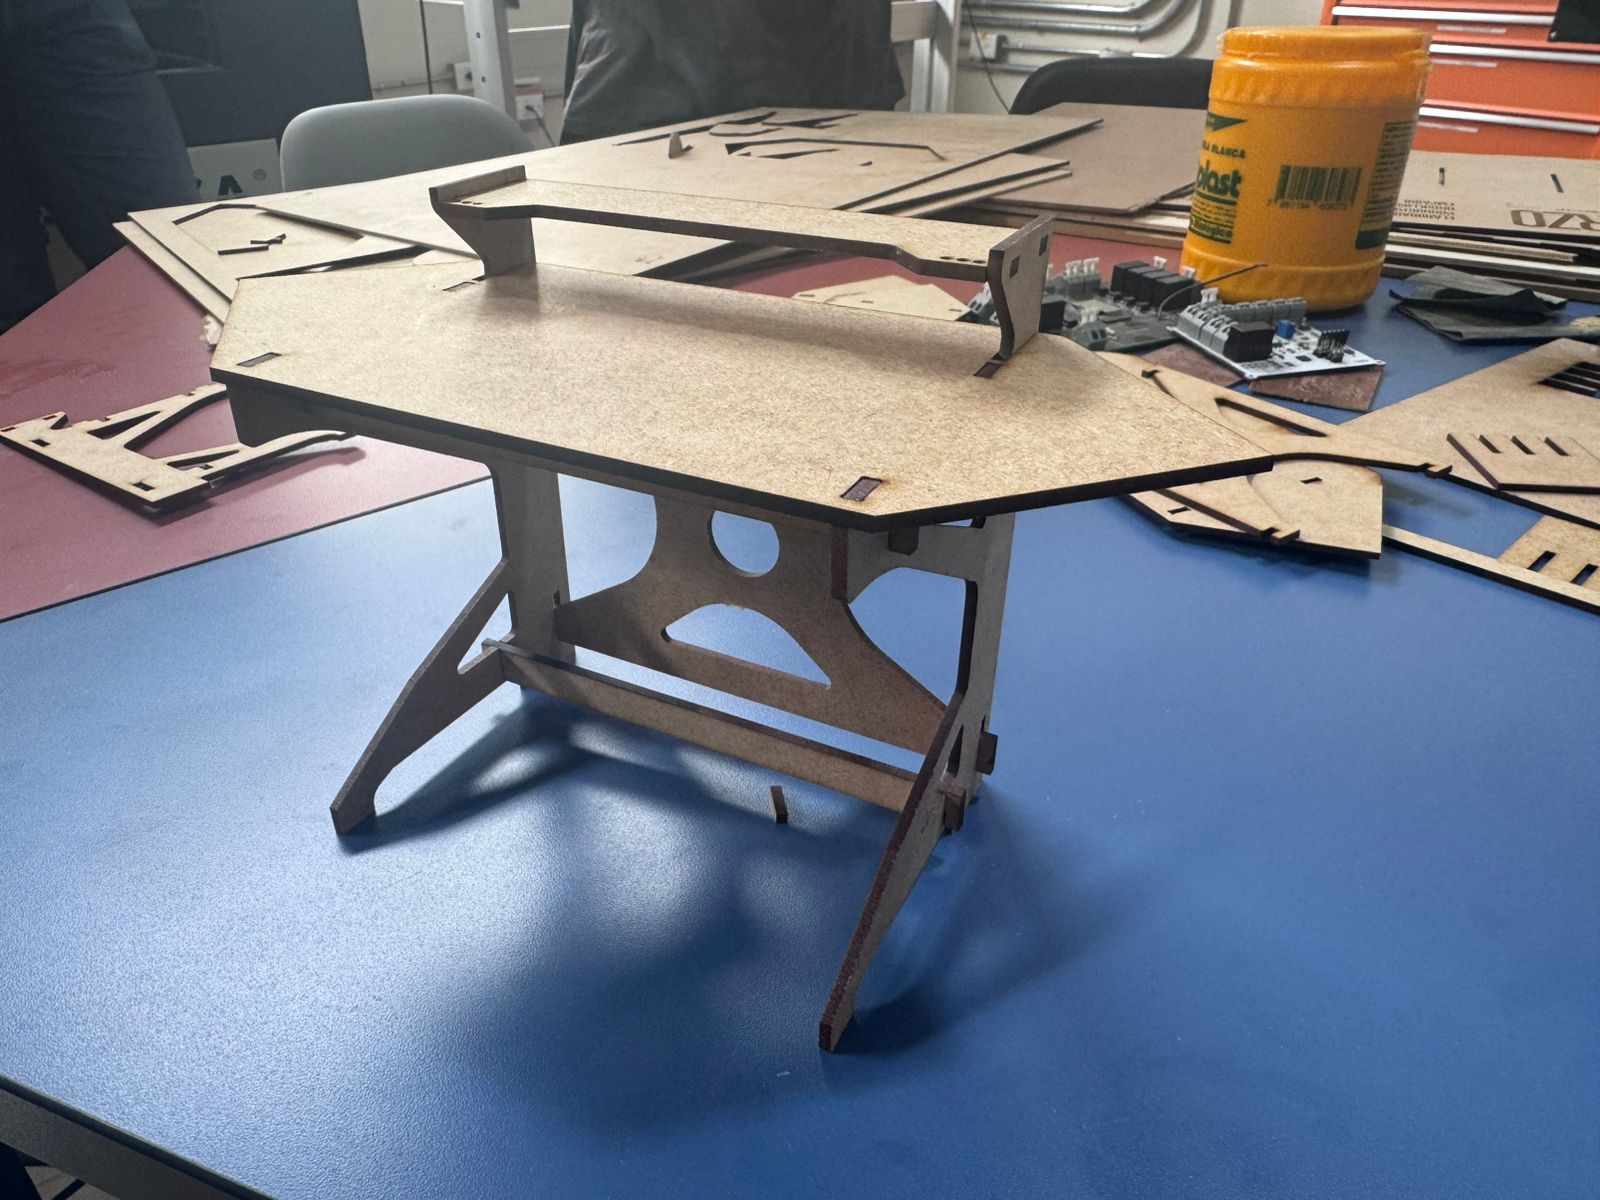
Assembly Process
The assembly process was done manually after removing the CNC-cut parts. Each piece was inserted into the corresponding slot and pressed into position. The side supports, cross members, top surface, and upper shelf were assembled by aligning the tabs with the machined openings.
A key feature of this module is that the structure does not use glue, nails, or screws. The mechanical strength comes from the precision of the joints. The tabs and slots fit tightly, so the parts lock together by friction and geometry. This makes the module easier to disassemble, repair, modify, or fabricate again.
The final result is a rigid assembly module that supports the Smart Lean Cell and provides a clean platform for the containers, sensors, PCB case, and presentation elements.
Downloadable File
The DXF file used for the CNC machining of the assembly module can be downloaded below. This file contains the cutting geometry for the press-fit module.
Download Assembly Module DXFLEAN Tool Construction
Theoretical Foundation: Order Before Assembly
Before integrating the electronic system, the Smart Lean Cell required a set of physical Lean tools to prepare the workstation for children. In a learning environment, organization is not only an aesthetic decision: it is part of the pedagogical strategy. If the pieces are visible, separated, easy to reach and logically positioned, children can focus on understanding the assembly flow instead of wasting time searching for components.
This stage connects directly with 5S, visual management, standard work and motion economy. The physical layout of the parts becomes the first lesson: a disorganized workstation produces unnecessary motion, confusion and longer cycle times, while an ordered workstation supports flow, reduces errors and makes improvement easier to observe.
Therbligs, Methods and Motion Study
The design of the Lean tools was also inspired by the concept of Therbligs, introduced by Frank and Lillian Gilbreth as part of methods and motion study. Therbligs describe small elemental motions in work, such as searching, finding, selecting, grasping, transporting, positioning and assembling. In the Smart Lean Cell, these ideas are simplified for the educational context: when a child searches for a part, reaches too far, or hesitates because the material is not organized, the cycle time increases.
| Motion Study Concept | Problem in Assembly | LEAN Tool Response |
|---|---|---|
| Search | The learner loses time looking for the correct component. | Separate trays and color-coded compartments make each part visible. |
| Select | Similar pieces can be confused during assembly. | Each component has a defined location before the task begins. |
| Reach / Transport | Excess movement makes the activity slower and less ergonomic. | The bins are placed close to the assembly space. |
| Position | The child needs to orient the part before assembling. | The panel and trays support a predictable assembly sequence. |
Toyota Dojo and Preparation Before Production
In Toyota and other Lean-oriented companies, training areas or dojos are used to prepare people before they enter real production. These spaces allow workers to practice basic operations, understand standard work, improve motion, and learn safety and quality principles in a controlled environment. The Smart Lean Cell follows this educational idea at a child-friendly scale: it acts as a small STEM dojo where children can practice organization, assembly, measurement and improvement before discussing formal industrial engineering concepts.
For this reason, the construction of Lean tools is part of the learning system. The physical panel and the trays prepare the work area before the electronic measurement begins. This reinforces an important TPS principle: improvement starts by making the work visible and understandable.
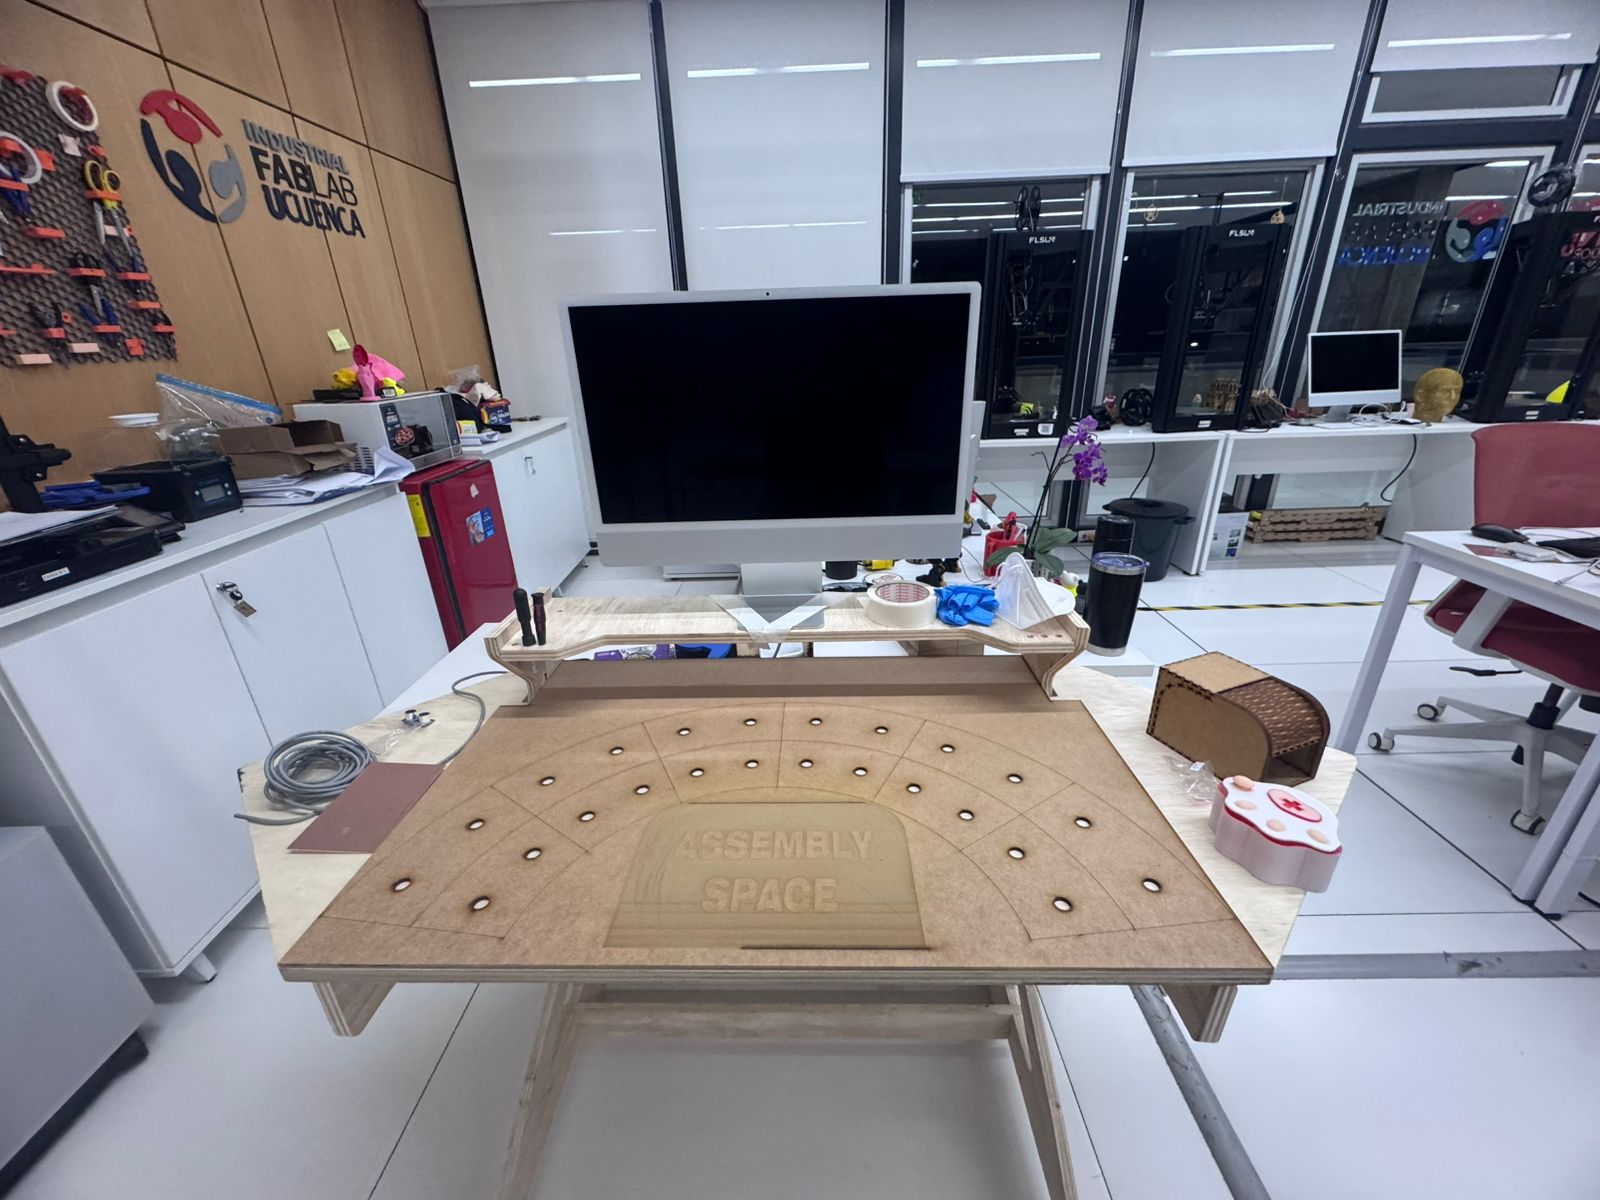
1. Laser-Cut Physical Panel
The first tool developed for the workstation was a physical organization panel. This panel defines the location of the assembly area, the inventory area and the finished-product area. It was designed to support the Lean Challenge by giving the child a clear visual structure before starting the activity.
Laser cutting technology was selected for the panel because it allows precise geometry, fast iteration and clean engraved references. The panel can include labels, outlines, slots or visual marks that guide the placement of parts and tools. This makes the workstation easier to understand and helps reduce unnecessary Therbligs such as searching, selecting and repositioning.
The DXF file used for the laser-cut physical panel is available below. This file contains the geometry for the Kanban-style organization board used to prepare the assembly activity.
Download Laser-Cut Panel DXF| Panel Function | Lean Principle | Educational Effect |
|---|---|---|
| Defines the assembly zone. | Standard work | The child understands where the task should happen. |
| Separates inventory and finished-product spaces. | Flow and visual management | The child sees the path from start to completion. |
| Provides visual references for components. | 5S and mistake reduction | The child can recognize when something is missing or misplaced. |
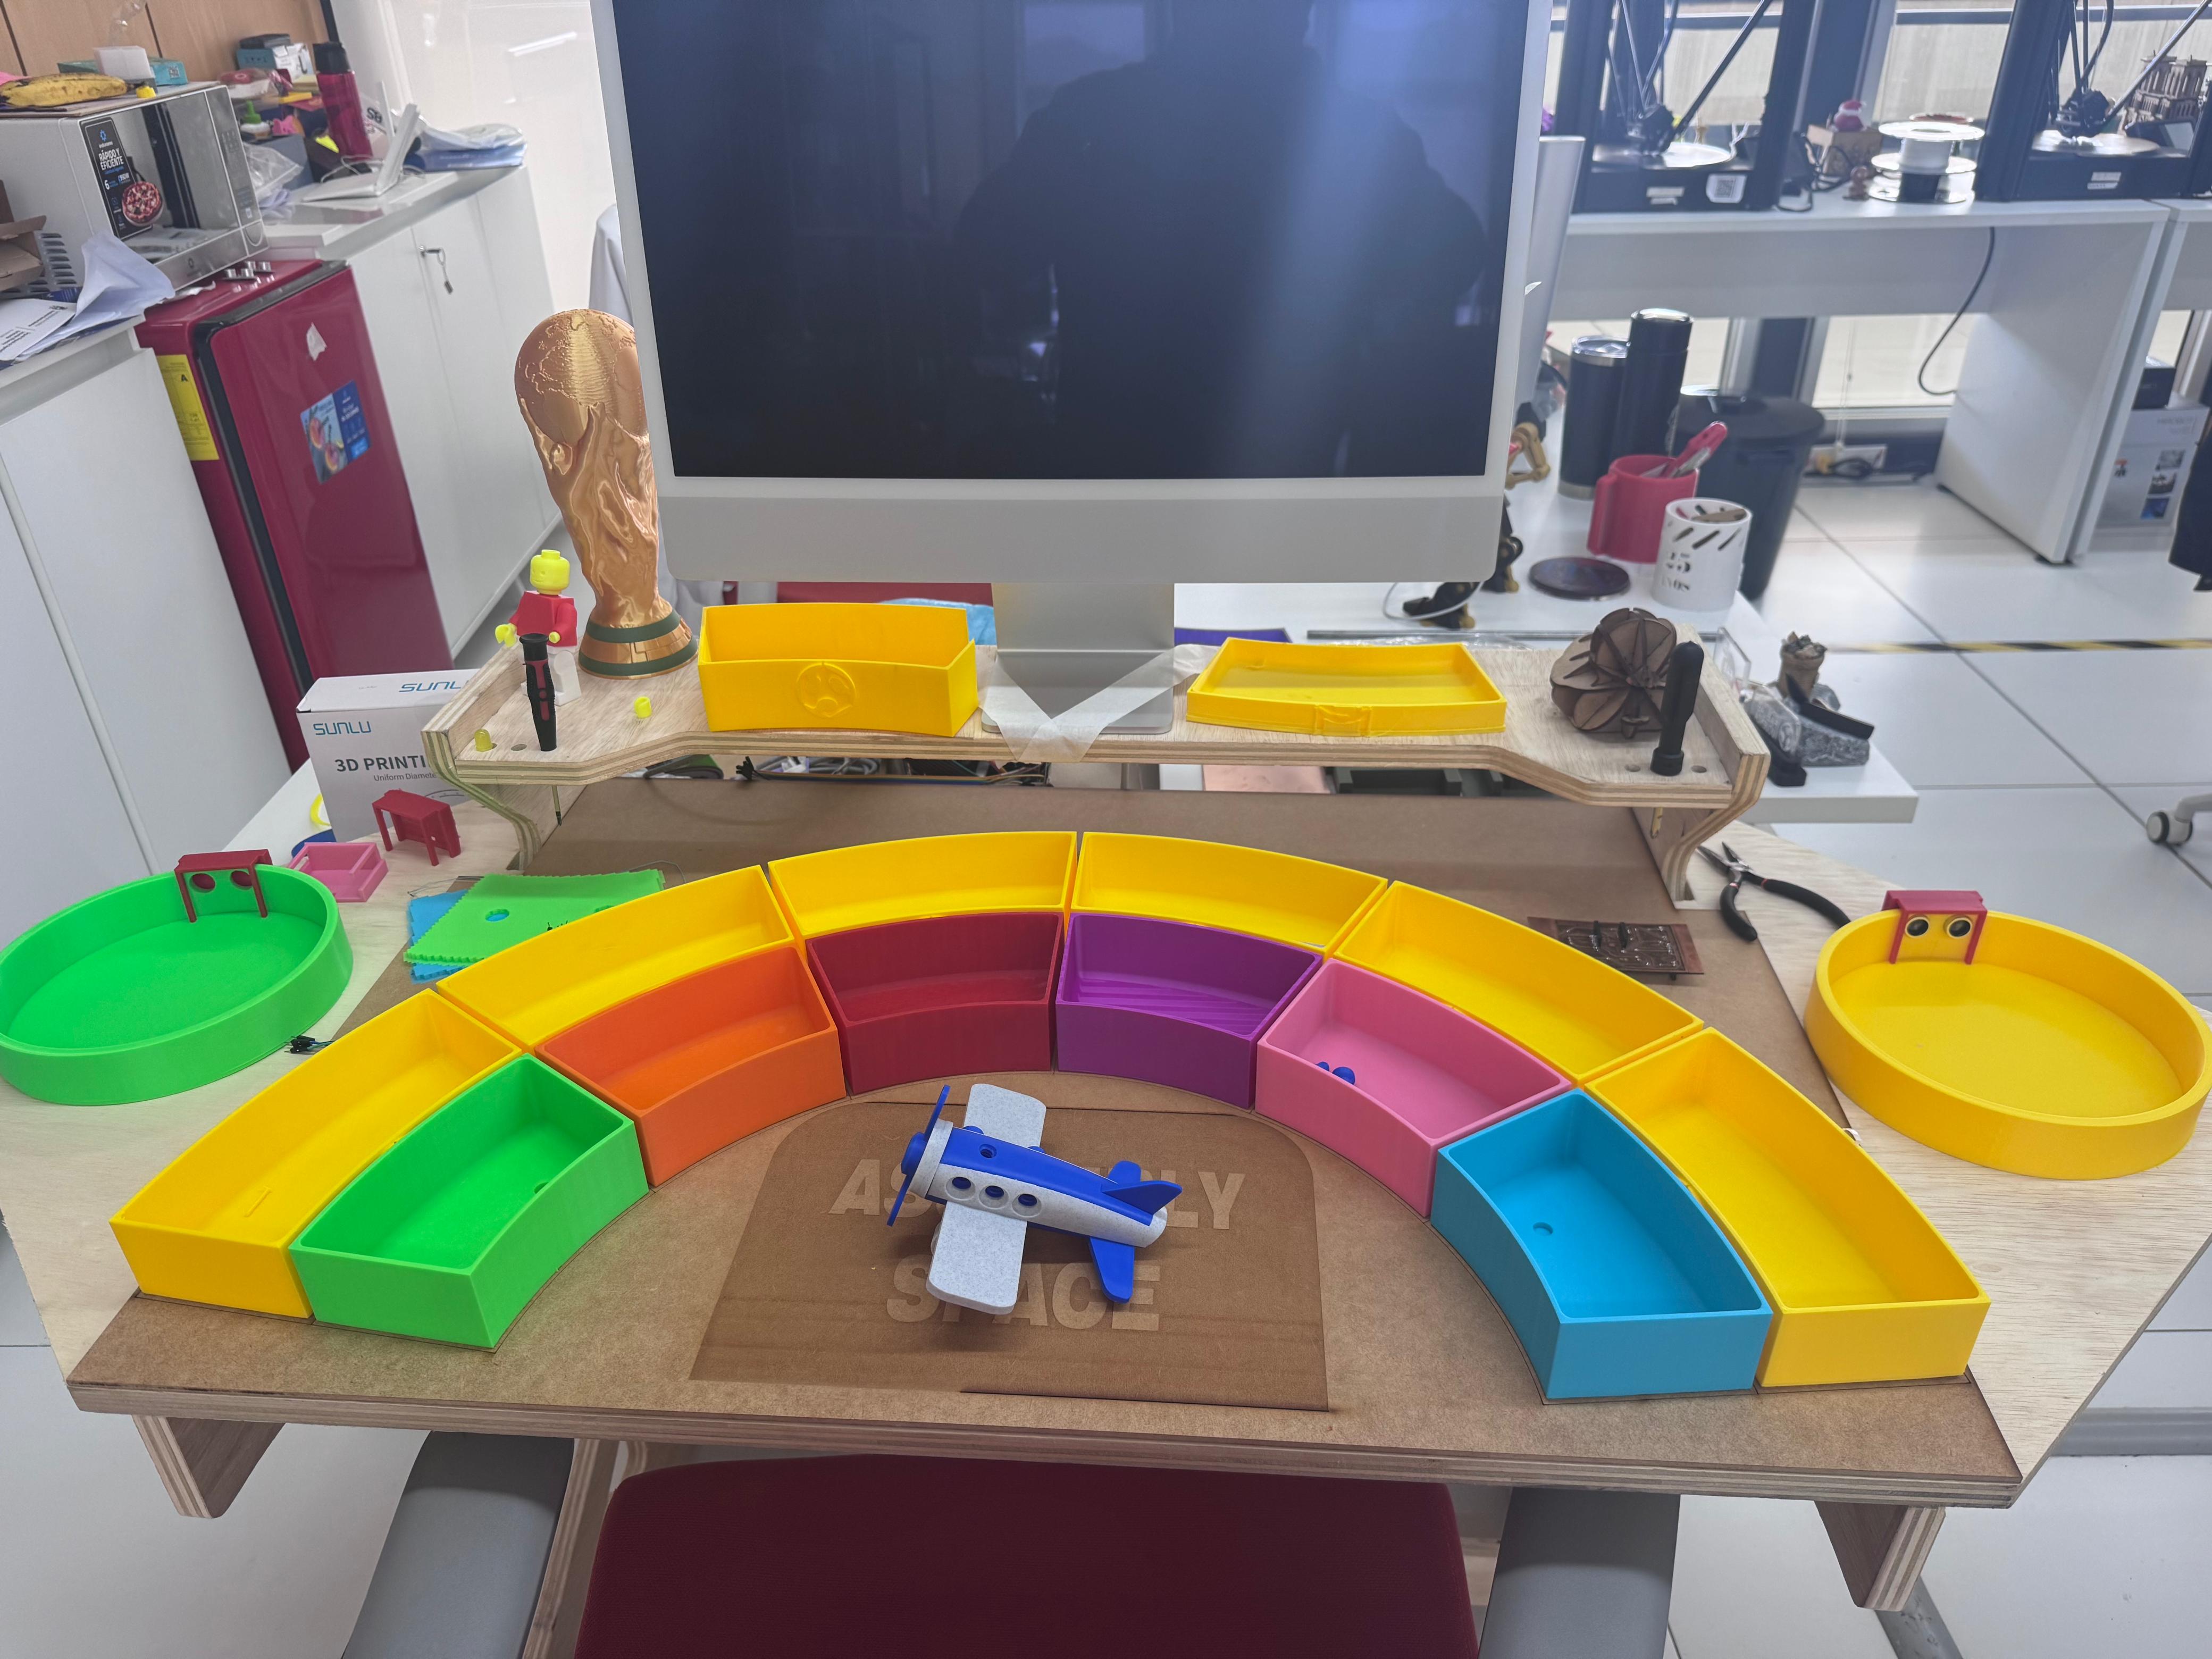
2. 3D Printed Tray Compartments
After defining the panel, I designed and fabricated 3D printed tray-style compartments. These trays organize the elements required for the assembly activity and separate them by type, color and function. The trays are important because they transform the workspace from a random collection of parts into a visual and repeatable system.
3D printing was used because it allows custom compartments adapted to the geometry and quantity of the parts. The trays can be resized, duplicated or modified depending on the activity. In the Smart Lean Cell, the tray system supports the idea of 5S: each part has a place, each place has a purpose, and the learner can quickly understand how the assembly should begin.
| 3D Printed Tool | Purpose | Contribution to the Smart Lean Cell |
|---|---|---|
| Component trays | Separate screws, pieces, tools and subassemblies. | Reduce search time and support standard work. |
| Incoming inventory compartment | Hold the part before the cycle starts. | Connects the physical inventory area with Sensor 1 logic. |
| Finished product compartment | Receive the completed assembly. | Connects the completed product area with Sensor 2 logic. |
| Color-coded bins | Group components visually. | Make the workstation intuitive for children. |
3. Integration with the Gamified Learning Strategy
The Lean tools are used before and during the assembly challenge. In the first level, the child can experience how a disorganized process feels. In the next levels, the panel and trays are introduced to show how order, visual management and standard work improve the process. This makes the difference between chaos and optimization visible without requiring a long theoretical explanation.
The final objective of this section is to show that optimization begins before the first part is assembled. A good layout, clear material locations and prepared tools reduce unnecessary movement and make the electronic indicators more meaningful. The child can then connect physical order with measurable improvement in the dashboard.
Downloadable 3D Printing Files
The following files include the 3D design, printable models and machine file used for the Kanban tray system. They can be downloaded to review, modify or fabricate the compartments again.
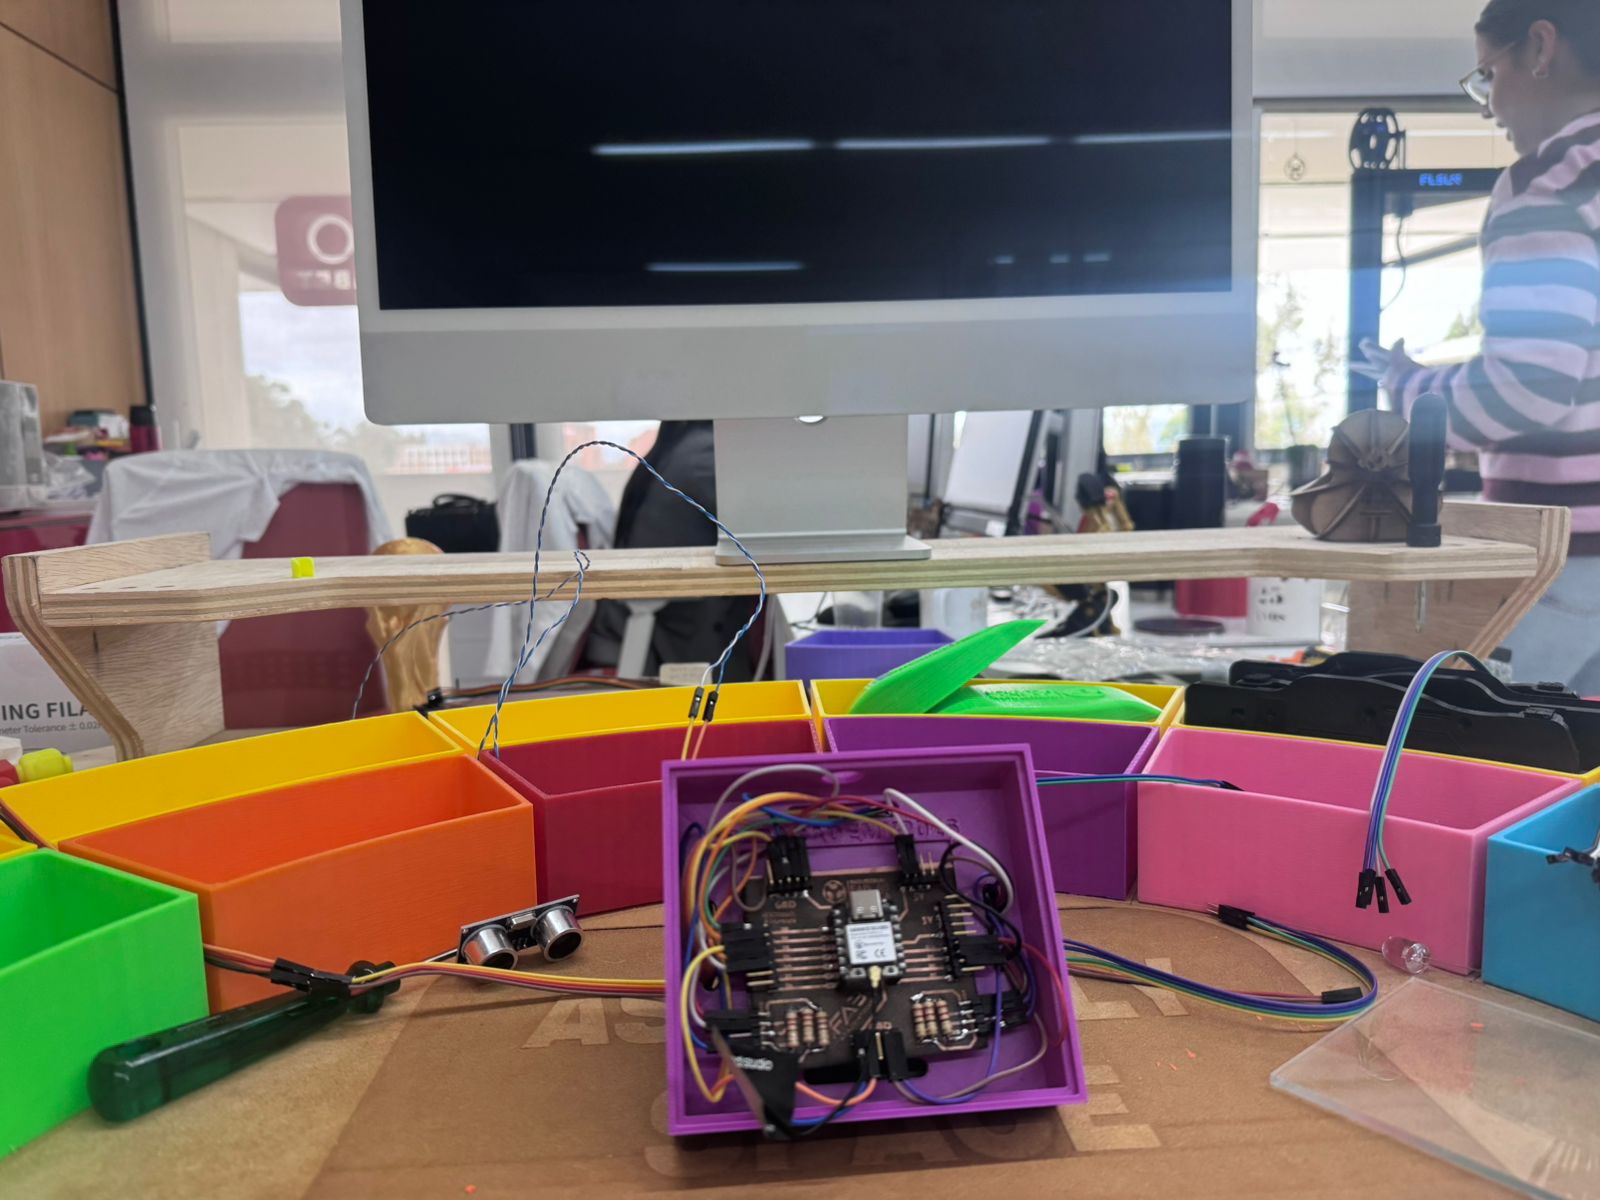
6. Electronic System
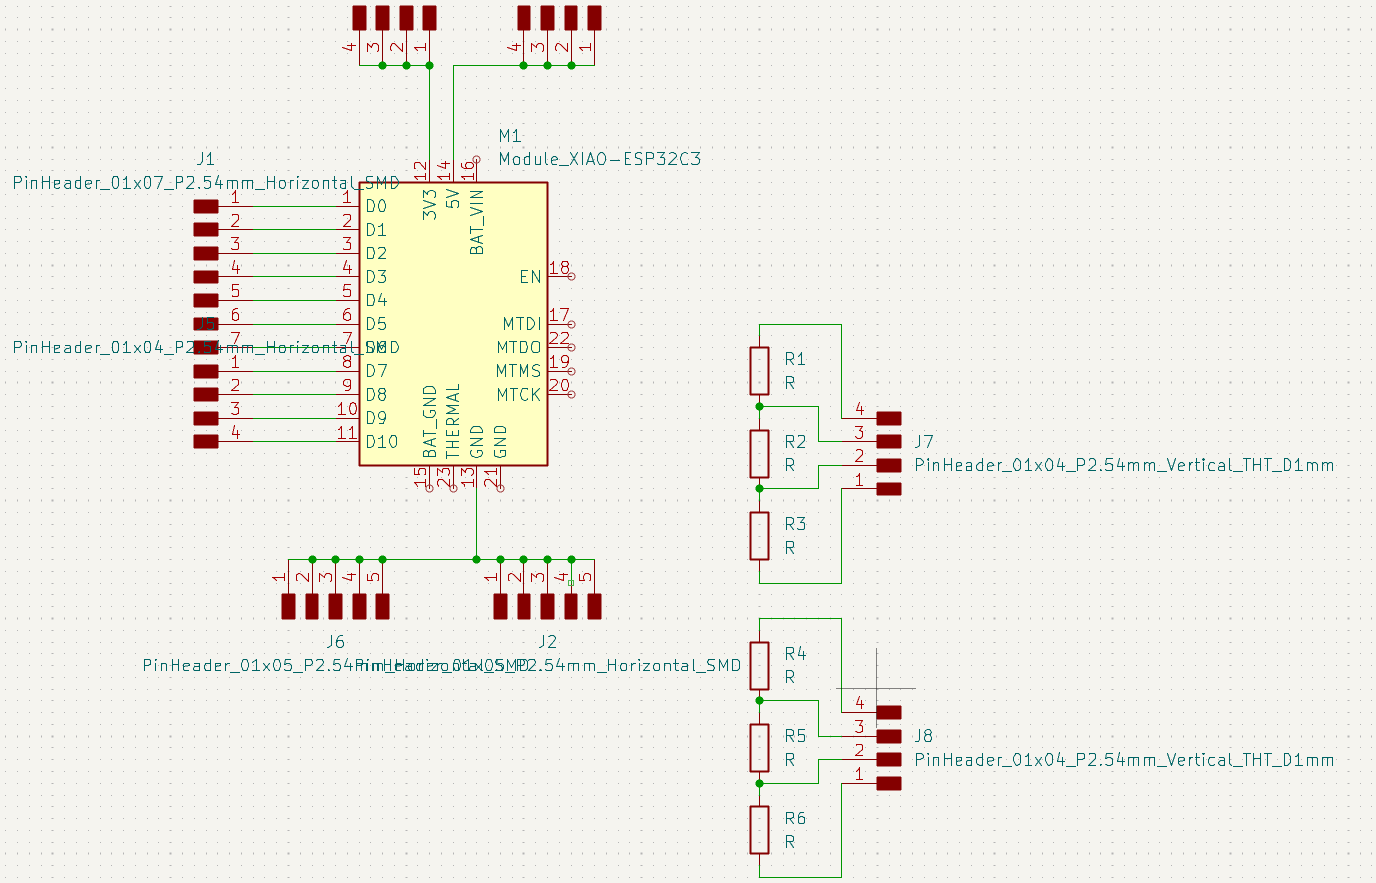
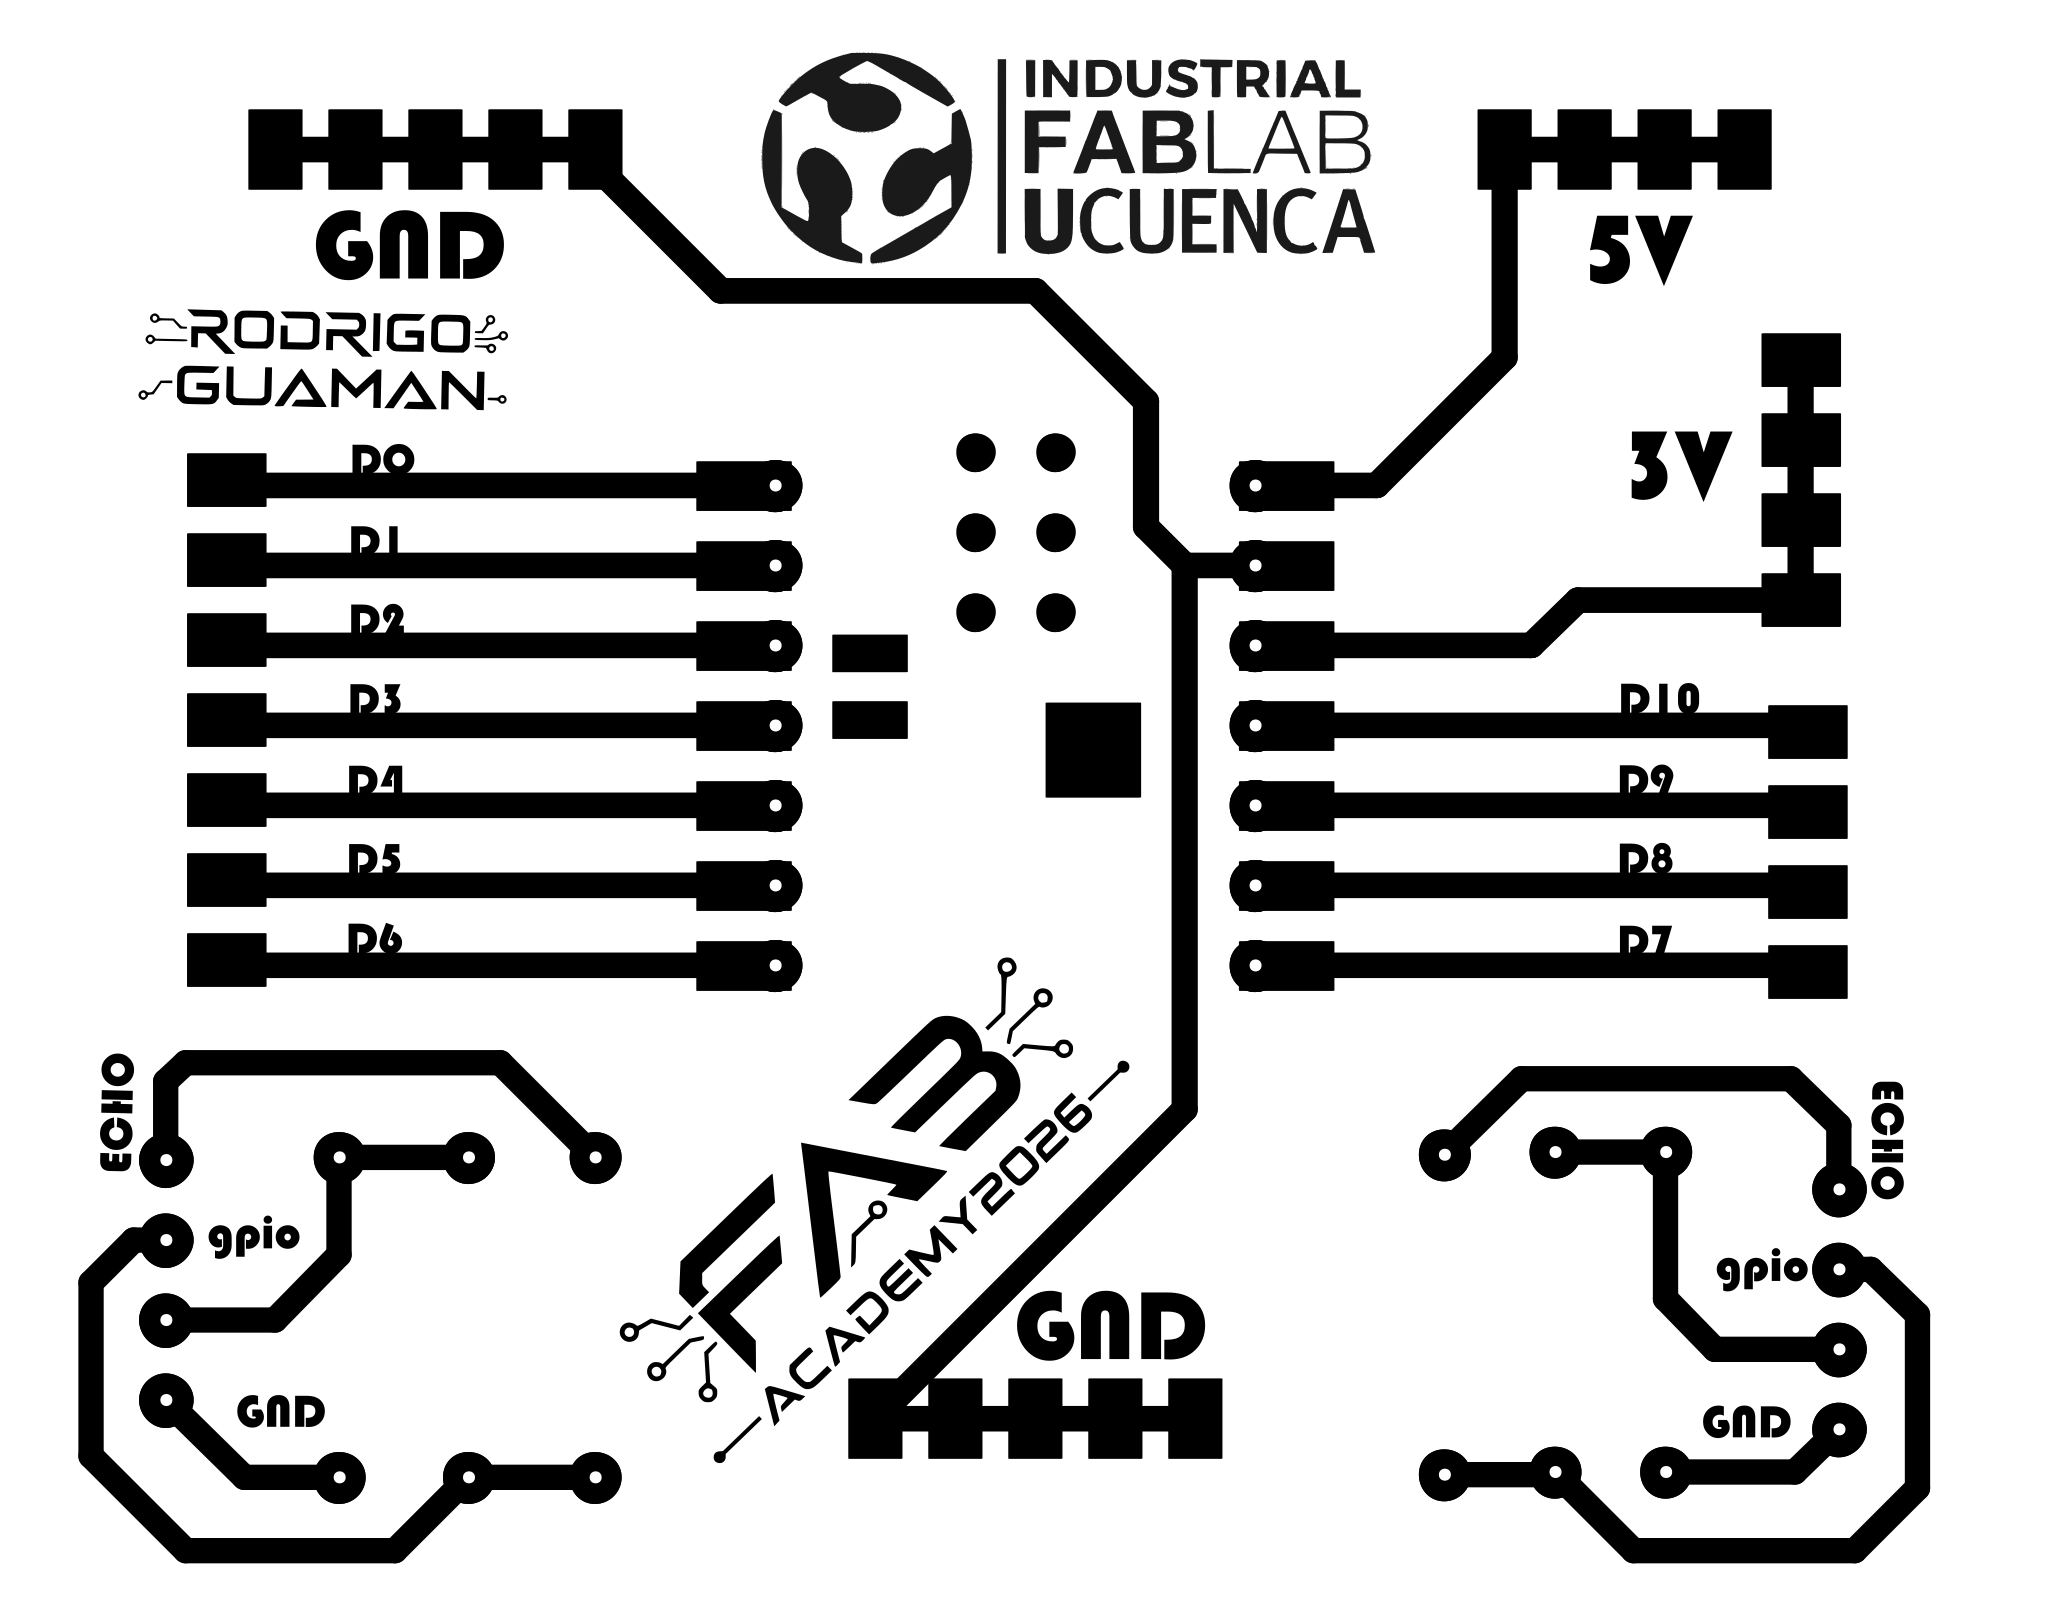
The electronic system of the Smart Lean Cell was developed around a custom PCB designed for the Seeed Studio XIAO ESP32-C3. This board works as the central connection module for the final project: it exposes the digital pins, organizes power lines, receives the ultrasonic sensor signals, and makes the wiring easier to integrate inside the physical prototype.
The schematic and PCB layout were designed in KiCad. The board was then fabricated using a fiber laser machine, which removed the unwanted copper and left the conductive traces, labels, pads, and logos on the copper board. This process allowed me to fabricate a personalized PCB for the project instead of using only a breadboard or commercial development board.
Electronic Design Objective
The objective was to create a generic control board for the final project that could connect sensors and external modules while keeping the XIAO ESP32-C3 accessible. The board includes pin headers for the XIAO pins, power distribution for 5V and 3V, ground references, and connector areas for the HC-SR04 ultrasonic sensor. Since the HC-SR04 echo signal works at 5V and the XIAO ESP32-C3 uses 3.3V logic, resistors were included to make a voltage divider and protect the microcontroller input.
| Element | Function in the Electronic System |
|---|---|
| XIAO ESP32-C3 | Main microcontroller used for reading the sensor and controlling the project logic. |
| Custom PCB | Organizes the pins, power lines, sensor connectors, and integration wiring. |
| HC-SR04 ultrasonic sensor | Detects distance and object presence inside the Smart Lean Cell. |
| Voltage divider resistors | Reduce the 5V echo signal from the HC-SR04 to a safer level for the ESP32-C3 input. |
| Pin headers and jumper wires | Allow modular connection between the PCB, sensor, and final project structure. |
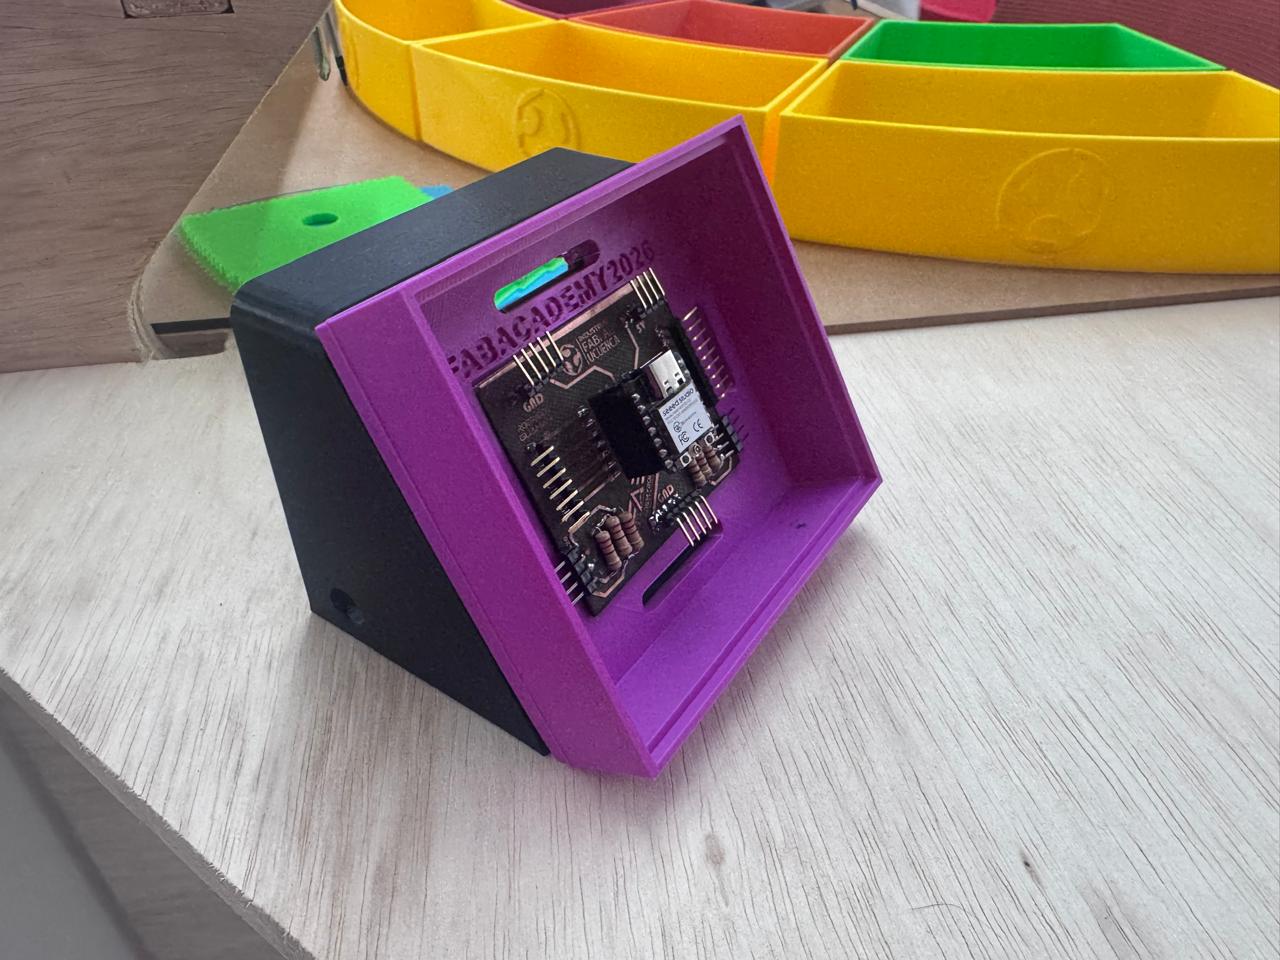
| 3D printed case | Protects the PCB and presents the electronics as a clean module in the final project. |
Open Week 16 - System Integration Documentation
KiCad Schematic and PCB Design
The schematic was first created in KiCad to define the XIAO ESP32-C3 connections, headers, power pins, ground lines, and the voltage divider circuit. After validating the schematic, the PCB layout was routed with wide and readable traces. Labels were added directly to the copper design so the board could be interpreted during assembly and debugging.
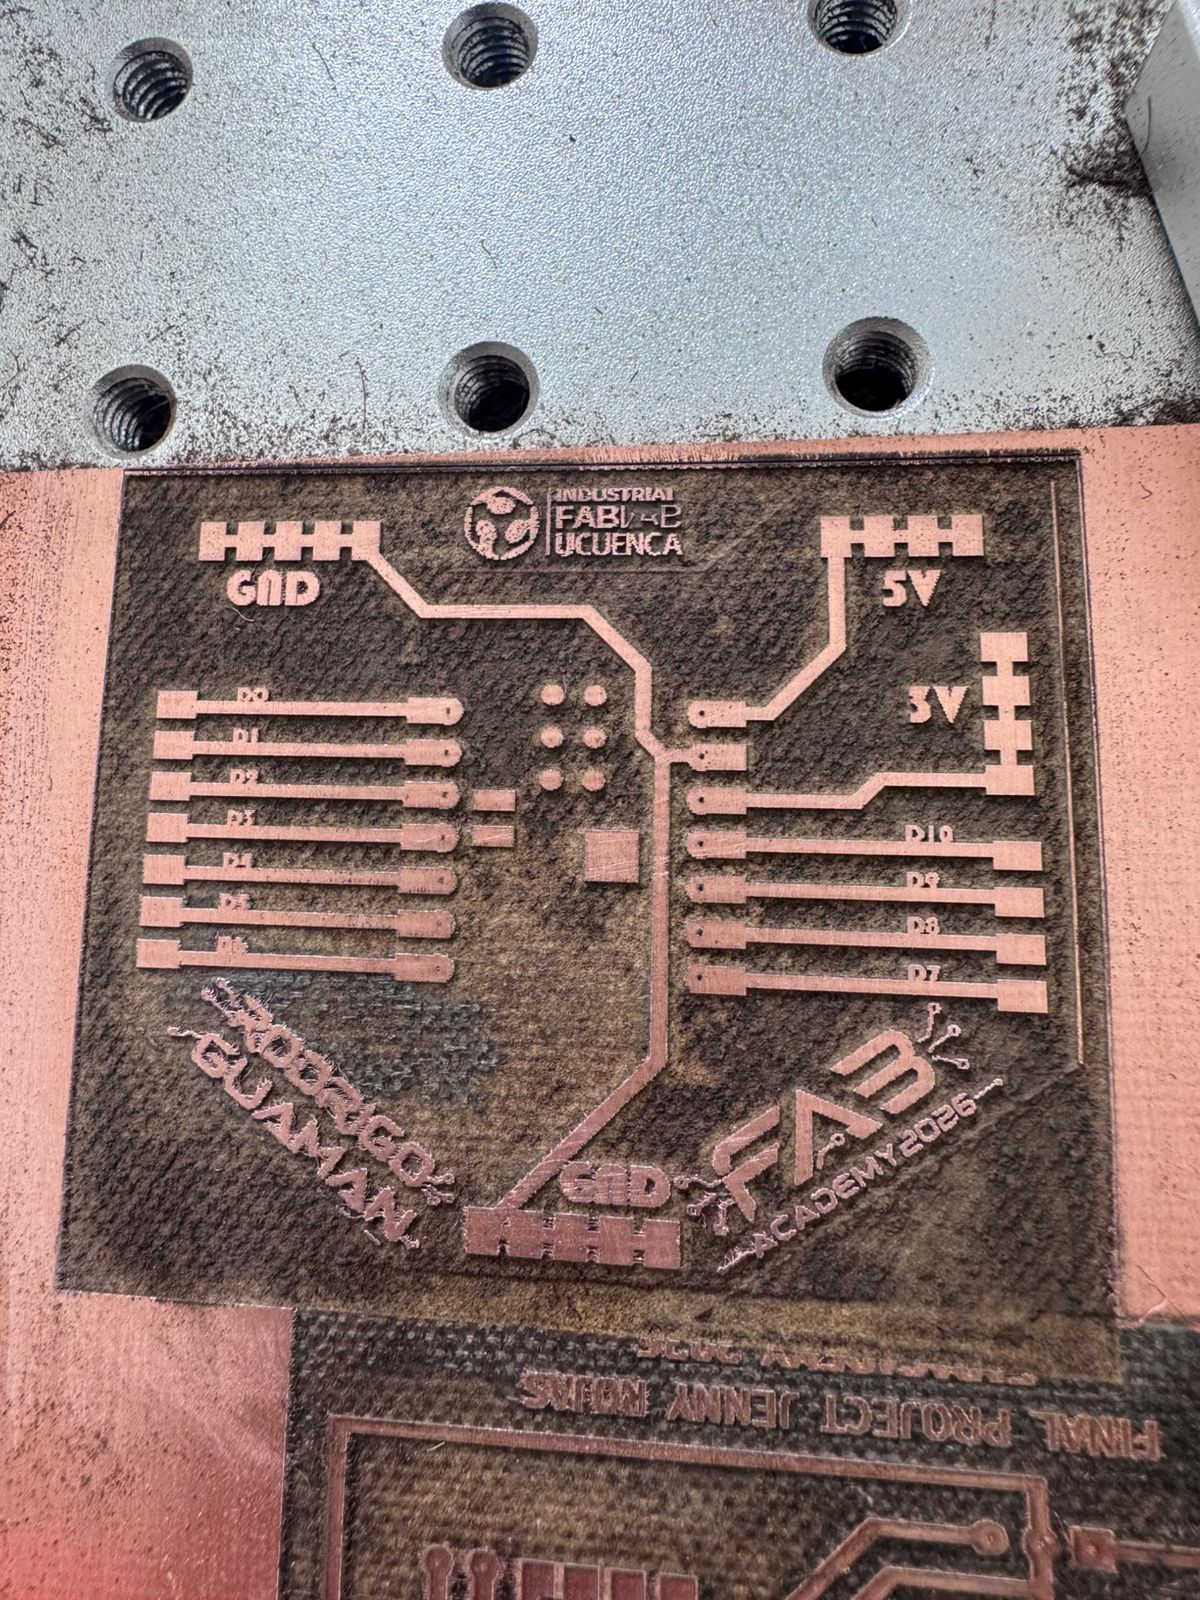
PCB Fabrication with Fiber Laser
For fabrication, the PCB design was transferred to the fiber laser workflow. The fiber laser was used to remove the unwanted copper from the board and define the final traces. This method made it possible to produce the board with visible text, logos, pads, and signal labels. After laser fabrication, the board was inspected to check that the traces were separated correctly and that there were no short circuits between adjacent copper areas.
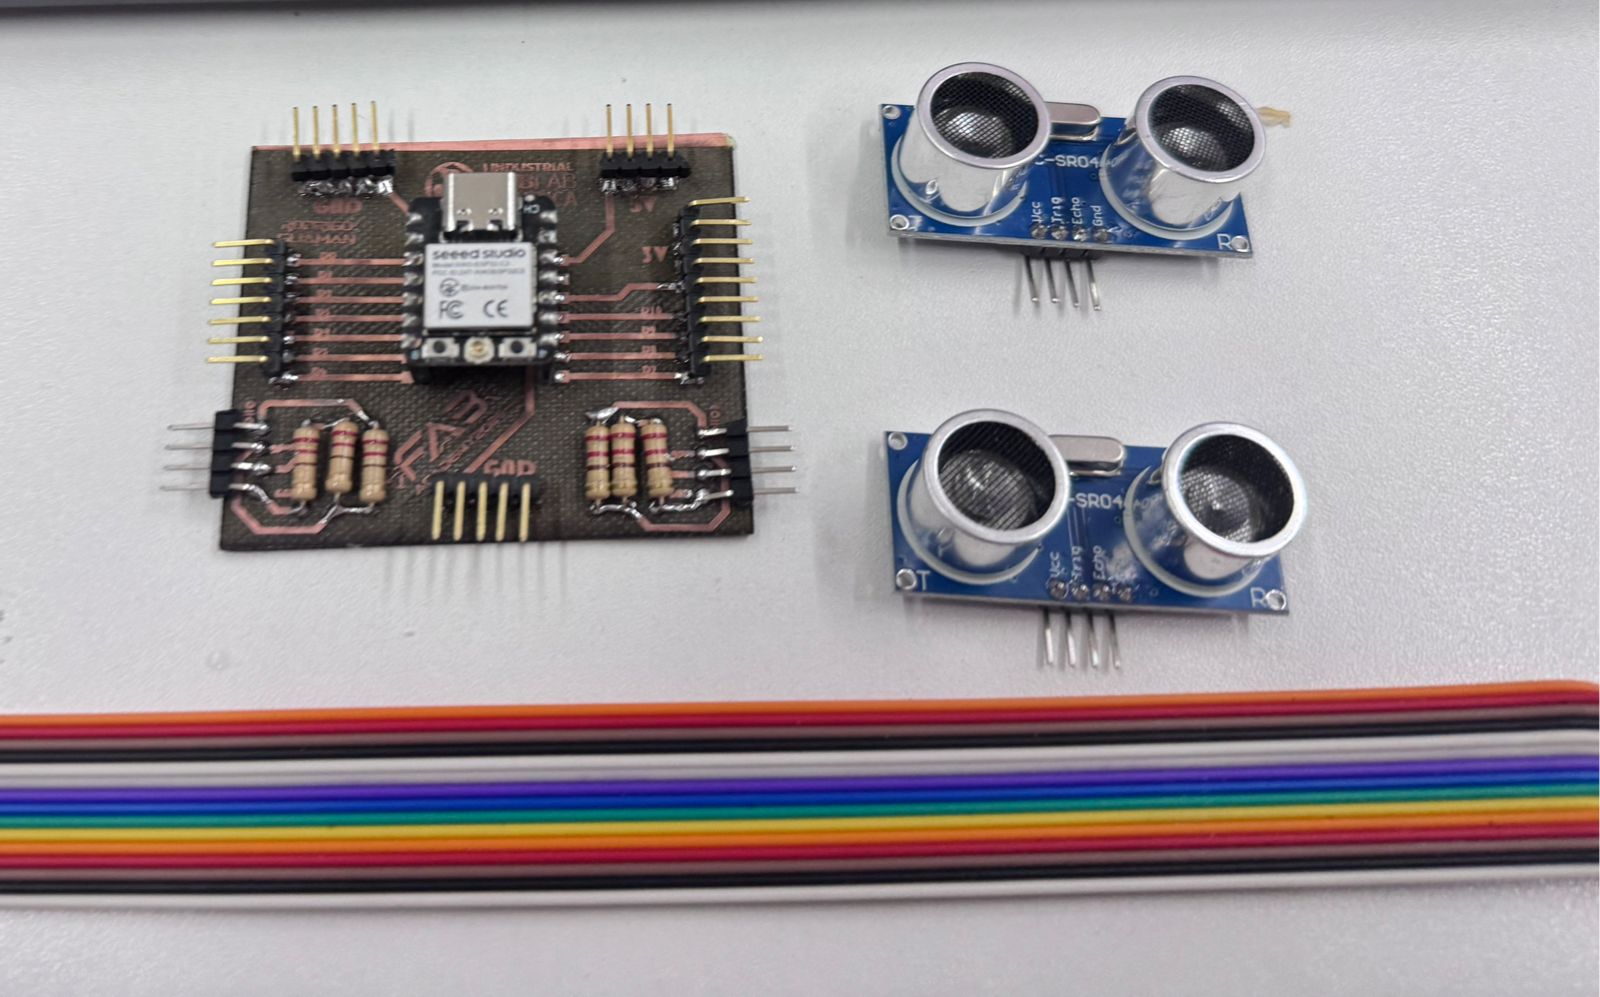
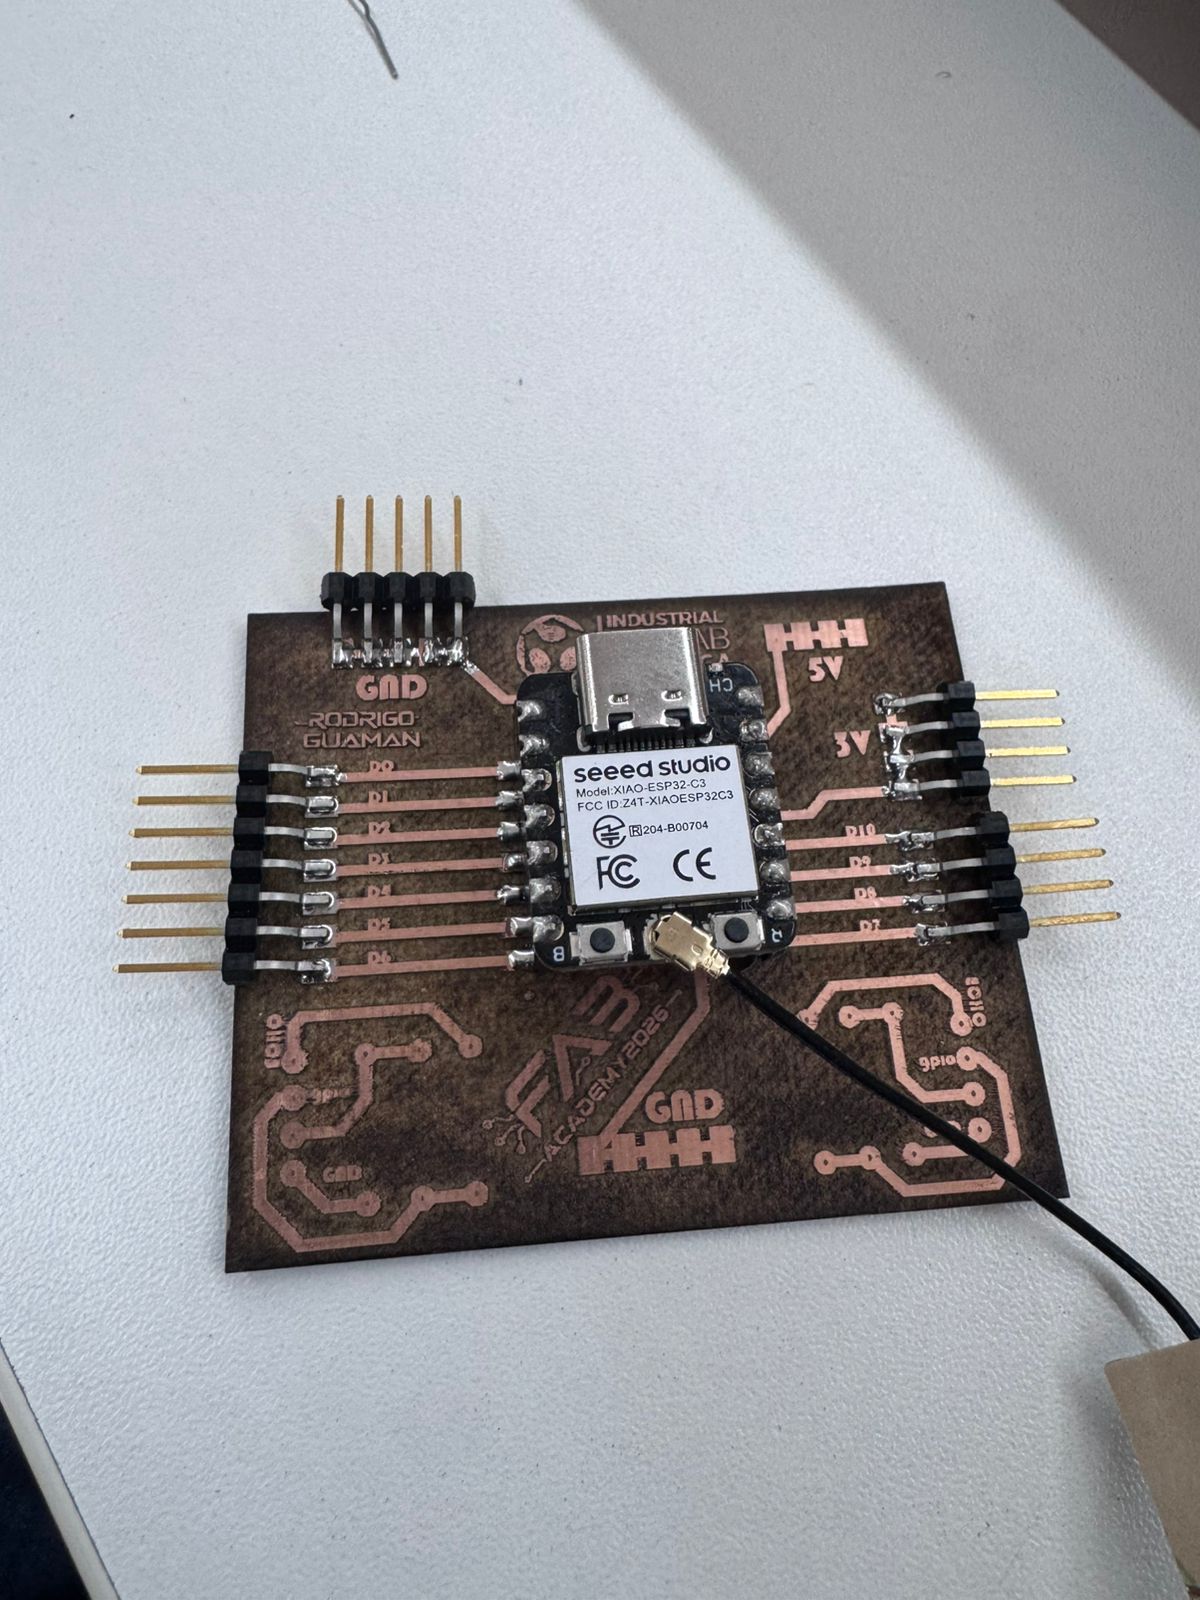
Assembly and Testing
After fabricating the board, I soldered the pin headers, resistors, and the XIAO ESP32-C3. The headers make the board modular because the HC-SR04 sensor and other project connections can be attached using jumper wires. The resistors form the voltage divider for the echo pin, which is important because the sensor module operates with 5V logic while the ESP32-C3 input should not receive a direct 5V signal.
The first tests were made outside the final case to verify continuity, pin access, and sensor wiring. After checking the electrical connections, the PCB was placed inside the 3D printed case designed during system integration. This made the electronic system safer, cleaner, and easier to present in the Smart Lean Cell.
Integration in the Final Project
The electronic system was integrated into the Smart Lean Cell as a visible control module. The PCB case is placed near the work area, while the ultrasonic sensor is positioned to detect objects in the assembly zone. This integration connects the mechanical system with the sensing system and supports the educational purpose of the project: showing how digital fabrication, electronics, and process monitoring can work together.
Downloadable Electronic Files
The following files document the electronic system and are included so the PCB and case can be reviewed, modified, or fabricated again.
7. Networking & Dashboard
For the networking layer of the final project I used Blynk as the web dashboard platform. The goal of this section was to connect the physical Lean Manufacturing cell with a real-time digital interface: the ESP32 XIAO C3 reads the two ultrasonic sensors, controls the status LEDs, calculates the cycle time of each part, and sends the production data to Blynk through WiFi.
Bill of Materials for the Dashboard System
| Component | Use in the System | Connection / Notes |
|---|---|---|
| XIAO ESP32-C3 | Main microcontroller with WiFi connection. | Programmed from Arduino IDE and connected to Blynk Cloud. |
| Custom PCB | Holds the ESP32, headers, power lines, sensor connectors and LED outputs. | Used as the electronic interface of the final project. |
| HC-SR04 Sensor 1 | Inventory sensor. Detects when a part is available or leaves the inventory area. | TRIG on D3, ECHO on D4. |
| HC-SR04 Sensor 2 | Finished-part sensor. Detects when a part reaches the end of the process. | TRIG on D8, ECHO on D9. |
| Status LEDs | Visual indication of inventory, process and finished-piece states. | Blue: inventory, Yellow: process, Red: finished part. |
| Resistors | Current limiting and signal conditioning. | Used in the PCB for LED lines and voltage protection. |
| Ribbon cables / jumper wires | Connect sensors, LEDs and the PCB during integration. | Used for modular testing and final assembly. |
| Blynk account and template | Cloud dashboard and datastream configuration. | Receives virtual pin data from the ESP32. |
Pinout Used in Arduino IDE
The code was written in Arduino IDE using the Blynk library. The two HC-SR04 sensors are used as digital measuring points: Sensor 1 represents the inventory entrance/exit condition, and Sensor 2 represents the finished station. The LEDs give local feedback even when the operator is not looking at the web dashboard.
| Function | Pin in Code | Description |
|---|---|---|
| Sensor 1 TRIG | D3 | Trigger signal for the inventory ultrasonic sensor. |
| Sensor 1 ECHO | D4 | Echo signal used to calculate distance at the inventory point. |
| Sensor 2 TRIG | D8 | Trigger signal for the finished-parts ultrasonic sensor. |
| Sensor 2 ECHO | D9 | Echo signal used to calculate distance at the finished station. |
| Blue LED | D0 | Indicates that there is a part in inventory. |
| Yellow LED | D1 | Indicates that at least one part is currently in process. |
| Red LED | D10 | Indicates that a finished part was detected. |
| Reset button | D2 | Resets counters, cycle values and production data. |
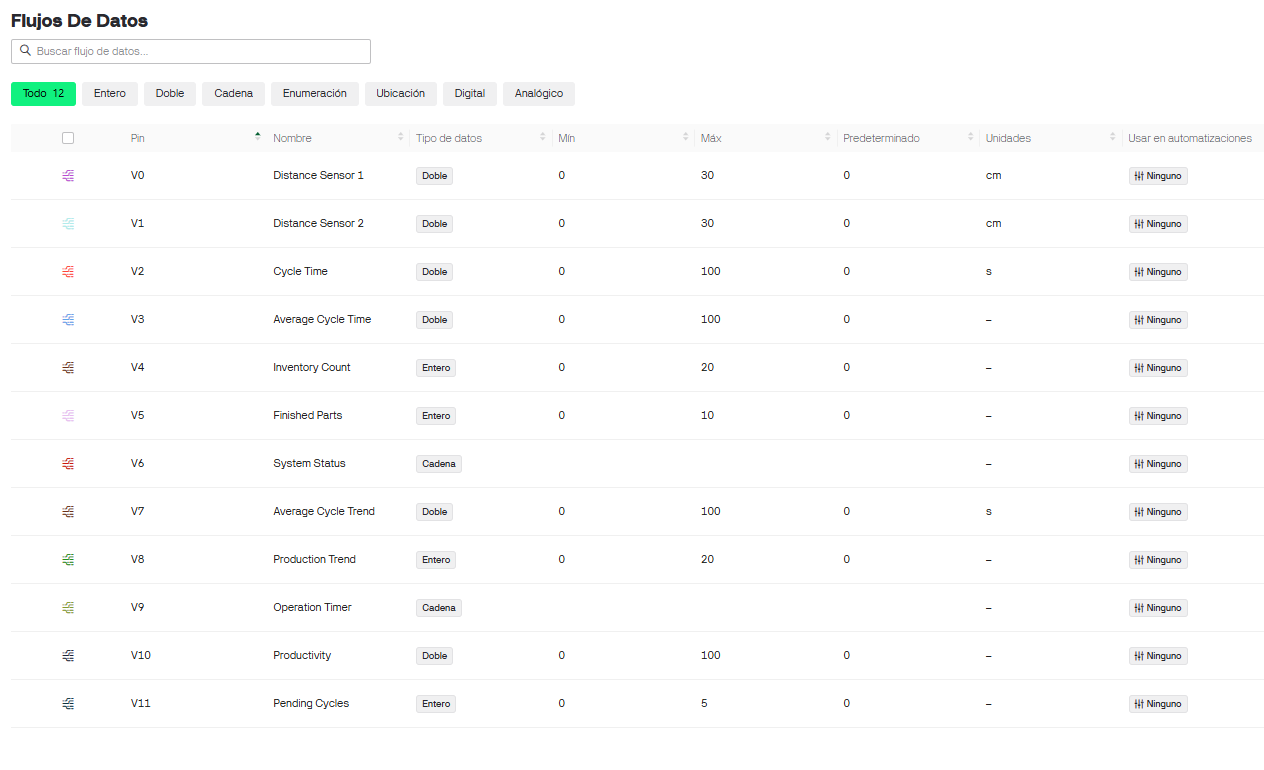
Blynk Virtual Pins
| Virtual Pin | Datastream | Purpose |
|---|---|---|
| V0 | Distance Sensor 1 | Inventory sensor distance in centimeters. |
| V1 | Distance Sensor 2 | Finished station sensor distance in centimeters. |
| V2 | Cycle Time | Last completed cycle time in seconds. |
| V3 | Average Cycle Time | Average of all completed cycles. |
| V4 | Inventory Count | Number of parts currently available in inventory. |
| V5 | Finished Parts | Total number of completed parts. |
| V6 | System Status | Text status: inventory, process, finished or waiting. |
| V7 | Average Cycle Trend | Trend value for average cycle-time graphing. |
| V8 | Production Trend | Trend value for completed production. |
| V10 | Operation Timer | Total operating time of the system. |
| V11 | Productivity | Production rate based on completed pieces over time. |
| V12 | Pending Cycles | Number of parts that have started but not finished. |
Cycle Logic
The system was designed to support more than one part in the production flow. This is important because the Lean cell can have one part already in process while another part is still in inventory. For that reason, the code does not depend on a single timer only; it stores pending cycle start times in a queue and closes them in order when the finished sensor detects a part.
Sensor 1 stops detecting. Cycle A starts.
Inventory status turns on while A is still moving.
The yellow LED remains on because there is an active cycle.
Cycle B starts and is added to the pending queue.
Sensor 2 detects a part and cycle A is calculated.
The system keeps one cycle open in the queue.
Sensor 2 detects again and cycle B is calculated.
Cycle Time Calculation
The rule for the time measurement is always the same: Sensor 1 stops detecting - the cycle starts. Sensor 2 detects - the cycle ends. The elapsed time is converted from milliseconds to seconds and then sent to Blynk as the last cycle time. The program also updates the average cycle time, the finished-parts counter and the productivity value.
| Indicator | Meaning |
|---|---|
| Blue LED | There is a piece in inventory. It can remain on even if another piece is already in process. |
| Yellow LED | There is at least one piece in process, meaning one or more cycles are pending. |
| Red LED | A finished piece was detected by Sensor 2. |
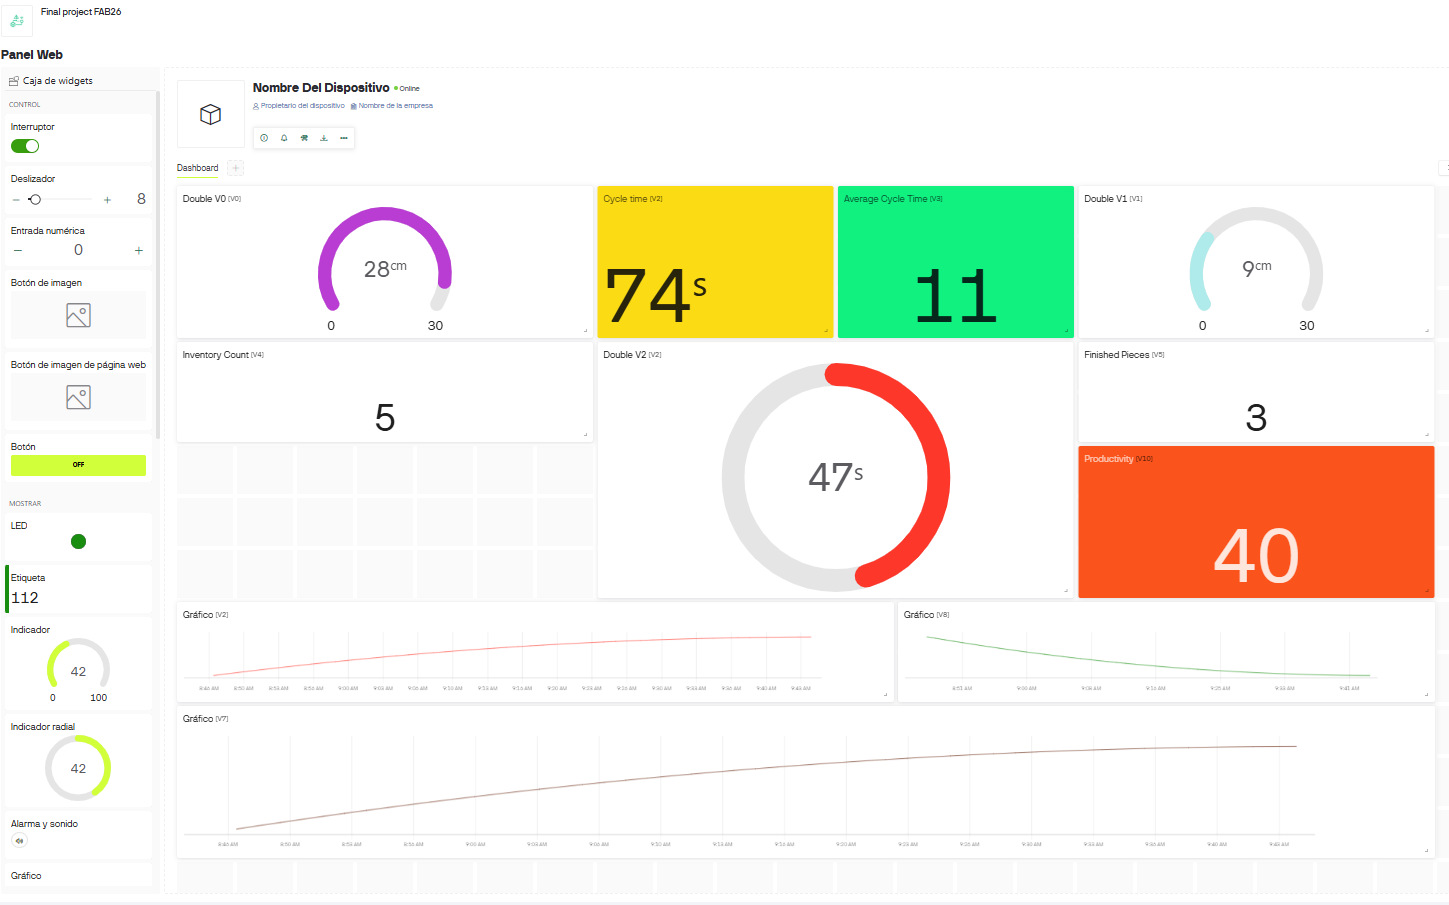
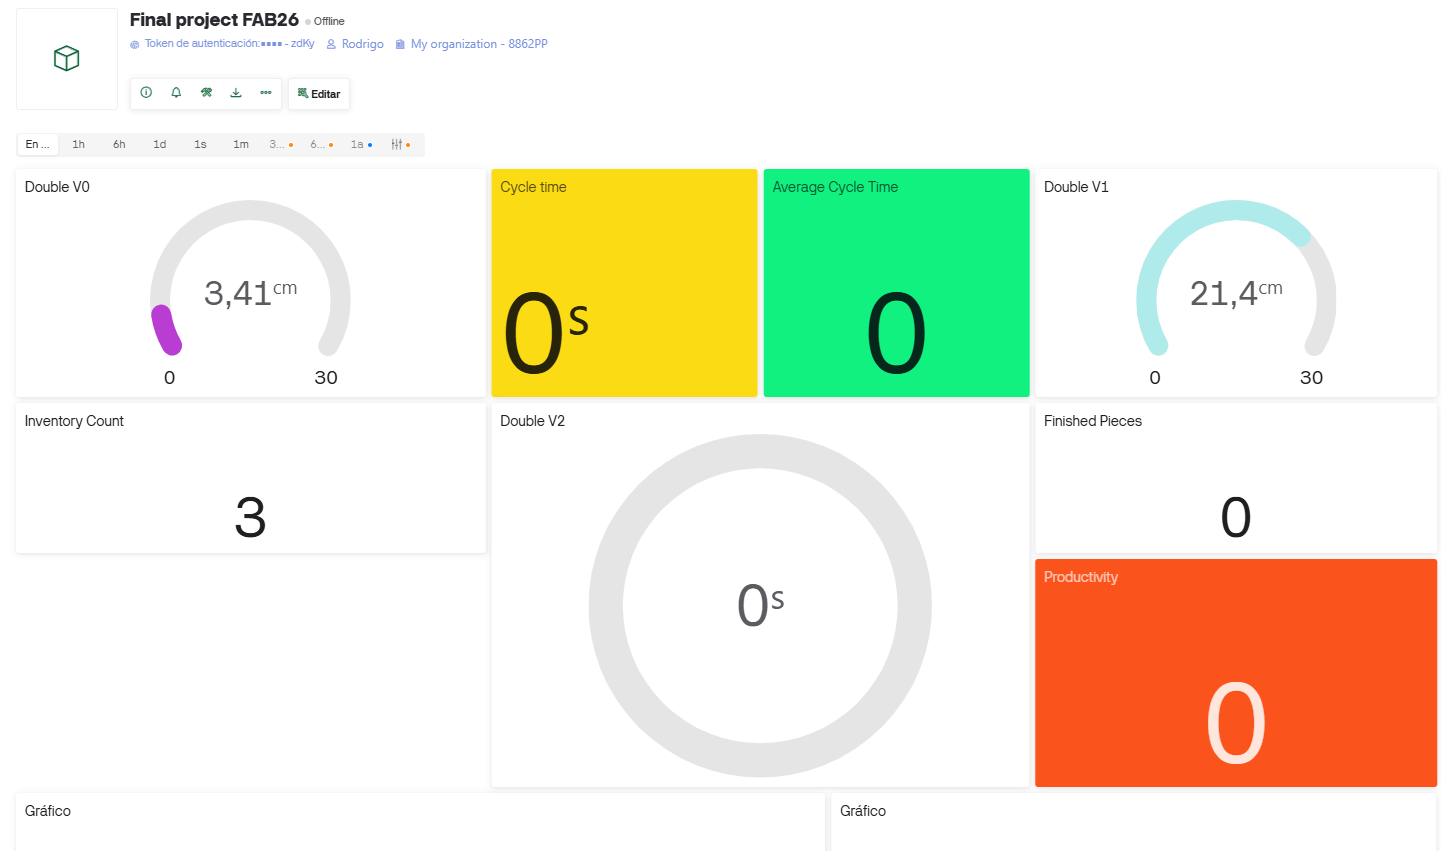
Blynk Dashboard Setup
In Blynk I created a template for the final project and configured the virtual datastreams used by the Arduino IDE
code. Each datastream receives a value from the ESP32 using Blynk.virtualWrite(). The dashboard then
displays distances, cycle time, average cycle time, inventory count, finished pieces, productivity and historical
trend graphs.
Arduino IDE Logic
The Arduino IDE code is the control layer between the physical prototype and the Blynk dashboard. It begins by defining the Blynk template, device name and authentication token. Then it loads the WiFi and Blynk libraries for the ESP32, so the XIAO ESP32-C3 can connect to the wireless network and send data to the web dashboard in real time.
The code assigns the HC-SR04 ultrasonic sensors to the digital pins of the PCB. Sensor 1 is connected to
D3 and D4, and it works as the inventory sensor. Sensor 2 is connected to
D8 and D9, and it works as the finished-parts sensor. The function
measureDistance() sends a short trigger pulse, waits for the echo response, and converts the measured
time into distance in centimeters. If the echo is not received, the function returns a large value so the system
understands that no object is present.
The most important part of the code is the cycle logic. The system compares the current state of each sensor with
the previous state. When Sensor 1 changes from detected to not detected, the program understands that a part has
left the inventory area and stores the starting time of a new cycle. This start time is saved inside an array named
cycleStartTimes. The variable pendingCycles keeps track of how many pieces are currently
in process.
When Sensor 2 detects a part, the code closes the oldest pending cycle. This works like a first-in, first-out queue: if Piece A starts first and Piece B starts after it, the next finished detection closes Piece A first. This is why the project can calculate overlapping production cycles instead of only measuring one part at a time.
| Code Block | How it Works |
|---|---|
| Blynk template and WiFi credentials | Identifies the device in Blynk and connects the ESP32 XIAO C3 to the WiFi network. |
| Pin definitions | Assigns TRIG, ECHO, LED and reset button pins according to the custom PCB wiring. |
measureDistance() |
Reads each HC-SR04 sensor and converts the echo time into centimeters. |
updateLEDs() |
Updates the local visual indicators for inventory, process and finished-part detection. |
| Cycle queue | Stores every cycle start time and closes them in order when a finished part is detected. |
| Reset button | Clears inventory count, finished parts, pending cycles, cycle time and average values. |
| Blynk virtual writes | Sends distance, cycle time, average, inventory, finished parts, productivity and status values to the dashboard. |
Cycle start: Sensor 1 changes from detected to not detected.
Cycle end:   Sensor 2 detects a finished piece.
Queue:       Each new start time is stored until a finished detection closes it.
Average:     Completed cycle times are accumulated and divided by the number of finished parts.
Dashboard:   Distances, counters, cycle time and productivity are sent to Blynk virtual pins.
The average cycle time is calculated by adding each completed cycle to totalCycleTime and dividing it
by the number of finished parts. The productivity value is calculated from the number of completed pieces and the
total operation time. These values are useful because the dashboard does not only show if the prototype works; it
also transforms the physical process into measurable Lean Manufacturing indicators.
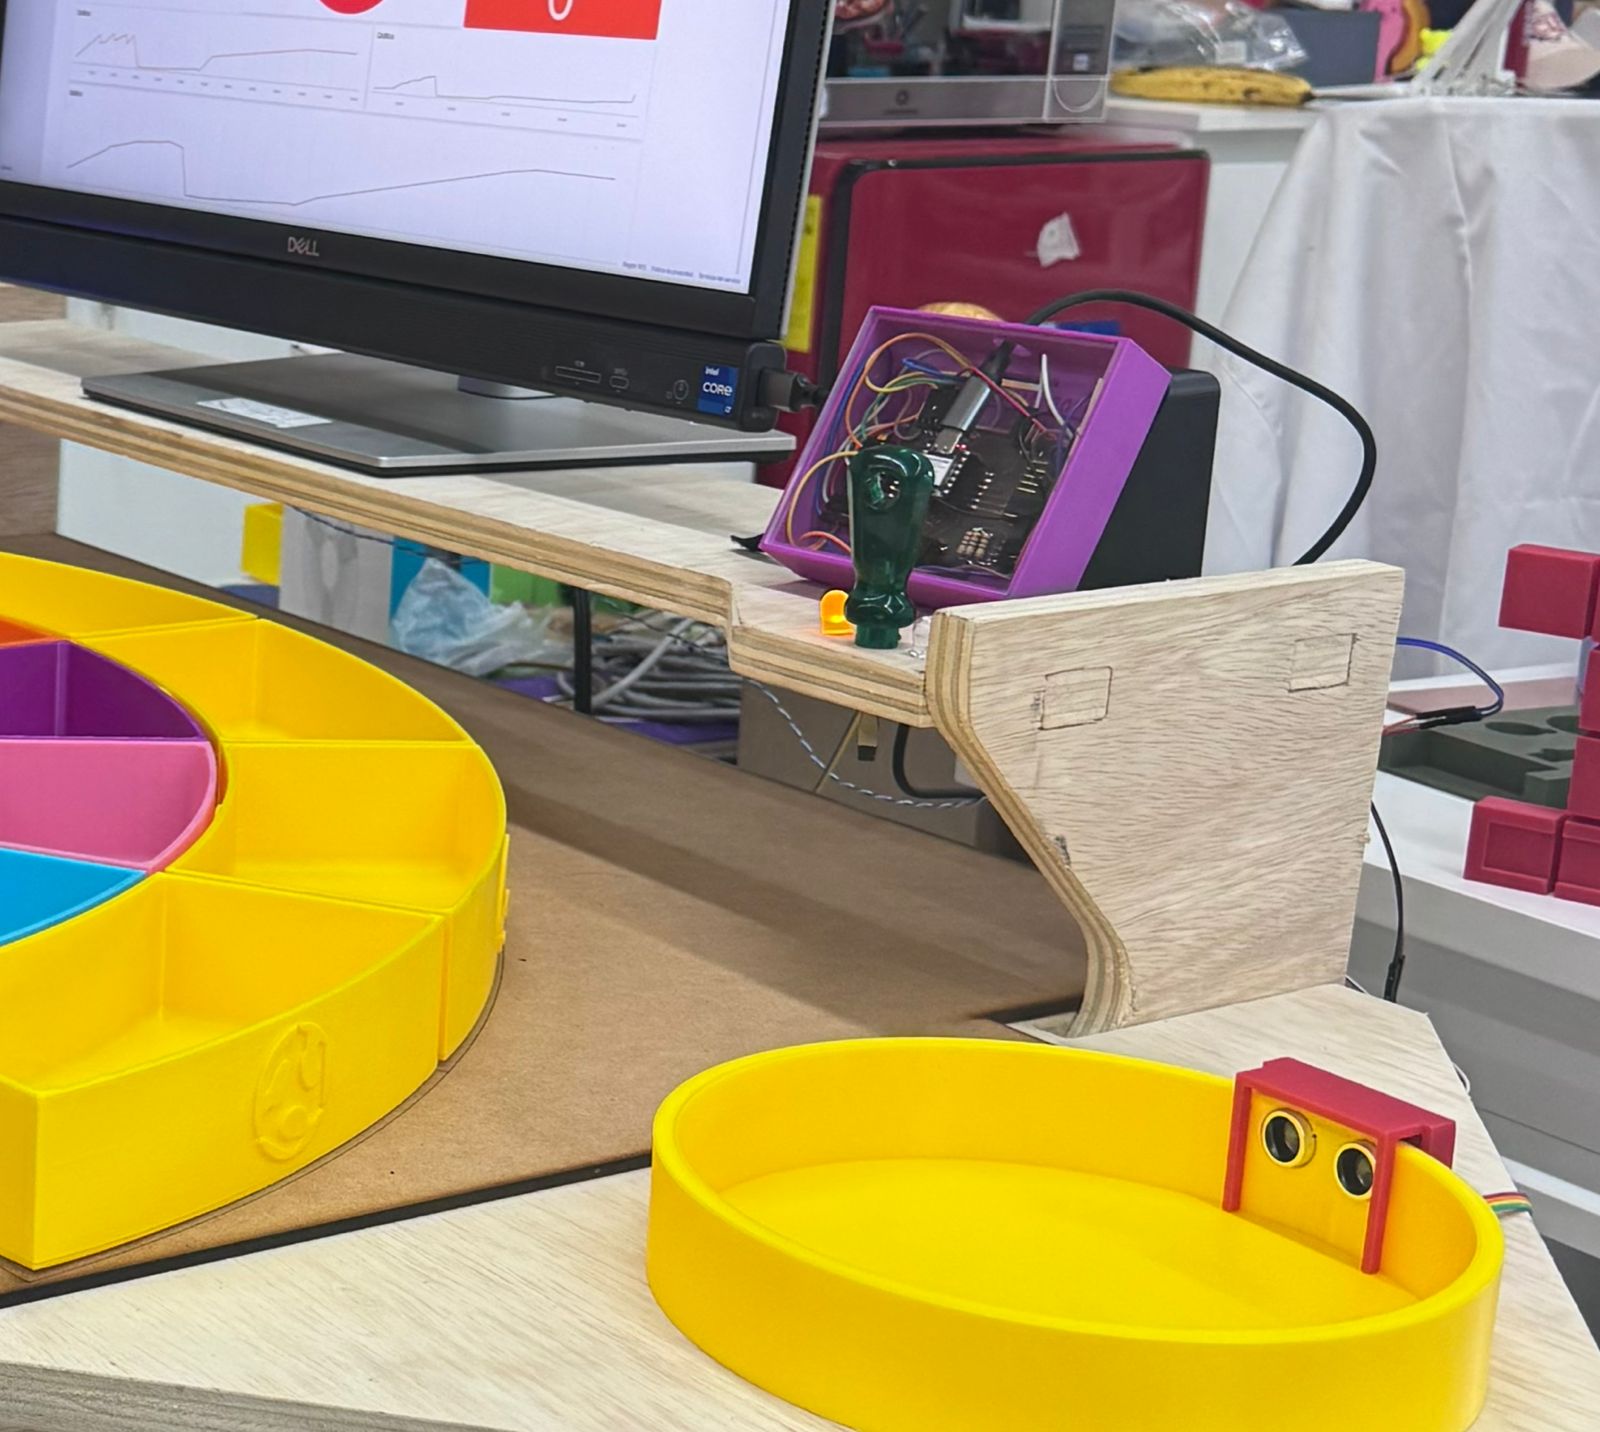
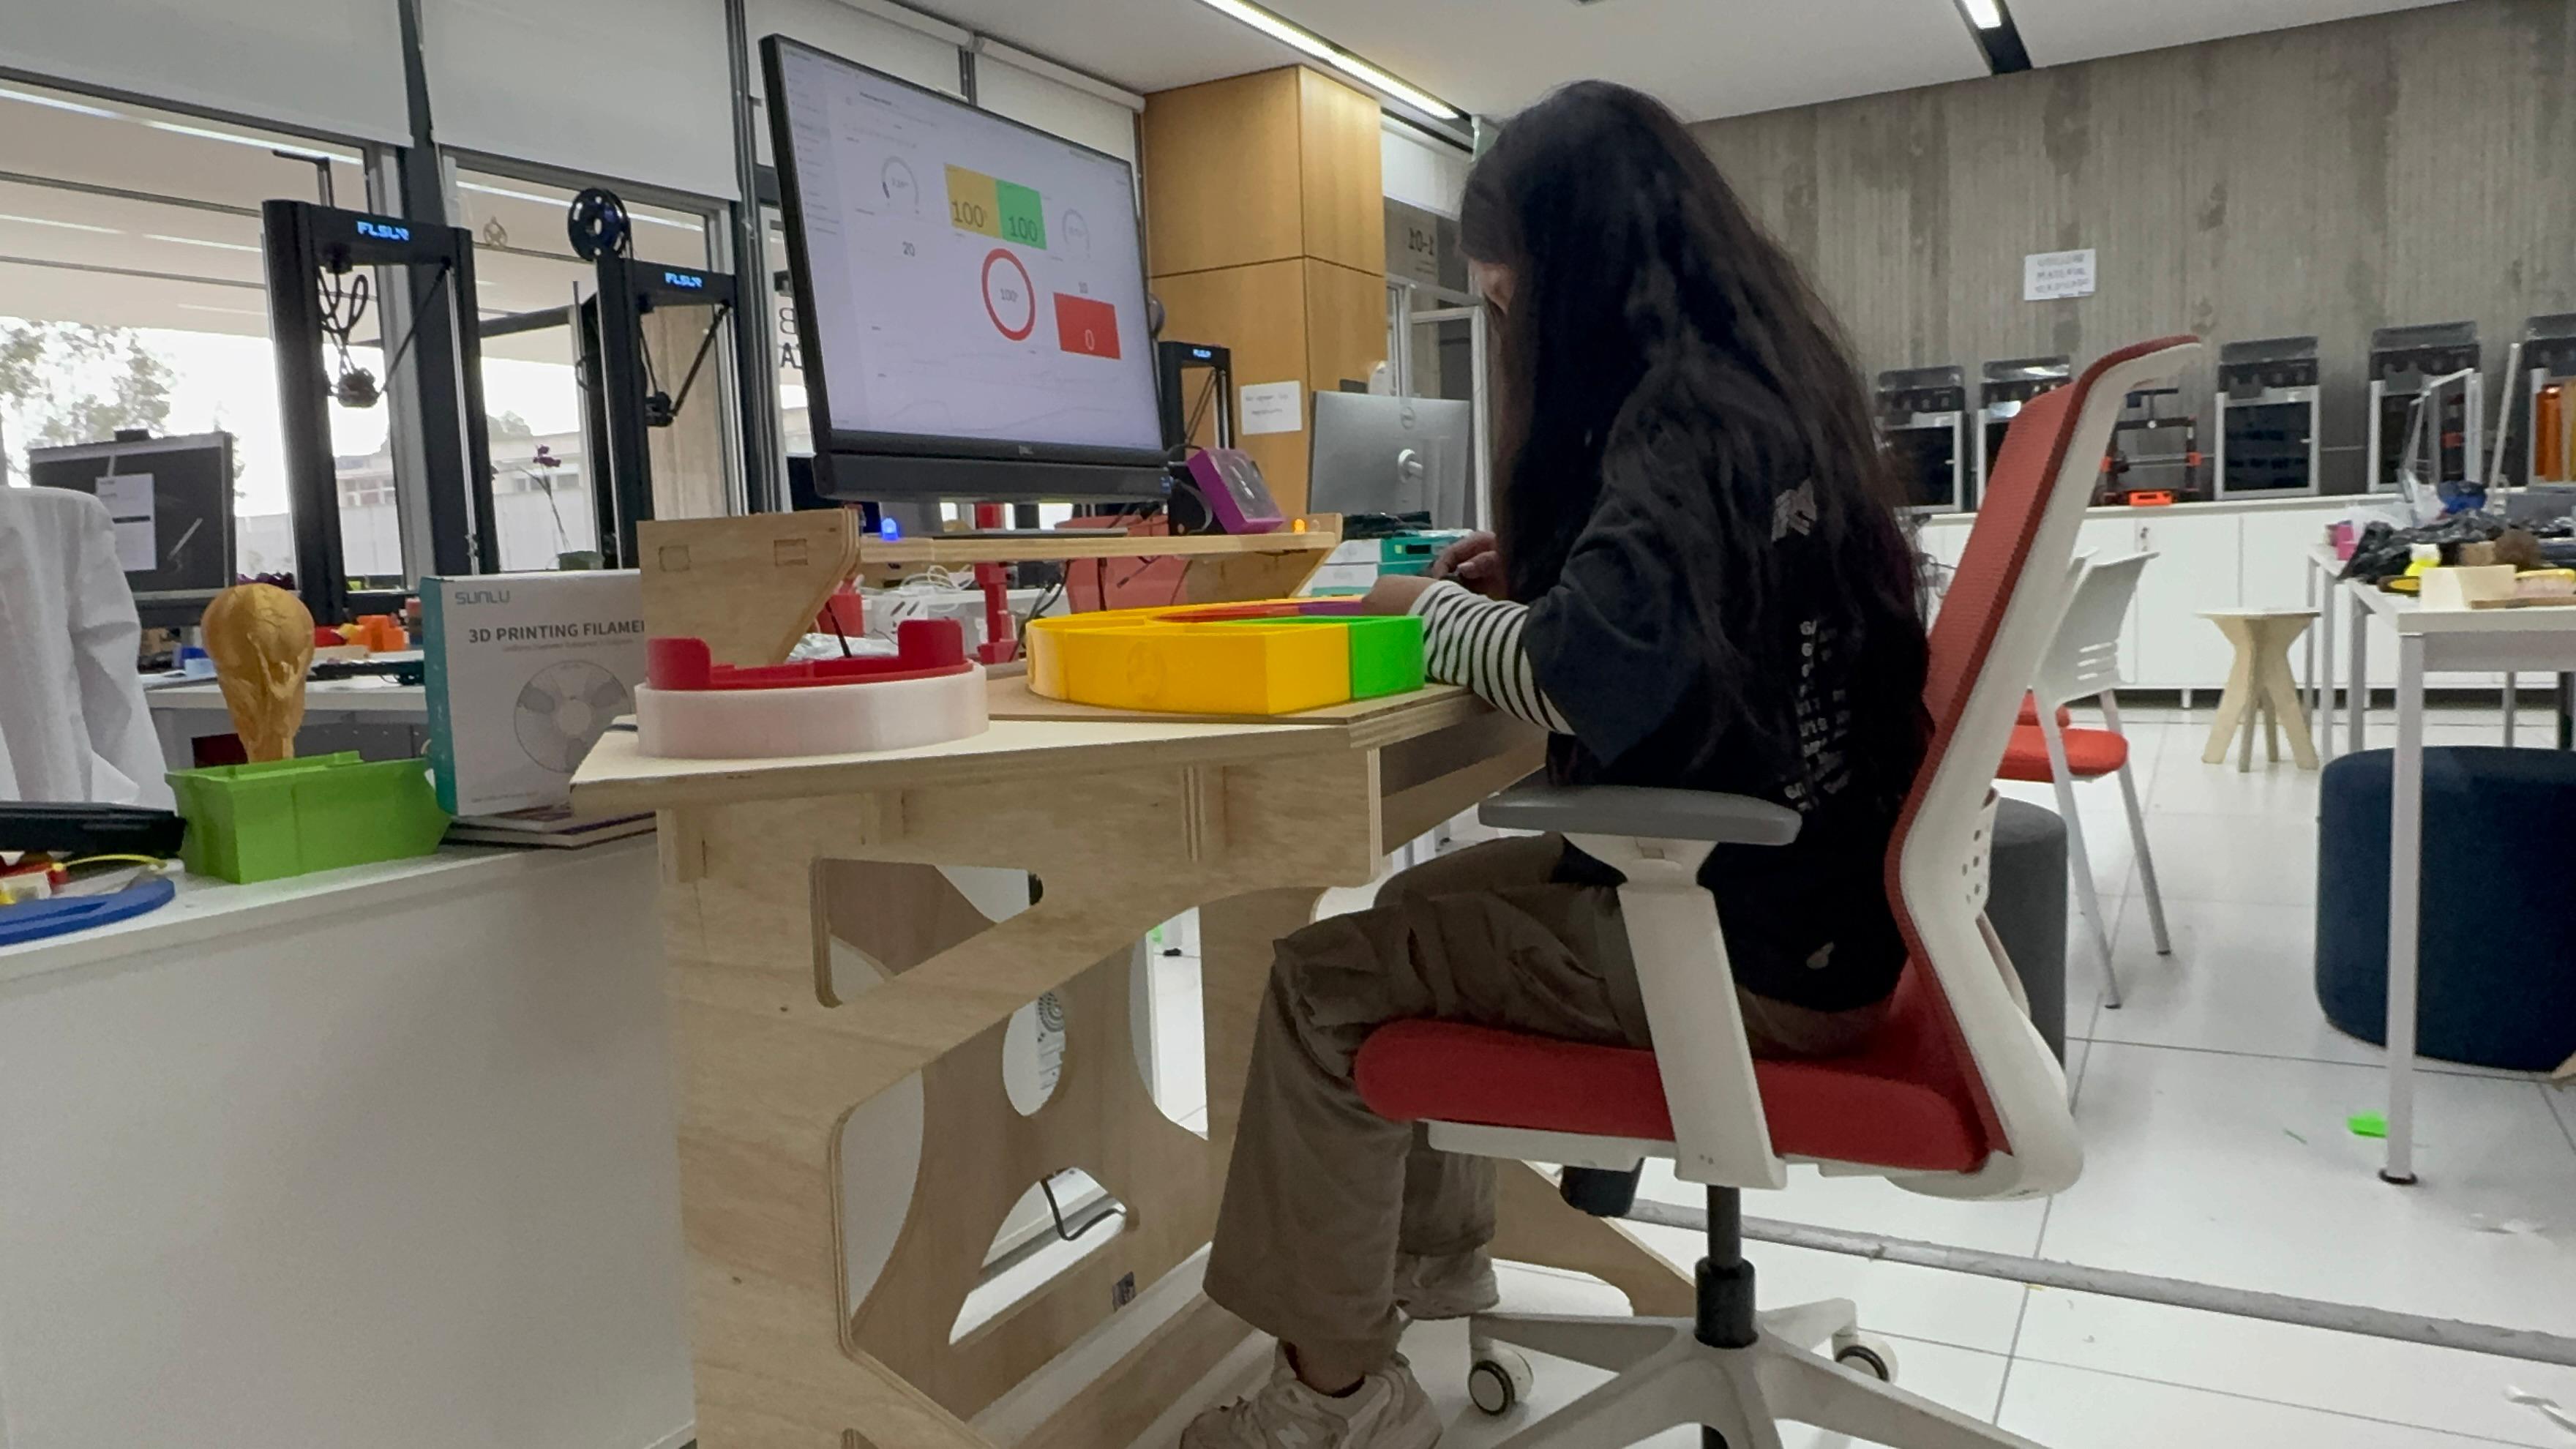
Complete Operation
During operation, the physical cell and the dashboard work together. The operator can see the LED states directly on the machine, while the Blynk panel records the same behavior digitally. This makes the system useful for Lean Manufacturing training because the student can compare physical movement with measurable indicators such as cycle time, average time, inventory and productivity.
IDE Code Download
The complete Arduino IDE code used for the Blynk dashboard, sensor reading, LED control and cycle-time calculation is available as a downloadable file.
8. Gamification - The Lean Challenge
Introduction
One of the main goals of the Kaizen Kart project is not only to measure production performance, but also to encourage continuous improvement through a gamified learning experience. Inspired by the Toyota Production System (TPS) and Lean Manufacturing principles, the workstation transforms a traditional assembly activity into an interactive challenge where users progressively improve productivity, reduce waste and understand how manufacturing systems evolve from disorder to optimization.
The concept is based on a simple idea: performance improvement should be visible, measurable and motivating. By integrating sensors, IoT monitoring, cycle-time measurement and a real-time dashboard, participants can immediately observe the impact of their decisions on the process.
Level 1 - Chaos
Push system baseline.
No standard work, disorganized material flow and high variability between cycles.
Level 2 - Synchronization
Lean process improvement.
5S, visual management, defined material locations and standardized assembly sequence.
Level 3 - Optimization
Smart manufacturing environment.
Embedded electronics, IoT dashboard, automatic cycle measurement and data-driven decisions.
Level 1 - Chaos (Push System)
The first level represents a traditional production environment with no standardized procedures, poor organization and a push-based workflow. At this stage, operators receive components without a defined process and perform assembly activities based on personal judgment rather than standardized methods.
Tools, components and materials may be scattered across the workstation, creating unnecessary movement and increasing the probability of errors. The objective of this level is to create a baseline measurement before any improvement initiative is introduced.
| Characteristics | Expected Observations | Learning Objective |
|---|---|---|
| No workstation organization, no standard instructions, excessive movement and search time. | Long cycle times, waiting time, motion waste, transportation waste and inconsistent performance. | Understand how process inefficiencies affect productivity and why standardization is necessary. |
Level 2 - Synchronization
The second level introduces Lean Manufacturing tools designed to eliminate waste and improve workflow synchronization. Instead of asking the operator to simply work faster, the focus is placed on improving the process itself. Participants analyze the results obtained during Level 1 and identify improvement opportunities.
Sort, set in order, shine, standardize and sustain the workstation.
Components are clearly identified and material locations are defined.
Operators follow a defined assembly sequence to reduce variability.
The workstation is redesigned to reduce motion, transportation, waiting and overprocessing.
After implementing these Lean tools, participants should observe reduced cycle times, more consistent assembly performance, improved workflow and increased production rate. The dashboard displays these improvements in real time, allowing direct comparison with the Chaos level.
Improve the process, and performance will follow.
Level 3 - Optimization
The third level represents a smart manufacturing environment where process performance is continuously monitored and analyzed using digital technologies. At this stage, the workstation becomes an Industry 4.0 platform capable of collecting, processing and visualizing production data in real time.
| Digital Technology | Application in Kaizen Kart |
|---|---|
| Embedded Electronics | A XIAO ESP32-C3 controls the system and processes sensor information. |
| Proximity Sensors | Two HC-SR04 sensors detect raw material removal and finished product placement. |
| IoT Communication | Production data is transmitted wirelessly to the Blynk platform. |
| Real-Time Dashboard | Displays cycle time, average cycle time, total production, pending assemblies, operating time and productivity. |
| Learning Curve Analysis | Historical charts show how cycle times decrease as the operator repeats the task. |
At this level, decisions are no longer based only on observation. The system provides objective performance indicators that support root-cause analysis, continuous improvement, performance benchmarking and standard work validation.
Comparison Between Levels
| Metric | Level 1: Chaos | Level 2: Synchronization | Level 3: Optimization |
|---|---|---|---|
| Organization | Poor | Structured | Fully standardized |
| Cycle Time | High | Medium | Low |
| Variability | High | Reduced | Minimal |
| Waste | High | Reduced | Controlled |
| Data Collection | Manual | Partial | Automatic |
| Dashboard | No | Limited | Real-time |
| Productivity | Low | Improved | Optimized |
| Learning Curve | Hidden | Partially visible | Fully measurable |
Educational Value
The Lean Challenge transforms a simple assembly activity into a complete learning experience that combines Lean Manufacturing, Toyota Production System principles, Industry 4.0, embedded electronics, IoT systems, data analytics and continuous improvement.
By progressing through the three levels, participants experience firsthand how manufacturing systems evolve from chaos to optimization. Rather than simply teaching theory, Kaizen Kart allows users to observe, measure and validate the impact of Lean principles using real production data.
9. Fab Academy Integration
The Smart Lean Cell was developed as an integrated Fab Academy final project. It combines the skills documented throughout the weekly assignments: project planning, 2D and 3D design, subtractive fabrication, additive fabrication, electronics design and production, embedded programming, input devices, networking, interface design, system integration and final project documentation.
The table below shows how each assignment contributed to the final project. The objective is to demonstrate that the final prototype is not an isolated object, but the result of applying the full Fab Academy learning path to a child-focused STEM system for introducing Lean Manufacturing, TPS and optimization through gamification.
| Week | Assignment Contribution | Application in Smart Lean Cell | Final Project Evidence |
|---|---|---|---|
| Week 1 | Project management, documentation workflow and initial final project planning. | Defined Smart Lean Cell as a Fab Academy final project and organized the documentation structure. | Final project page, development timeline and iterative documentation. |
| Week 2 | Computer-aided design and digital modeling. | Used CAD thinking to design the assembly station, compartments, PCB case and modular learning tools. | 2D/3D design files, Fusion 360 models and visual documentation. |
| Week 3 | Computer-controlled cutting and parametric fabrication logic. | Applied laser cutting for the Kanban-style organization panel and visual work references. | Laser-cut physical panel, DXF file and process videos. |
| Week 4 | Embedded programming. | Developed the programming logic needed to control microcontrollers and understand sensor behavior. | Foundation for the ESP32 logic used later for cycle timing, LEDs and reset behavior. |
| Week 5 | 3D scanning and 3D printing. | Used additive fabrication to produce tray compartments, bins and physical learning accessories. | 3D printed Kanban trays, inventory compartments and finished-product areas. |
| Week 6 | Electronics design. | Designed a custom PCB around the XIAO ESP32-C3 for sensors, power and wiring organization. | KiCad schematic, PCB layout, voltage divider and downloadable board files. |
| Week 7 | Computer-controlled machining. | Fabricated the structural assembly module using CNC machining and press-fit construction. | CNC-cut module, no-glue assembly, DXF file and machining documentation. |
| Week 8 | Electronics production. | Applied PCB fabrication and soldering knowledge to manufacture and assemble the Smart Lean Cell control board. | Fabricated PCB, soldered headers and documented electronic assembly. |
| Week 9 | Input devices. | Integrated HC-SR04 ultrasonic sensors to detect inventory exit and finished-product arrival. | Sensor 1 and Sensor 2 logic used to start and stop cycle measurement. |
| Week 10 | Output devices. | Used LEDs and dashboard indicators to provide immediate visual feedback to children. | Status LEDs for inventory, in-process and finished conditions. |
| Week 11 | Networking and communication. | Connected the ESP32 XIAO C3 to Blynk using WiFi and virtual pins. | Blynk datastreams, live dashboard and demo video. |
| Week 12 | Mechanical design and machine/system thinking. | Defined the relationship between structure, user position, assembly flow and sensor placement. | Integrated workstation geometry and functional layout. |
| Week 14 | Midterm review and project consolidation. | Reviewed progress, clarified the Smart Lean Cell scope and identified what still needed integration. | Project refinement before final electronics, dashboard and packaging work. |
| Week 15 | Interface and application programming. | Designed the user-facing dashboard logic and visual indicators for interpreting process performance. | Blynk dashboard layout, virtual pins, gauges, counters and graphs. |
| Week 16 | System integration. | Designed the electronics case, mounted the PCB and integrated wiring, sensors and structure. | 3D printed PCB case, assembly inside the workstation and downloadable 3MF file. |
| Week 18 | Applications, implications and project development. | Defined who the project is for, what it does, what it costs, what remains open and why it matters. | Final project requirements, BOM, implications and learning objectives. |
| Week 19 | Invention, intellectual property and income. | Supported decisions about dissemination, authorship, licensing and future educational use. | License, acknowledgements and future development strategy. |
| Week 20 | Final project requirements. | Prepared the final documentation package, project summary, files, media and final validation evidence. | Final page, presentation assets, downloadable design files and compliance checklist. |
Fab Academy Final Project Requirements Covered
| Requirement | How It Was Covered |
|---|---|
| 2D design | Laser-cut Kanban panel, CNC assembly station geometry and visual organization references. |
| 3D design | Fusion 360 models, 3D printed tray compartments, PCB case and modular accessories. |
| Additive fabrication | 3D printed component bins, inventory compartment, finished-product area and electronics case. |
| Subtractive fabrication | CNC-machined assembly module and laser-cut physical organization panel. |
| Electronics design and production | Custom XIAO ESP32-C3 PCB designed in KiCad and fabricated with fiber laser. |
| Embedded programming | Arduino IDE code for sensors, LEDs, counters, reset button, cycle queue and productivity calculations. |
| Input and output devices | HC-SR04 sensors as inputs; LEDs and Blynk dashboard indicators as outputs. |
| Networking | WiFi communication between ESP32 and Blynk cloud dashboard. |
| System integration and packaging | Mechanical structure, Lean tools, electronics, sensors, dashboard and gamification levels integrated into one prototype. |
| Original design files | DXF, 3MF, F3D, G-code, KiCad files and Arduino code included as downloadable files. |
11. Final Reflection and Acknowledgements
This final project was much more than the construction of a prototype. It was a complete learning process where digital fabrication, electronics, programming, system integration, design thinking and educational validation came together in one physical system. Through the Smart Lean Cell, I learned how every decision in a project has a direct impact on usability, reliability, assembly, maintenance and learning value.
The most important lesson was understanding that an integrated project is not only the sum of its parts. The CNC structure, the 3D printed modules, the custom PCB, the sensors, the Blynk dashboard and the gamified learning sequence only became meaningful when they started working together as a complete experience. This helped me see fabrication as a cycle of design, testing, error, correction and improvement.
I am deeply grateful to Fab Academy and the Fab Foundation for creating a global learning ecosystem where making, sharing and documenting are part of the same culture. I also thank the Career of Industrial Engineering, Jenny Rojas and Industrial FabLab UCuenca for providing the infrastructure, guidance and support that made this project possible.
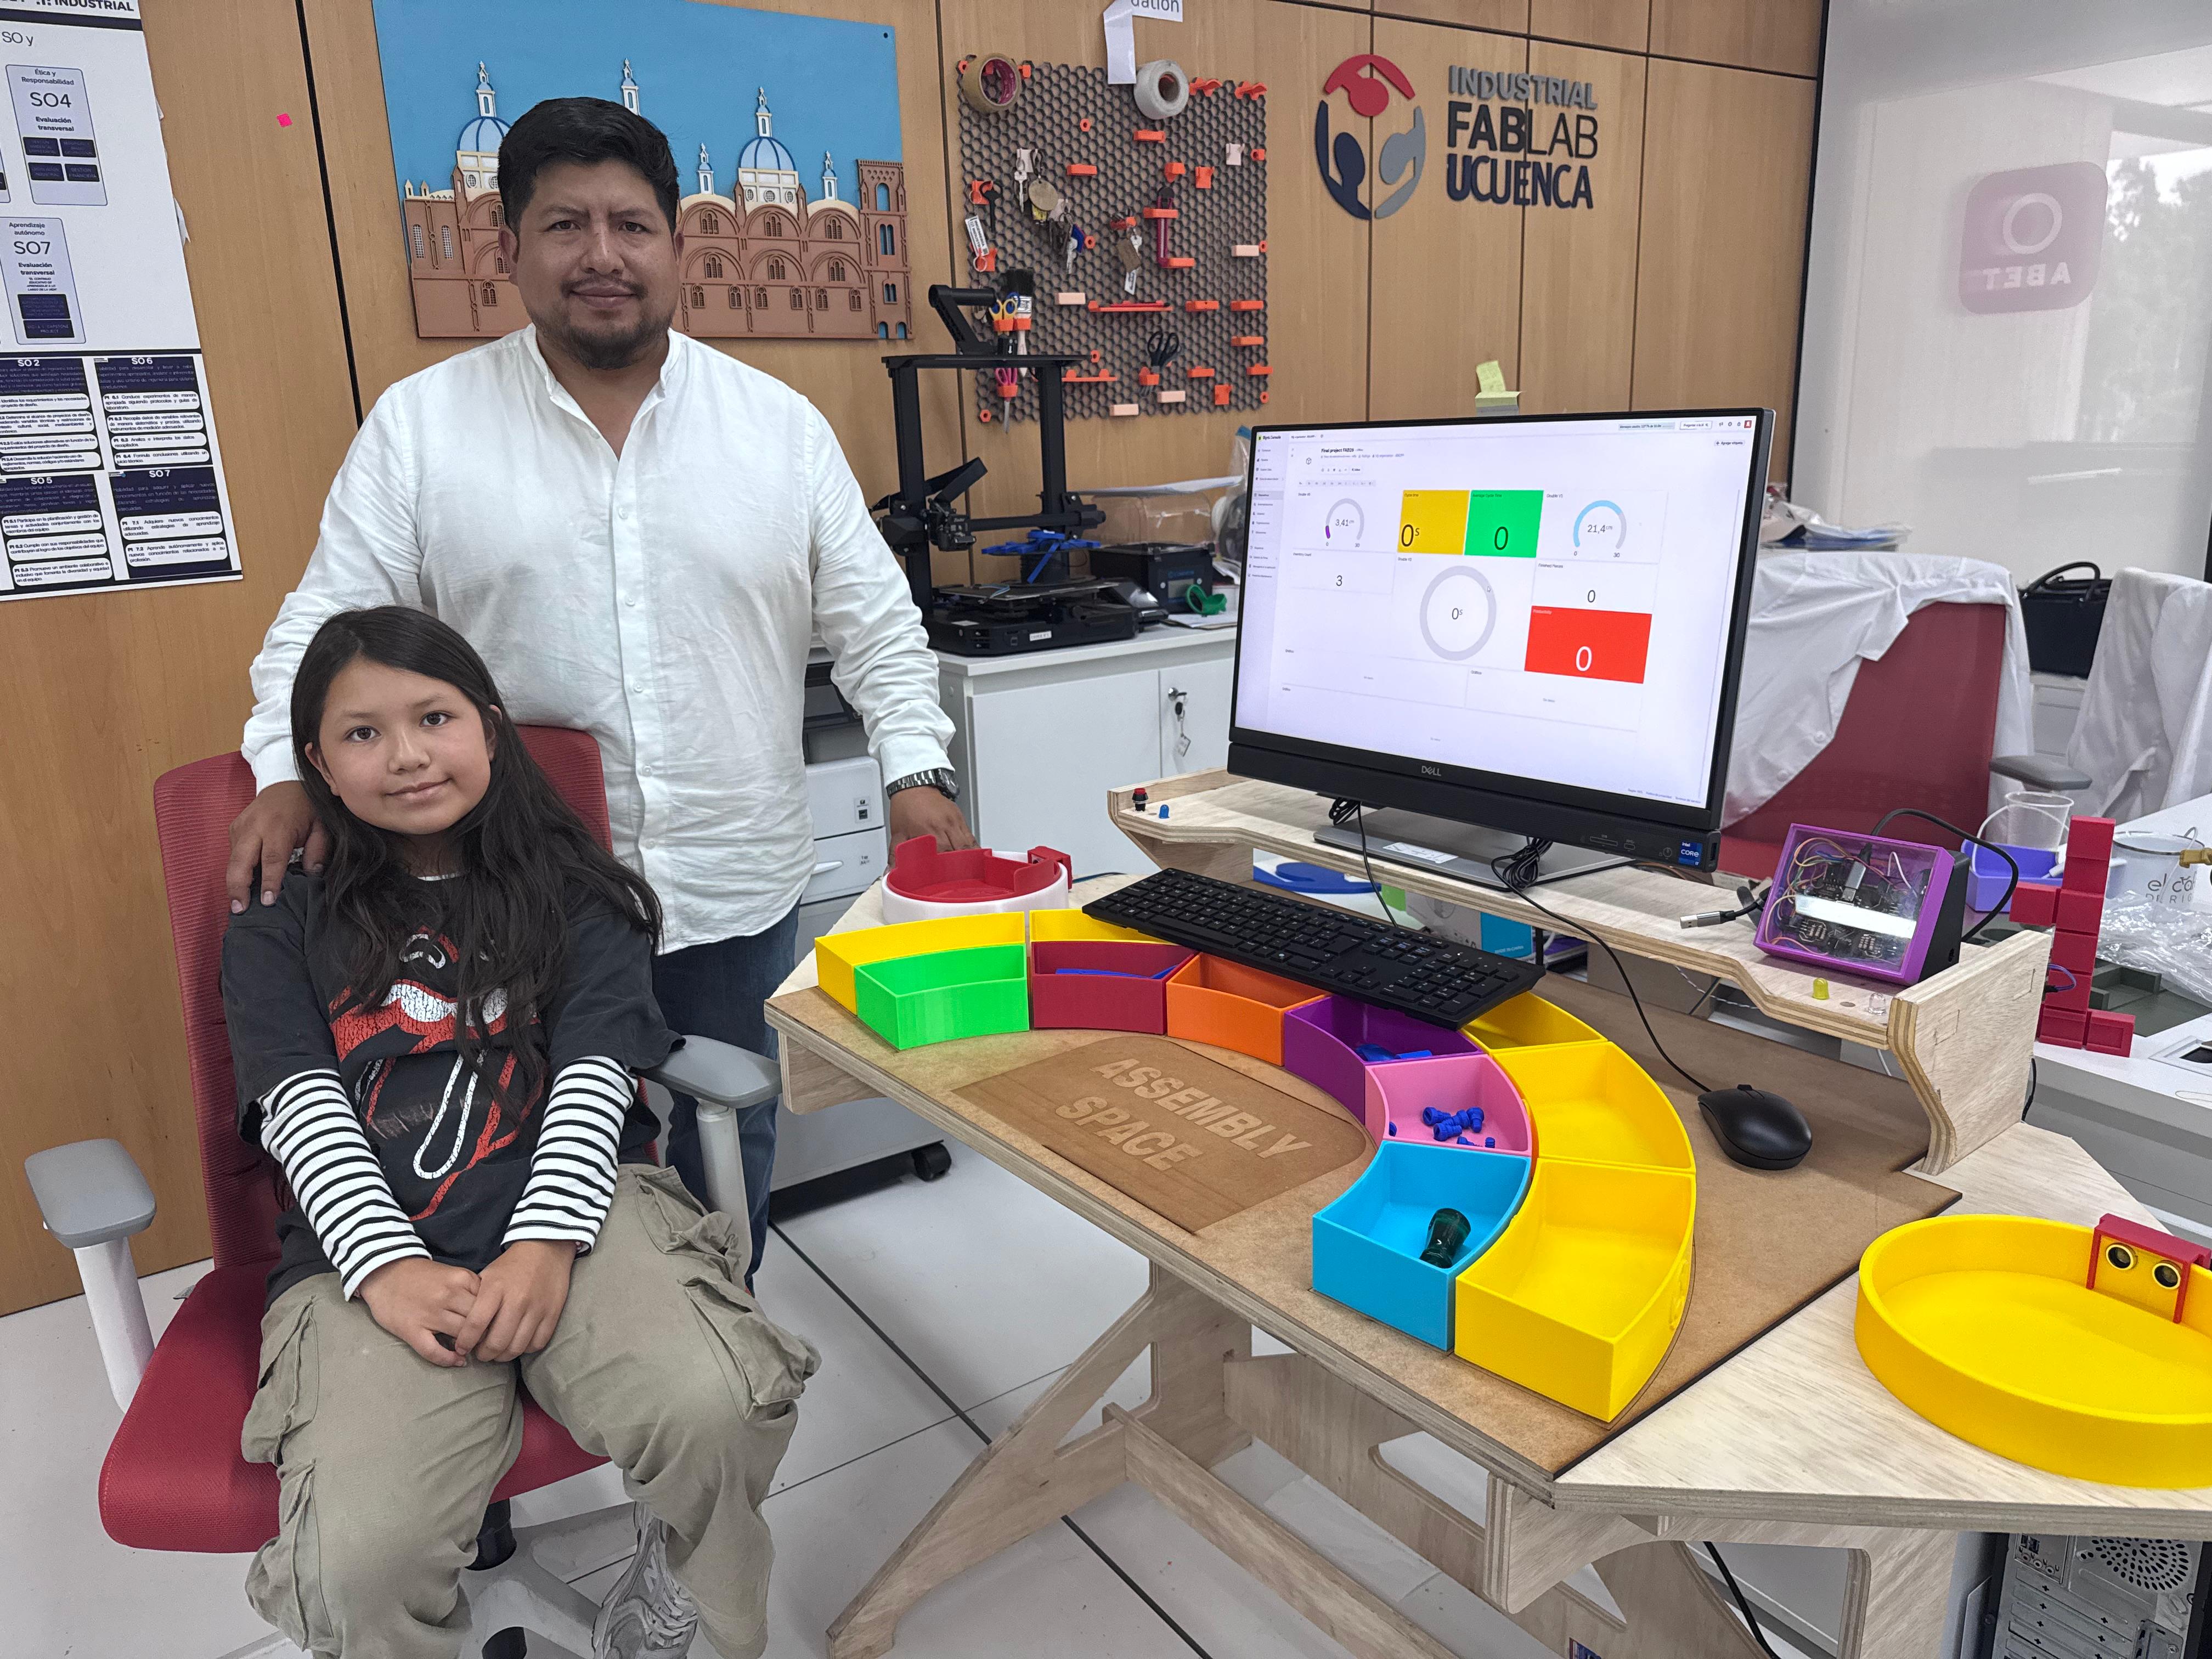
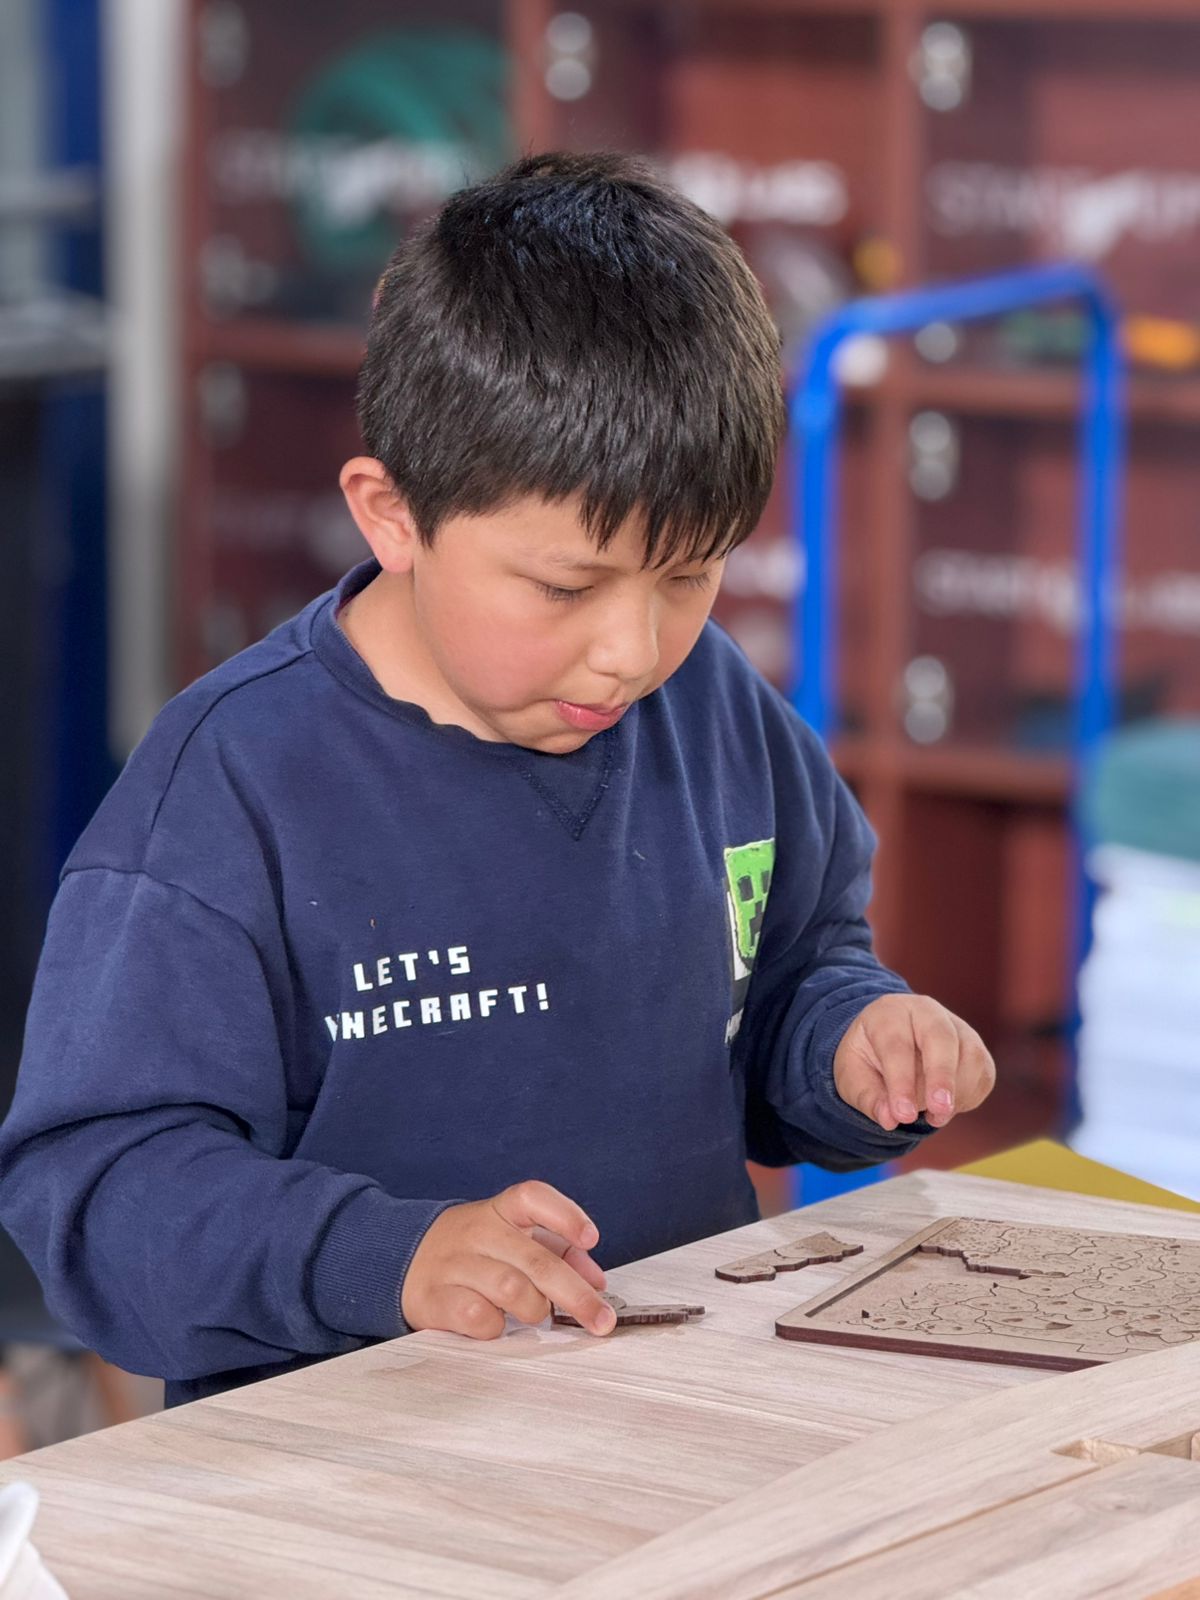
I want to give a very special thanks to Sofia Guaman and Carlos Guaman, who validated the project with patience, curiosity and constant support during the construction and testing process. Their participation helped me confirm that the project could work not only as a technical prototype, but also as a learning tool that can be understood and used by real people.
I also thank the University of Cuenca for having the vision to support spaces where education, technology and fabrication can meet. My gratitude goes as well to Neil Gershenfeld for his classes and vision, to the Center for Bits and Atoms (CBA) at MIT, and to the ZOI Node in Ecuador for being part of the academic and technical network that supports this learning journey.
At the end of this process, I understand that making is also a way of thinking. Every cut, printed part, soldered component, line of code and test with users became evidence of learning. This project closes one stage of Fab Academy, but also opens a path to keep improving how industrial engineering can be taught through real, measurable and human-centered systems.