WEEK 15 — Interface and Application Programming
Group Assignment — Comparing tool options for user interfaces, dashboards, IoT applications, mobile apps, web apps, and SCADA-style systems for embedded boards.
Personal Contributions
| Name | University | Activities carried out |
|---|---|---|
| Rodrigo Guamán | Universidad de Cuenca |
|
| Jenny Rojas | Universidad de Cuenca |
|
| Diego Zhindón | Universidad Politécnica Salesiana |
|
Group Assignment Checklist
This section documents the group work for the Interface and Application Programming assignment. The objective was to compare as many tool options as possible for creating applications and user interfaces that communicate with embedded microcontroller boards.
- ☑ Compared multiple interface and application programming tools.
- ☑ Compared web, mobile, desktop, IoT dashboard, and SCADA-style options.
- ☑ Identified communication protocols used by different interface tools.
- ☑ Compared tools according to programming language, difficulty, and use case.
- ☑ Related interface tools to embedded boards, inputs, and outputs.
- ☑ Documented the group research process on the group assignment page.
Group Assignment – Tool Comparison
The group assignment for this week asked us to compare as many tool options as possible. Since the topic is Interface and Application Programming, we focused on tools that allow a user to interact with an embedded system.
The tools compared in this page include IoT dashboards, web applications, mobile applications, desktop interfaces, visual programming environments, data visualization platforms, and SCADA-style tools. These tools can be used to display sensor values, send commands, control actuators, monitor machine states, and build dashboards for embedded boards.
In Fab Academy, an interface is especially useful when a board has an input device, such as a sensor, and an output device, such as a LED, motor, relay, display, or actuator. The interface makes the system easier to understand, debug, control, and demonstrate.
What is an Interface?
An interface is the connection layer between a user and a system. In embedded electronics, an interface allows a person to observe data, send commands, change parameters, and understand what the microcontroller is doing.
Interfaces can be simple or complex. A simple interface can be the Arduino Serial Monitor displaying sensor values. A more advanced interface can be a web dashboard, a mobile application, a cloud IoT platform, or an industrial SCADA system.
| Interface type | Example | Typical use |
|---|---|---|
| Serial interface | Arduino Serial Monitor | Debugging, testing, and simple communication with a board. |
| Desktop interface | Processing, Python Tkinter, PyQt | Local applications running on a computer. |
| Web interface | HTML, CSS, JavaScript, Flask, FastAPI | Browser-based dashboards and control panels. |
| Mobile interface | MIT App Inventor, Flutter, Blynk App | Phone-based control and monitoring. |
| IoT dashboard | Blynk, ThingsBoard, Arduino IoT Cloud, Ubidots | Remote monitoring and control through the internet. |
| SCADA / HMI | Ignition, Node-RED Dashboard, industrial HMI tools | Industrial supervision, alarms, and process control. |
Automation Pyramid and Interface Levels
Interfaces can be understood through the automation pyramid. At the bottom of the pyramid are the physical devices, such as sensors and actuators. Above them are controllers, such as microcontrollers and PLCs. Higher levels include supervision, dashboards, production systems, and business systems.
In Fab Academy, most interface projects are located in the first levels of the pyramid: field devices, embedded boards, and user dashboards. However, the same ideas can scale to industrial systems where SCADA and HMI tools are used to monitor machines and processes.
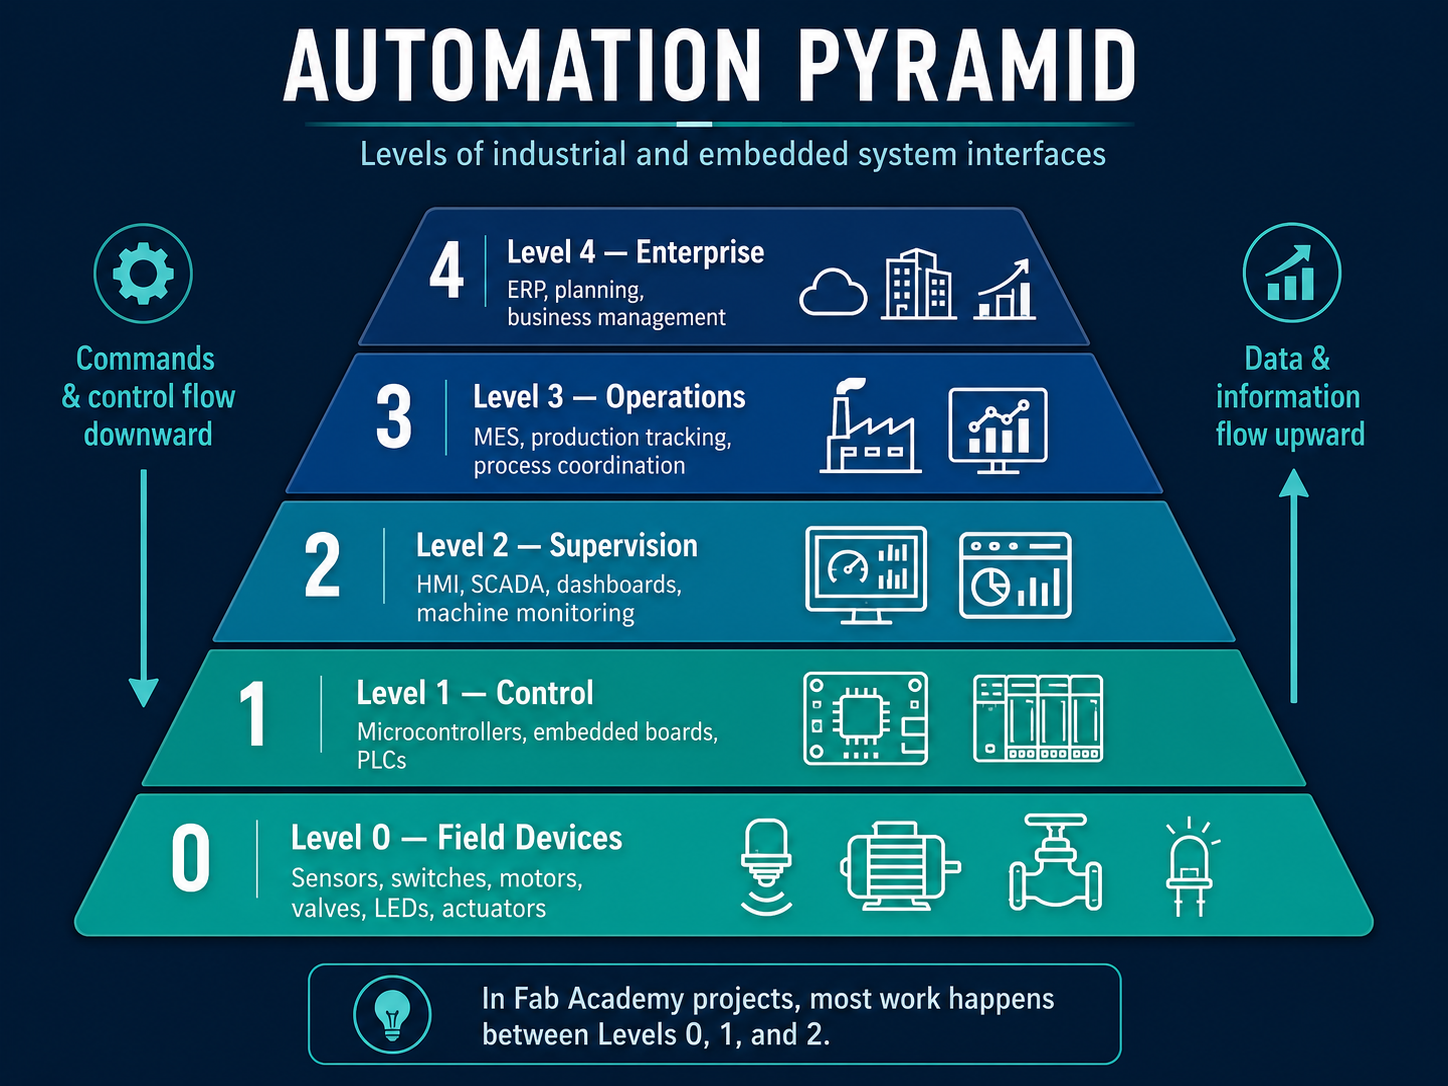
Image source: The image w15_1.png was generated
with an AI image generation tool.
AI Image Generation Prompt
Create a professional horizontal 16:9 infographic titled “AUTOMATION PYRAMID” showing the levels of industrial and embedded system interfaces, using a dark navy futuristic background with a glowing teal and blue color palette. In the center, design a five-level pyramid with horizontal layers, wider at the bottom, labeled from bottom to top: Level 0 — Field Devices: sensors, switches, motors, valves, LEDs, actuators, with icons of a sensor, motor, valve and LED; Level 1 — Control: microcontrollers, embedded boards, PLCs, with icons of a microcontroller board and PLC modules; Level 2 — Supervision: HMI, SCADA, dashboards, machine monitoring, with monitor icons showing gauges and charts; Level 3 — Operations: MES, production tracking, process coordination, with factory and analytics dashboard icons; Level 4 — Enterprise: ERP, planning, business management, with cloud, building and business growth chart icons. Add a downward arrow on the left with the text “Commands & control flow downward” and an upward arrow on the right with the text “Data & information flow upward”. At the bottom, include a highlighted note box saying “In Fab Academy projects, most work happens between Levels 0, 1, and 2.” Use clean white typography, modern technical line icons, thin glowing lines, strong visual hierarchy, and a polished educational presentation style suitable for a Fab Academy documentation page.
| Level | Typical elements | Interface role |
|---|---|---|
| Level 0 — Field | Sensors, motors, LEDs, relays, actuators | Physical devices produce data or perform actions. |
| Level 1 — Control | Microcontrollers, PLCs, embedded boards | Reads inputs, processes logic, and controls outputs. |
| Level 2 — Supervision | HMI, SCADA, dashboards | Allows users to monitor and control the process. |
| Level 3 — Operations | MES, production monitoring | Tracks production data, machine status, and performance. |
| Level 4 — Business | ERP, enterprise software | Connects production information with business decisions. |
Types of Interfaces for Embedded Systems
Different projects require different types of interfaces. A small prototype may only need a Serial Monitor, while a connected IoT device may need a mobile or web dashboard. A machine or industrial process may need a SCADA-style interface with alarms, historical data, and multiple screens.
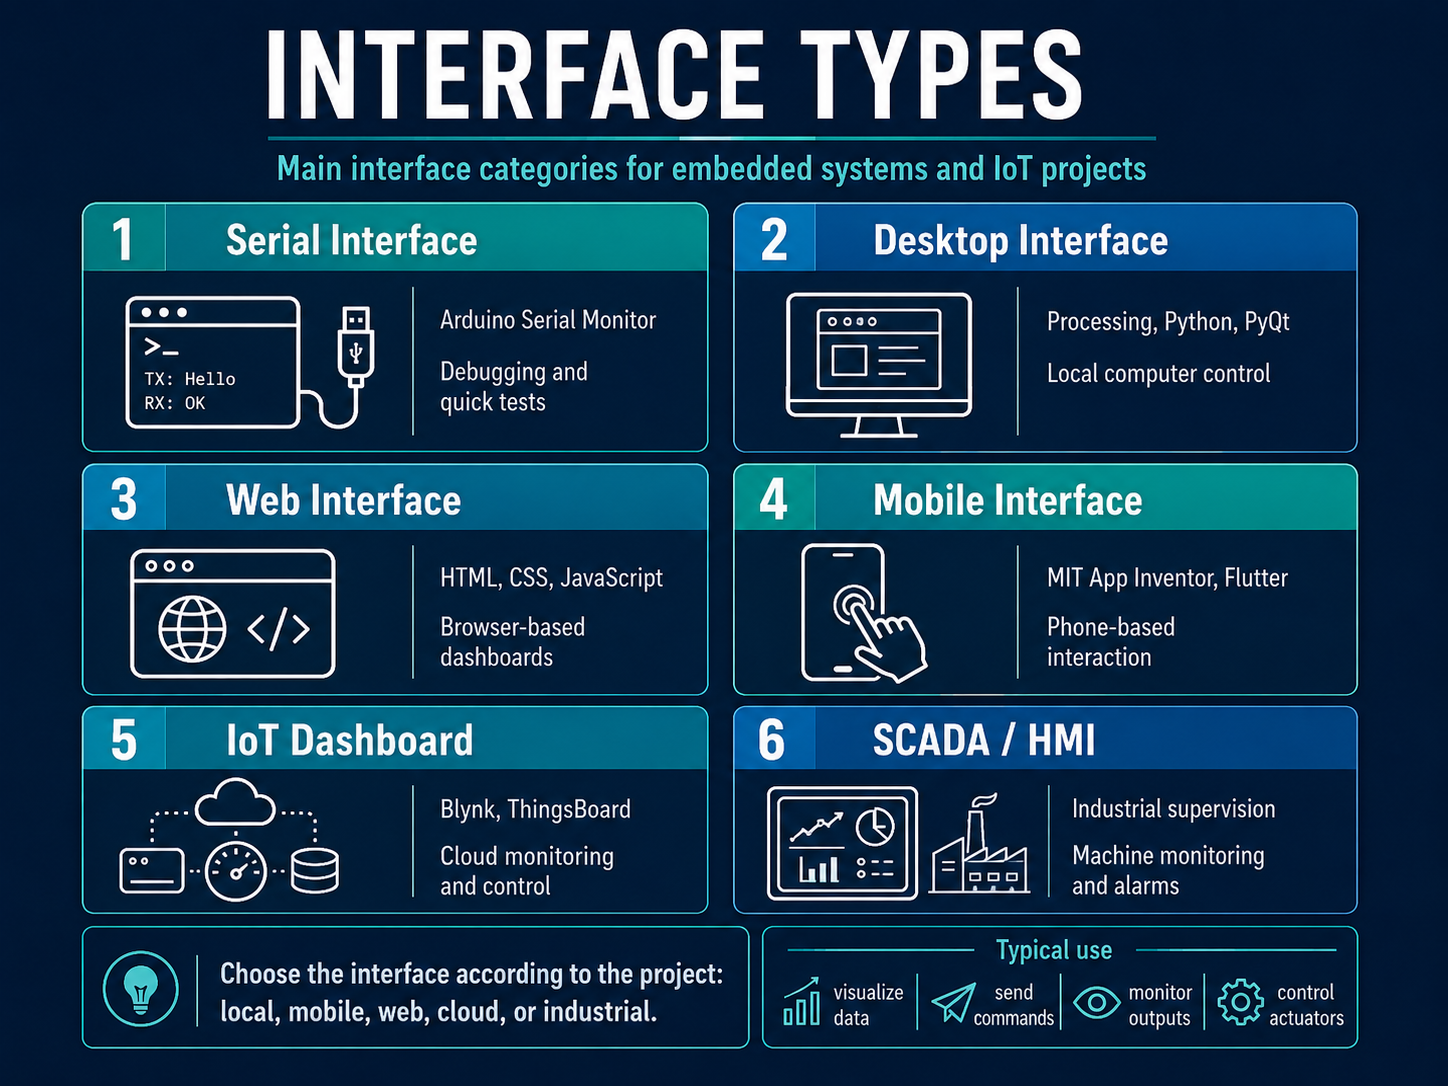
Image source: The image w15_2.png was generated
with an AI image generation tool.
AI Image Generation Prompt
Create a professional horizontal 16:9 infographic titled “INTERFACE TYPES” with the subtitle “Main interface categories for embedded systems and IoT projects,” using a dark navy futuristic background, glowing teal and blue accents, clean white typography, thin neon borders, and modern technical line icons. Design six rounded rectangular cards arranged in a 2-column by 3-row grid, each card numbered and labeled: 1 — Serial Interface, with an icon of a terminal window and USB cable, text “Arduino Serial Monitor” and “Debugging and quick tests”. 2 — Desktop Interface, with a computer monitor icon, text “Processing, Python, PyQt” and “Local computer control”. 3 — Web Interface, with browser, globe and code icons, text “HTML, CSS, JavaScript” and “Browser-based dashboards”. 4 — Mobile Interface, with smartphone and touch hand icon, text “MIT App Inventor, Flutter” and “Phone-based interaction”. 5 — IoT Dashboard, with cloud, device, gauge and database icons, text “Blynk, ThingsBoard” and “Cloud monitoring and control”. 6 — SCADA / HMI, with industrial dashboard and factory icons, text “Industrial supervision” and “Machine monitoring and alarms”. At the bottom, add a highlighted note box saying “Choose the interface according to the project: local, mobile, web, cloud, or industrial.” Also add a small “Typical use” strip with icons and labels for “visualize data,” “send commands,” “monitor outputs,” and “control actuators.” Make the layout polished, high-impact, readable, educational, and suitable for a Fab Academy documentation page.
| Interface category | Strength | Weakness | Best use case |
|---|---|---|---|
| Serial interface | Very easy to start and excellent for debugging. | Not user friendly for final demonstrations. | Testing sensors, messages, and board behavior. |
| Desktop application | Good local control and custom visualization. | Requires the computer to stay connected. | Lab tools, local control panels, visual experiments. |
| Web application | Runs in a browser and can be highly customized. | Requires frontend and sometimes backend programming. | Custom dashboards and networked interfaces. |
| Mobile application | Convenient and portable. | May require mobile app development or platform tools. | Bluetooth or IoT device control from a phone. |
| IoT dashboard | Good for remote monitoring and cloud connection. | Depends on internet access and platform configuration. | ESP32, sensors, remote outputs, IoT prototypes. |
| SCADA / HMI | Strong for industrial supervision and process control. | More complex and sometimes requires licenses. | Machines, production lines, industrial automation. |
Communication Protocols for Interfaces
An interface needs a communication method to exchange information with the embedded board. Some protocols are local and wired, while others are wireless or cloud-based. The correct choice depends on distance, speed, power consumption, complexity, and whether the system needs internet access.
| Protocol | Type | How it works | Typical interface use |
|---|---|---|---|
| Serial / UART | Wired | Uses TX and RX lines to exchange data between a board and computer or another device. | Debugging, Processing interfaces, Python GUIs, Serial Monitor. |
| I2C | Wired bus | Uses SDA and SCL lines; multiple devices can share the same bus using addresses. | Local sensors, OLED displays, sensor networks inside a device. |
| SPI | Wired bus | Uses clock, data, and chip-select lines for fast communication. | Displays, SD cards, fast sensors, radio modules. |
| WiFi | Wireless network | Connects the board to a local network and internet services. | IoT dashboards, Blynk, web servers, cloud APIs. |
| Bluetooth / BLE | Wireless short range | Connects nearby devices, usually phones or computers. | Mobile applications, low-power sensors, local control. |
| MQTT | IoT messaging | Uses a publish/subscribe model with a broker. | IoT platforms, Node-RED, ThingsBoard, home automation. |
| HTTP / HTTPS | Web protocol | Sends requests between a device and a server or API. | REST APIs, Blynk API, custom web dashboards. |
| WebSocket | Real-time web | Keeps an open bidirectional connection between browser and server. | Live dashboards and real-time web control. |
| Modbus | Industrial | Common protocol for industrial devices, PLCs, and sensors. | SCADA and industrial monitoring. |
| OPC UA | Industrial / IIoT | Standardized communication layer for industrial data exchange. | SCADA, MES, Industry 4.0 systems. |
Tool Categories Compared
The group organized the tools into categories according to how they are used. Some tools are designed for beginners and fast prototypes, while others are better for custom interfaces, industrial systems, or large IoT deployments.
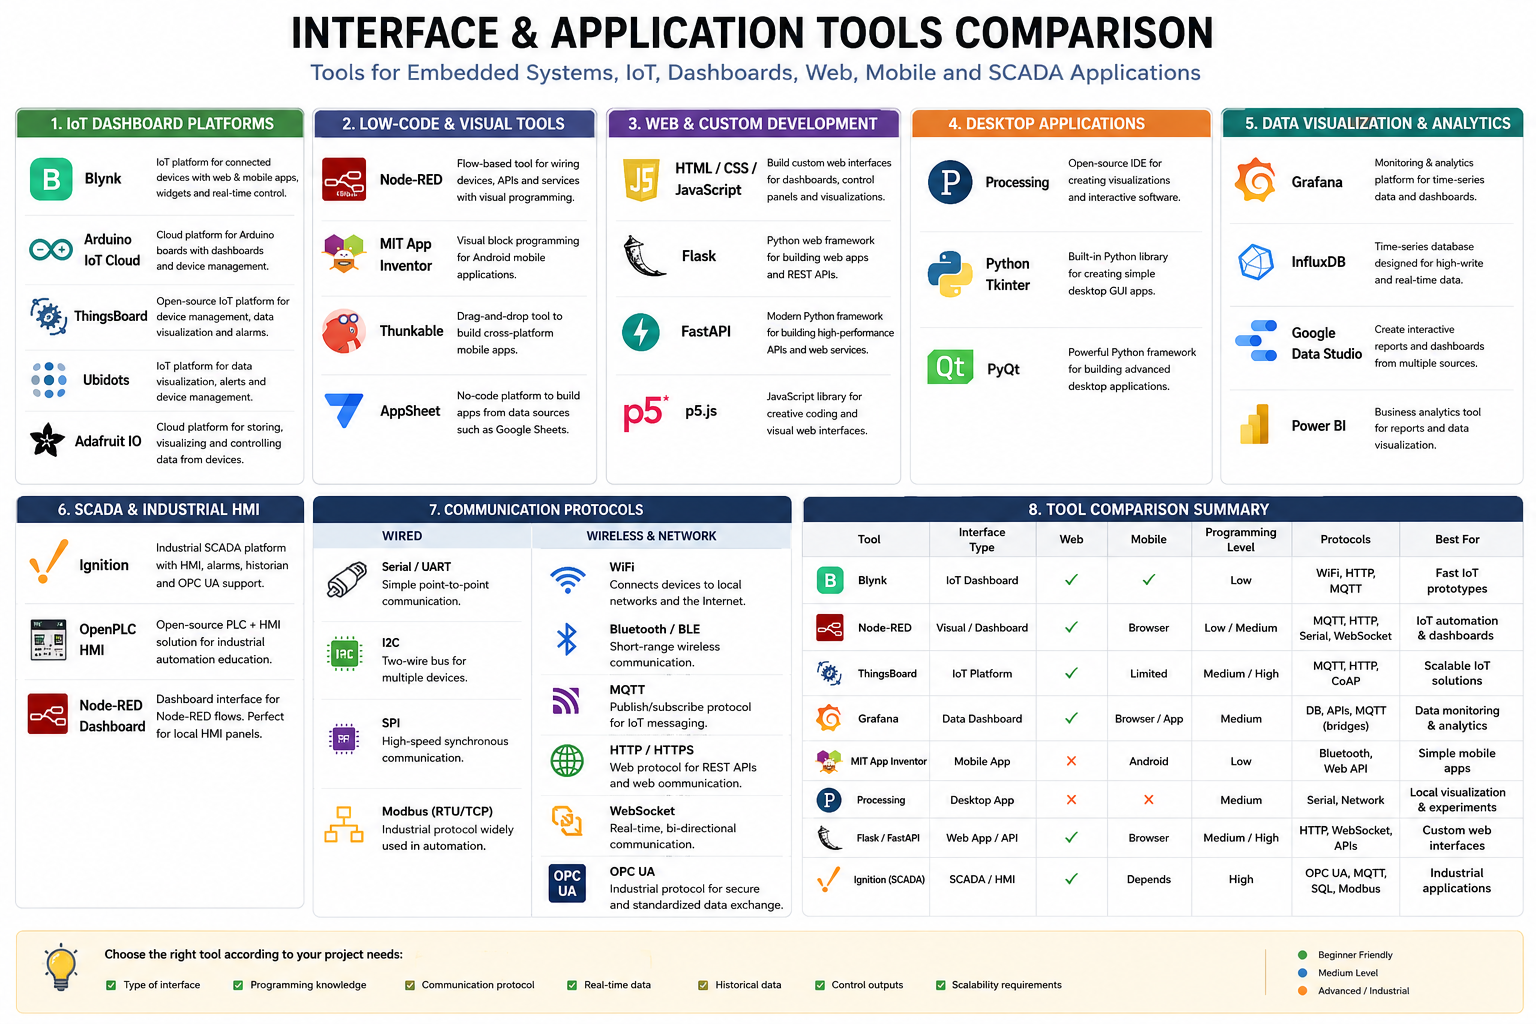
Image source: The image w15_3.png was generated
with an AI image generation tool.
AI Image Generation Prompt
Create a professional horizontal infographic titled “INTERFACE & APPLICATION TOOLS COMPARISON” with the subtitle “Tools for Embedded Systems, IoT, Dashboards, Mobile and SCADA Applications,” using a clean white background, dark blue frame, modern typography, thin section borders, and a polished technical presentation style. Organize the infographic into clearly separated panels and columns with colored section headers, each one comparing categories of tools commonly used in embedded systems and Fab Academy style projects. Include these main sections: 1. IoT Dashboard Platforms Show tools such as Blynk, Arduino IoT Cloud, ThingsBoard, Ubidots, and Adafruit IO, each with logo/icon, name, and a short one-line description of its purpose. 2. Low-Code & Visual Tools Show Node-RED, MIT App Inventor, Thunkable, and AppSheet, each with logo/icon, name, and a short one-line description. 3. Web & Custom Development Show HTML / CSS / JavaScript, Flask, FastAPI, and p5.js, each with icon or logo, name, and a concise description. 4. Desktop Applications Show Processing, Python Tkinter, and PyQt, each with icon or logo, name, and a concise description. 5. Data Visualization & Analytics Show Grafana, InfluxDB, Google Data Studio, and Power BI, each with icon or logo, name, and a concise description. 6. SCADA & Industrial HMI Show Ignition, OpenPLC HMI, and Node-RED Dashboard, each with icon or logo, name, and a concise description. 7. Communication Protocols Split this area into Wired and Wireless & Network categories. Under Wired include Serial / UART, I2C, SPI, and Modbus (RTU/TCP). Under Wireless & Network include WiFi, Bluetooth / BLE, MQTT, HTTP / HTTPS, WebSocket, and OPC UA. Each protocol should have a small icon and a short explanation. 8. Tool Comparison Summary Create a comparison table with columns such as: Tool, Interface Type, Web, Mobile, Programming Level, Protocols, Best For. Include rows for Blynk, Node-RED, ThingsBoard, Grafana, MIT App Inventor, Processing, Flask / FastAPI, and Ignition (SCADA). Use check marks, crosses, and short text labels where appropriate. At the bottom, add a note strip that says: “Choose the right tool according to your project needs:” and include small labeled criteria such as: Type of interface, Programming knowledge, Communication protocol, Real-time data, Historical data, Control outputs, and Scalability requirements. Add a small legend in one corner indicating: Beginner Friendly, Medium Level, and Advanced / Industrial. Make the infographic visually balanced, highly readable, educational, detailed, and professional, suitable for a Fab Academy or engineering documentation page.
| Category | Examples | Main advantage | Typical limitation |
|---|---|---|---|
| IoT dashboards | Blynk, ThingsBoard, Arduino IoT Cloud, Ubidots, Adafruit IO | Fast connection between boards and cloud dashboards. | Depends on platform configuration and internet access. |
| Low-code tools | Node-RED, MIT App Inventor, Thunkable | Reduces the amount of code needed. | May be less flexible than fully custom programming. |
| Data dashboards | Grafana, InfluxDB, Power BI | Good for historical data and visualization. | Usually needs a data source or database. |
| Custom web apps | HTML, CSS, JavaScript, Flask, FastAPI | Maximum flexibility for interface design. | Requires more programming knowledge. |
| Desktop apps | Processing, Python Tkinter, PyQt | Good for local interfaces connected by USB or serial. | Usually tied to a specific computer. |
| SCADA / HMI | Ignition, OpenPLC HMI, industrial HMI tools | Robust for machines and industrial process supervision. | More complex and sometimes license-based. |
Main Tool Comparison
The following table compares different tools that can be used to create interfaces for embedded boards. The comparison considers the type of interface, whether it supports web or mobile use, the programming language or logic used, typical protocols, difficulty, and recommended use.
| Tool | Interface type | Web | Mobile | Programming / logic | Common protocols | Difficulty | Best use case |
|---|---|---|---|---|---|---|---|
| Blynk | IoT cloud dashboard | Yes | Yes | Low-code + Arduino/C++ firmware | WiFi, HTTP API, MQTT integrations | Low | Fast IoT prototypes with ESP32 boards. |
| Arduino IoT Cloud | IoT dashboard | Yes | Yes | Arduino ecosystem | WiFi, cloud variables, MQTT-style backend | Low / medium | Arduino-based projects and classroom prototypes. |
| ThingsBoard | IoT platform | Yes | Limited / integrable | Dashboard configuration + device firmware | MQTT, HTTP, CoAP | Medium / high | Scalable IoT systems and device management. |
| Ubidots | IoT dashboard | Yes | Yes | Low-code dashboard + firmware | MQTT, HTTP | Low / medium | Educational IoT dashboards and telemetry. |
| Adafruit IO | IoT dashboard | Yes | Not primary | Arduino/Python libraries + dashboards | MQTT, HTTP | Low | Simple sensor dashboards and Adafruit ecosystem projects. |
| Node-RED | Flow-based interface and automation | Yes | Browser-based | Visual nodes + JavaScript functions | MQTT, HTTP, WebSocket, Serial, APIs | Medium | IoT logic, automation flows, and dashboards. |
| Grafana | Data dashboard | Yes | Browser/app viewer | Dashboard configuration + queries | Databases, APIs, MQTT through bridges | Medium | Historical data, charts, metrics, and monitoring. |
| Processing | Desktop visual application | No | No | Java-like programming | Serial, network libraries | Medium | Local visual interfaces and serial data visualization. |
| Python Tkinter | Desktop GUI | No | No | Python | Serial, HTTP, MQTT libraries | Medium | Simple local control panels and testing tools. |
| PyQt | Desktop GUI | No | No | Python + Qt framework | Serial, HTTP, MQTT libraries | Medium / high | More advanced desktop applications. |
| HTML / CSS / JavaScript | Custom web interface | Yes | Browser-based | JavaScript frontend | HTTP, WebSocket, MQTT.js | Medium / high | Fully custom browser dashboards. |
| Flask | Web backend and interface | Yes | Browser-based | Python backend + HTML frontend | HTTP, WebSocket, Serial, APIs | Medium | Local web interfaces and custom dashboards. |
| FastAPI | Web API and backend | Yes | Browser-based | Python API backend | HTTP, WebSocket, APIs | Medium / high | Modern APIs for custom interfaces. |
| MIT App Inventor | Mobile app builder | No | Android | Visual block programming | Bluetooth, Web APIs | Low | Simple mobile apps for embedded systems. |
| Thunkable | Mobile app builder | Limited | Yes | Visual block programming | Web APIs, Bluetooth depending on setup | Low / medium | Mobile app prototypes. |
| Ignition | SCADA / industrial HMI | Yes | Depends on deployment | Industrial configuration + scripting | OPC UA, MQTT, databases, industrial protocols | High | Industrial supervision and machine monitoring. |
IoT Dashboard Tools
IoT dashboard tools are useful when the embedded board needs to communicate through the internet. They are especially suitable for ESP32-based boards because these boards can connect to WiFi and send sensor data to a cloud service.
| Tool | Strengths | Limitations | Recommended project type |
|---|---|---|---|
| Blynk | Fast setup, web and mobile dashboard, virtual pins, simple ESP32 integration. | Depends on Blynk Cloud and correct token/device configuration. | Fab Academy prototypes, remote LED/motor/sensor dashboards. |
| ThingsBoard | Open-source, device management, dashboards, alarms, MQTT/HTTP/CoAP. | More configuration effort than Blynk. | Large IoT systems with multiple devices and dashboards. |
| Arduino IoT Cloud | Integrated with Arduino tools and boards, dashboard widgets, mobile app. | Best inside the Arduino ecosystem. | Arduino-based IoT assignments and simple connected products. |
| Ubidots | Good educational dashboards, telemetry, MQTT/HTTP support. | Platform limits depend on plan. | Sensor monitoring and educational IoT dashboards. |
| Adafruit IO | Simple feeds and dashboards, good for beginners. | Less industrial than other platforms. | Small prototypes, sensor feeds, quick dashboards. |
Low-code and Visual Programming Tools
Low-code tools are useful when the goal is to build an interface or automation workflow quickly. Instead of writing everything from zero, the user connects blocks, nodes, or visual elements.
| Tool | Interface style | Programming method | Best use |
|---|---|---|---|
| Node-RED | Browser-based flow editor | Connects nodes and optional JavaScript functions. | IoT automation, MQTT dashboards, API integration, sensor flows. |
| MIT App Inventor | Mobile app builder | Visual blocks. | Simple Android apps for Bluetooth or web API communication. |
| Thunkable | Mobile app builder | Visual blocks and app components. | Mobile app prototypes with less code. |
| AppSheet | No-code data app | Table and form-based logic. | Data collection and simple dashboards, less direct hardware control. |
Custom Web and Desktop Interfaces
Custom programming tools give more flexibility than low-code platforms. They require more development time, but they allow the designer to control the interface layout, behavior, communication, and data structure.
| Tool | Platform | Language | Communication options | Use case |
|---|---|---|---|---|
| HTML / CSS / JavaScript | Web browser | JavaScript | HTTP, WebSocket, MQTT.js | Fully custom browser dashboard. |
| Flask | Web server | Python | HTTP, WebSocket, Serial libraries | Local web dashboard connected to hardware. |
| FastAPI | Web API | Python | HTTP APIs, WebSocket | Modern backend for web applications. |
| Processing | Desktop | Java-like syntax | Serial, network libraries | Visual interfaces and real-time graphics. |
| p5.js | Web browser | JavaScript | Web APIs, WebSocket, MQTT.js | Creative web interfaces and visualizations. |
| Python Tkinter | Desktop | Python | Serial, HTTP, MQTT libraries | Simple local control interfaces. |
| PyQt | Desktop | Python | Serial, HTTP, MQTT libraries | Professional desktop GUIs. |
Data Dashboards and SCADA-style Tools
Some tools are focused on data visualization and process supervision. These are useful when the system needs historical charts, alarms, machine states, database connections, or industrial communication protocols.
| Tool | Type | Strength | Typical protocols or data sources | Recommended use |
|---|---|---|---|---|
| Grafana | Data dashboard | Strong visualization, panels, time-series data, alerts. | InfluxDB, Prometheus, SQL, APIs, plugins. | Monitoring sensor data over time. |
| InfluxDB + Grafana | Database + dashboard | Good combination for IoT telemetry and historical plots. | MQTT to database, APIs, time-series data. | Long-term sensor records. |
| Node-RED Dashboard | Lightweight HMI / IoT dashboard | Combines logic flows with simple UI elements. | MQTT, HTTP, Serial, WebSocket. | Local automation panels and prototypes. |
| Ignition | Industrial SCADA | Robust industrial supervision, alarms, databases, OPC UA. | OPC UA, MQTT, SQL, industrial protocols. | Industrial machines and production lines. |
| OpenPLC + HMI | Educational industrial control | Useful for PLC logic and automation learning. | Modbus, PLC-style logic. | Learning industrial automation. |
Recommended Tools by Scenario
The best tool depends on the goal of the interface. A tool that is excellent for a small Fab Academy prototype may not be the best option for an industrial machine, and a SCADA system may be too complex for a simple LED or sensor demo.
| Scenario | Recommended tool | Reason |
|---|---|---|
| Fast ESP32 IoT prototype | Blynk | Quick setup, web/mobile dashboards, virtual pins, low-code interface. |
| Local debugging | Serial Monitor | Simple and immediate communication with the board. |
| Visual local interface | Processing or Python Tkinter | Good for local serial data visualization. |
| Flow-based IoT automation | Node-RED | Connects MQTT, APIs, serial data, dashboards, and logic blocks. |
| Large IoT deployment | ThingsBoard | Device management, dashboards, MQTT/HTTP/CoAP support. |
| Historical data visualization | Grafana + InfluxDB | Strong time-series visualization and monitoring. |
| Custom web dashboard | HTML/CSS/JavaScript + Flask or FastAPI | Full control over interface design and backend behavior. |
| Simple Android mobile app | MIT App Inventor | Block-based app building and easy Bluetooth/Web API experiments. |
| Industrial process supervision | SCADA / Ignition / OPC UA tools | Designed for machines, alarms, production data, and robust supervision. |
Selection Criteria
To compare interface tools, the group considered several criteria. These criteria help decide which tool is more appropriate for a specific project.
| Criterion | Questions to ask | Why it matters |
|---|---|---|
| Target platform | Should the interface run on web, mobile, desktop, or cloud? | Defines where the user can access the application. |
| Communication protocol | Does the board use Serial, WiFi, Bluetooth, MQTT, HTTP, or Modbus? | The interface must support the same communication method as the hardware. |
| Programming level | Does the project need low-code, blocks, Python, JavaScript, or full custom development? | Affects development time and flexibility. |
| Real-time behavior | Does the data need to update continuously? | Important for sensors, motors, machines, and live dashboards. |
| Historical data | Does the project need to store and graph data over time? | Important for monitoring, experiments, and analysis. |
| Control outputs | Does the interface need to send commands to actuators? | Important for motors, relays, LEDs, and machines. |
| Scalability | Is it one board or many devices? | Some tools are better for fleets of devices. |
| Reliability | Is the project educational, experimental, or industrial? | Industrial systems require more robust tools and protocols. |
Group Comparison Notes
During the comparison, we observed that interface tools can be selected according to the complexity and purpose of the project. For simple Fab Academy prototypes, tools like Blynk, Processing, Node-RED, MIT App Inventor, and Python interfaces can be implemented quickly. For larger IoT projects, platforms such as ThingsBoard, Arduino IoT Cloud, Ubidots, or Adafruit IO provide dashboards and device communication tools.
For projects that require historical data, Grafana with a time-series database is a stronger option. For industrial or machine supervision, SCADA and HMI tools are more appropriate because they are designed for process visualization, alarms, machine states, and production environments.
The most important point is that the interface must match the communication method of the embedded board. For example, a board connected through USB may use Serial, a local wireless device may use Bluetooth or BLE, and an IoT device connected to the internet may use WiFi with HTTP, HTTPS, or MQTT.
Summary Table
The table below summarizes the most relevant tools for Fab Academy interface projects.
| Need | Simple option | Advanced option | Typical protocol |
|---|---|---|---|
| Debug a board | Serial Monitor | Python serial GUI | UART / Serial |
| Visualize data locally | Processing | PyQt | Serial / USB |
| Create a phone app | MIT App Inventor | Flutter / React Native | Bluetooth, BLE, HTTP |
| Create a web dashboard | Blynk / Node-RED Dashboard | HTML/JS + Flask/FastAPI | HTTP, WebSocket, MQTT |
| Connect IoT devices | Blynk / Arduino IoT Cloud | ThingsBoard | WiFi, MQTT, HTTP |
| Graph historical data | Ubidots / Adafruit IO | Grafana + InfluxDB | MQTT, HTTP, database APIs |
| Monitor a machine | Node-RED Dashboard | SCADA / Ignition | Modbus, OPC UA, MQTT |