Week 15 — Interface and Application Programming
Fab Academy 2026 · Jenny Rojas · Industrial FabLab UCuenca
Group Assignment
For the group assignment, we compared different tool options for creating user interfaces and applications that communicate with embedded systems. This helped us understand that there are many possible ways to build an interface, depending on the type of project, the communication protocol, and the level of interaction required.
Water Detection Monitoring System with Blynk
This week focused on developing an application capable of interacting with an embedded electronic system through both hardware and software interfaces. The objective was not only to program a microcontroller, but also to create a complete user experience where sensor information can be acquired, processed, transmitted, and visualized in real time.
For this assignment, I developed a water detection monitoring system using a XIAO ESP32C3, a water sensor, and the Blynk IoT platform. The application allows the user to remotely monitor the presence of water, visualize sensor readings through a dashboard, and observe system behavior through graphical interfaces connected to the cloud.
System Overview
The developed system combines embedded electronics, wireless communication, and cloud-based visualization to create a functional IoT application. The water sensor continuously measures conductivity values and sends the analog signal to the XIAO ESP32C3.
The microcontroller processes the readings and transmits them through WiFi to the Blynk platform. The user can then access a dashboard that displays sensor values, water detection status, and the behavior of the system over time.
Components Used
The following hardware and software components were selected to build the monitoring system. These components allowed the implementation of an embedded application capable of sensing water presence, processing data, and visualizing the result through a cloud dashboard.
| Component | Description |
|---|---|
| XIAO ESP32C3 | Main microcontroller with WiFi connectivity. |
| Water Sensor | Analog input device used to detect the presence of water. |
| LED + 220Ω Resistor | Visual output indicator for the water detection state. |
| Blynk Cloud | IoT platform used to create the user interface and dashboard. |
| Arduino IDE | Programming environment used to upload the firmware. |
System Logic
The application was designed around a simple decision-making process. The microcontroller continuously reads the analog value generated by the water sensor and compares it with a predefined threshold. Based on this comparison, the system determines whether water is present or absent.
- The water sensor sends an analog value to the XIAO ESP32C3.
- The microcontroller compares the value with a threshold.
- If water is detected, the LED turns on and Blynk receives status 1.
- If no water is detected, the LED turns off and Blynk receives status 0.
- The dashboard displays the sensor value and historical graph.
Electronic Connections
Proper wiring is essential for reliable sensor operation and accurate data acquisition. Special attention was given to voltage levels and pin assignments because the XIAO ESP32C3 works with 3.3V logic.
Water Sensor Connection
| Water Sensor Pin | XIAO ESP32C3 Pin |
|---|---|
| S | A0 |
| + | 3.3V |
| - | GND |
LED Indicator Connection
| LED Connection | XIAO ESP32C3 |
|---|---|
| LED positive | D8 |
| LED negative | GND through 220Ω resistor |
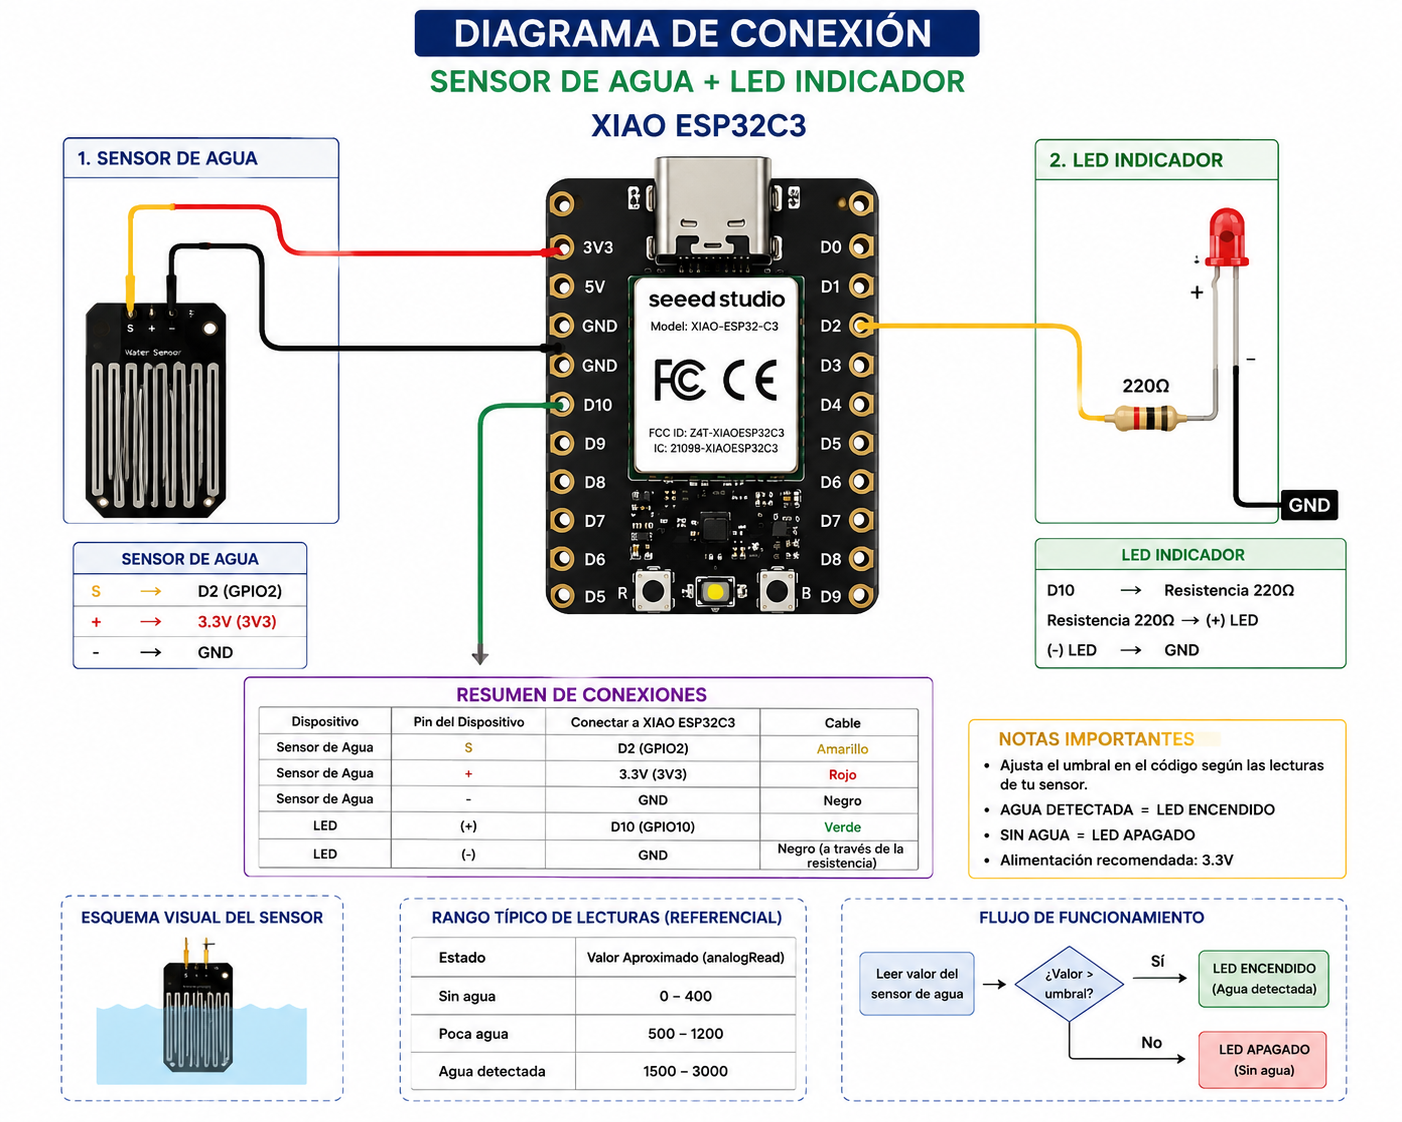
Figure 1. Schematic diagram of the water sensor, XIAO ESP32C3, and LED indicator.
Prompt used: “Create a clean technical schematic diagram showing a XIAO ESP32C3 connected to an analog water sensor and an LED indicator with a 220 ohm resistor. The diagram should clearly show the signal pin connected to A0, power connected to 3.3V, ground connected to GND, and the LED connected to a digital output pin. Use a simple educational style suitable for Fab Academy documentation.”
Embedded Programming
The embedded application was developed using Arduino IDE and the ESP32-compatible Blynk libraries. The program integrates sensor acquisition, wireless communication, cloud synchronization, and output control.
#define BLYNK_TEMPLATE_ID "TMPL2VyawO3C4"
#define BLYNK_TEMPLATE_NAME "GRAFICA"
#define BLYNK_AUTH_TOKEN "XXXXXXXX"

#include <WiFi.h>
#include <WiFiClient.h>
#include <BlynkSimpleEsp32.h>

char ssid[] = "YOUR_WIFI";
char pass[] = "YOUR_PASSWORD";

#define WATER_SENSOR A0
#define LED_PIN D8

int umbralAgua = 750;

BlynkTimer timer;

void enviarDatos() {

  int valorAgua = analogRead(WATER_SENSOR);

  Serial.print("Valor Sensor: ");
  Serial.println(valorAgua);

  Blynk.virtualWrite(V0, valorAgua);

  if (valorAgua >= umbralAgua) {
    digitalWrite(LED_PIN, HIGH);
    Serial.println("AGUA DETECTADA");
    Blynk.virtualWrite(V1, 1);
  } else {
    digitalWrite(LED_PIN, LOW);
    Serial.println("SIN AGUA");
    Blynk.virtualWrite(V1, 0);
  }
}

void setup() {
  Serial.begin(115200);
  pinMode(LED_PIN, OUTPUT);
  digitalWrite(LED_PIN, LOW);

  Blynk.begin(BLYNK_AUTH_TOKEN, ssid, pass);

  timer.setInterval(1000L, enviarDatos);
}

void loop() {
  Blynk.run();
  timer.run();
}
Downloadable Files
This section includes the Arduino IDE source file developed for the assignment. The file contains the complete program used to read the water sensor, process the threshold logic, communicate with Blynk, and update the dashboard values in real time.
Blynk Dashboard Configuration
A custom dashboard was created using the Blynk IoT platform to provide a simple and intuitive user interface. The dashboard enables real-time visualization of sensor data and system status while also maintaining historical records through graphical widgets.
| Widget | Datastream | Function |
|---|---|---|
| Gauge | V0 | Displays the real-time analog value of the water sensor. |
| LED / Status Indicator | V1 | Shows whether water is detected or not. |
| Chart | V0 | Shows the behavior of the sensor over time. |
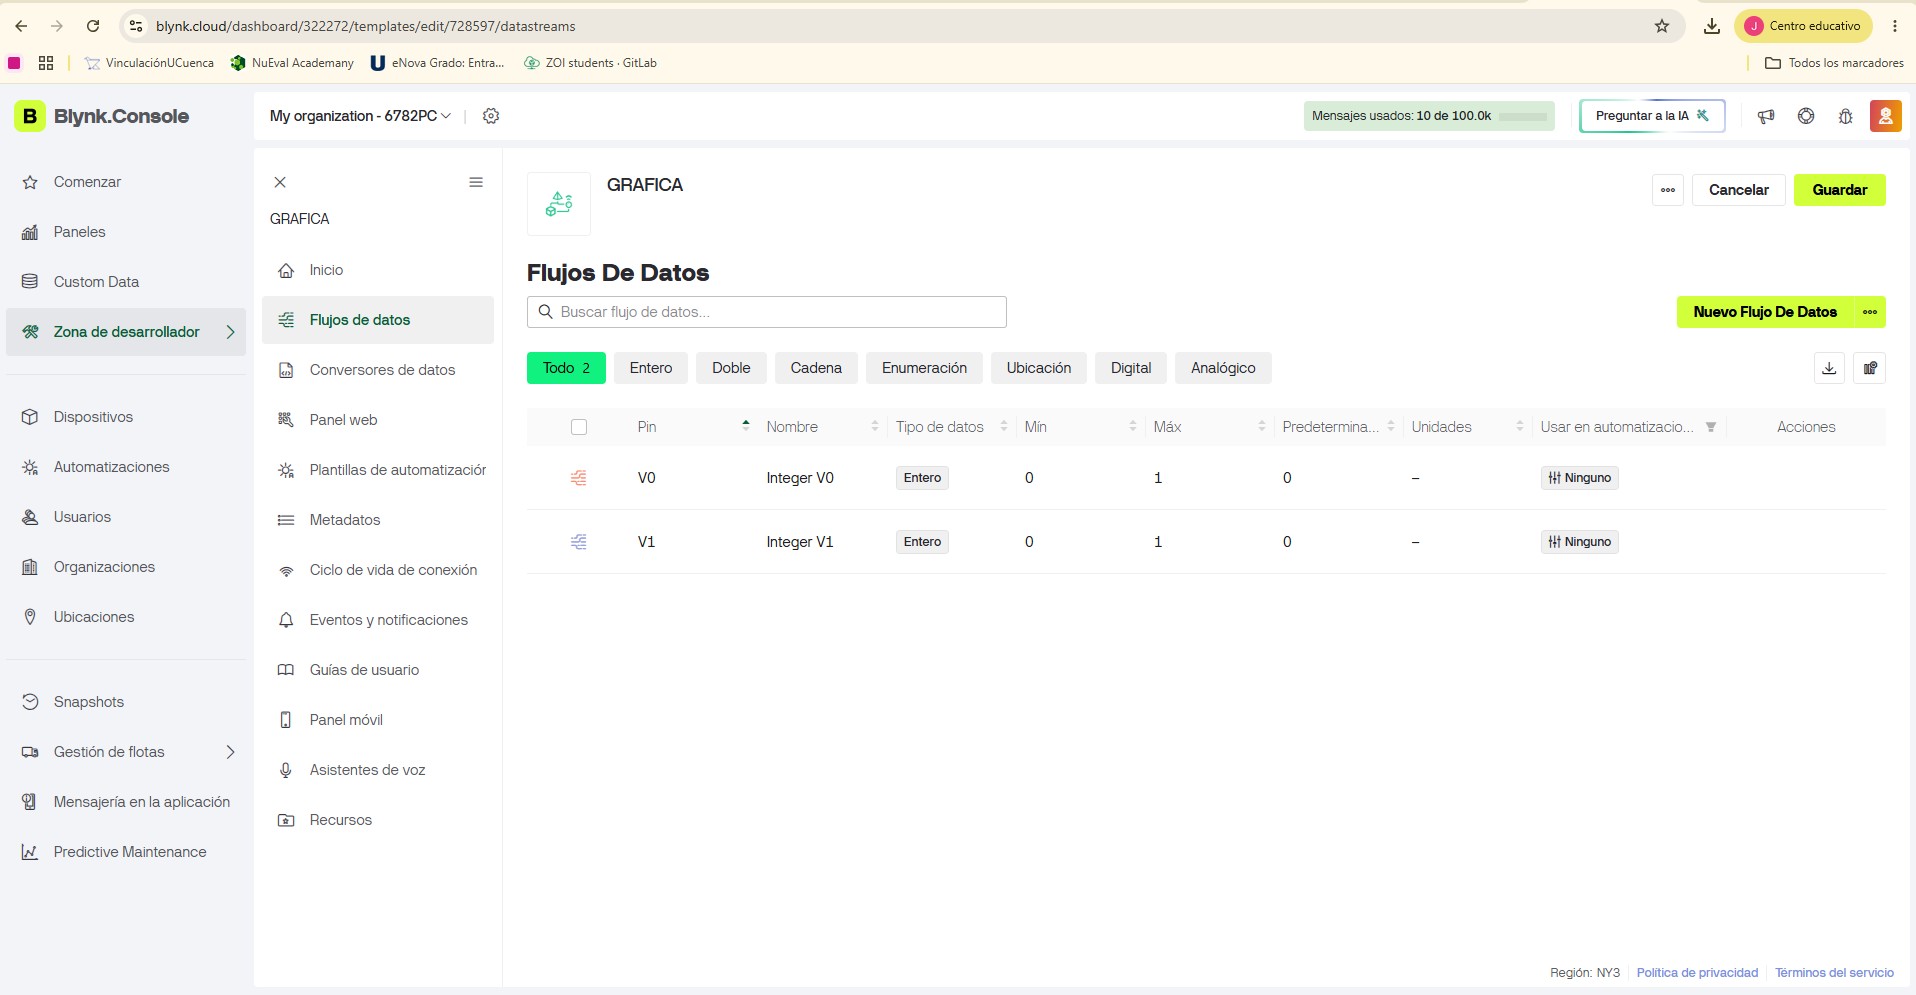
Figure 2. Blynk dashboard used to visualize the water sensor values and status.
Sensor Calibration
Sensor calibration was an important stage of the development process. Multiple measurements were taken under different operating conditions to identify the typical range of values corresponding to the presence and absence of water.
| Condition | Approximate Sensor Value |
|---|---|
| No water | 720 – 740 |
| Water detected | 760 – 950 |
Based on the tests, the threshold value was defined as:
int umbralAgua = 750;Problems Encountered and Debugging
The main errors were related to the physical connection of the pins. The compact layout of the XIAO ESP32C3 made it easy to confuse the analog input pin and the power pins during the first tests.
After reviewing the pinout carefully, the connections were corrected. The water sensor was connected to A0, powered from 3.3V, and referenced to GND. The LED was also protected using a 220Ω resistor.
Once the pin connections were corrected, the system worked successfully on the first complete functional test. The board connected to Blynk, the sensor values were displayed on the dashboard, and the LED responded according to the water detection state.
Results
The final prototype successfully demonstrated the integration of sensing, processing, communication, and visualization capabilities within a single IoT application.
- Real-time sensor value visualization.
- Water detection status using Blynk.
- LED output response based on sensor readings.
- Historical graph of sensor behavior.
- Wireless communication using the XIAO ESP32C3.
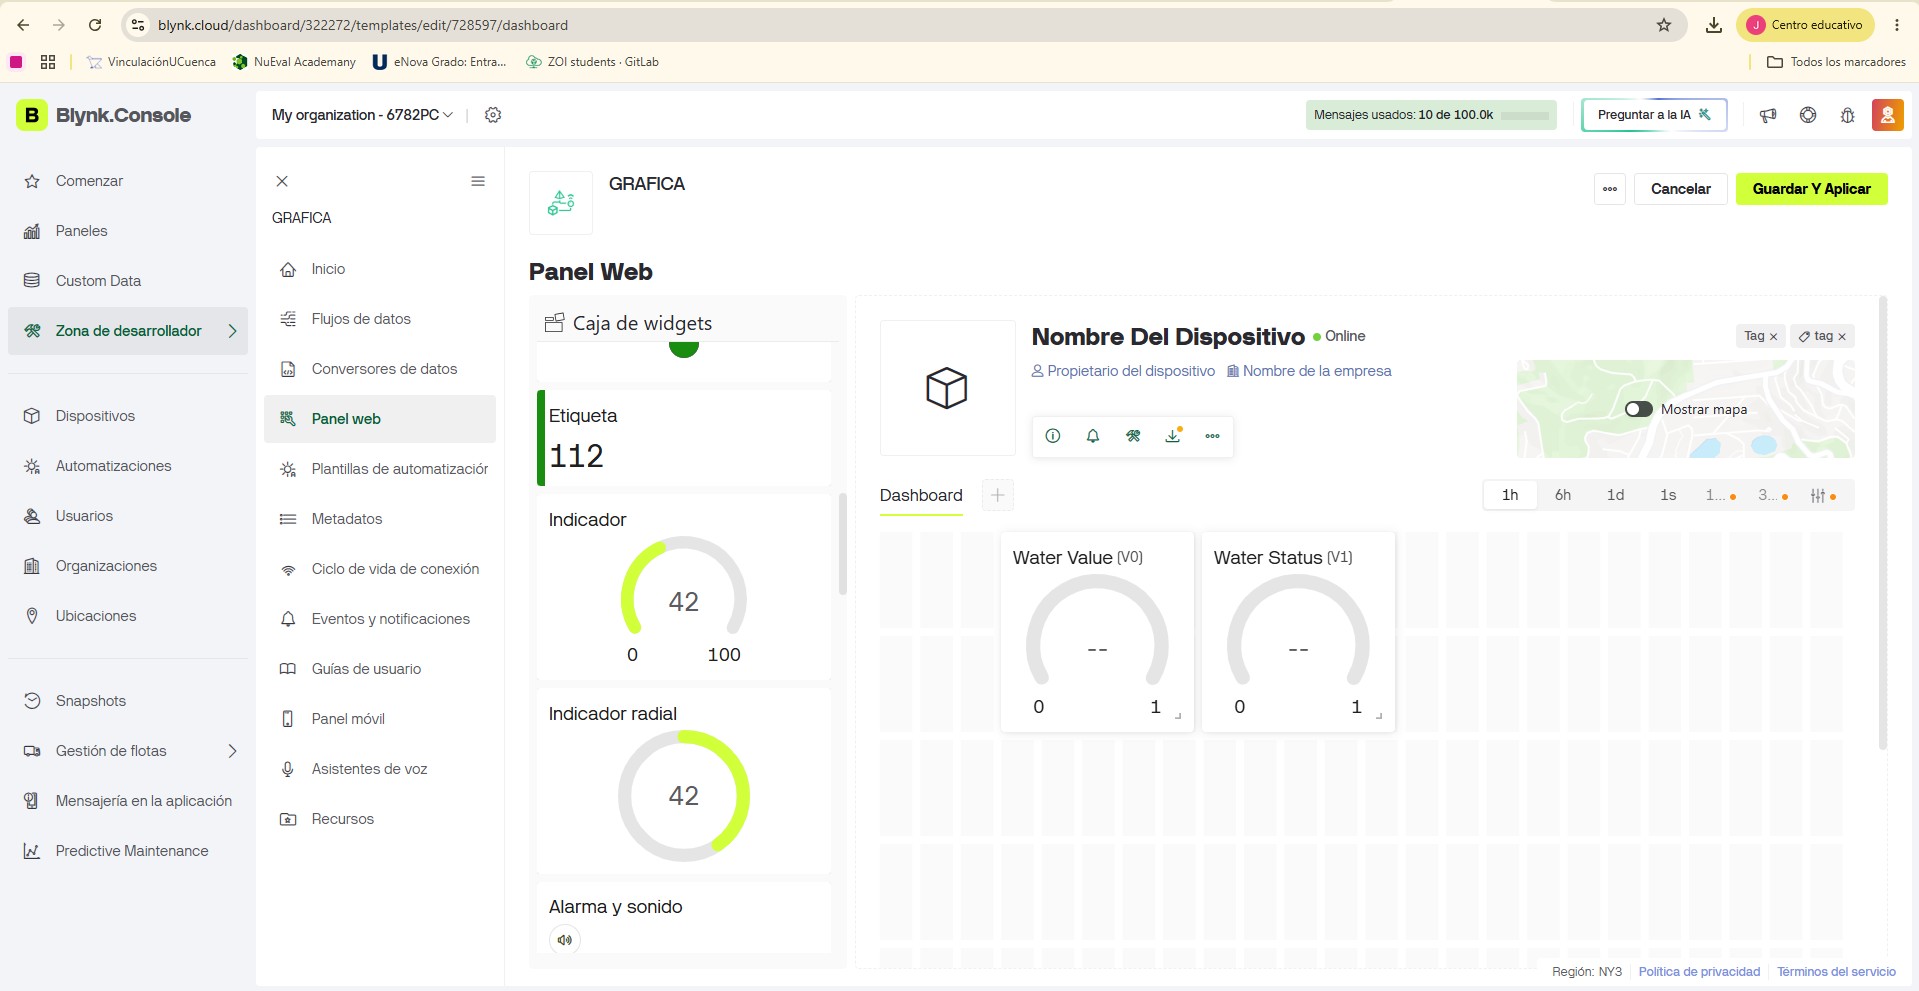
Figure 3. Test condition without water.
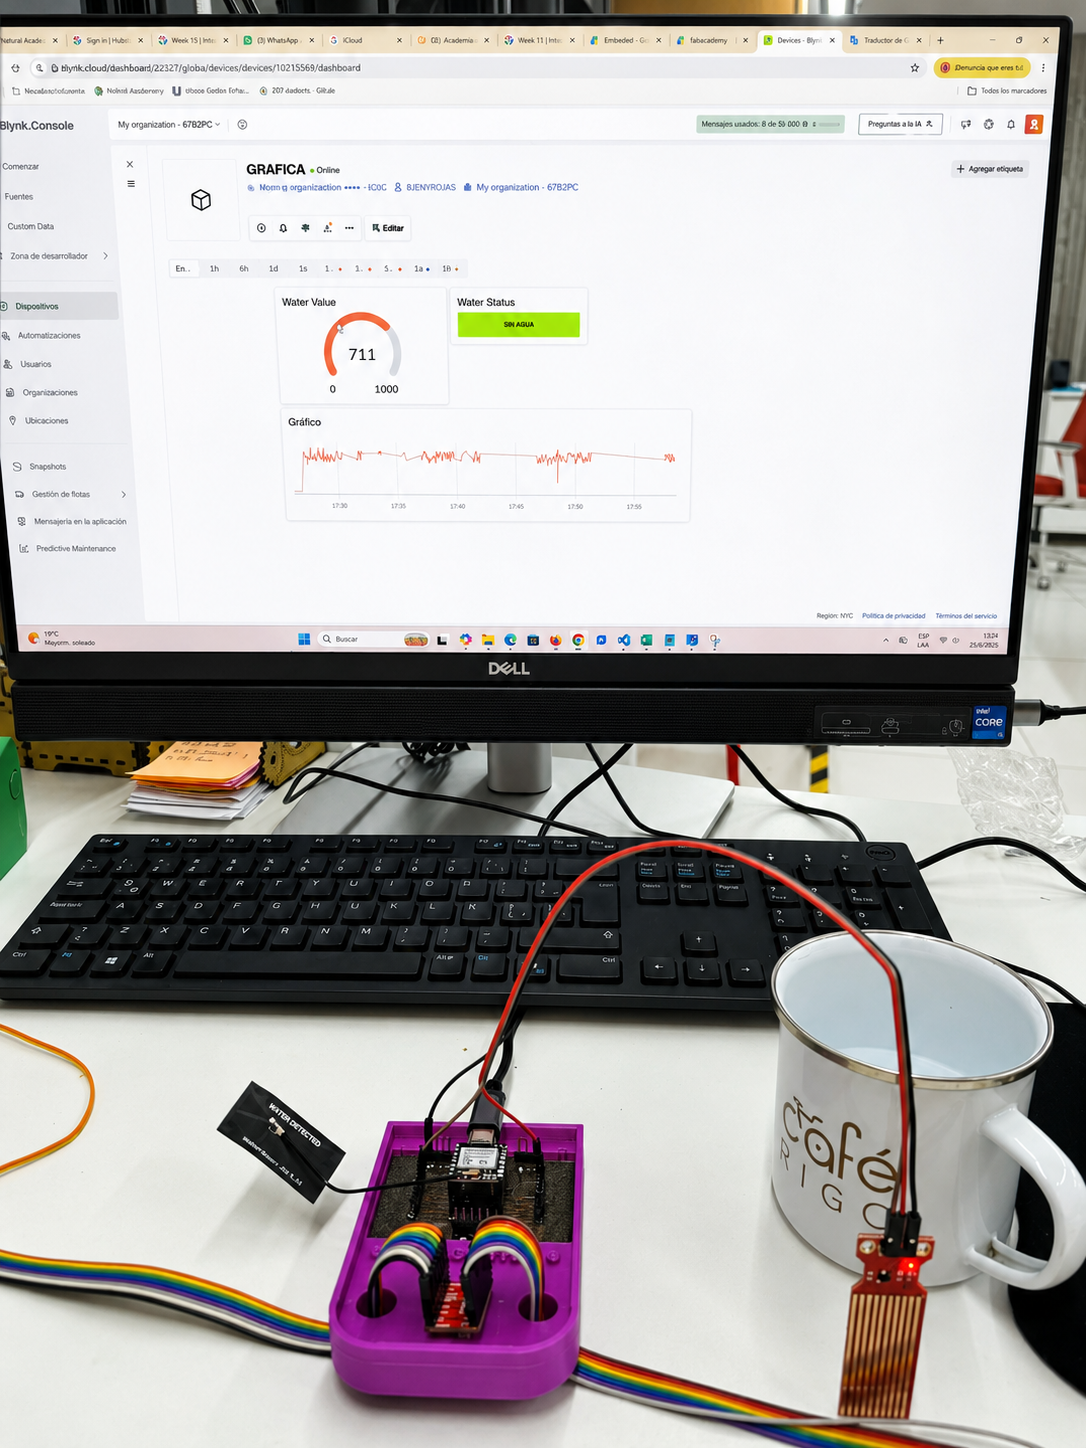
Figure 4. Test condition with water detected.
Evidence
The following evidence documents the development and validation of the interface application. I selected only the most relevant images and video captures to show the hardware setup, the programming environment, the Blynk dashboard, and the final operation of the system.
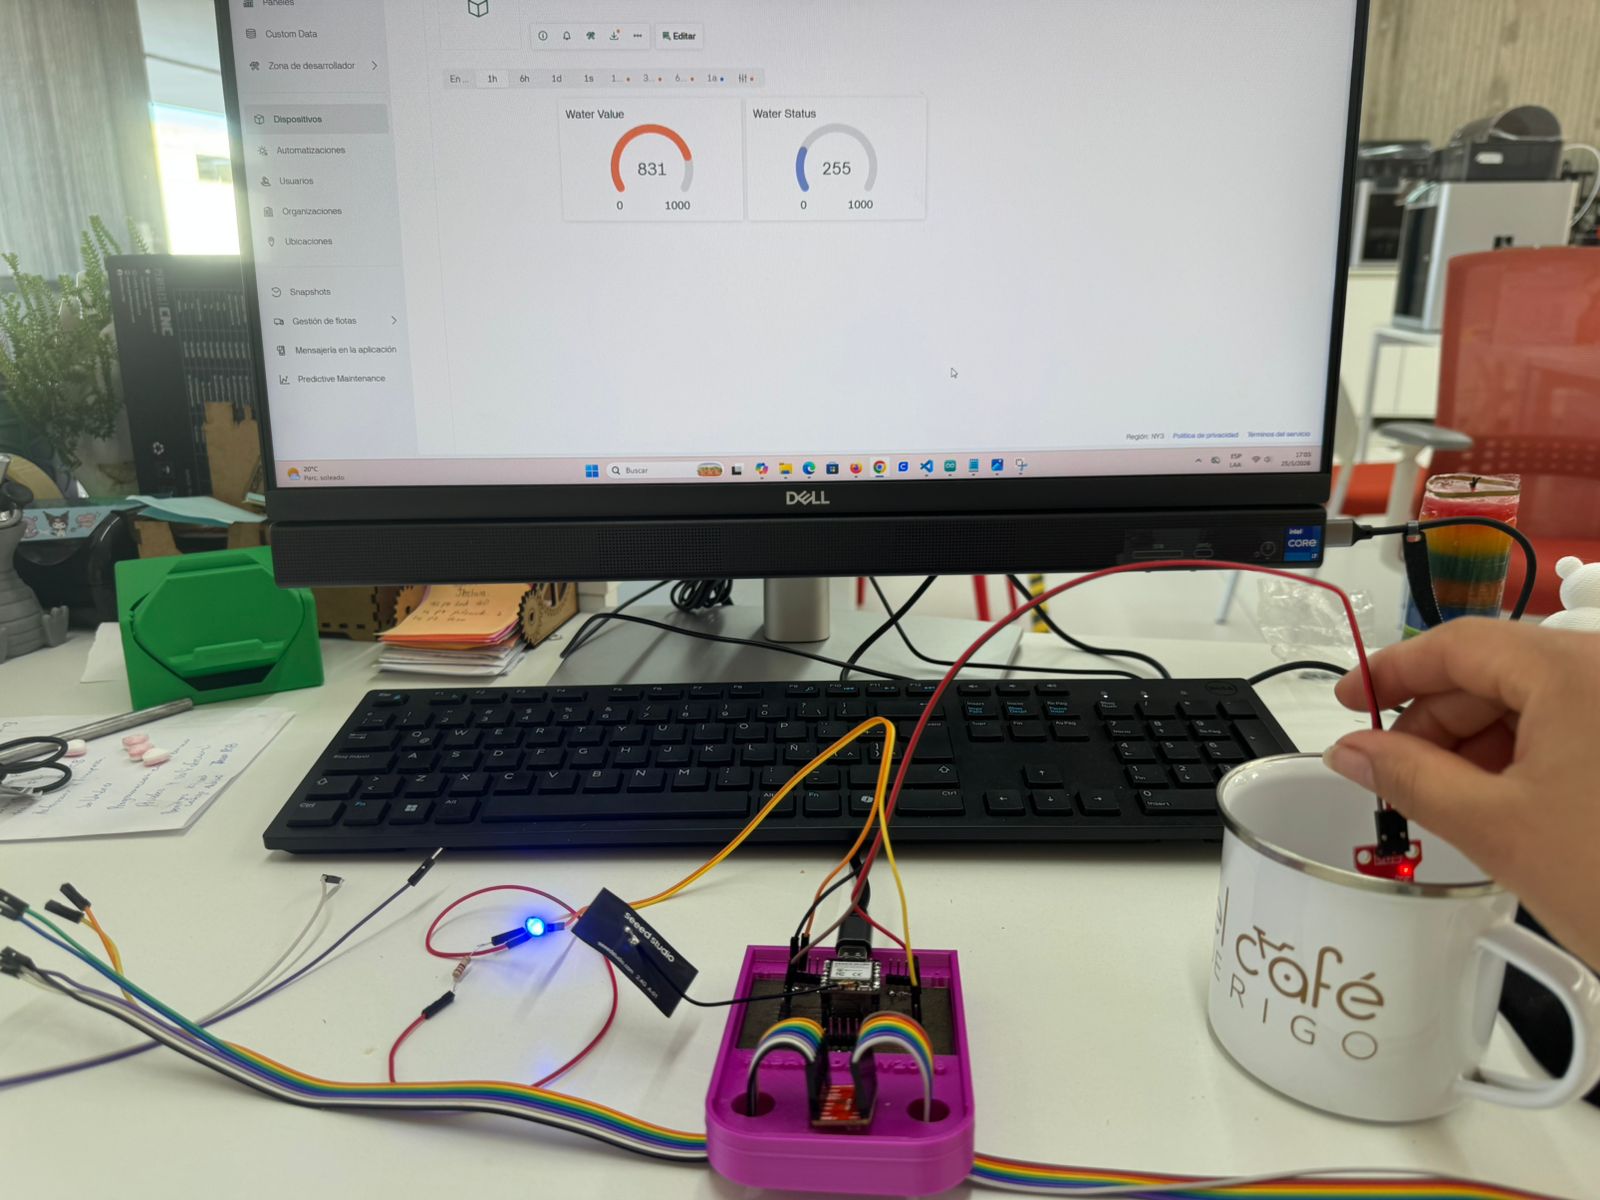
Figure 5. Hardware assembly showing the XIAO ESP32C3 connected to the water sensor and indicator system.
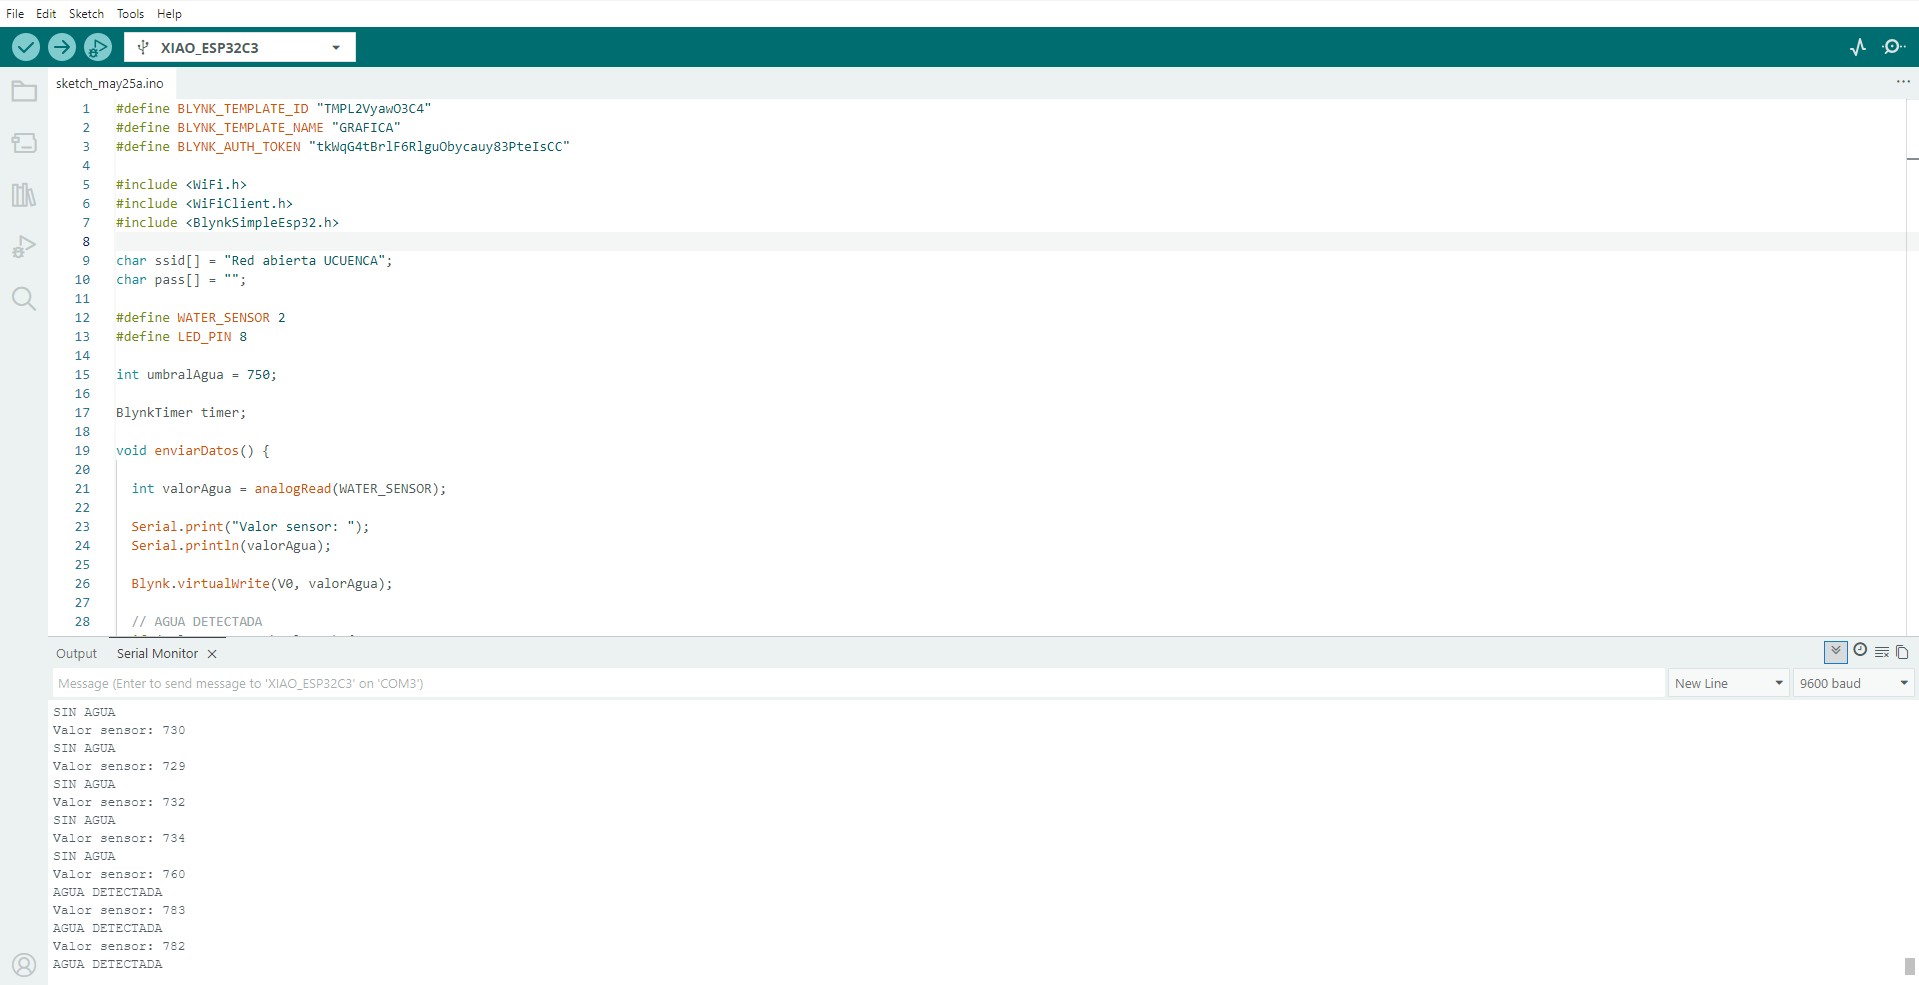
Figure 6. Arduino IDE environment used to program the embedded application.
Figure 7. Blynk dashboard configuration used to monitor the water sensor values in real time.
Individual Reflection
This assignment helped me understand how embedded devices can become part of larger interconnected systems. Beyond simply programming a microcontroller, I learned how to design an application that enables interaction between hardware and users through cloud technologies.
The experience strengthened my skills in sensor integration, wireless communication, dashboard development, and debugging embedded systems. These lessons will be directly applicable to the development of my final project, where monitoring and decision-making play a central role.
Hero Shot
The final prototype integrates the XIAO ESP32C3, the water sensor, and the Blynk cloud platform into a complete IoT monitoring application. The system detects the presence or absence of water, transmits the data wirelessly, and displays the information through a dashboard that the user can read in real time.
The videos below show the final operation of the system. Both videos are displayed in one row and keep their original proportions to avoid distortion.
Figure 8. Final Hero Shot showing the operation of the Water Detection Monitoring System and the interaction between the XIAO ESP32C3, water sensor, and Blynk dashboard.
Conclusion
This assignment successfully demonstrated the development of a complete application integrating embedded electronics, sensor acquisition, wireless communication, and cloud-based visualization. Through the use of the XIAO ESP32C3, a water sensor, and the Blynk IoT platform, it was possible to establish a functional communication system capable of collecting real-time information and presenting it to the user through an intuitive and interactive interface.
One of the most valuable aspects of this assignment was understanding how different technologies can be integrated into a single application. The project required combining hardware design, embedded programming, cloud communication, dashboard development, and system validation.
During development, several challenges related to pin connections and hardware configuration were encountered. Although these issues initially prevented proper operation, they became an important learning opportunity. Troubleshooting the system improved my understanding of the XIAO ESP32C3 architecture, signal acquisition, power distribution, and debugging methodologies commonly used in embedded systems development.
The final application was able to detect the presence of water, transmit sensor readings through WiFi, update cloud-based dashboards, and provide immediate feedback through visual indicators. This demonstrates the potential of IoT technologies for monitoring and automation applications.
This assignment contributes directly to the development of my autonomous orchid irrigation system, since real-time monitoring, wireless communication, and user interaction are essential components of the final project.
Student Checklist — Fab Academy
- ✔ Wrote an application for the embedded board.
- ✔ Connected an input device to the system.
- ✔ Created user interaction through Blynk.
- ✔ Programmed wireless communication.
- ✔ Visualized real-time data.
- ✔ Documented the programming process.
- ✔ Included testing and debugging process.
- ✔ Demonstrated a working interface application.