Assignment 9 :- Input Devices
Learning Outcomes
In this input week, I learned about sensor technology and understood how sensors work. During this week, I used the DHT11 sensor and a light intensity sensor because I plan to use them in my final project. I also learned how to program and interface different sensors with a microcontroller.
Heroshot
This week Task
Group Assignment :- we probed the input device’s analog levels and digital signals using a multimeter and an oscilloscope to analyze and verify the sensor output signals.
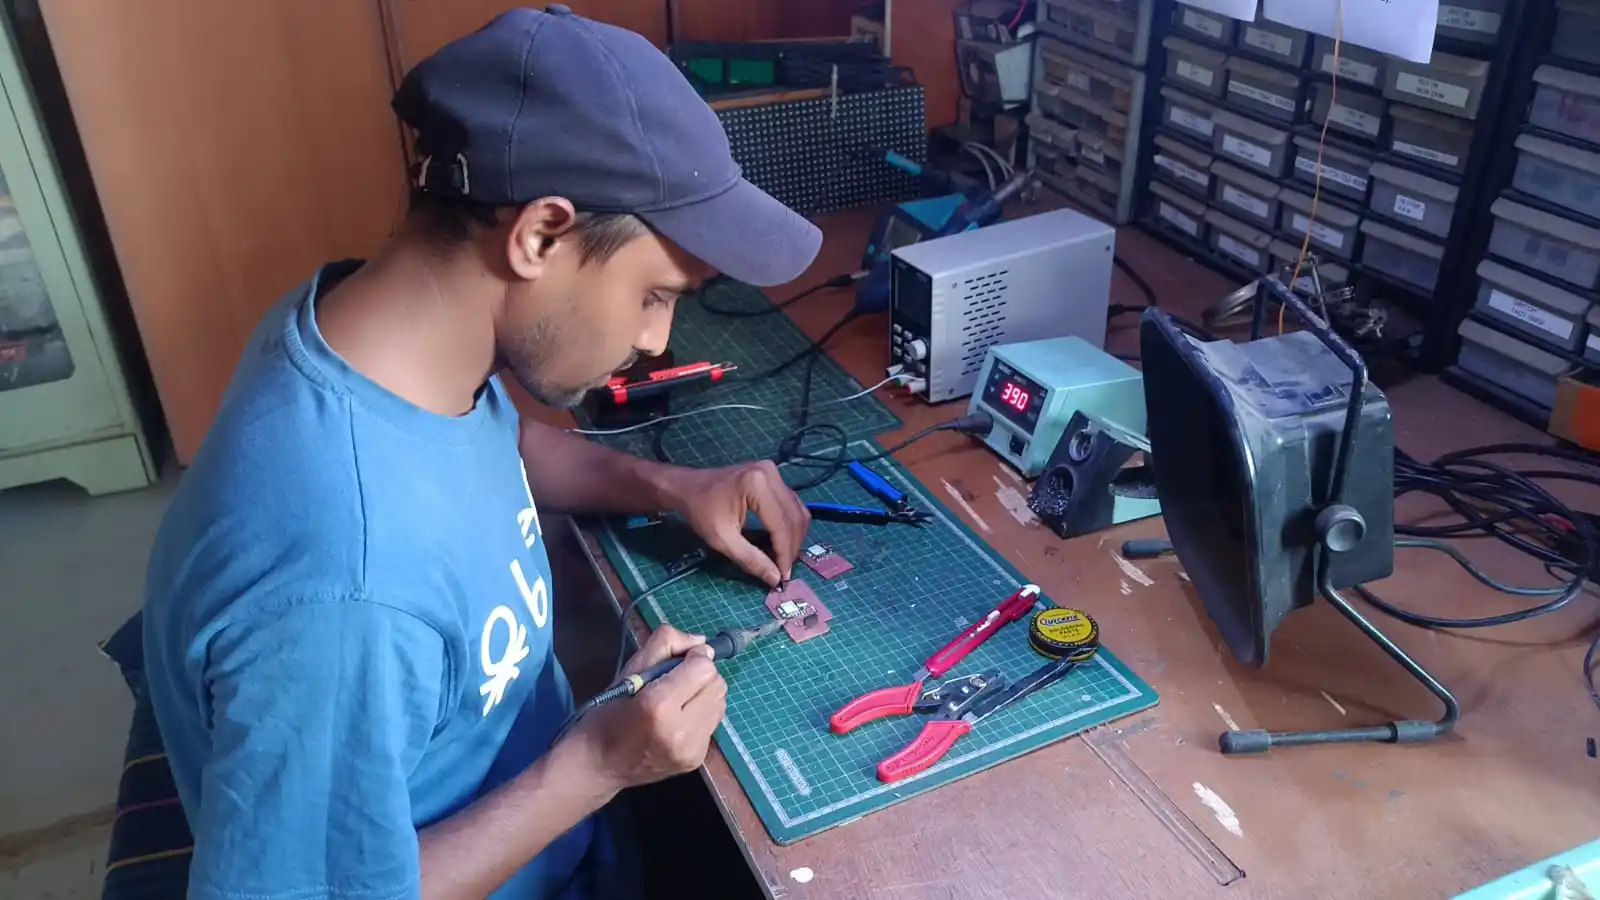
In this group assignment, I worked with the DHT22 sensor to study its signal output. The sensor data was displayed on the serial monitor using a microcontroller. I also checked the voltage fluctuations and signal behavior using a multimeter and an oscilloscope.
This helped me understand the analog and digital signal characteristics of the sensor.
The DHT22 sensor is commonly used in various projects because it provides good accuracy for temperature and humidity measurement. The sensor detects the surrounding atmospheric temperature and moisture levels. It can measure temperatures from 0°C to 80°C and humidity levels from 0% to 100%. In this project, the DHT22 sensor was connected to a microcontroller and programmed to read the sensor data. The measured temperature and humidity values were displayed on the serial monitor. A graph of the sensor readings was also generated for better visualization and analysis
The DHT22 sensor mainly has three pins: VCC (3.3V), GND, and a signal pin. These pins are connected to the microcontroller for communication and power supply. The sensor measures and provides temperature and humidity data from the surrounding environment. The collected data is then processed and displayed through the microcontroller.
The graph below shows the temperature and humidity readings collected from the DHT22 sensor.
Click here to read more about our group assignment.
group assignment.
What is Sensor
A sensor is an electronic device used to detect and measure physical parameters from the environment. Sensors can measure temperature, light intensity, pressure, motion, humidity, moisture, and many other variables. The measured physical changes are converted into electrical signals, which can then be processed by a microcontroller or computer system. Sensors are widely used for monitoring, automation, and data analysis in various applications. The processed sensor data is presented in a human-readable format for easy interpretation and decision-making.
Type of Sensor
Sensors are classified into different categories based on power source, output type, and conversion phenomenon. Different types of sensors are available under each classification.
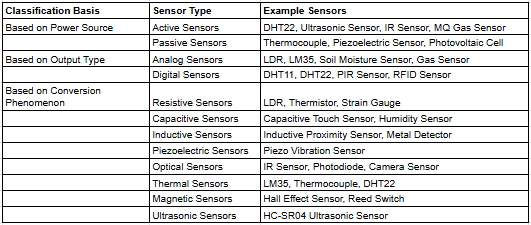
The following table was generated with the help of ChatGPT.
Reference.
For my final project, I used a temperature sensor and a light intensity sensor to monitor environmental conditions.
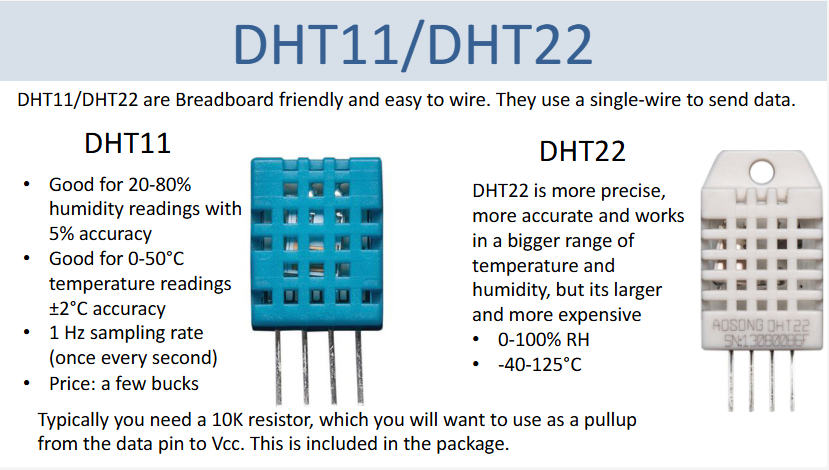
Temperature sensor
Different types of temperature sensors are available, but for this project, I used the DHT11 and DHT22 sensors. These sensors are widely used for measuring temperature and humidity in environmental monitoring applications.
They are available in both 3-pin and 4-pin configurations, with the main connections being VCC, GND, and signal pin. The sensors are capable of measuring temperatures from -40°C to 80°C and humidity levels from 0% to 100%, with good measurement accuracy.
Reference.
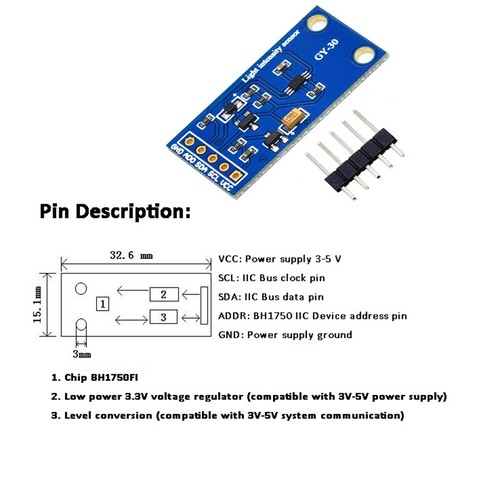
light intensity sensor(BH1750)
The BH1750 is a digital ambient light sensor used to measure the intensity of light in the surrounding environment. It features a high-precision 16-bit A/D converter and communicates through the I2C protocol, making it simple to interface with microcontrollers. The sensor uses SDA and SCL pins for data communication. Unlike analog light sensors, the BH1750 directly outputs light intensity values in lux (lx), eliminating the need for additional calculations. The measurable light intensity range is from 0 to 65,535 lux, which makes the sensor suitable for smart lighting and environmental monitoring applications.
datasheet.
Individual Assignment
Individual Assignment
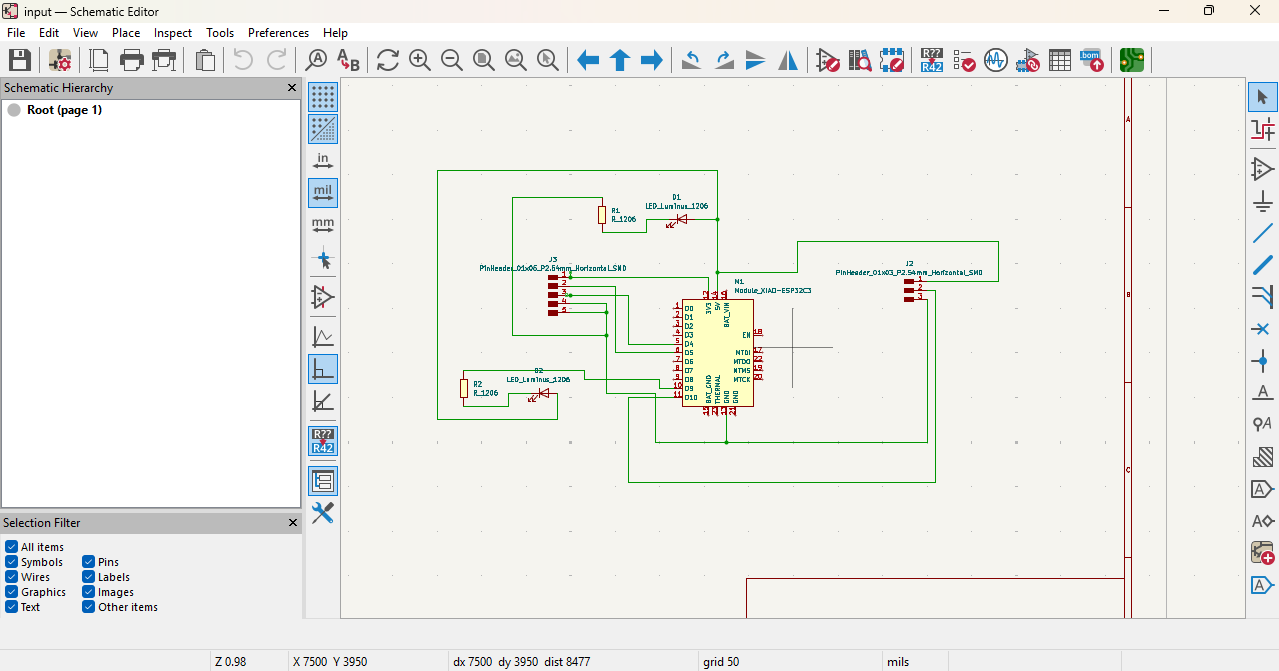
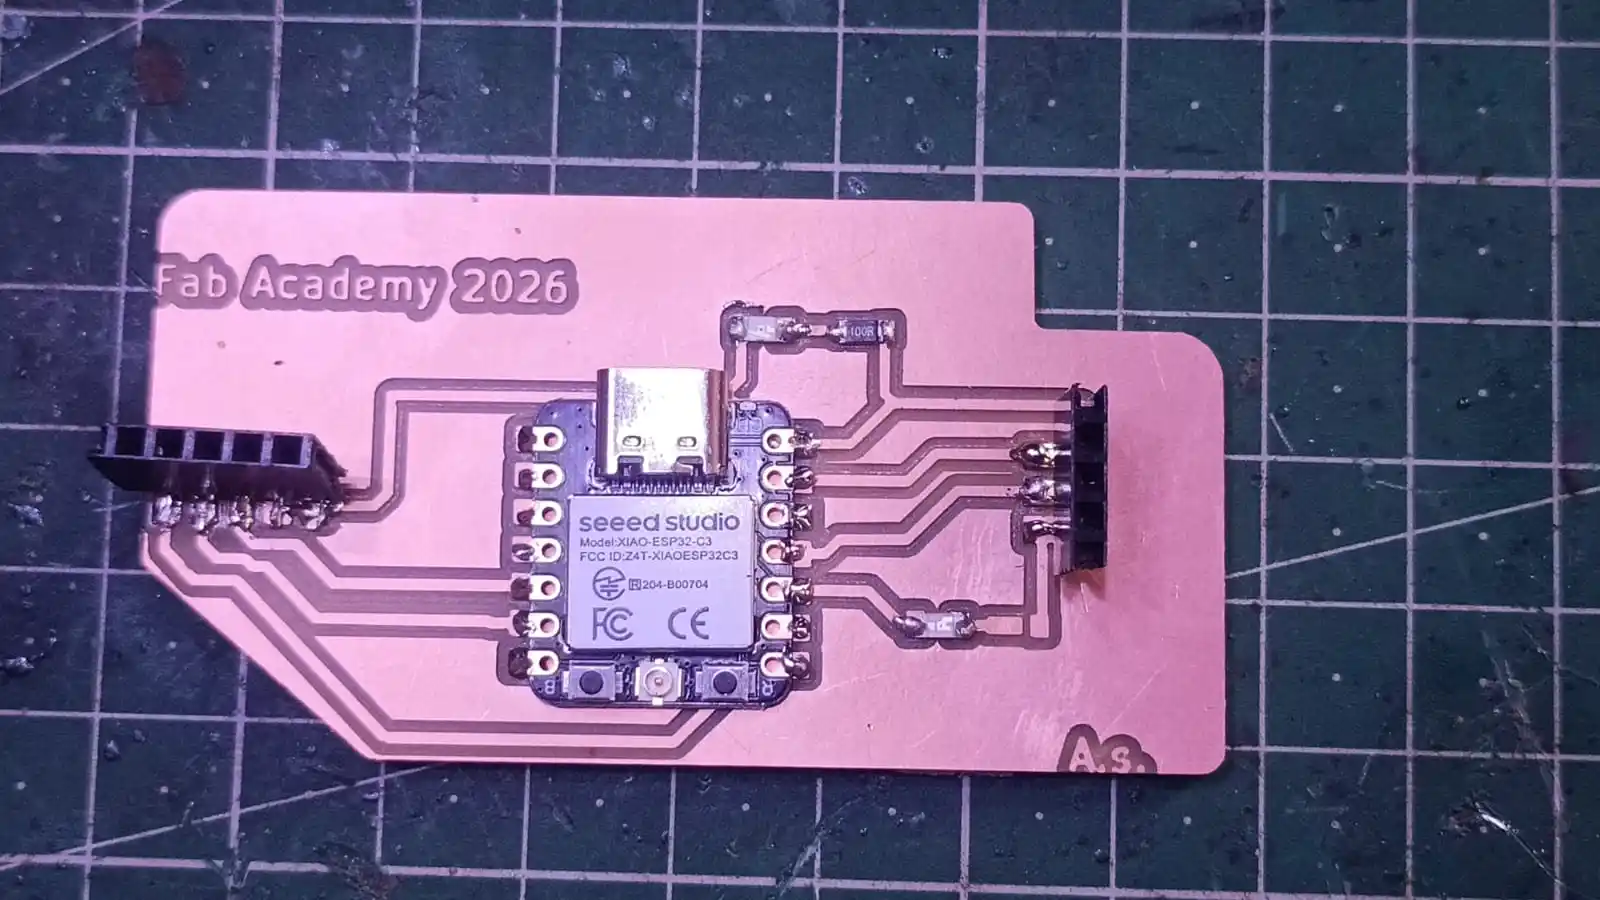
For my individual assignment, I first designed an input device board using KiCad software. In this board, I used two sensors: a temperature and humidity sensor and a light intensity sensor. These sensors were selected according to the requirements of my final project. I also connected an LED to the board for output indication and testing purposes. While designing the PCB, I created the schematic, arranged the components, and routed the traces carefully in KiCad. After completing the design, the PCB files were prepared for the milling and fabrication process.
I documented every step of the process, including schematic design, PCB layout, component selection, milling, soldering, and testing of the board.
Step 1:- I started by opening the KiCad software and verifying that all required libraries were properly installed and updated. For the PCB design, I selected the XIAO ESP32-C3 microcontroller module along with supporting components such as resistors, LEDs, pin headers, and their corresponding footprints. The components were then connected in the schematic according to the required pin definitions and circuit design.
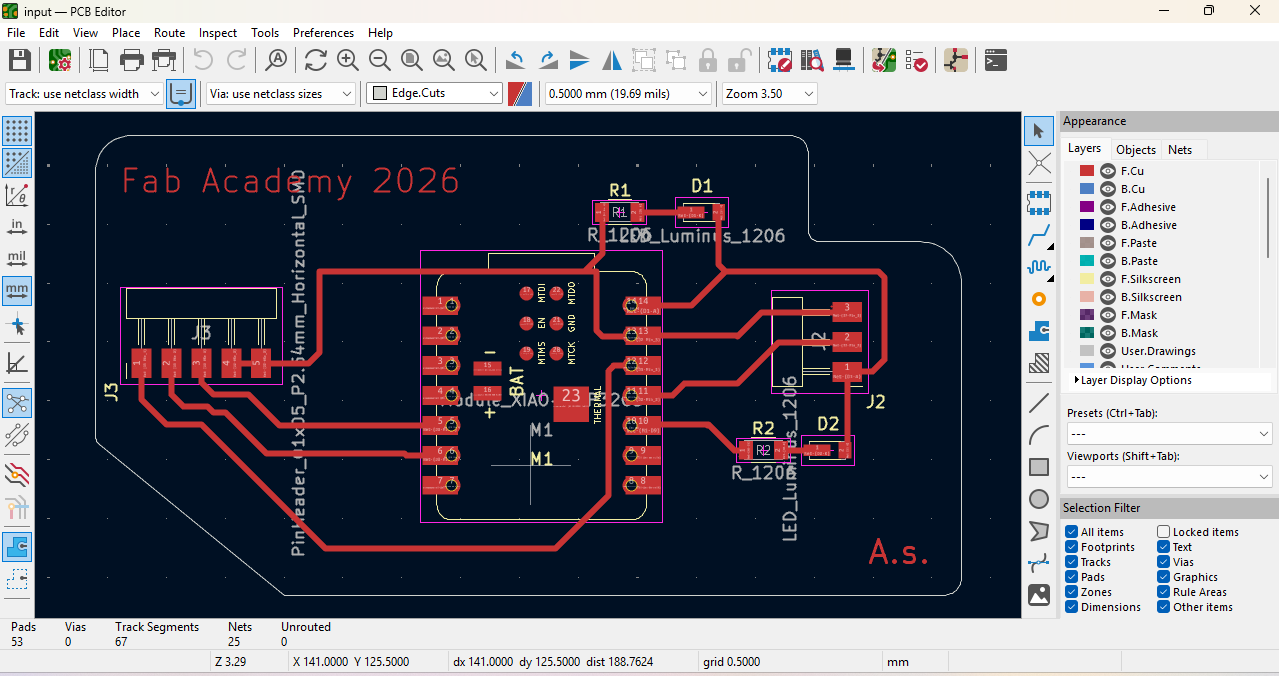
Step 2:-Once the schematic was completed, I updated the PCB layout and proceeded with PCB routing. All component connections and traces were routed carefully according to the circuit requirements. After completing the routing process, I checked the PCB design for errors and ensured all connections were correct. The project files were then saved, and the final Gerber files were generated for fabrication.
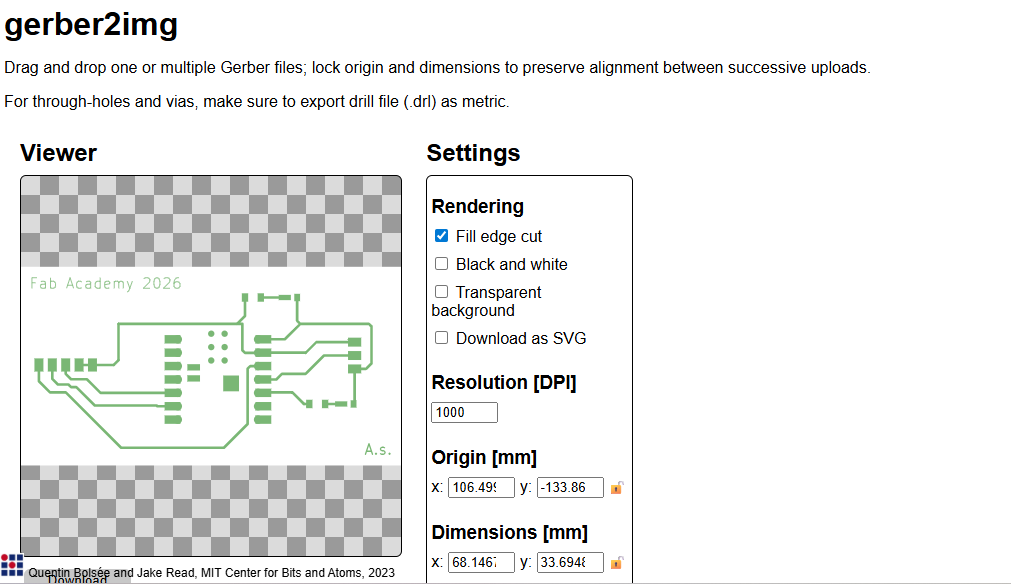
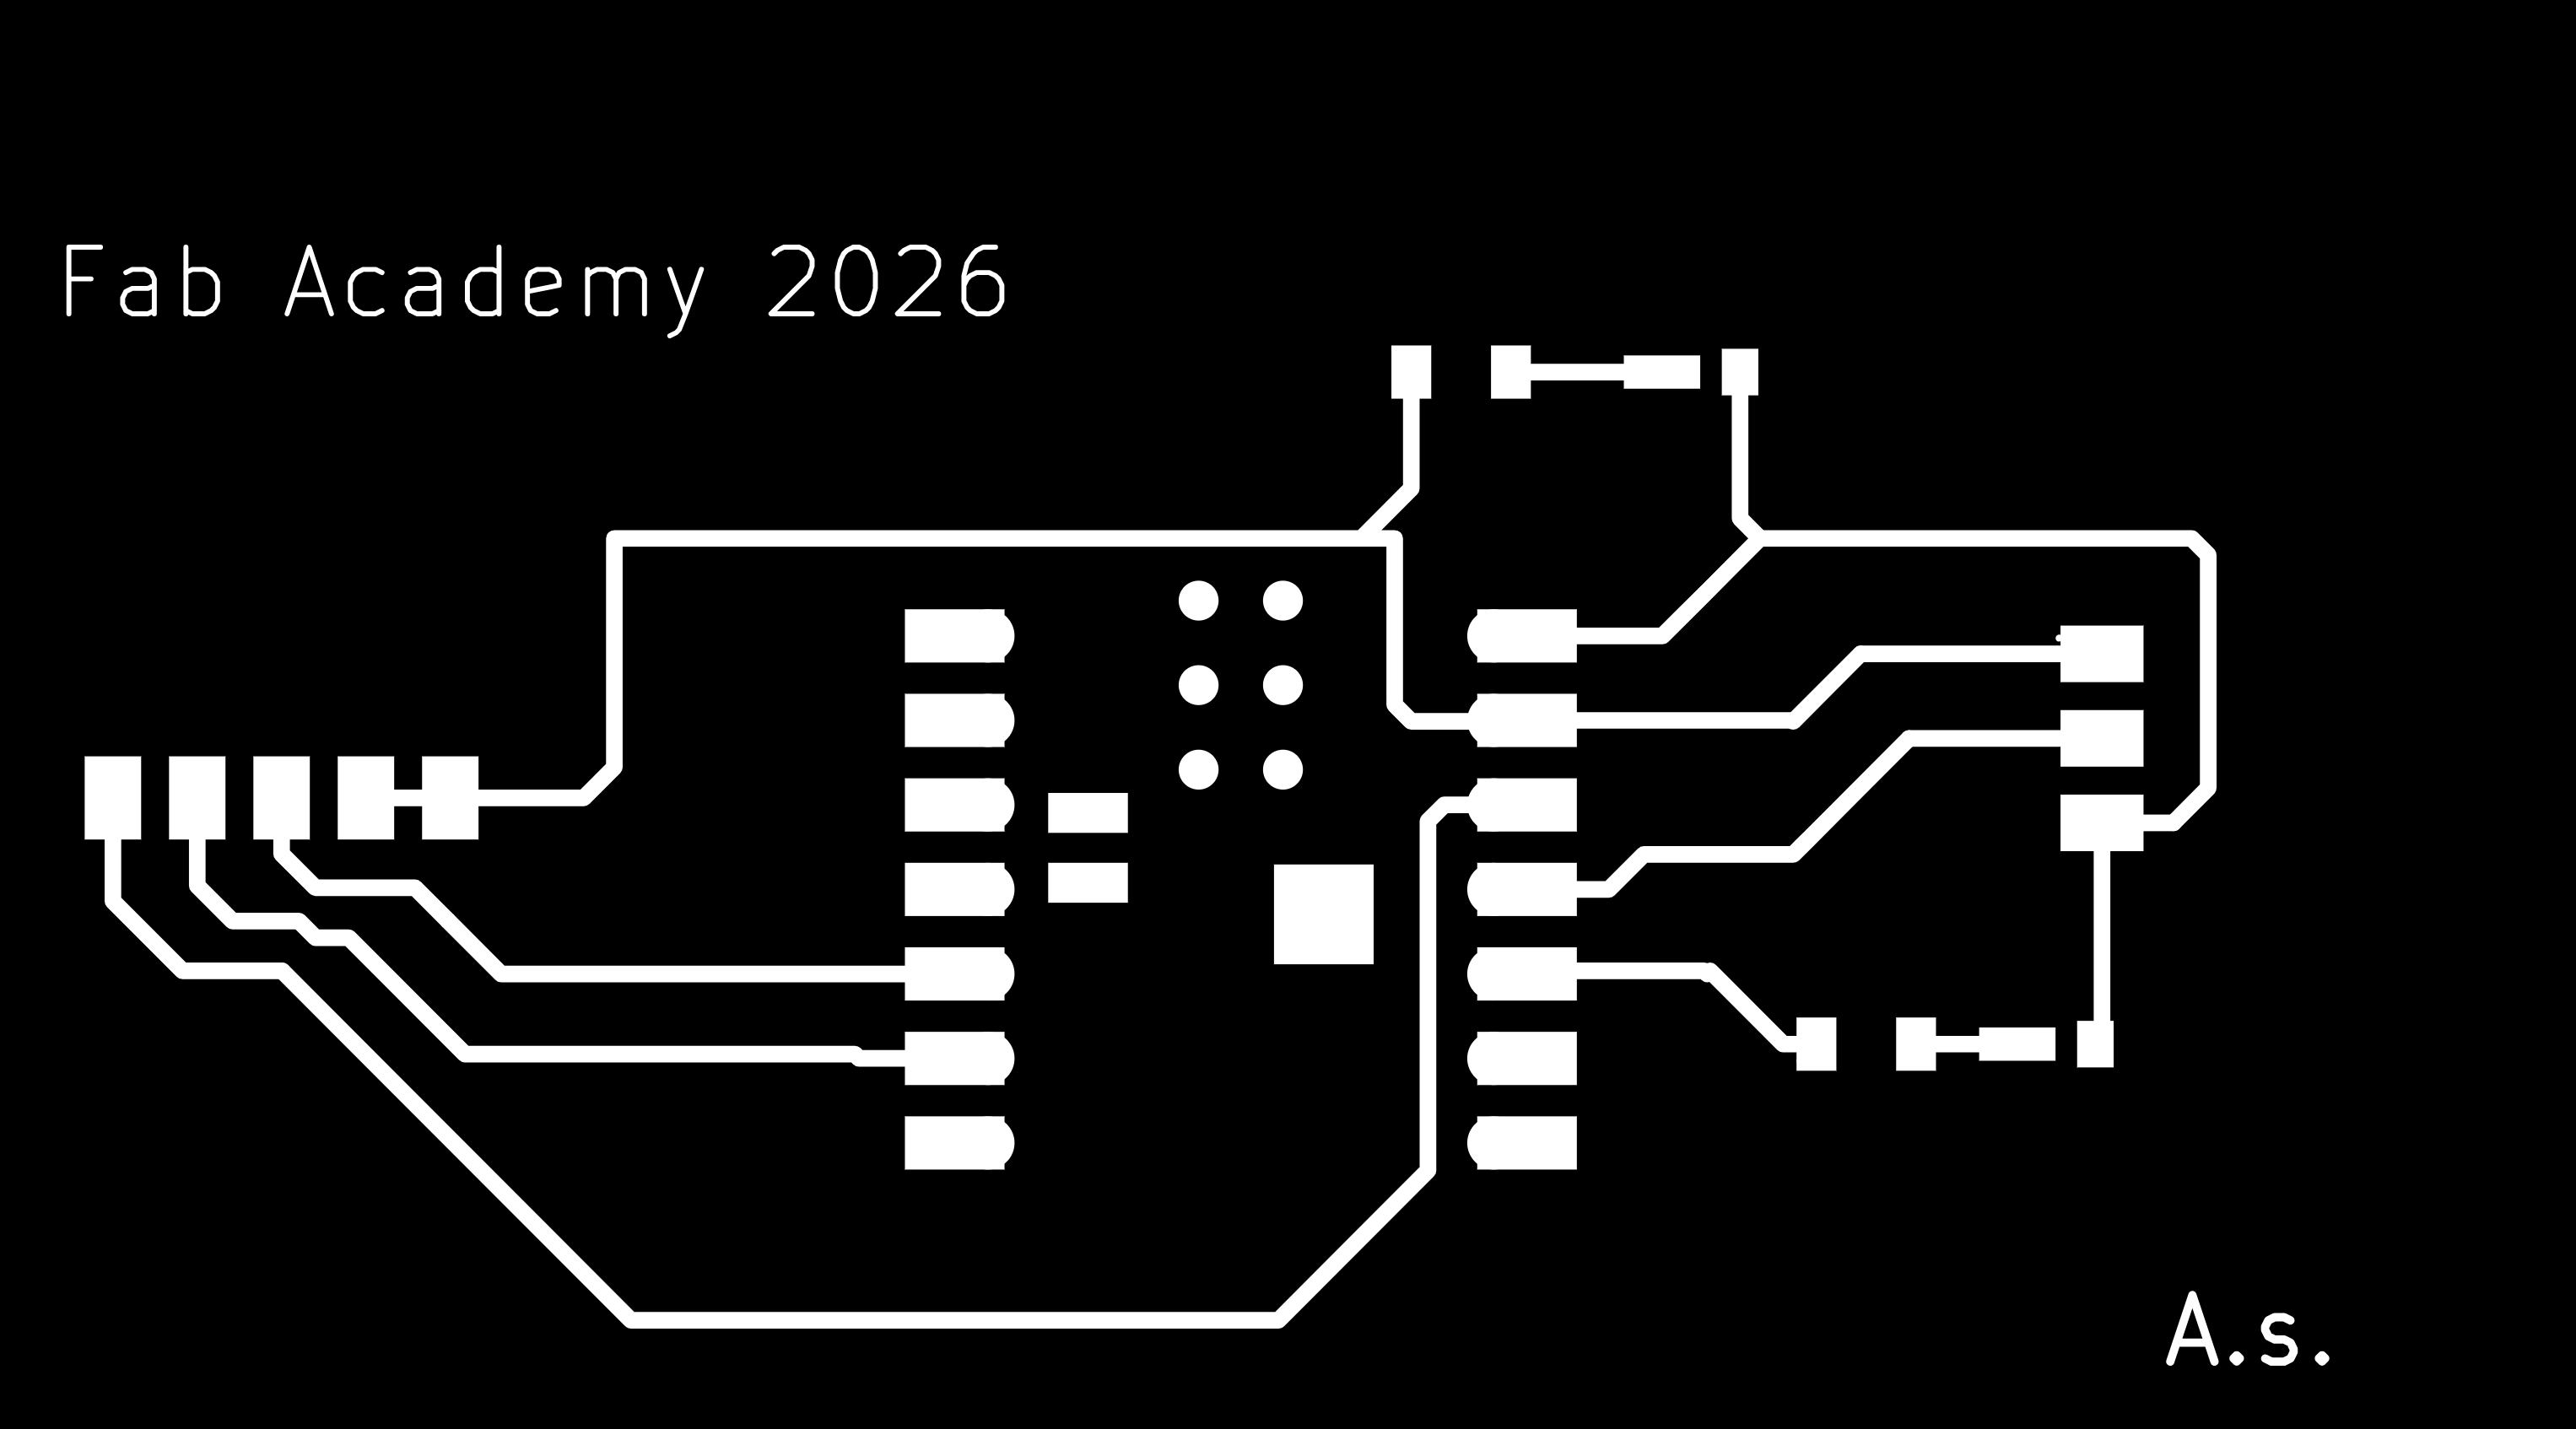
Step 3:- After generating the Gerber files, I converted them into trace and edge-cut PNG files required for the PCB milling process. To perform this conversion, I used the Gerber2Image tool. These generated image files were later used in the Mods software for toolpath generation and PCB fabrication.
gerber2img
Step 4:- Output of the trace and edge-cut PNG files.

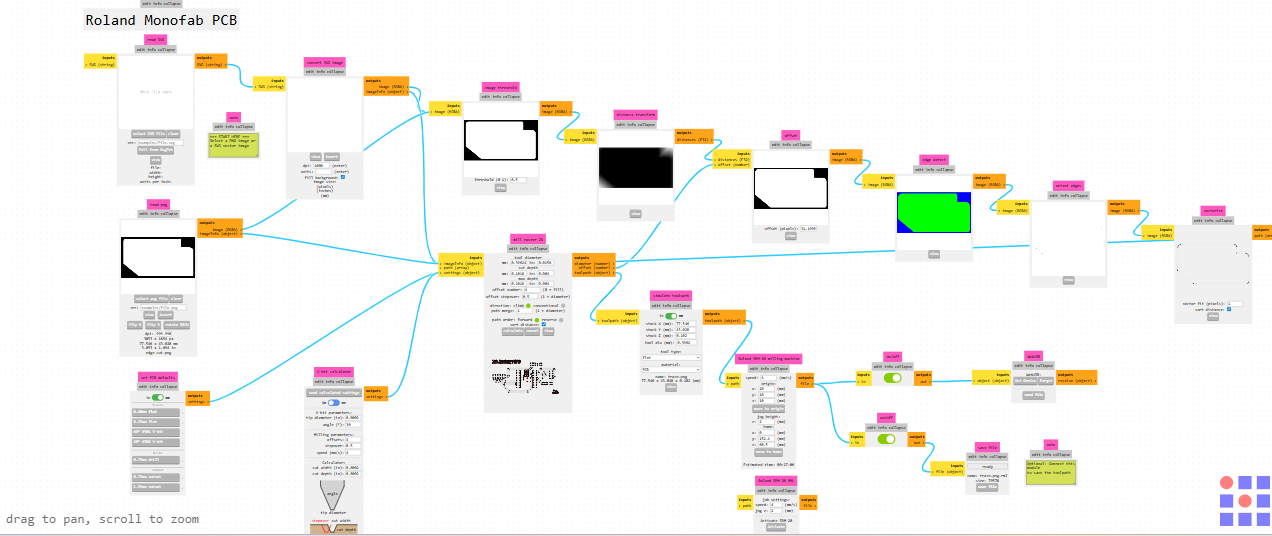
Step 5:- After generating the trace and edge-cut PNG files, they were imported into the Mods software to create the toolpaths required for PCB milling and cutting.
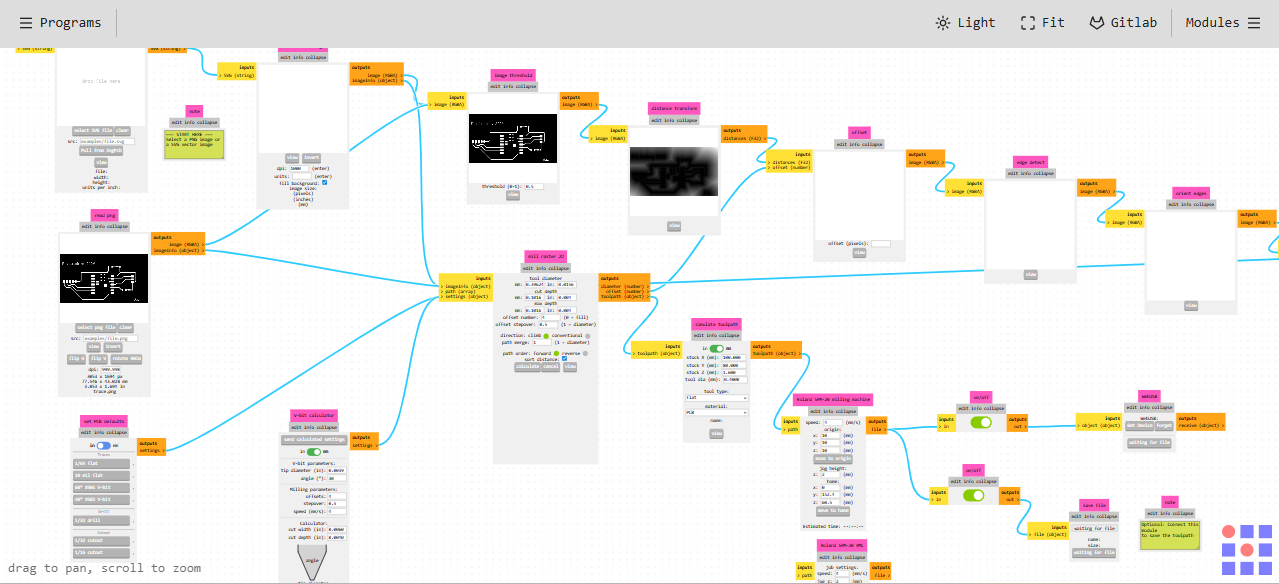
Step 6:-In the next step, the required milling tool was selected, and the calculation button was used to generate the toolpath parameters.
A 1/64-inch end mill bit was selected for milling the PCB traces because it is suitable for fine and precise trace cutting.
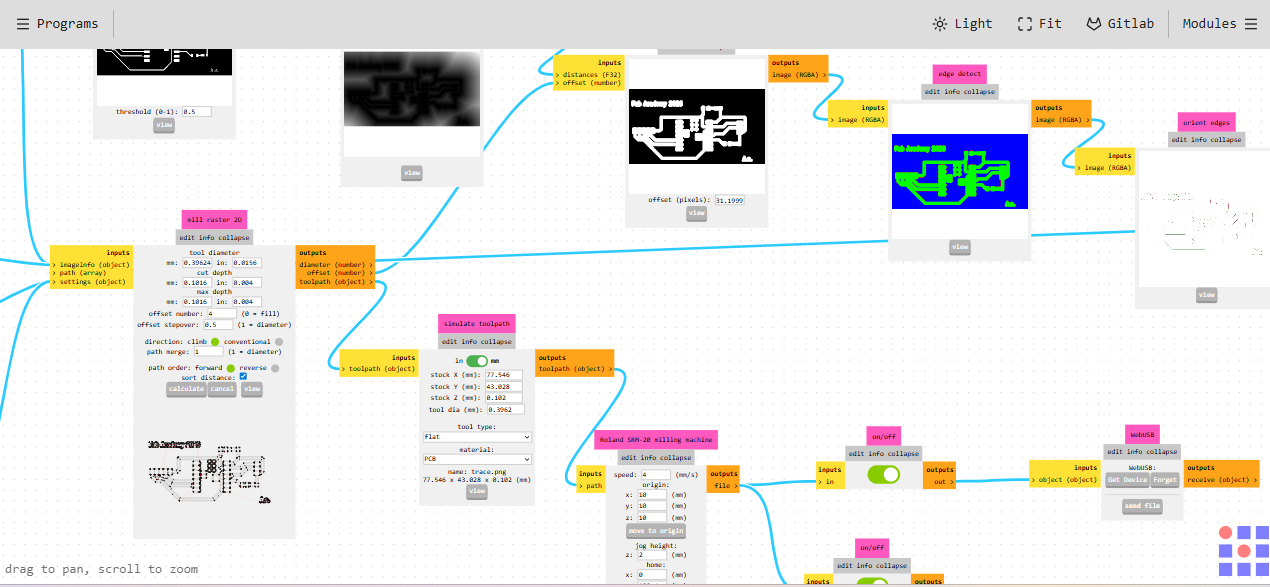
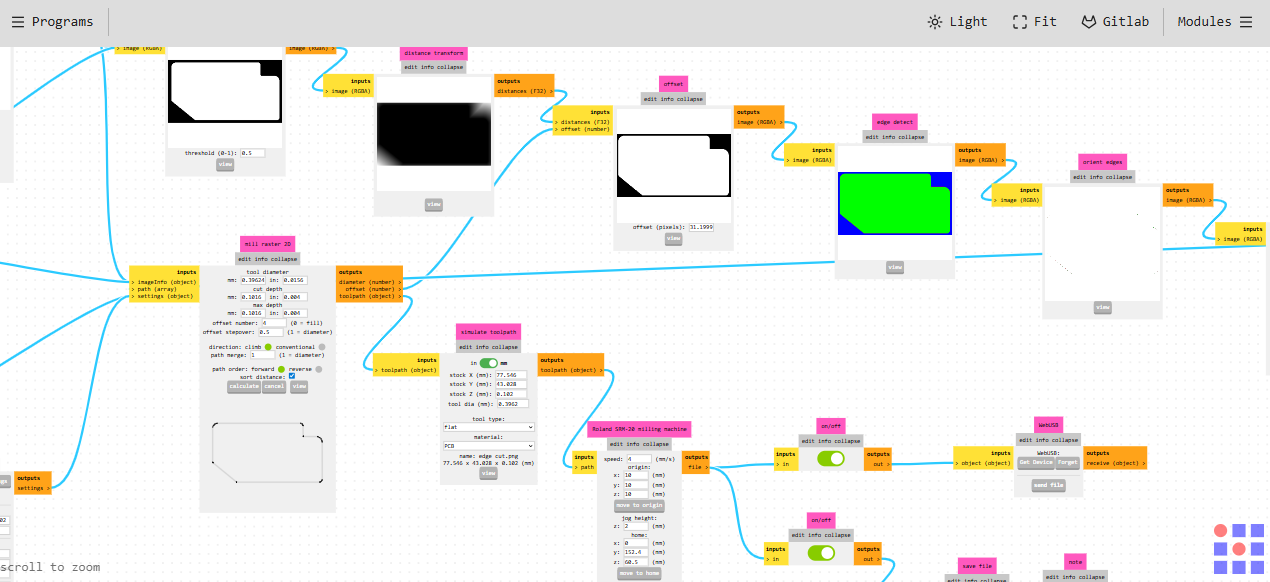
Step 7:- After generating the toolpath, the 3D view of the trace-cut design was checked to verify the milling preview and toolpath accuracy.
Step 8:-The edge-cut process followed the same workflow as the trace milling process. However, for cutting the PCB outline, the milling tool was changed to a 1/32-inch end mill bit.
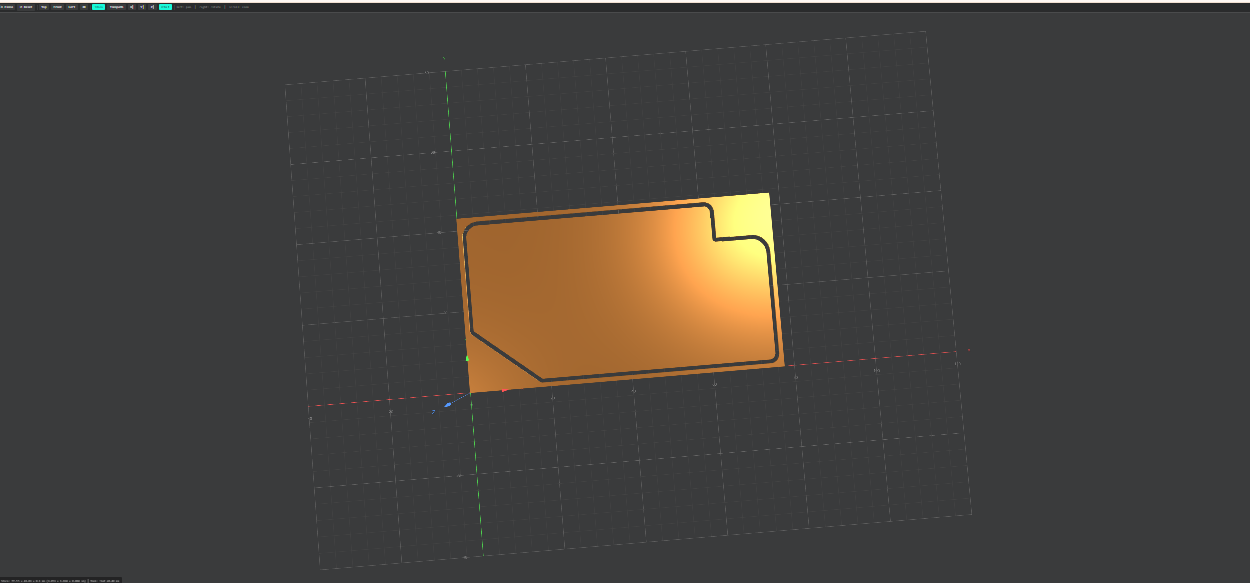
Step 9:-The following image shows the preview of the edge-cut toolpath generated for PCB cutting.
Step 10:-In the next step, the toolpath file was generated and prepared for the milling process. VPanel software was used to control the machine, and the 1/64-inch end mill bit was initially installed for PCB trace milling.
.webp)
.webp)
Step 11:-The milling machine was then operated to perform the PCB trace milling process using the generated toolpath.
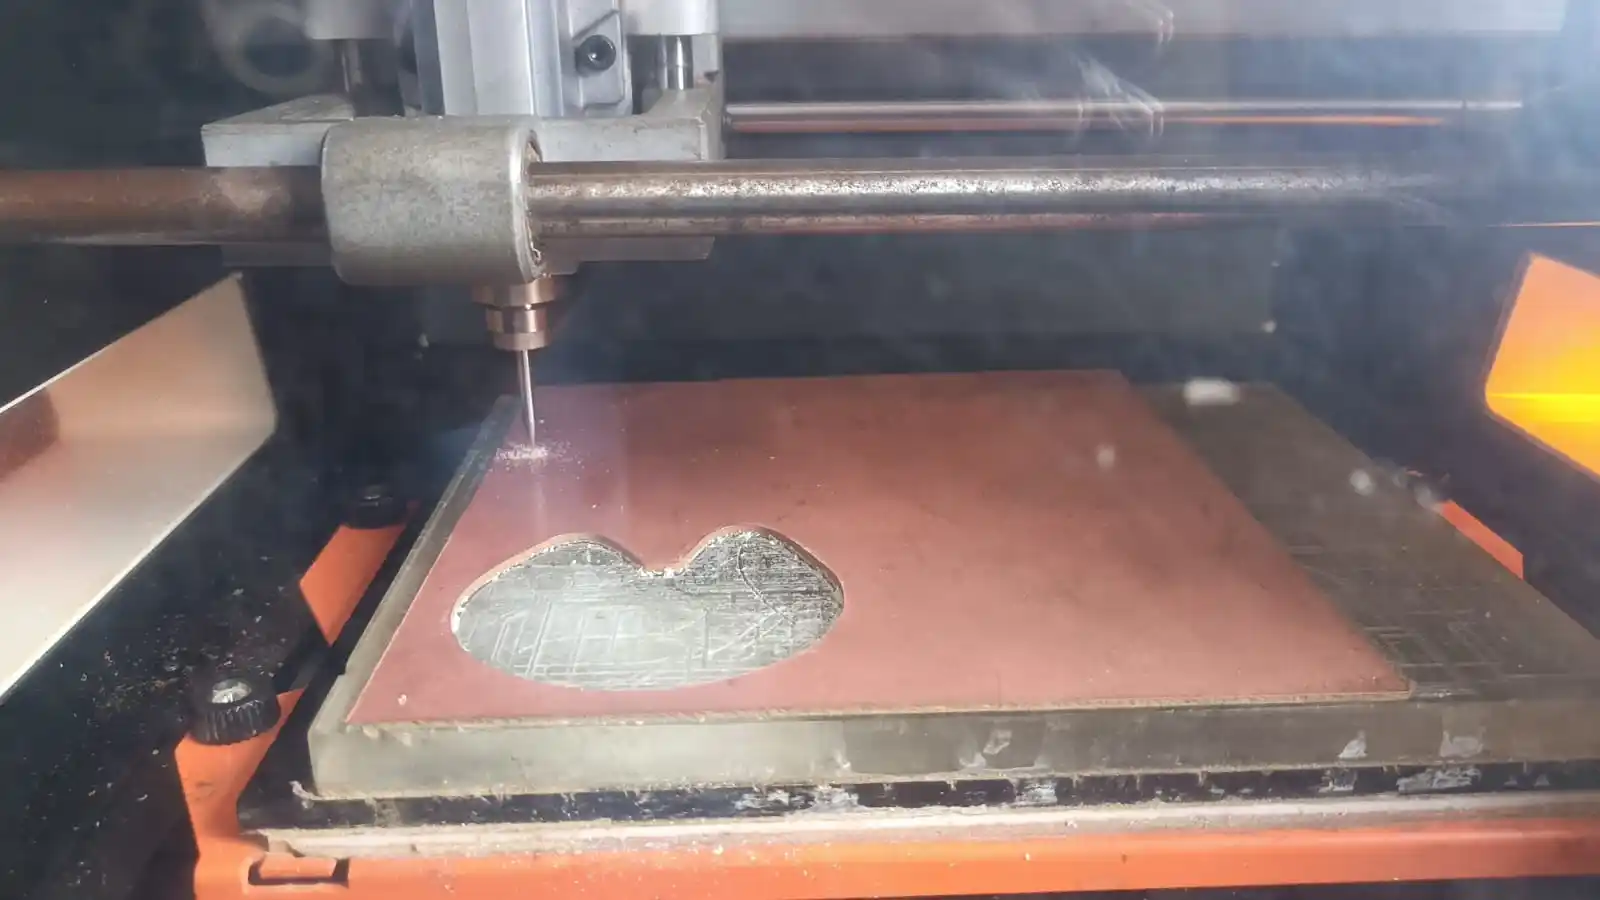
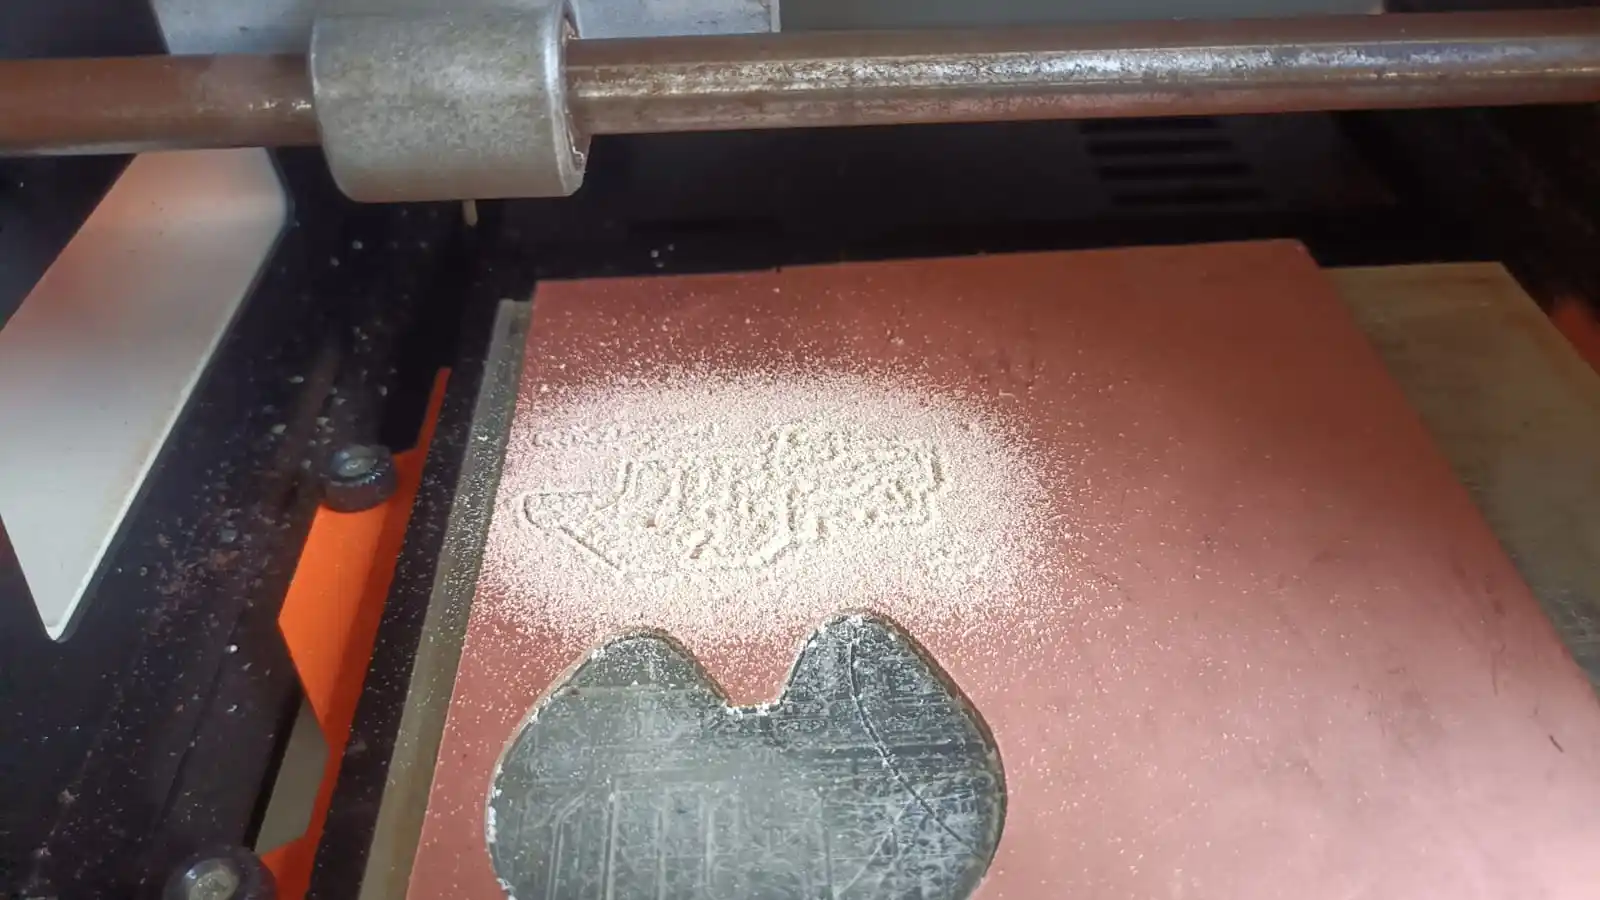
Step 12:-After the PCB trace milling was completed, the 1/64-inch milling bit was removed and replaced with a cutting bit for performing the edge-cut operation.
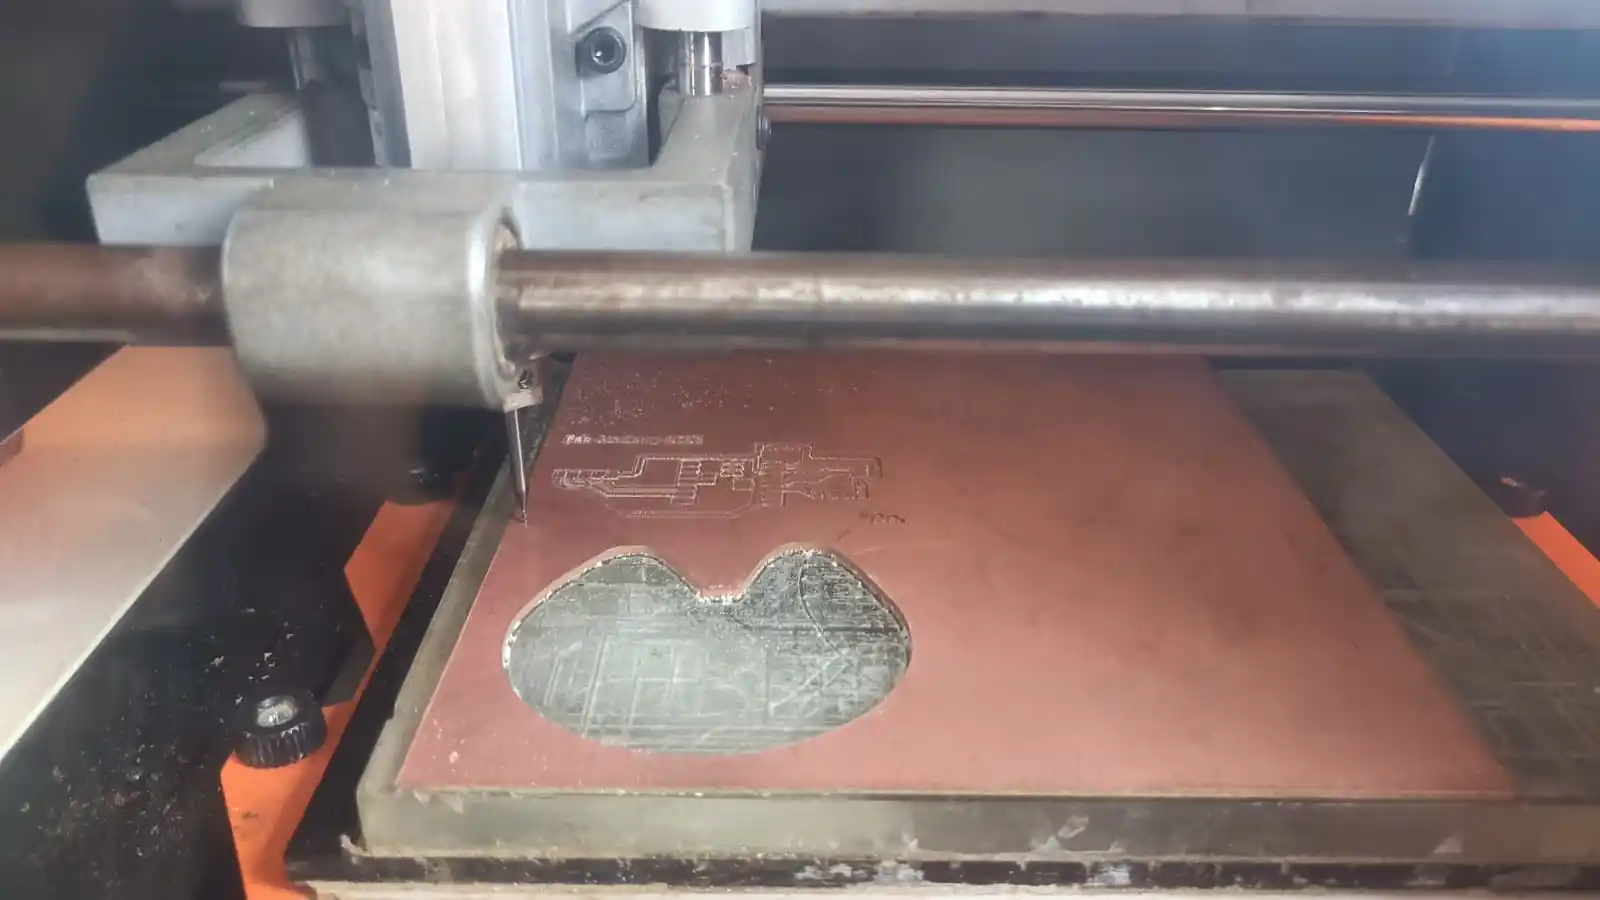
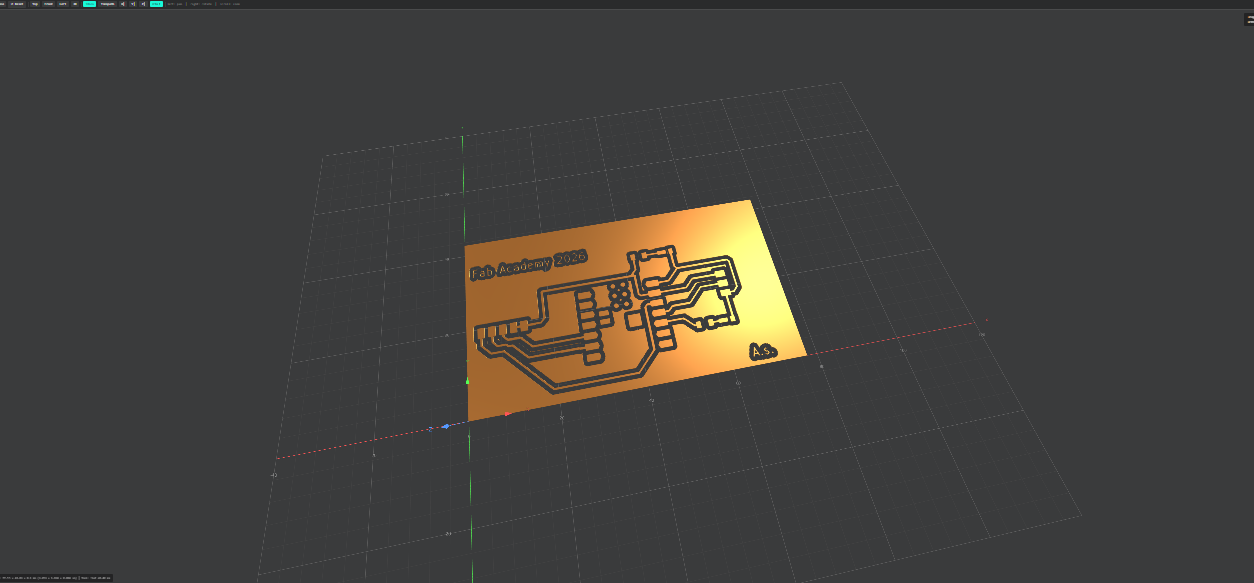
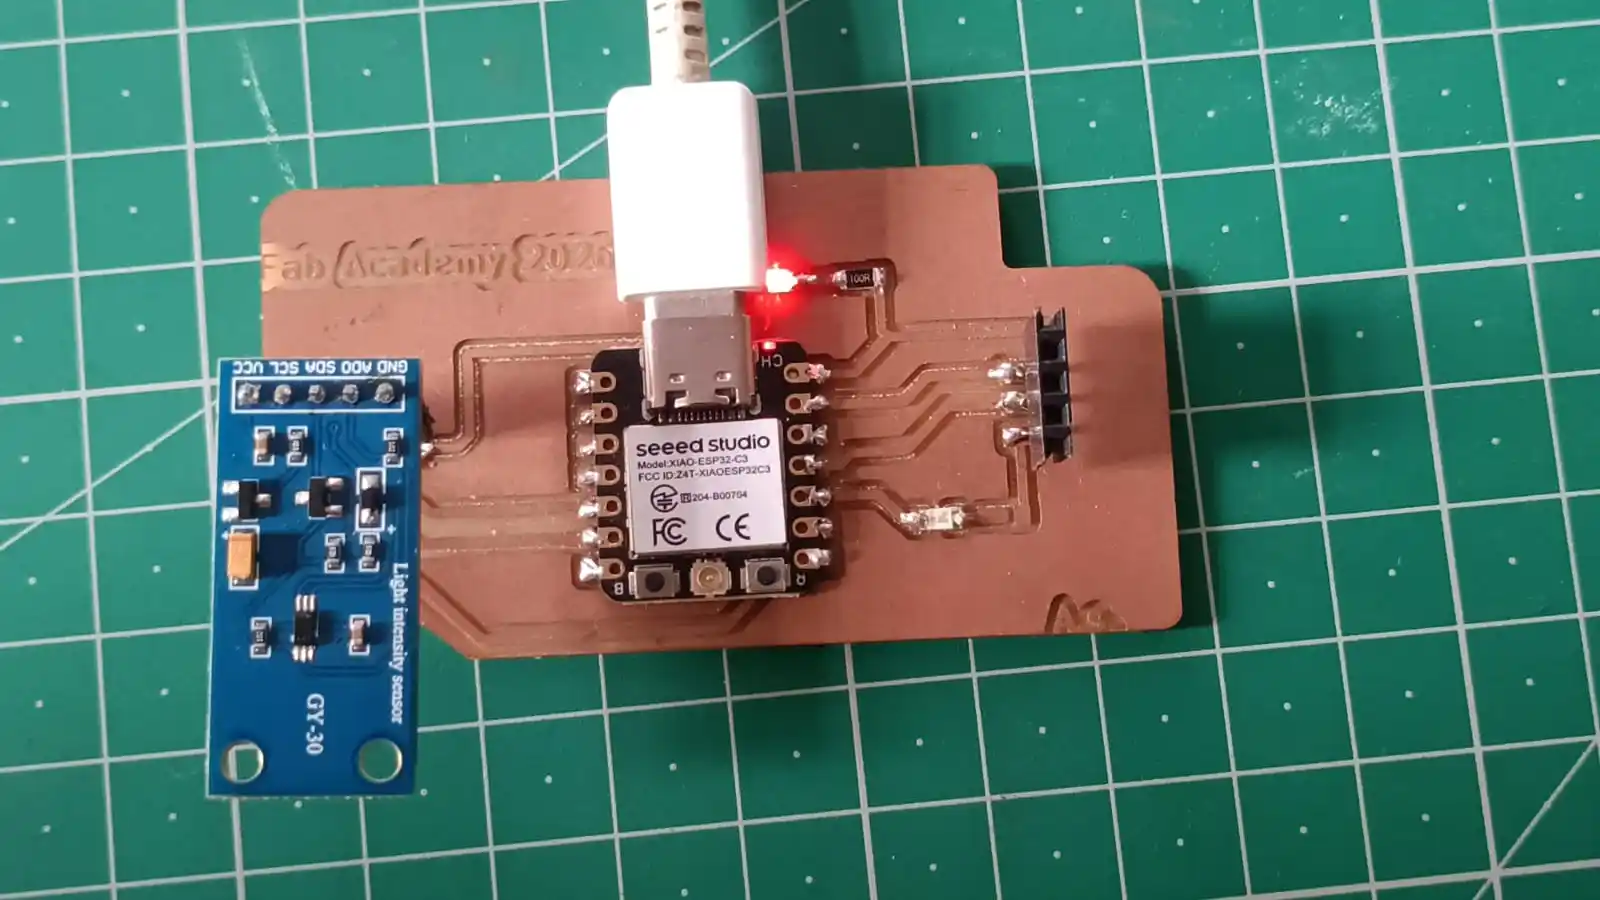
Step 13:-After the milling and cutting process, my PCB board looked like this. Using the same process, I also milled the Hello Touch Board, and the design file for this board was provided during the class lecture.
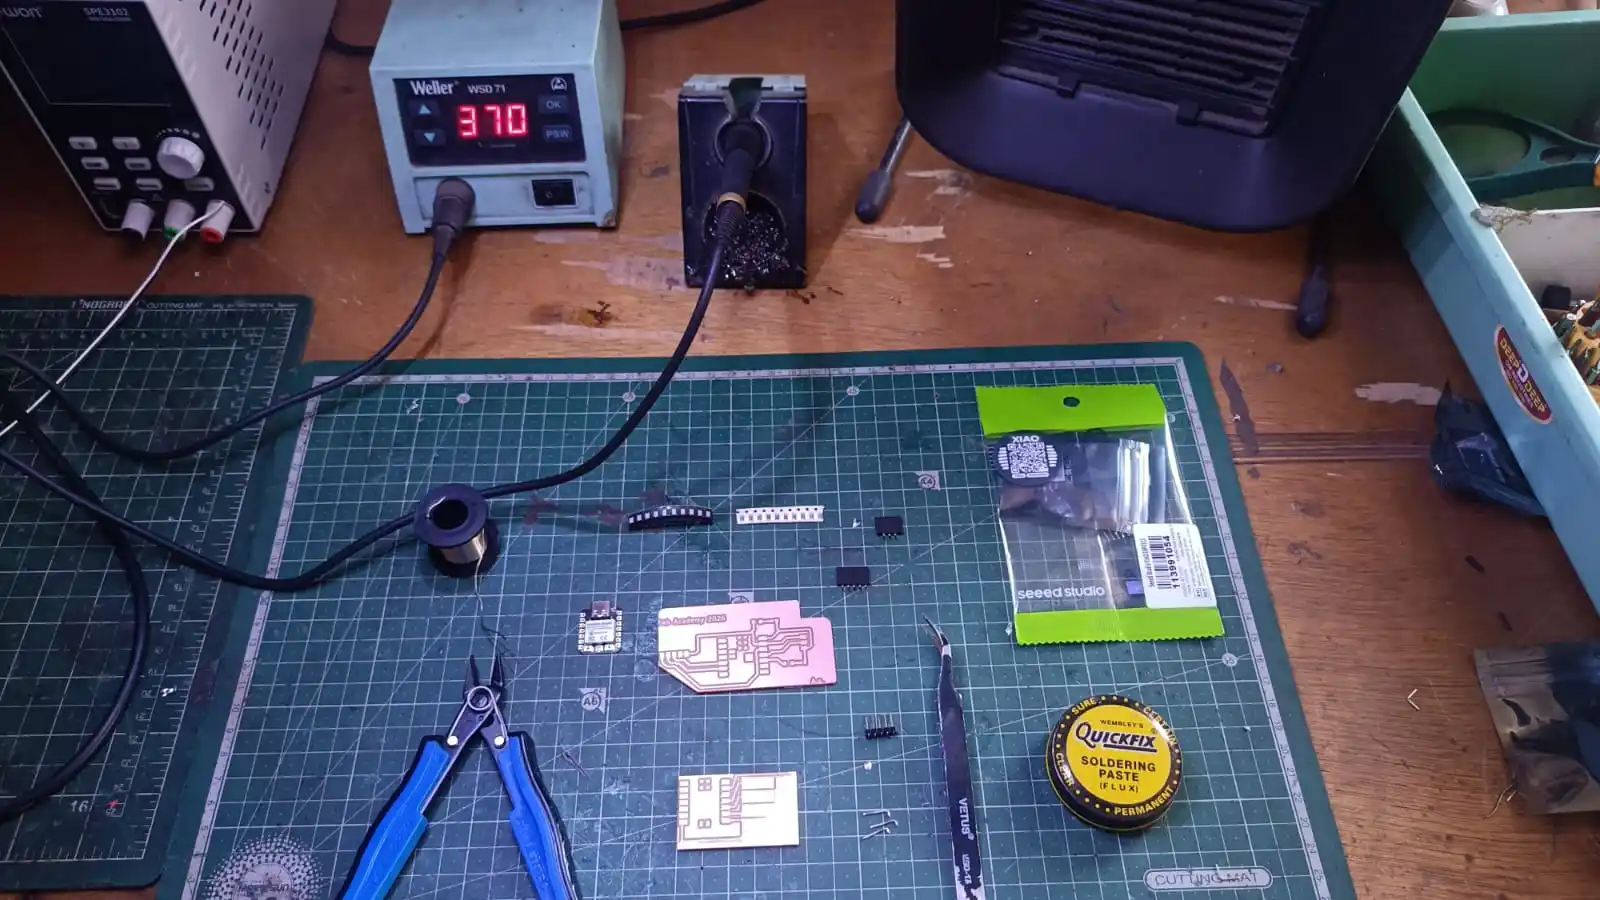
Step 14:-In the next step, the soldering process was carried out. The PCB was assembled using the XIAO ESP32-C3 microcontroller, two LEDs, and the required resistors and supporting components, Female header pins were also soldered onto the PCB to provide removable and flexible connections for components and modules.
The image above shows all the components used for assembling the PCB board.
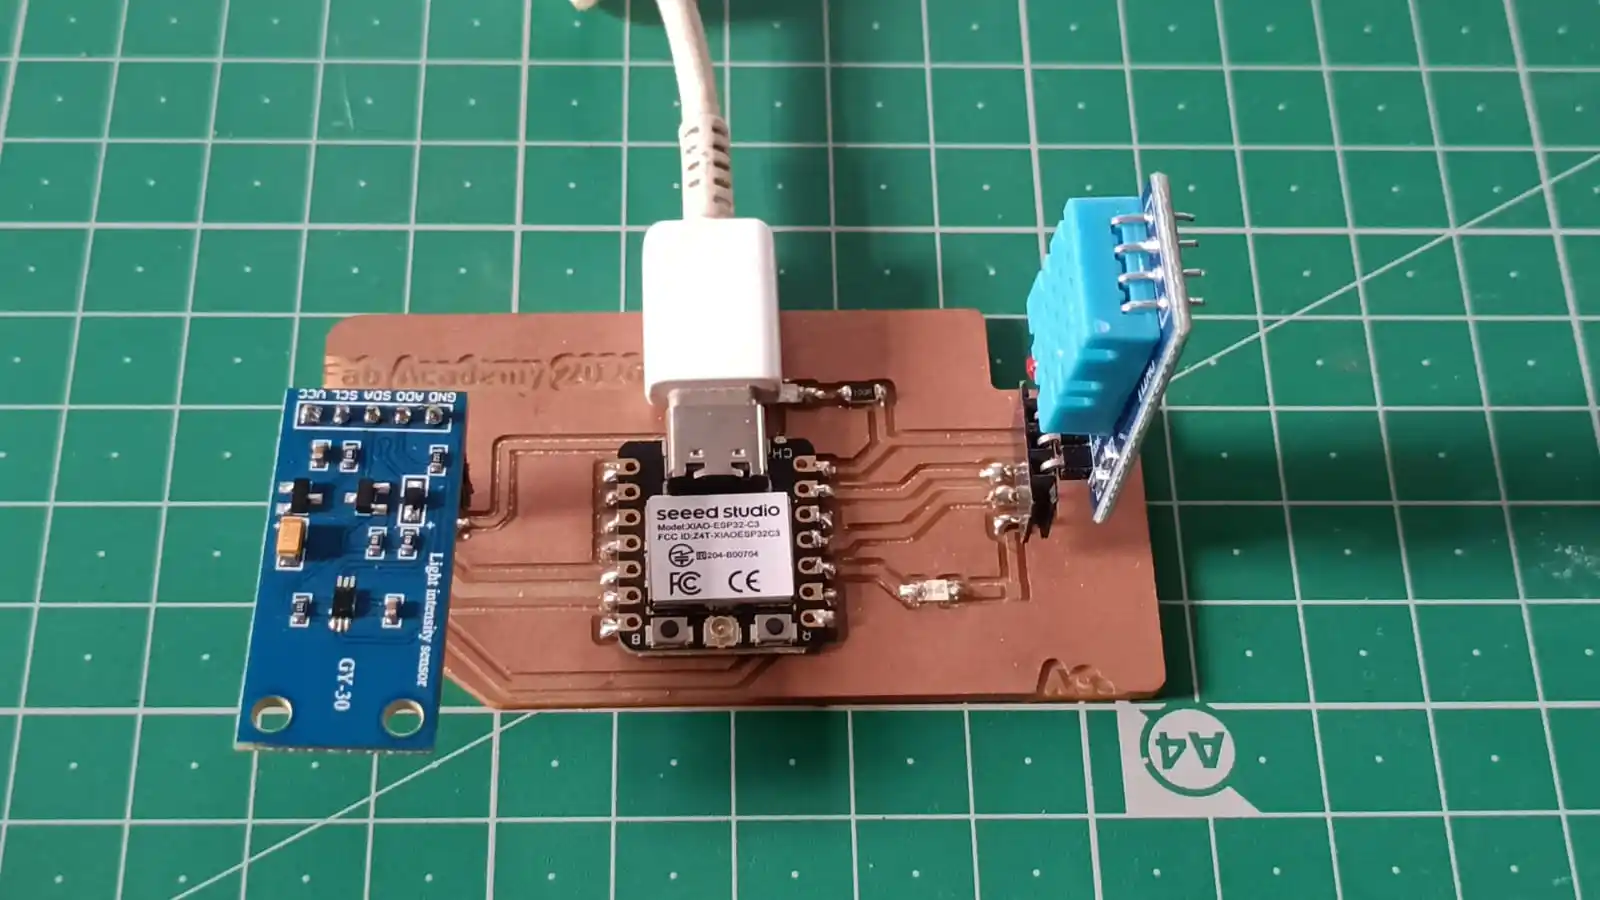
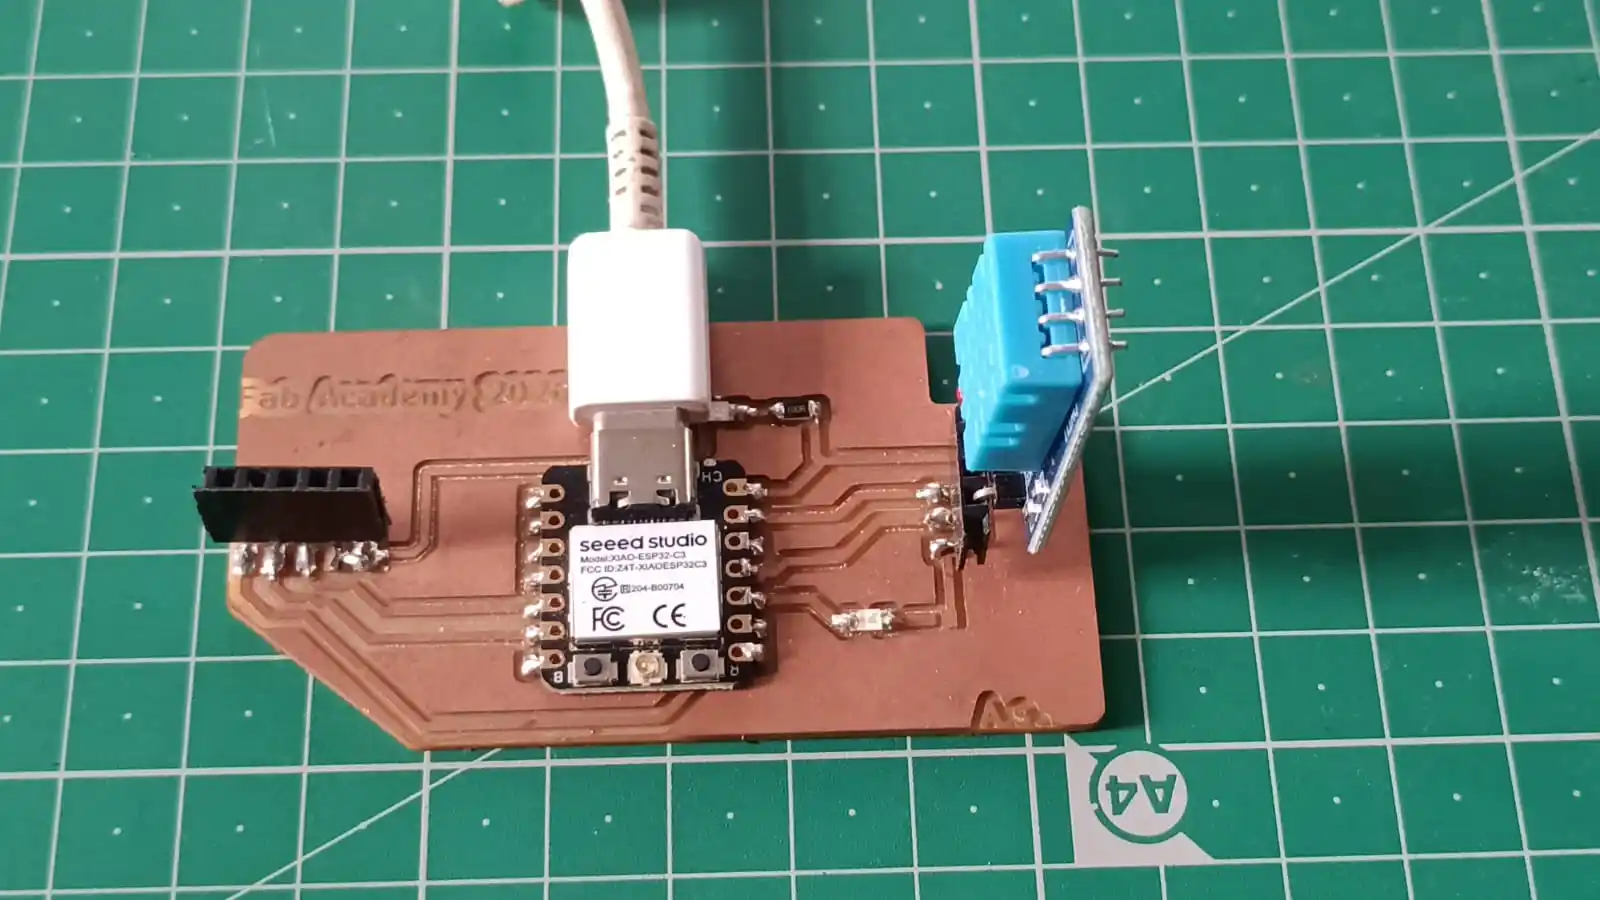
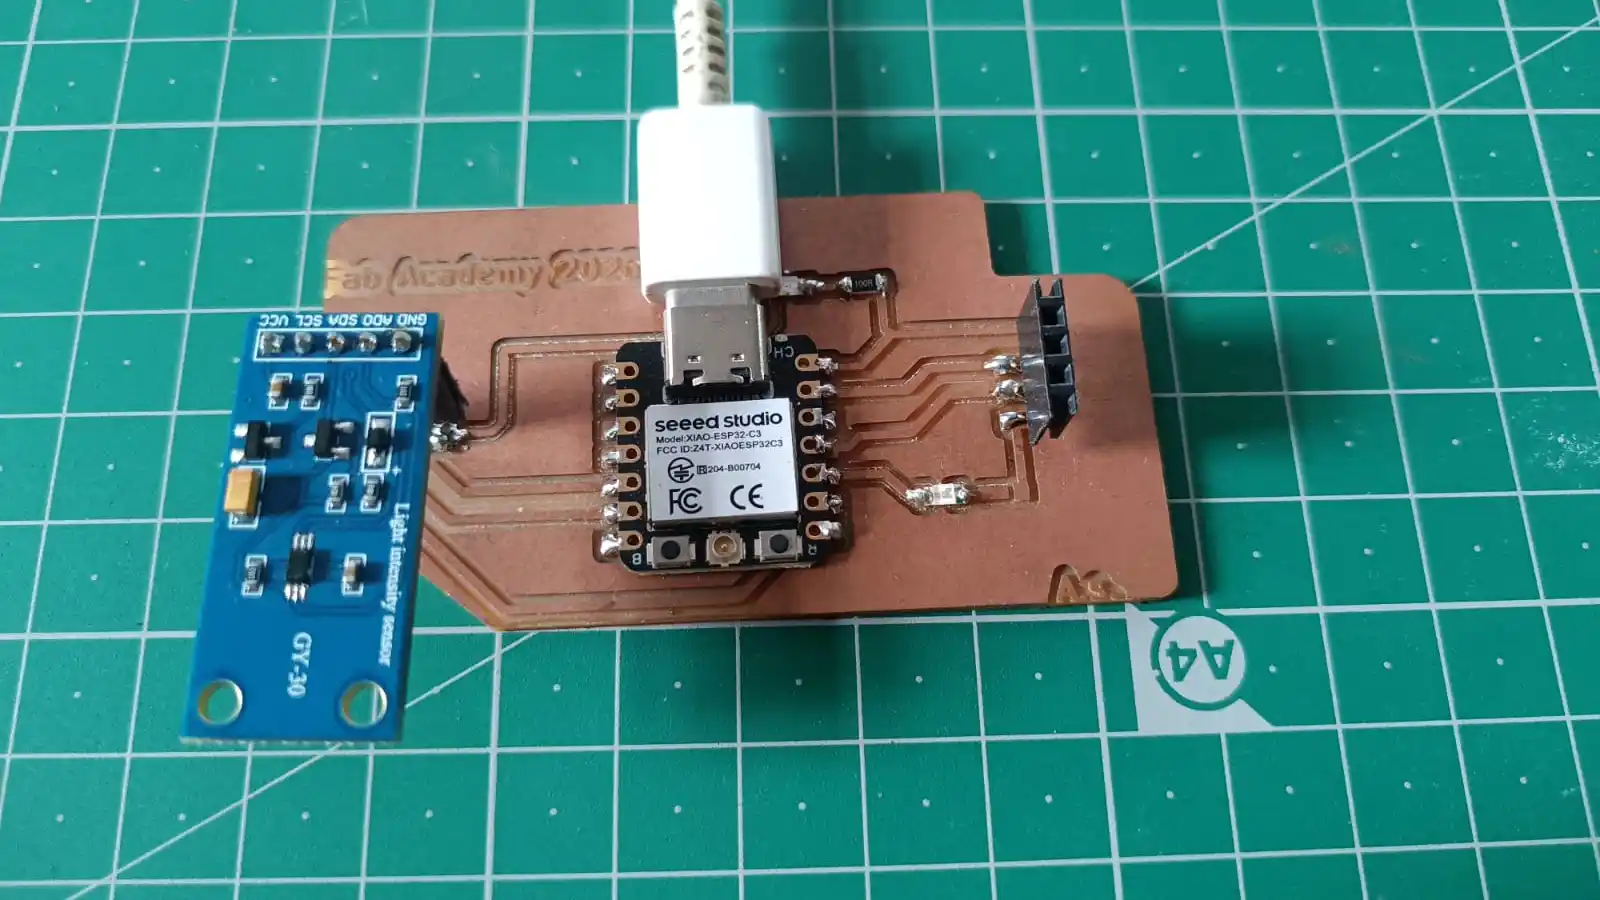
Step 15:-After completing the soldering process, the final PCB board appeared as shown below. I also captured a hero shot of the fully assembled board.
Programming Part
1) The PCB board was designed with provisions for two input sensors. For the initial testing process, I connected the DHT11 temperature and humidity sensor to the board.
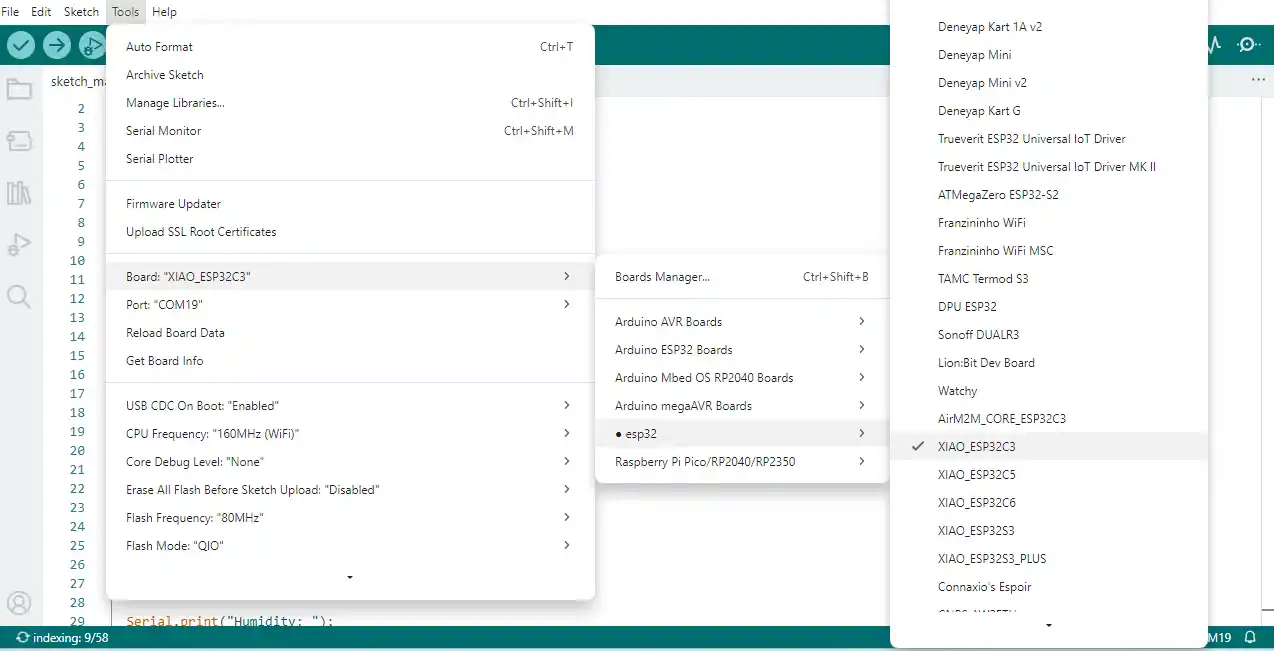
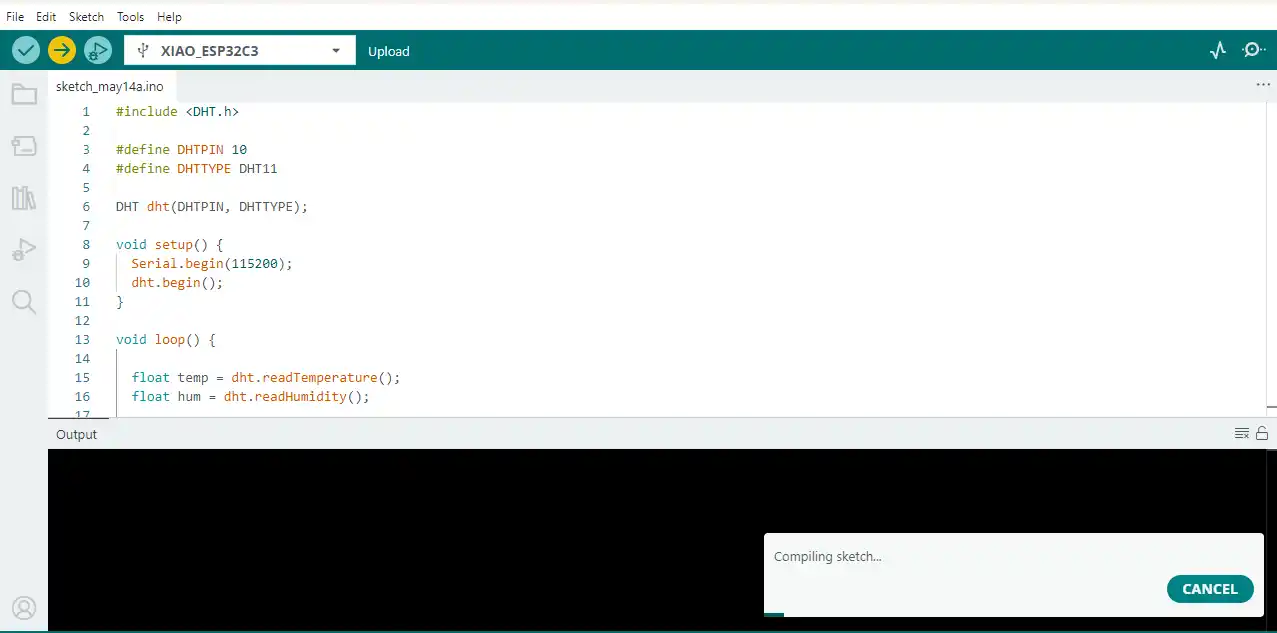
After connecting the board to the computer using a USB cable, the Arduino IDE was opened. Then, from the Tools menu, the appropriate board type and COM port were selected before uploading the code.
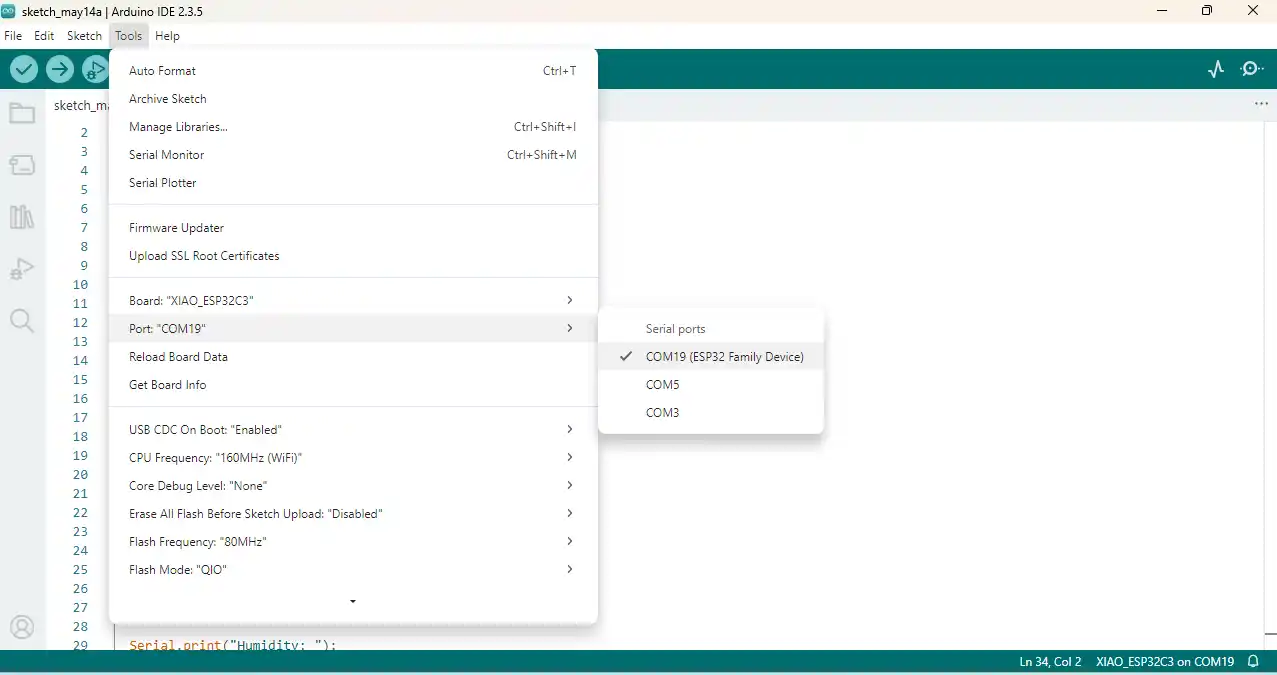
After selecting the board and port, I uploaded the program code to the microcontroller. The code reads the temperature and humidity data from the sensor and displays the values on the Serial Monitor.
Code Explanation
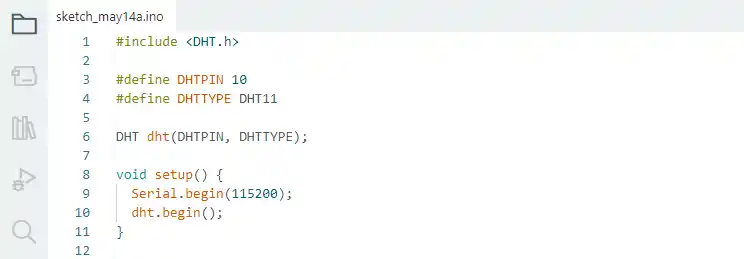
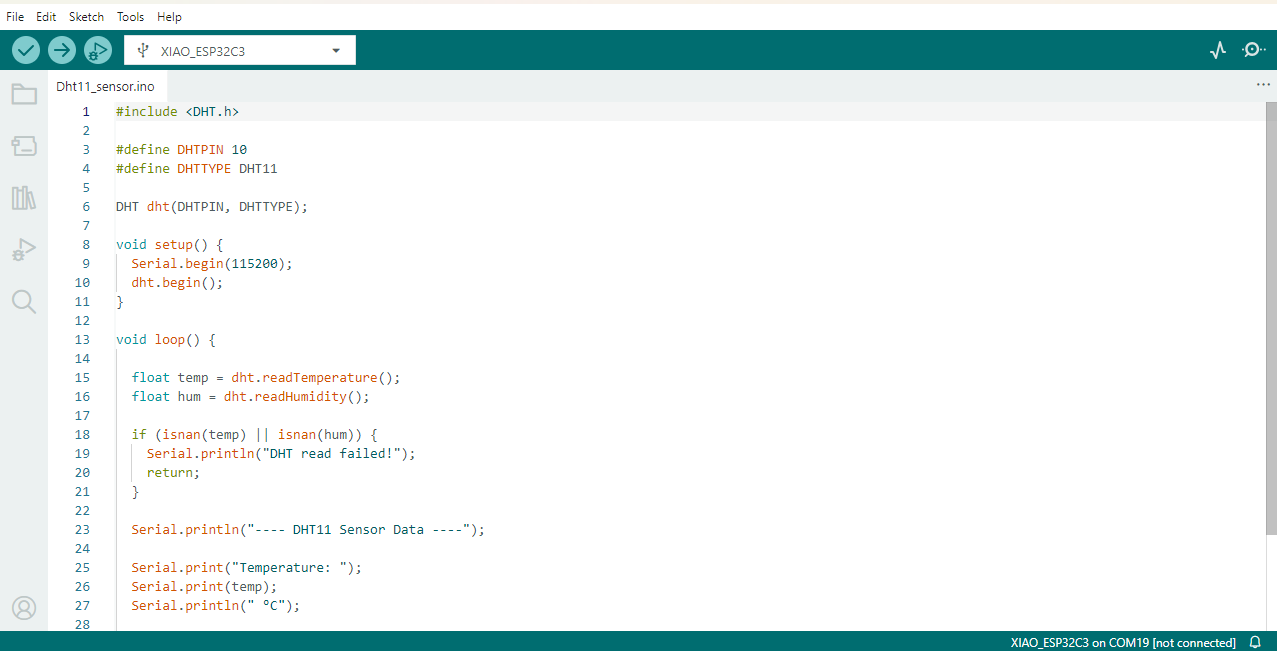
This code starts by including the DHT sensor library, which is used for communication with the DHT11 sensor. The sensor signal pin is connected to GPIO pin 10 of the microcontroller, and the sensor type is defined as DHT11. After that, a DHT sensor object is created using the selected pin and sensor type. The setup function runs once when the board powers on or resets. Inside the setup function, serial communication is started at a baud rate of 115200, and the DHT11 sensor is initialized for reading temperature and humidity data.
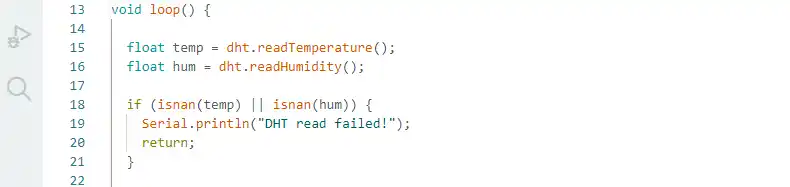
In this part of the code, the loop() function continuously reads the temperature and humidity data from the DHT11 sensor. The temperature value is stored in the variable temp, and the humidity value is stored in the variable hum. After reading the data, the program checks whether the sensor values are valid using the isnan() function. If the sensor fails to provide proper data, the message “DHT read failed!” is displayed on the Serial Monitor, and the program stops the current loop cycle using the return statement. This helps detect sensor reading errors during operation.
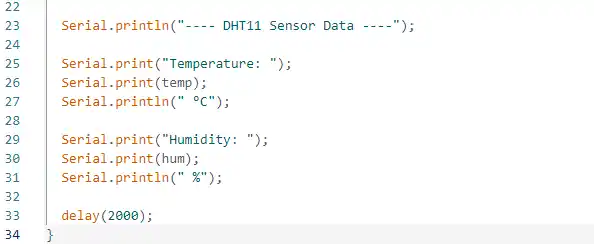
In this section of the code, the sensor data is displayed on the Serial Monitor. First, a heading named “DHT11 Sensor Data” is printed to organize the output. Then, the program prints the temperature value stored in the variable temp along with the unit in degrees Celsius (°C). After that, the humidity value stored in the variable hum is displayed with the percentage (%) symbol. Finally, the delay(2000) command pauses the program for 2 seconds before taking the next sensor reading.
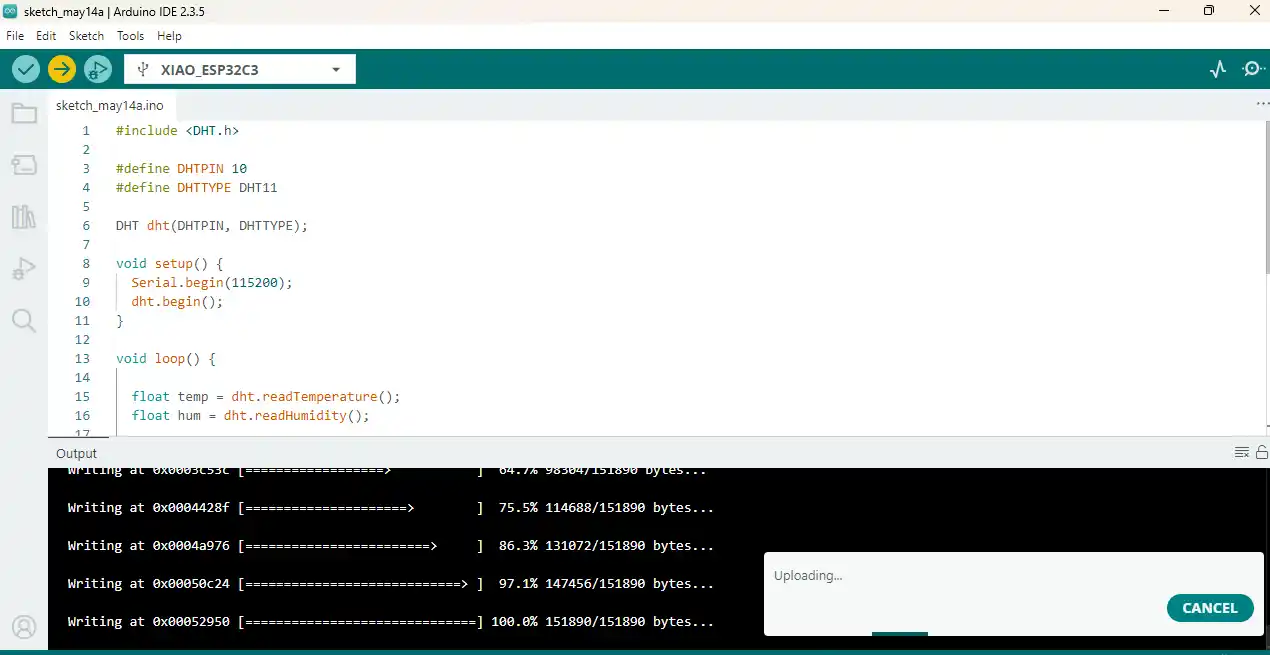
After selecting the correct board and port, the program code was uploaded to the microcontroller using the Arduino IDE.
After uploading the code, I opened the Serial Monitor to view the printed sensor data.
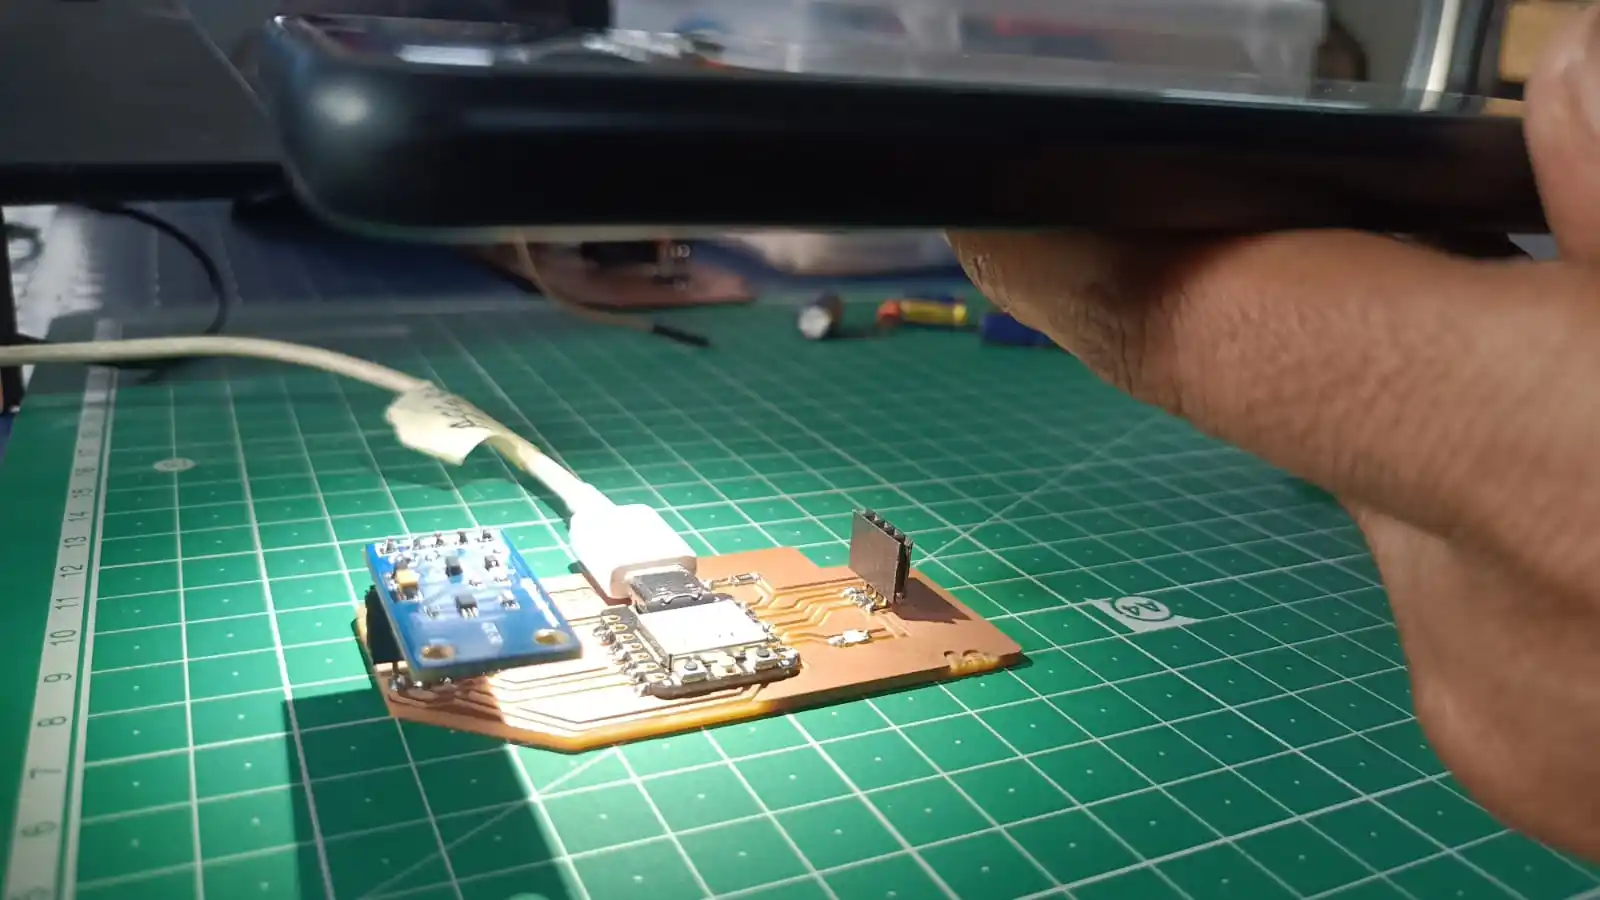
2) After successfully testing the DHT11 sensor, I moved on to testing the BH1750 light intensity sensor.
The same procedure was followed to select the correct board and COM port before uploading the code for the light intensity sensor.
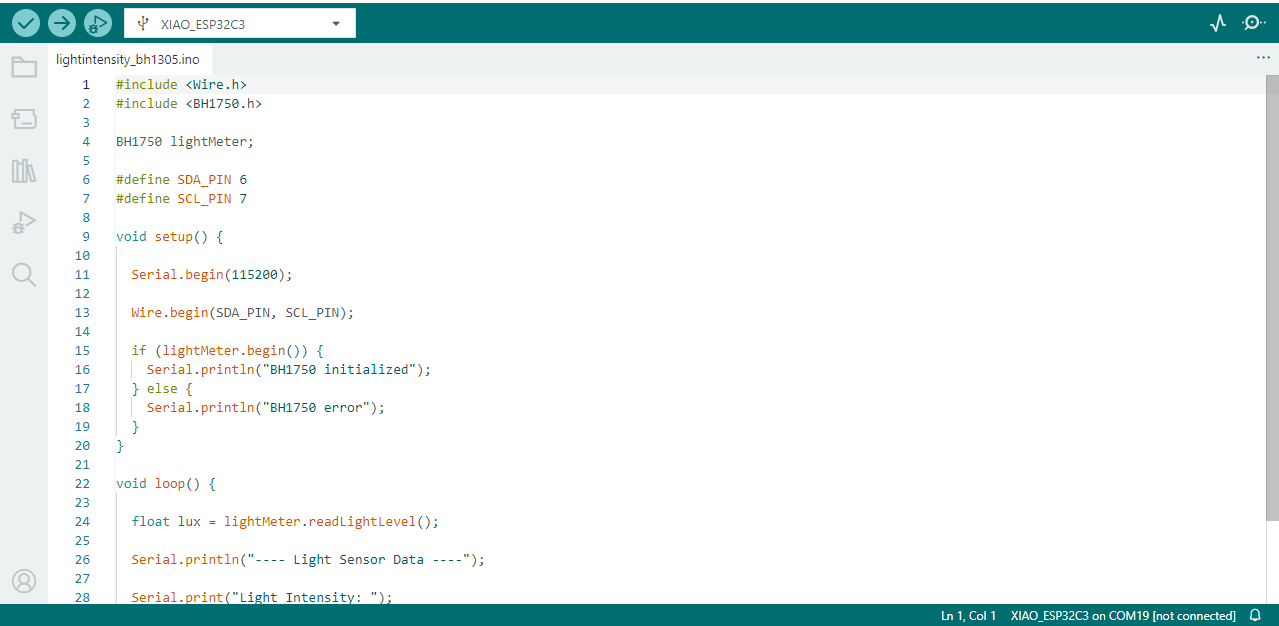
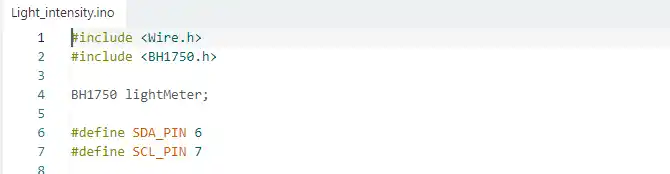
Code Explanation
This part of the code includes the required libraries for the BH1750 sensor and creates the sensor object. The SDA and SCL pins are defined for I2C communication between the microcontroller and the light intensity sensor.
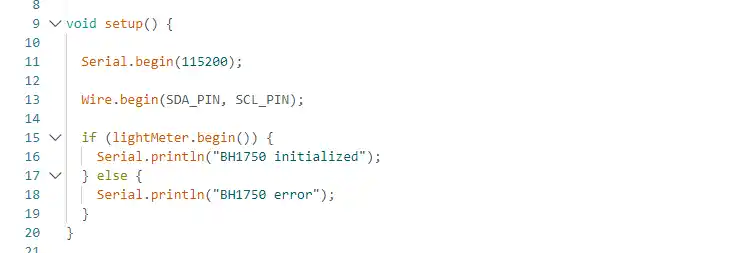
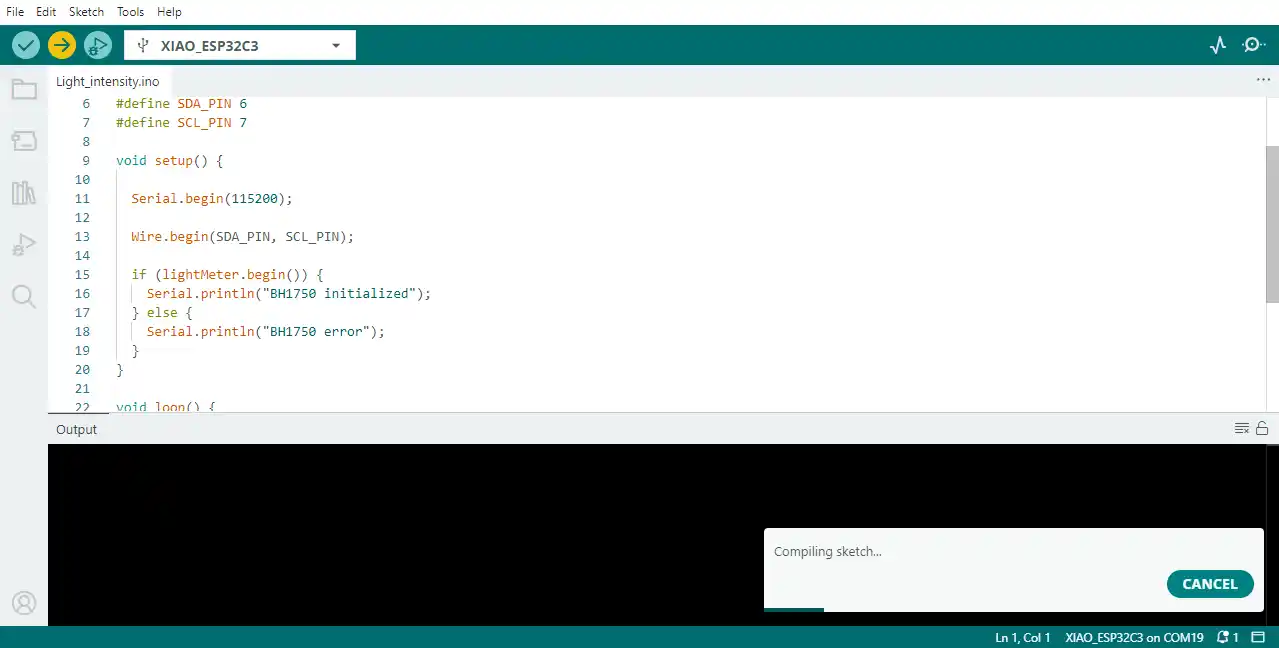
In this setup function, serial communication is started at 115200 baud rate. Then, the I2C communication is initialized using the SDA and SCL pins. After that, the program checks whether the BH1750 sensor is connected properly. If the sensor initializes successfully, it prints “BH1750 initialized”; otherwise, it shows “BH1750 error” on the Serial Monitor.
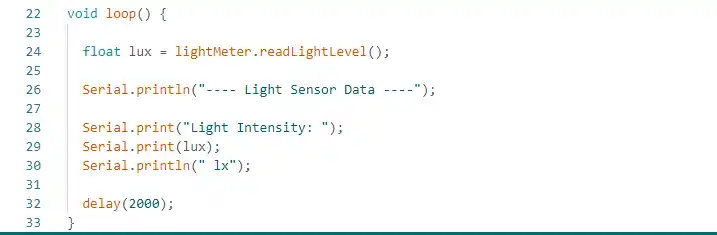
In this loop function, the BH1750 sensor reads the light intensity value and stores it in the variable lux. The sensor data is then displayed on the Serial Monitor with the heading “Light Sensor Data.” Finally, the program waits for 2 seconds before taking the next reading.
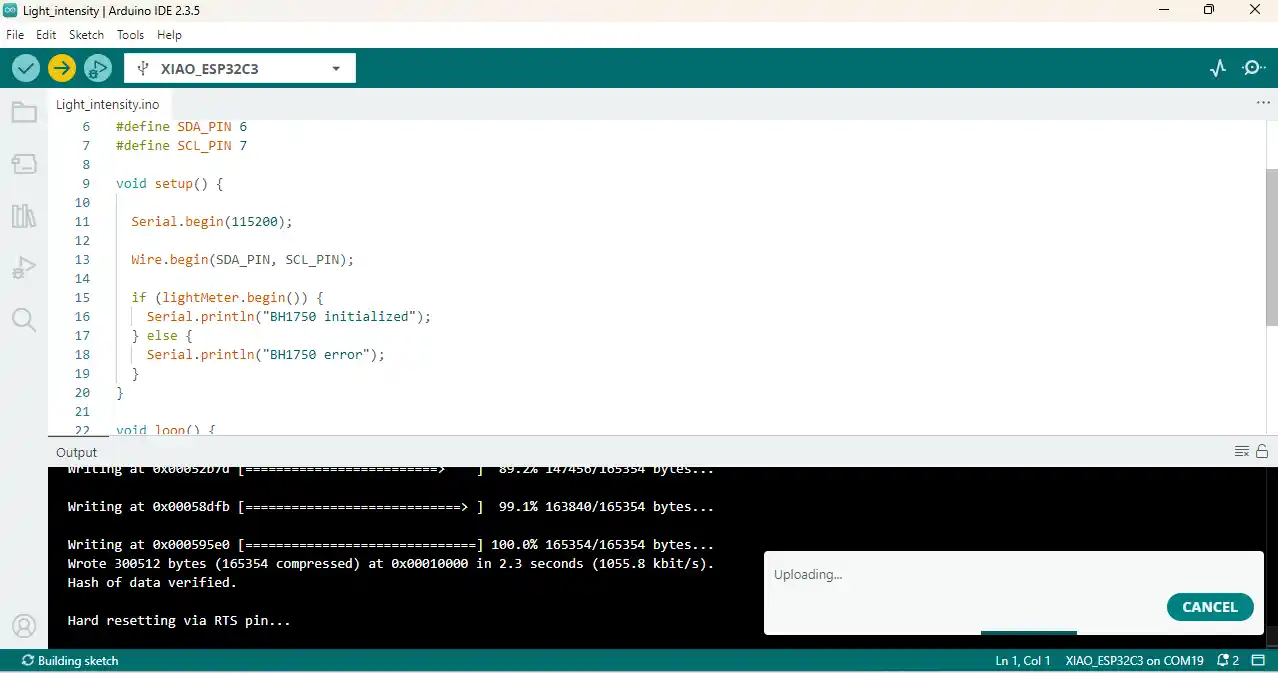
Uploading the code to the microcontroller took a few minutes. After the upload was completed successfully, the program started running on the board.
The Serial Monitor was opened to display all the data received from the sensors.
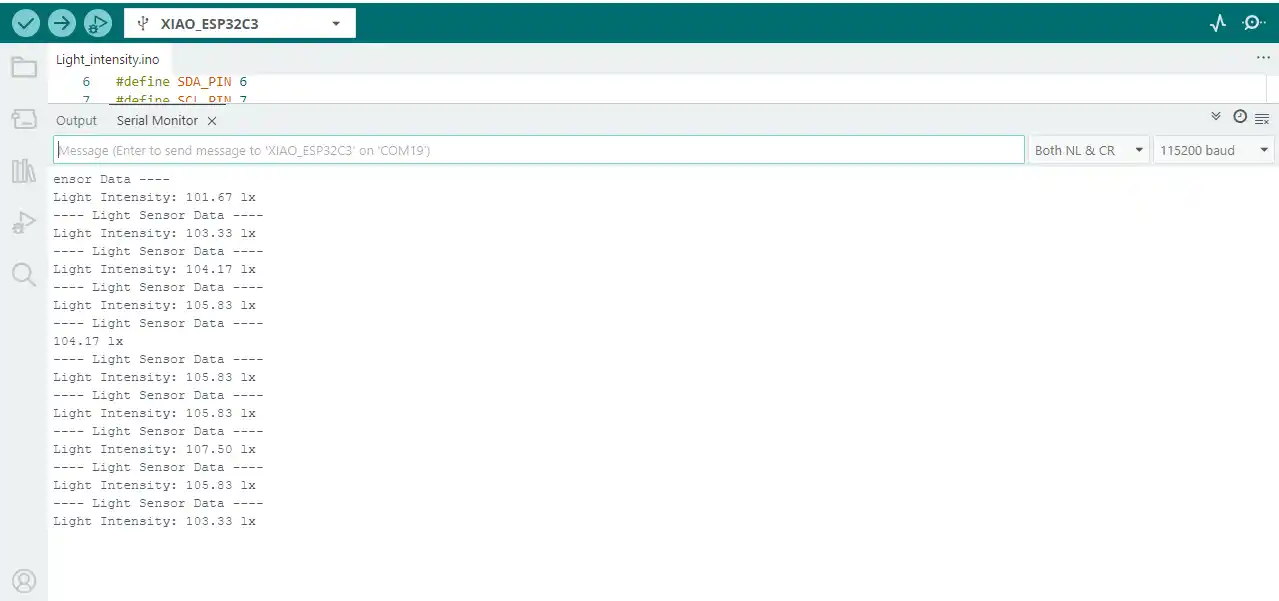
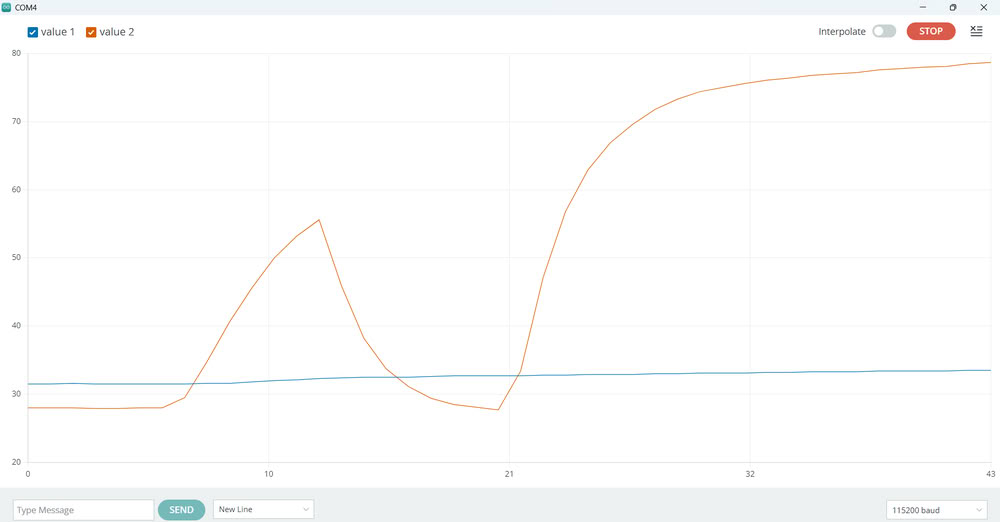
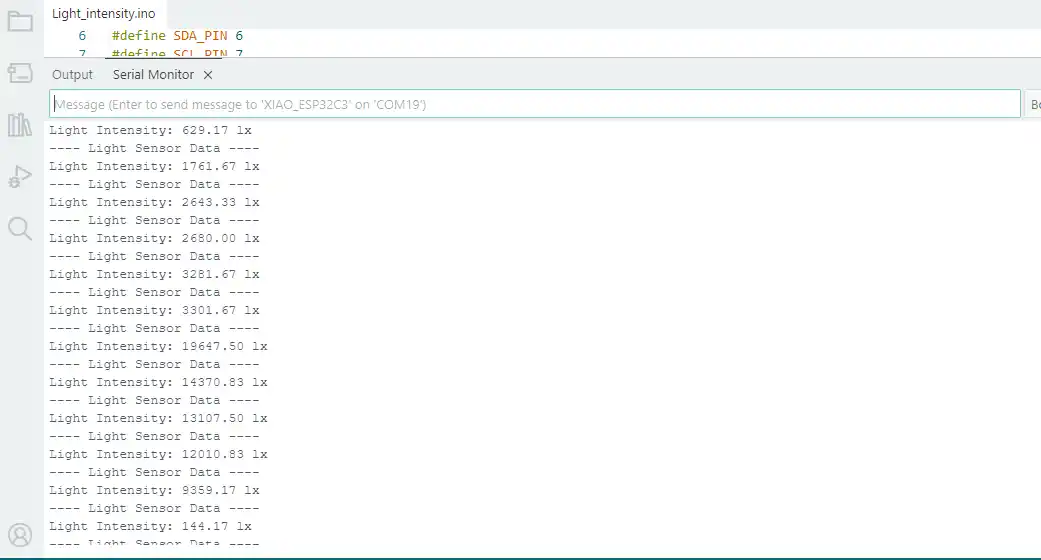
During testing, I used the flashlight from my mobile phone and directed it toward the BH1750 sensor to observe changes in the light intensity values.
All the changed sensor data was printed and displayed on the Serial Monitor, as shown here.
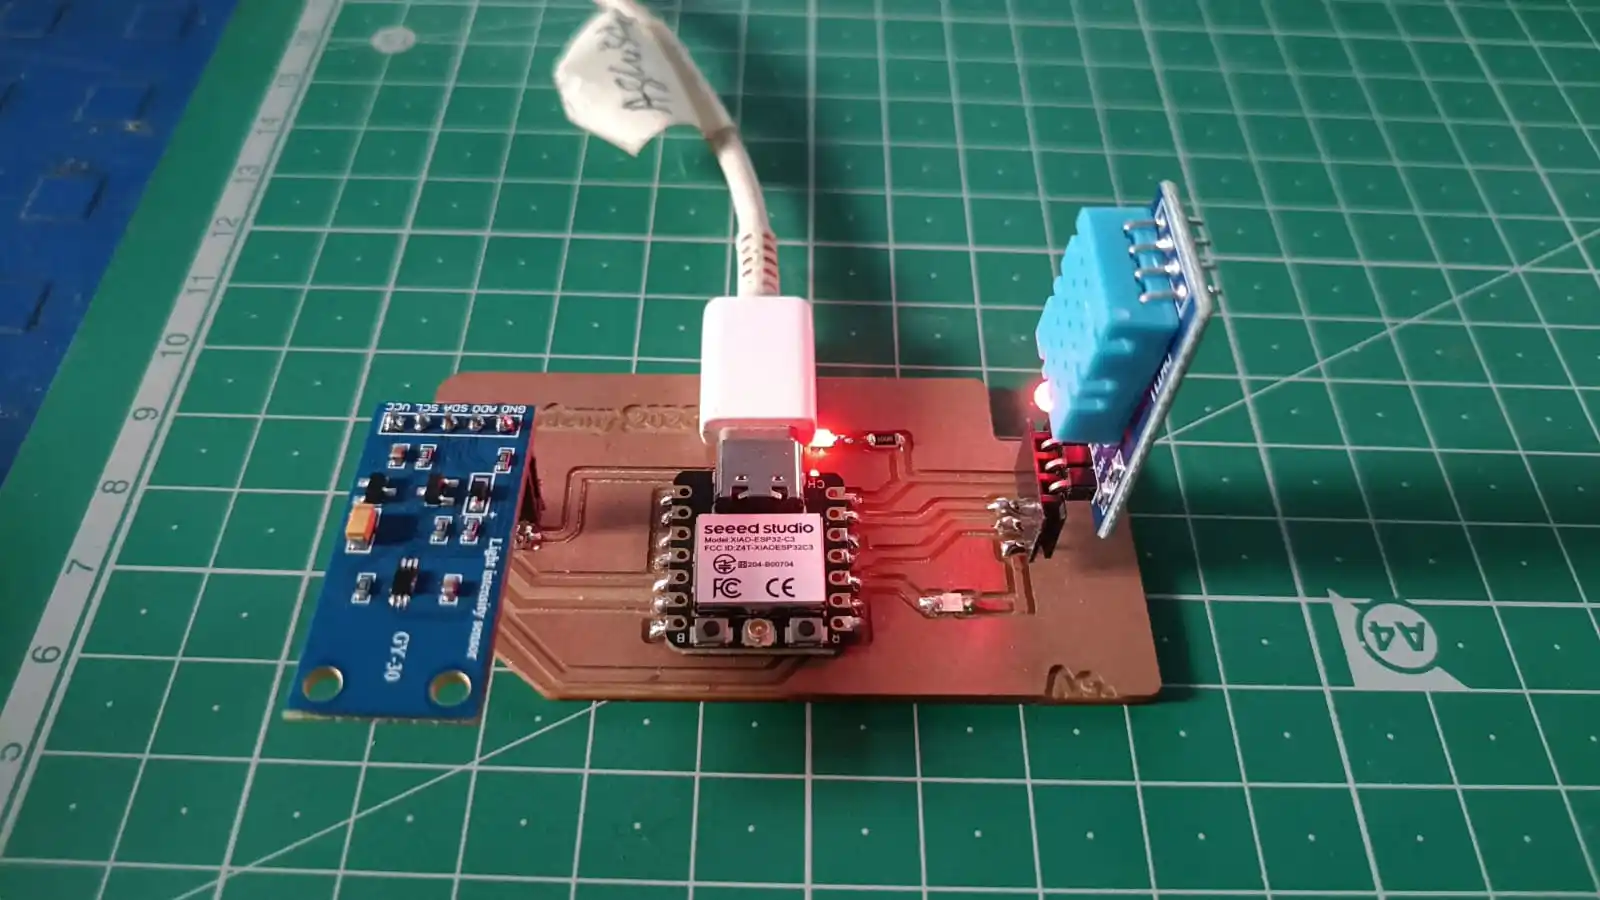
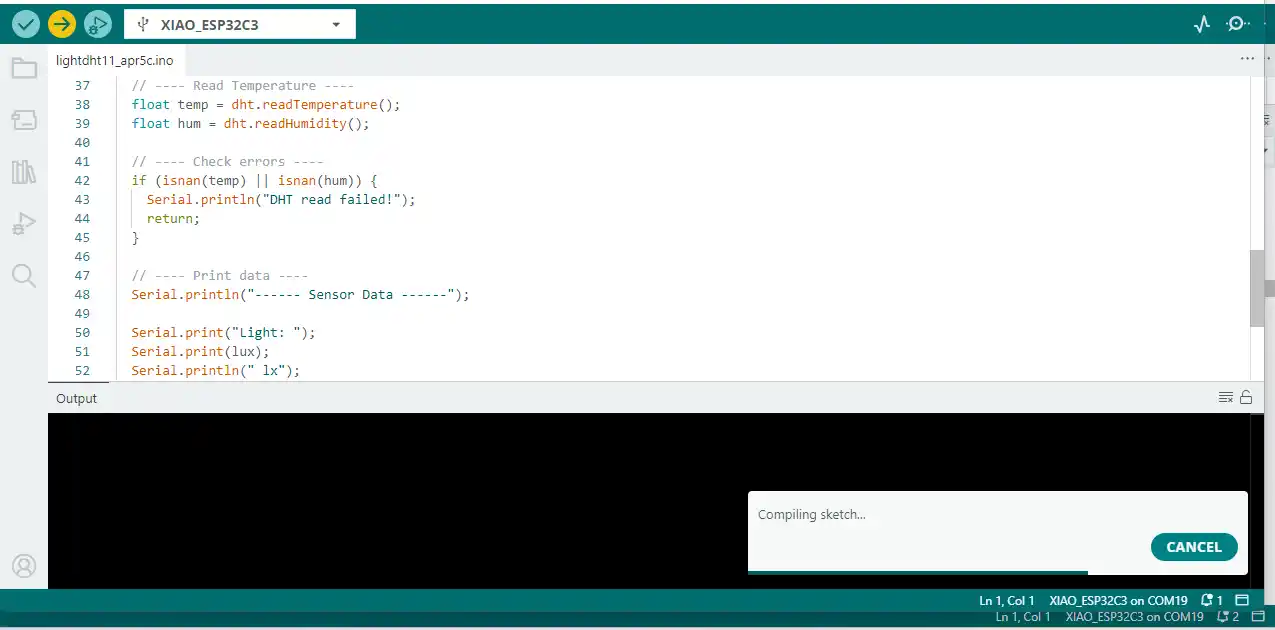
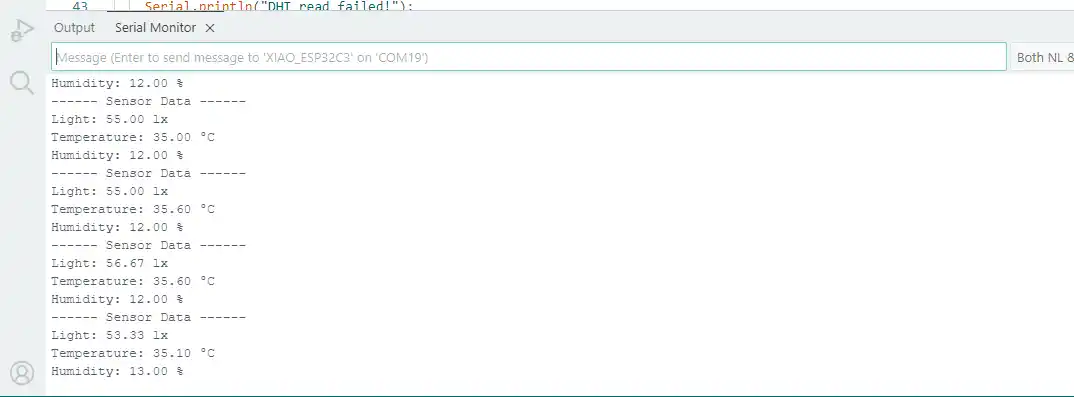
3) In the third program, both the DHT sensor and BH1750 light intensity sensor were connected and interfaced together with the XIAO ESP32-C3 module on the PCB board.
The same setup procedure was followed again by connecting the board through USB and selecting the appropriate board and COM port in the Arduino IDE.
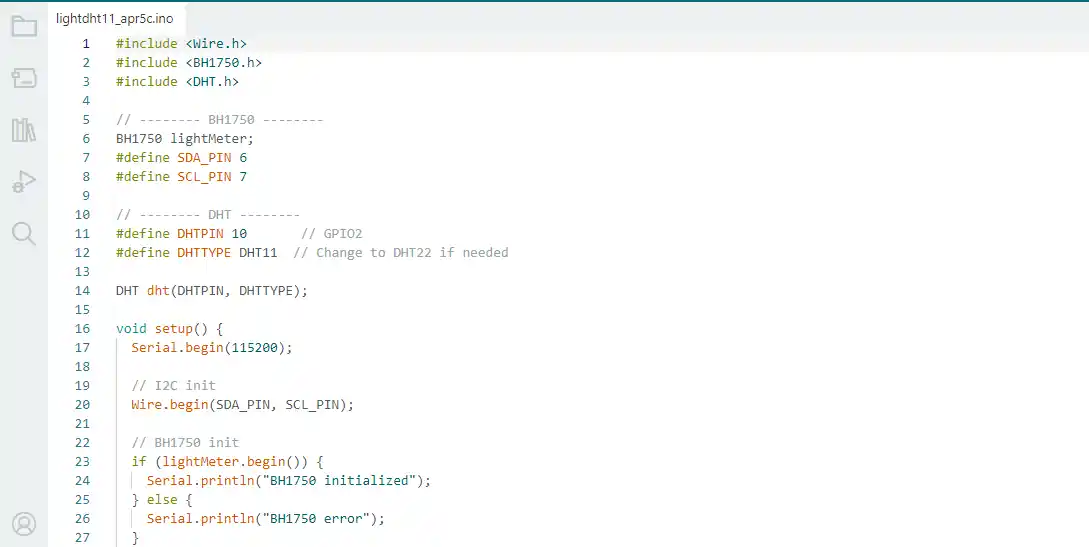
Code Explanation
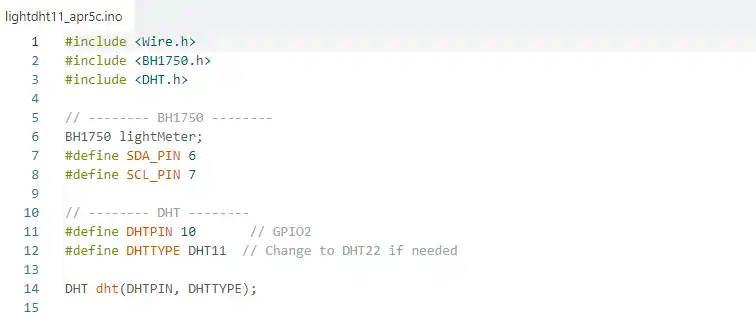
In this part of the code, the required libraries for the BH1750 light sensor and DHT11 sensor are included. A BH1750 sensor object named lightMeter is created, and the SDA and SCL pins are defined for I2C communication. Then, the DHT sensor pin is defined as GPIO 10, and the sensor type is selected as DHT11. Finally, a DHT sensor object is created using the selected pin and sensor type for temperature and humidity measurement.
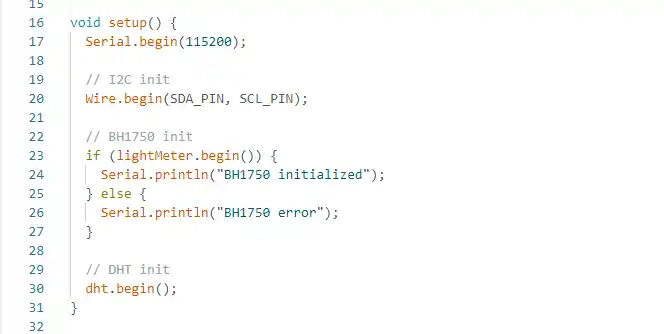
In this setup function, serial communication is started at a baud rate of 115200. Then, the I2C communication is initialized using the SDA and SCL pins for the BH1750 sensor. After that, the program checks whether the BH1750 sensor is connected properly. If the sensor initializes successfully, it prints “BH1750 initialized”; otherwise, it displays “BH1750 error” on the Serial Monitor. Finally, the DHT11 sensor is initialized for temperature and humidity measurement.
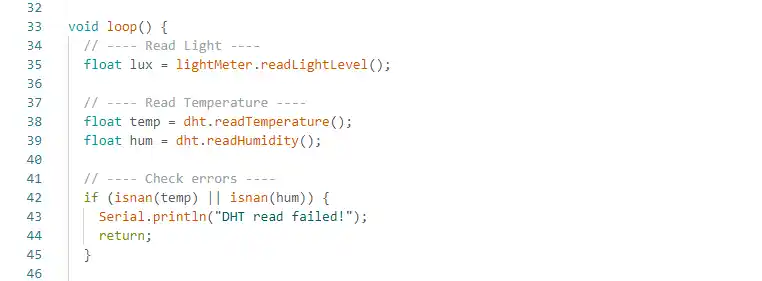
In this loop function, the BH1750 sensor reads the light intensity value and stores it in the variable lux. Then, the DHT11 sensor reads the temperature and humidity values and stores them in the variables temp and hum. After reading the sensor values, the program checks whether the data is valid using the isnan() function. If the sensor reading fails, the message “DHT read failed!” is displayed on the Serial Monitor, and the loop stops for that cycle.
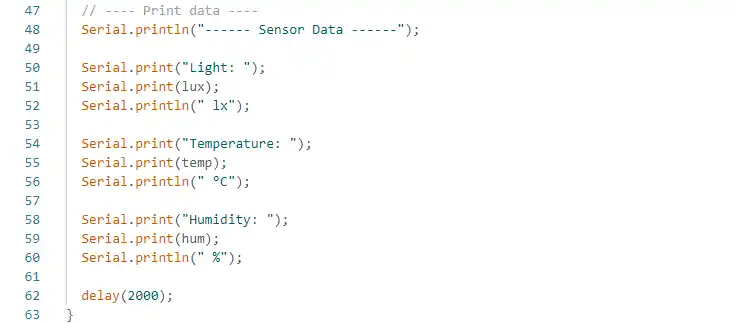
In this section of the code, all the sensor data is printed on the Serial Monitor. First, a heading called “Sensor Data” is displayed. Then, the program prints the light intensity value from the BH1750 sensor in lux (lx). After that, the temperature value from the DHT11 sensor is printed in degrees Celsius (°C), followed by the humidity value in percentage (%). Finally, the delay(2000) command pauses the program for 2 seconds before taking the next sensor readings.
Once the code was uploaded successfully, the Serial Monitor displayed the light intensity, temperature, and humidity data from the connected sensors.
Faced some problems
1) During the PCB fabrication process, an issue occurred while performing the edge-cut operation. The cutting bit passed very close to the PCB traces, increasing the possibility of cutting or damaging the circuit lines. Careful adjustments were required to avoid damaging the PCB traces.
2) During the programming process, I encountered several coding and debugging issues. To solve these problems, I used ChatGPT as a reference and troubleshooting tool, which helped me understand and fix the errors.
Download all files from here code and kicad files