- Measure something: add a sensor to a microcontroller board that you have designed and read it.
This week's topic is measuring input devices. For this, we attended a class taught by instructors Ulises and Roberto. This class was quite dynamic, as several measuring instruments, such as a multimeter, were used. Performing these measurements will help us understand several key concepts useful for the task.
After showing the electronic components that make up the board, the PBC board editor is shown in the Kid Cat software.
We performed several simulations using Wokwi, an online electronics and embedded systems simulator that allows you to develop and test projects with microcontrollers such as Arduino, ESP32, STM32, and Raspberry Pi Pico, among others. Below are some exercises we developed with Instructor Ulises.
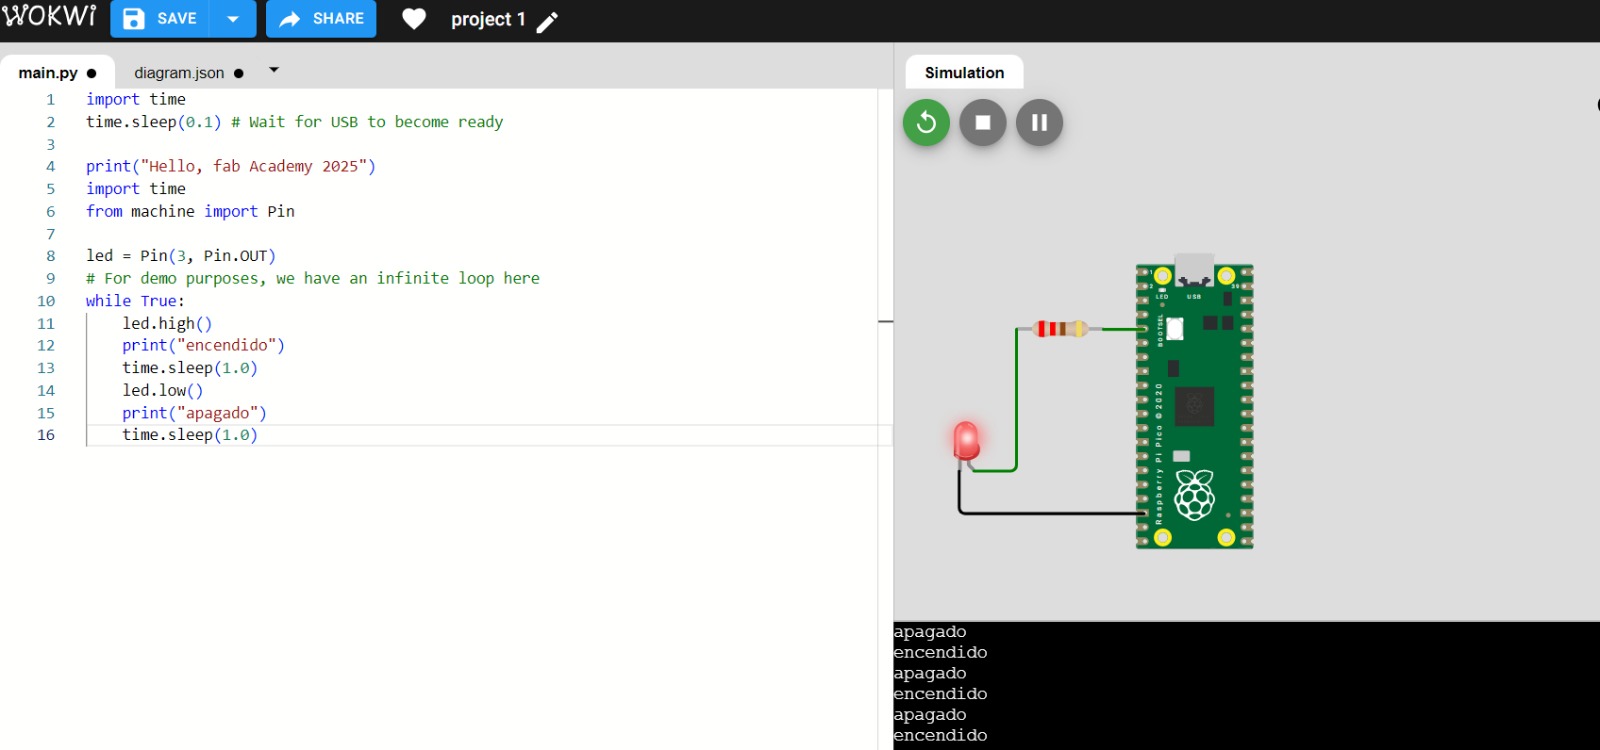
Exercise 1 using Wokwi simulator
In this exercise we learned how to use code in MicroPython, using the Wokwi online simulator to blink an LED.
This is the code I used:
from machine import Pin
from time import sleep

print("Hello, Fab Academy 2025!")

pinLed = Pin(3, Pin.OUT)

while True:
	#pinled.toggle()
	pinLed.value(0)
	print("Apagado")
	sleep(1.0)
	pinLed.value(1)
	print("Encendido")
	sleep(1.0)
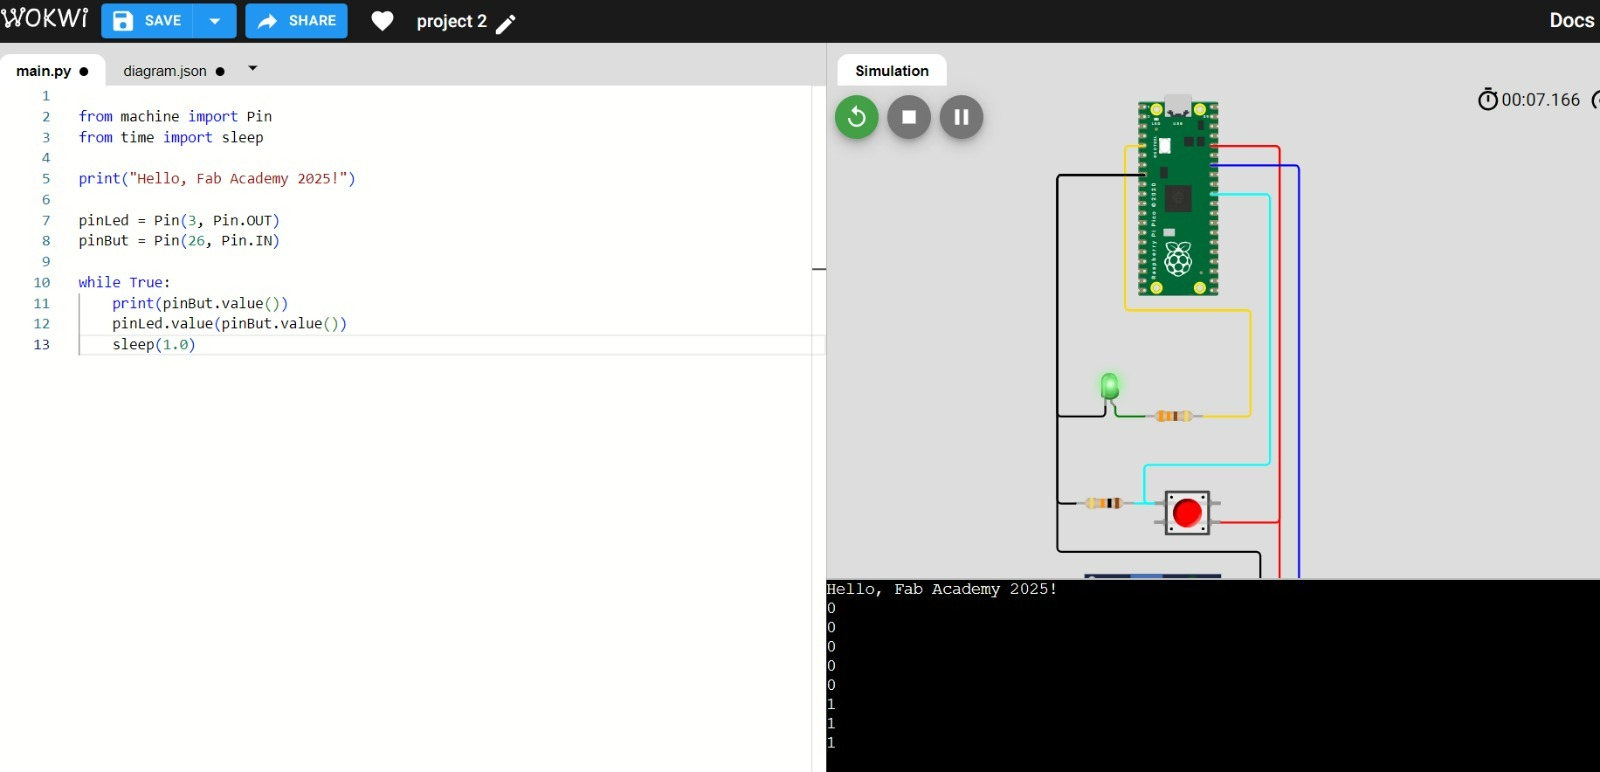
Exercise 2
For this exercise, we add a push button to the circuit shown in exercise 1, which controls the LED turning on and off.
This is the code I used:
from machine import Pin
from time import sleep

print("Hello, Fab Academy 2025!")

pinLed = Pin(3, Pin.OUT)
pinBut = Pin(26, Pin.IN)

while True:
    print(pinBut.value())
   	pinLed.value(pinBut.value())
    sleep(0.5)
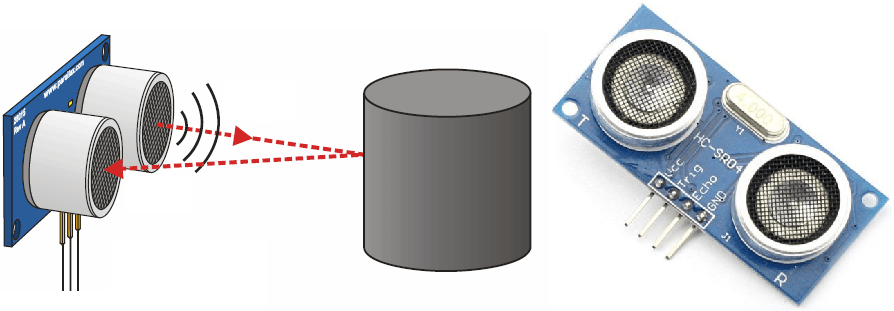
Distance Measurement with HC-SR04 Ultrasonic Sensor
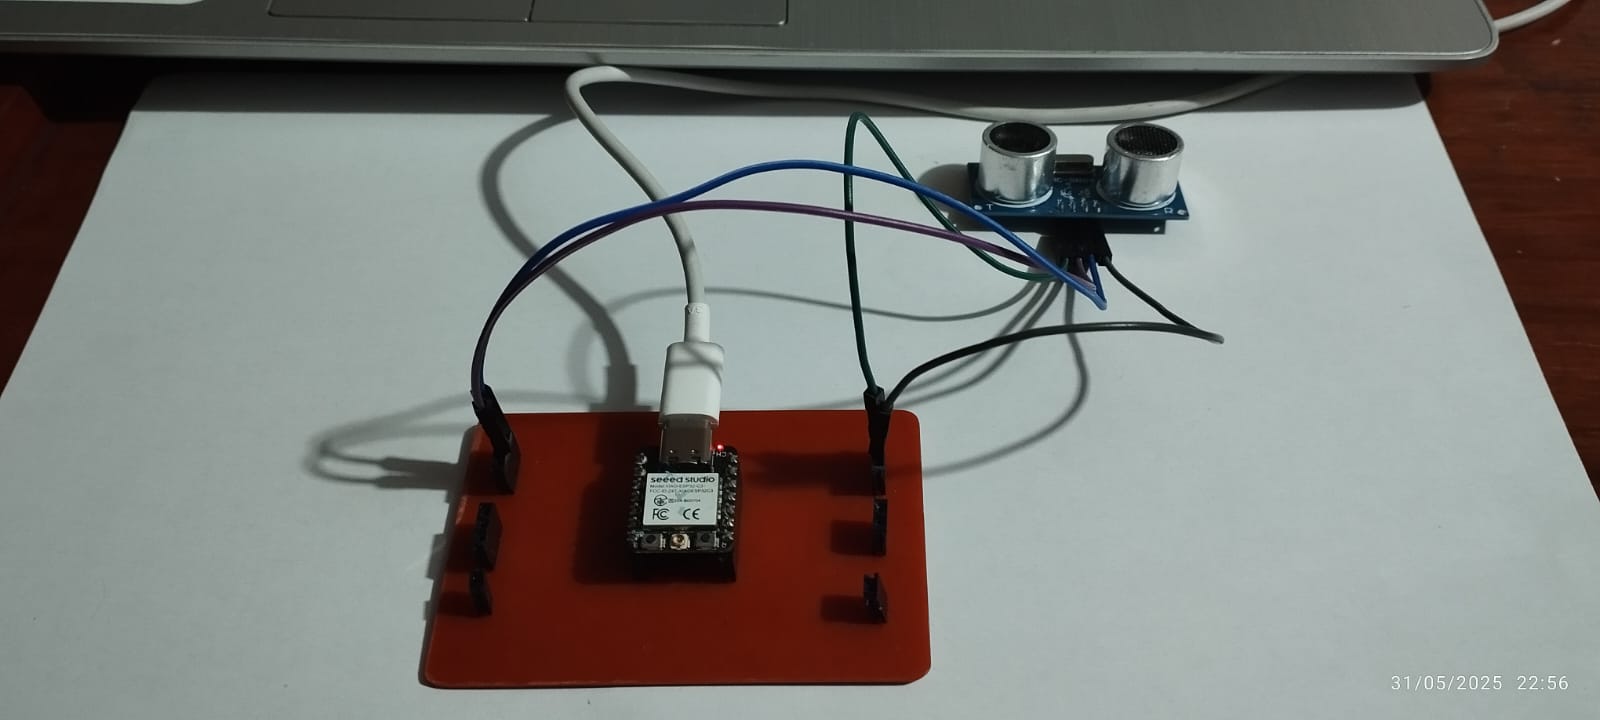
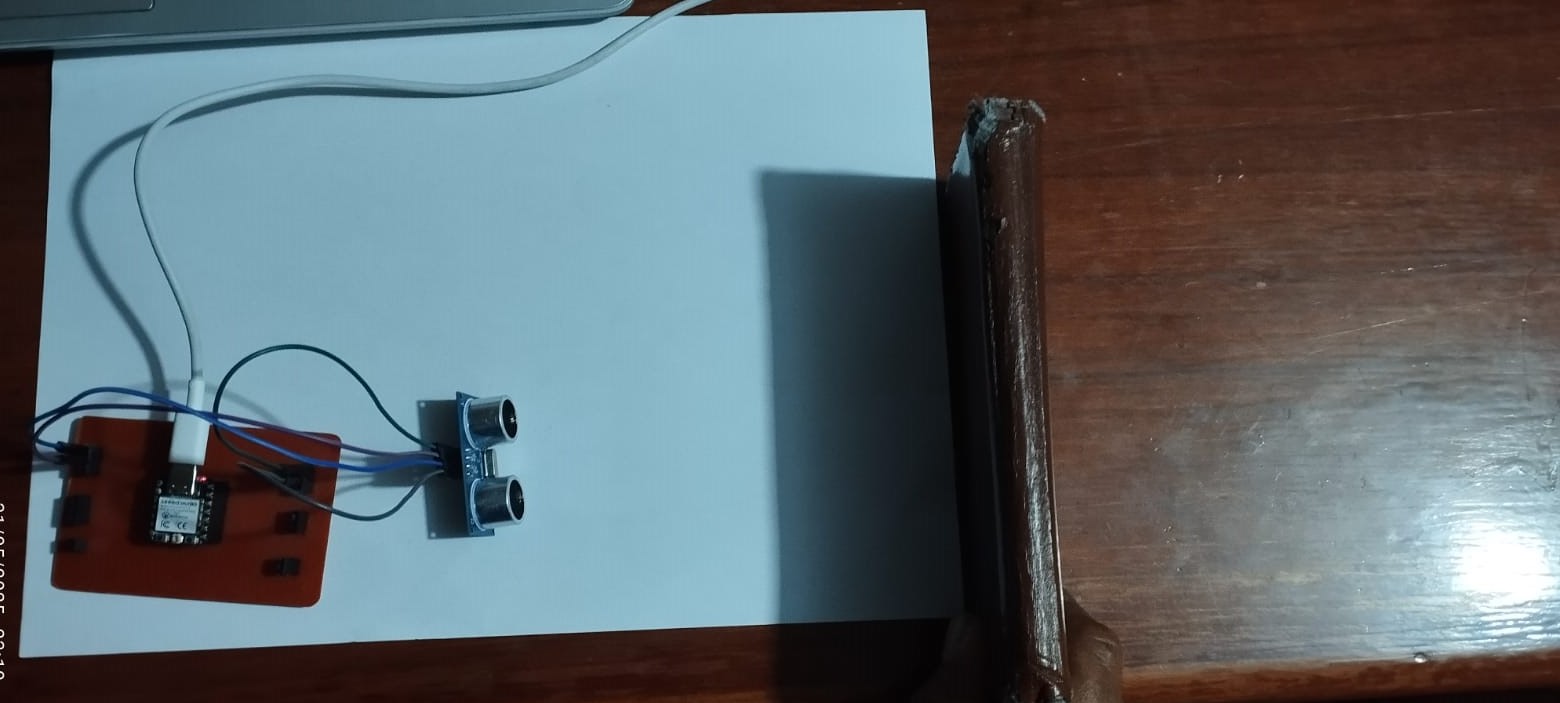
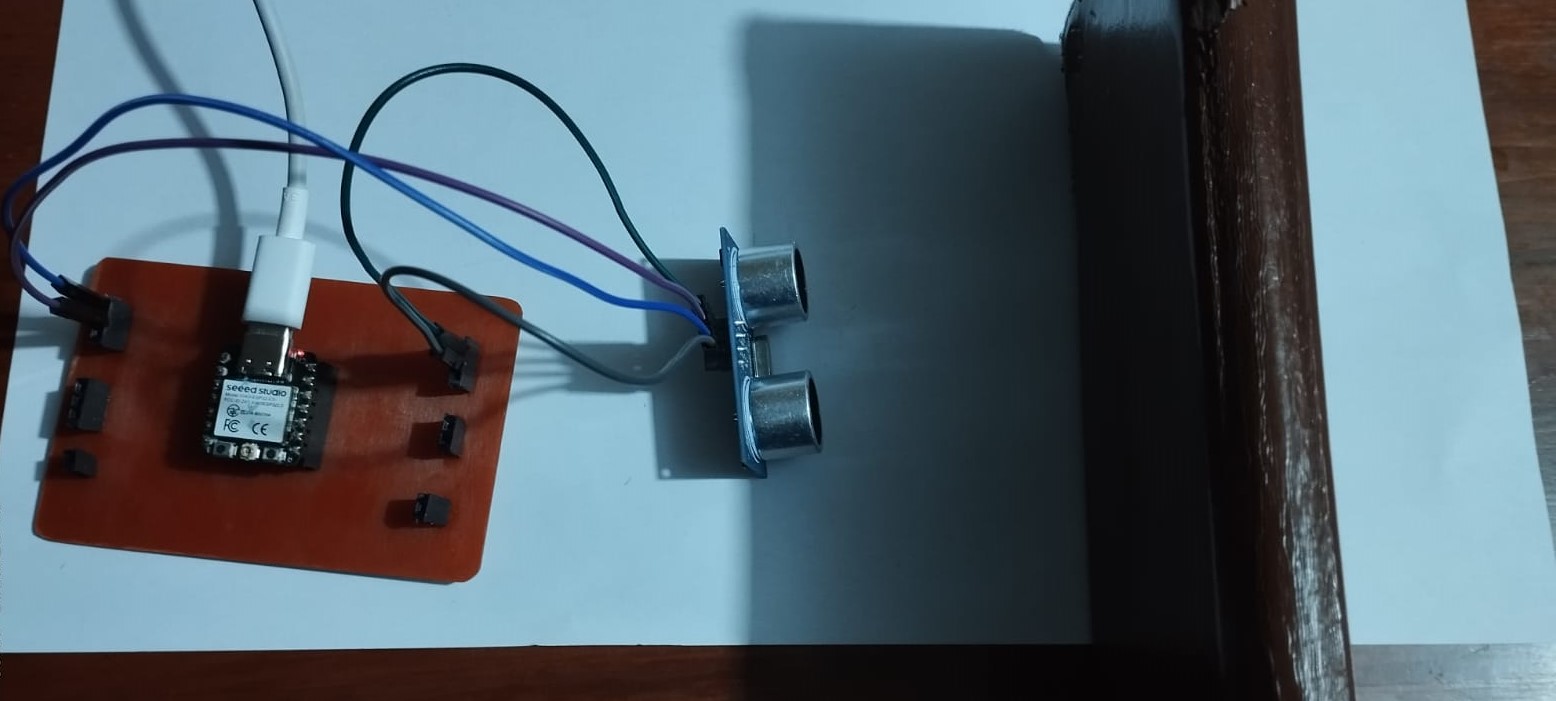
After completing the previous exercises, I will now add a sensor to the microcontroller board I designed to take readings. To do this, I integrated an HC-SR04 ultrasonic sensor into a custom PCB based on the ESP32-C3 XIAO.
The sensor measures distances using ultrasonic pulses. The input signal (TRIG) is generated from a GPIO pin on the microcontroller, while the return signal (ECHO) is read and processed to calculate the distance. The result is displayed on the serial monitor, continuously showing the measured distance.
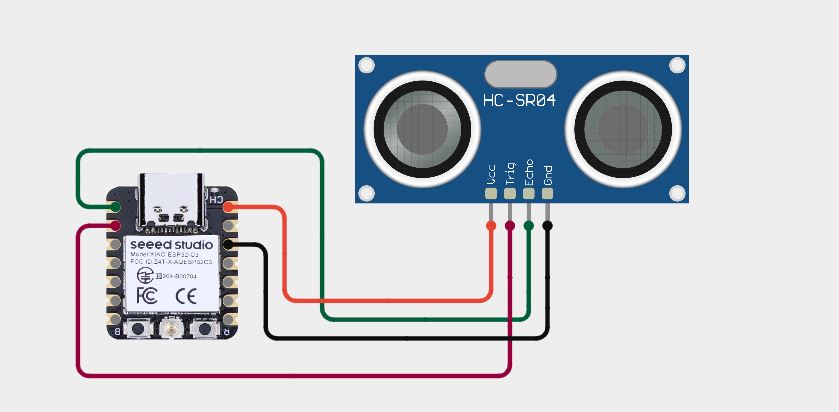
Step 1: Circuit Design (Schematic)
Connection of the HC-SR04 to the ESP32-C3 XIAO
HC-SR04 to ESP32-C3 XIAO Pin Mapping
| HC-SR04 |
ESP32-C3 XIAO |
Description |
| VCC |
VBUS (5V USB) |
Power supply |
| GND |
GND |
Ground |
| TRIG |
GPIO 2 |
Trigger pulse |
| ECHO |
GPIO 3 |
Echo signal read |
Serial Communication
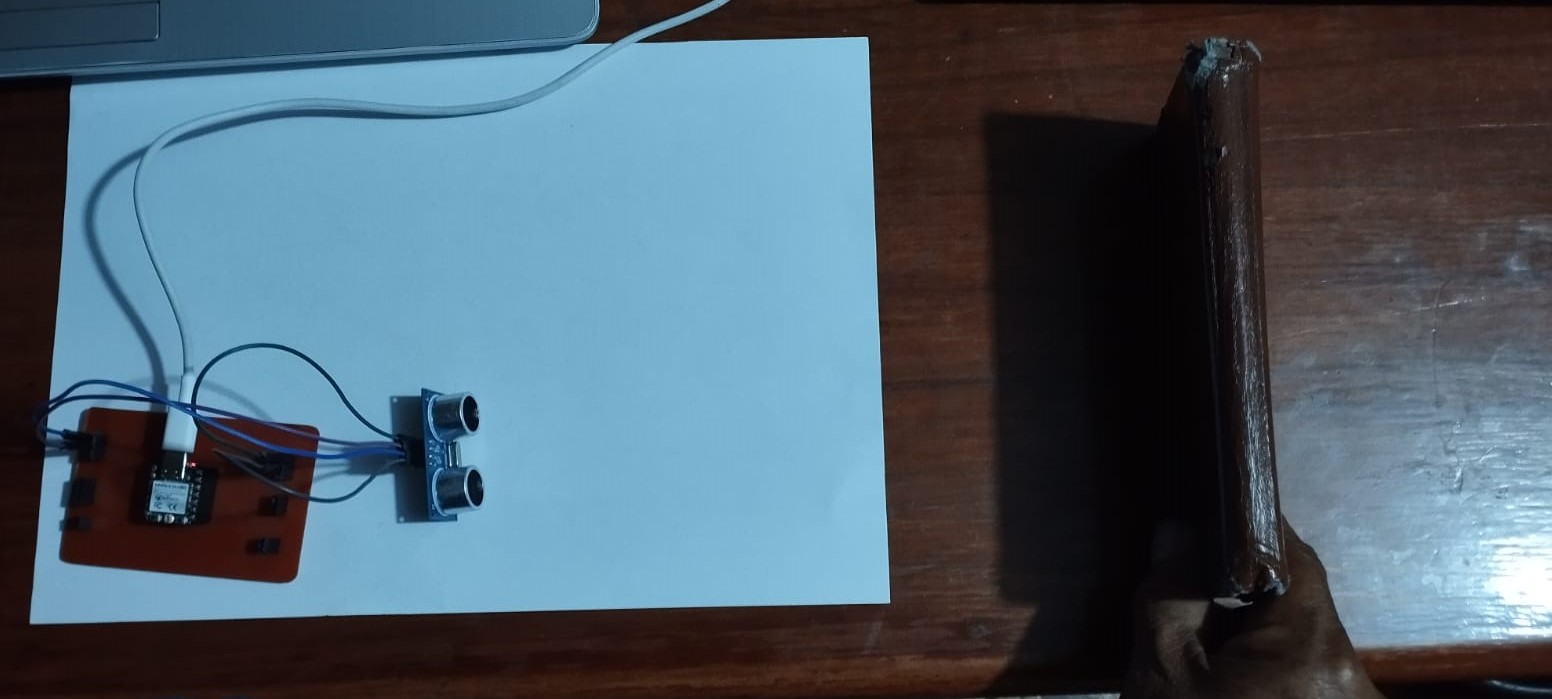
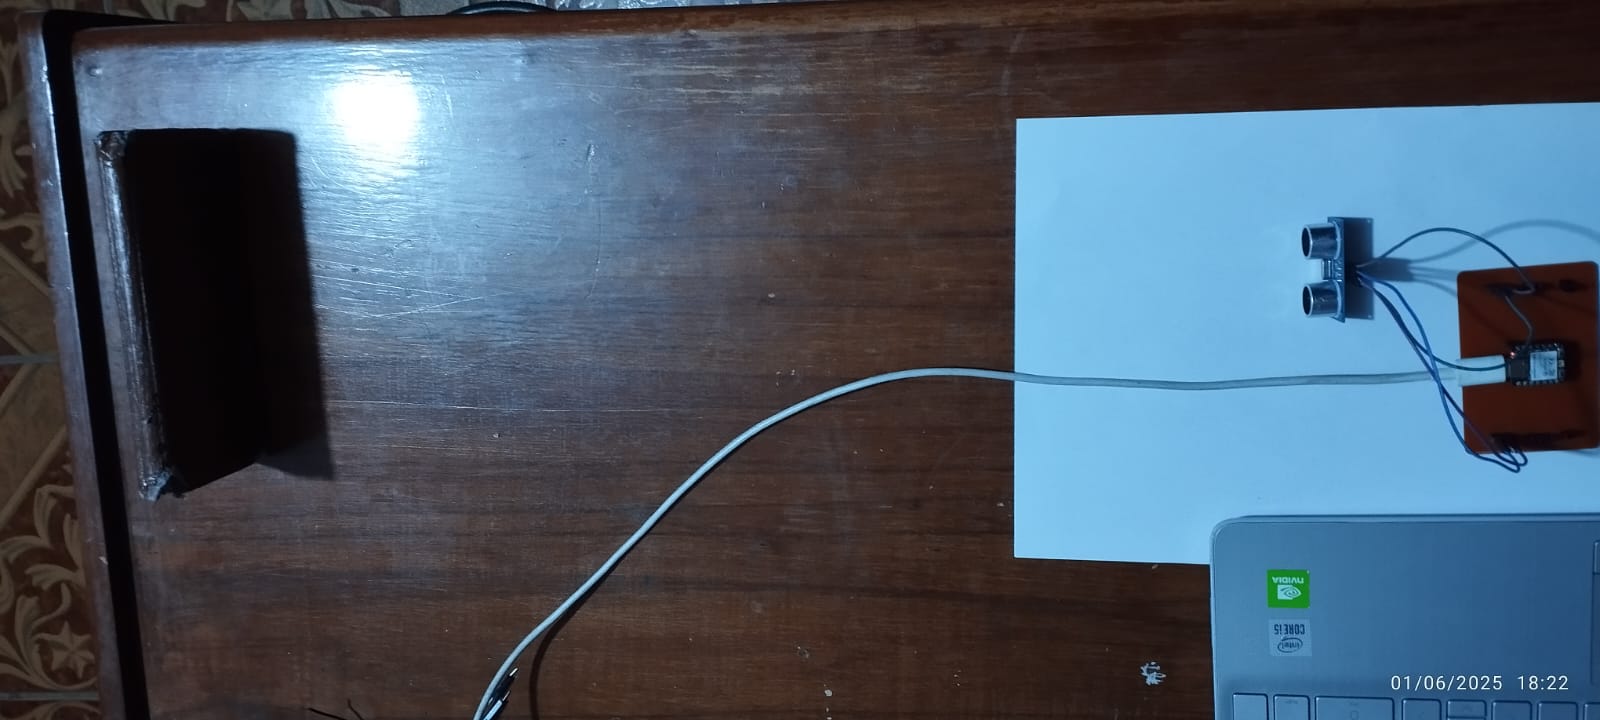
The connection circuit between the XIAO ESP32-C3 and the HC-SR04 Ultrasonic Sensor is as follows:
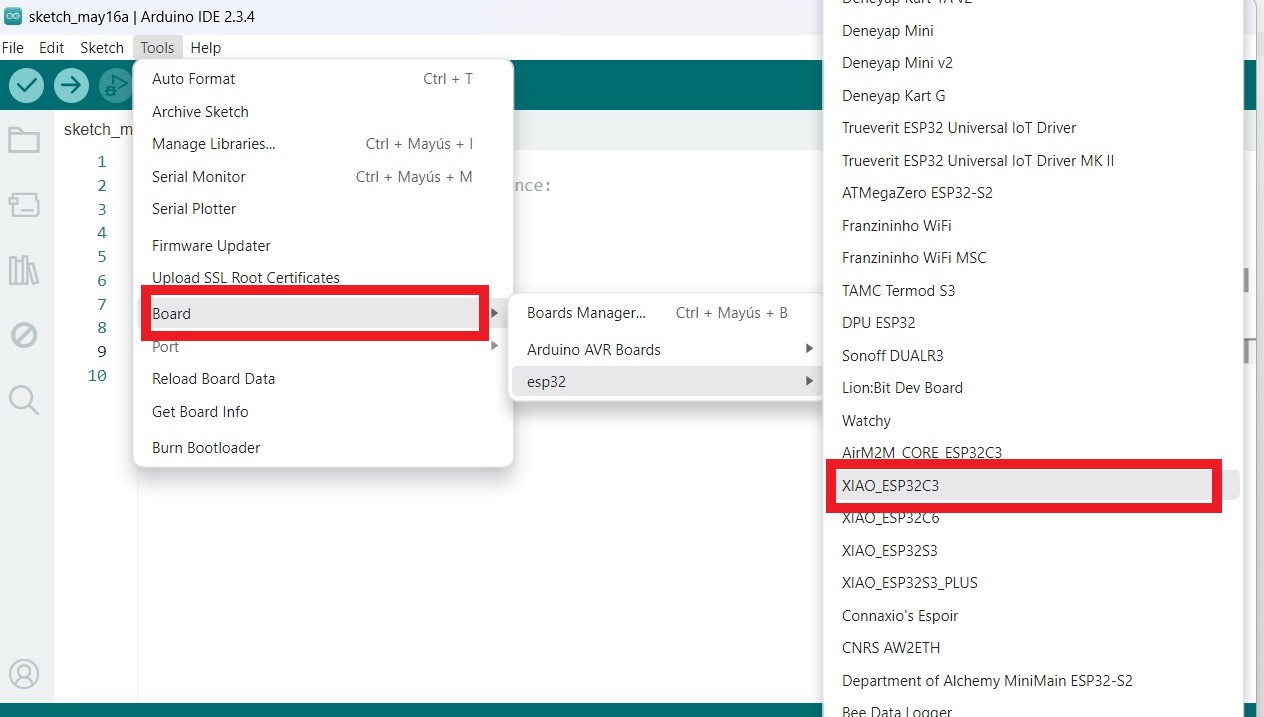
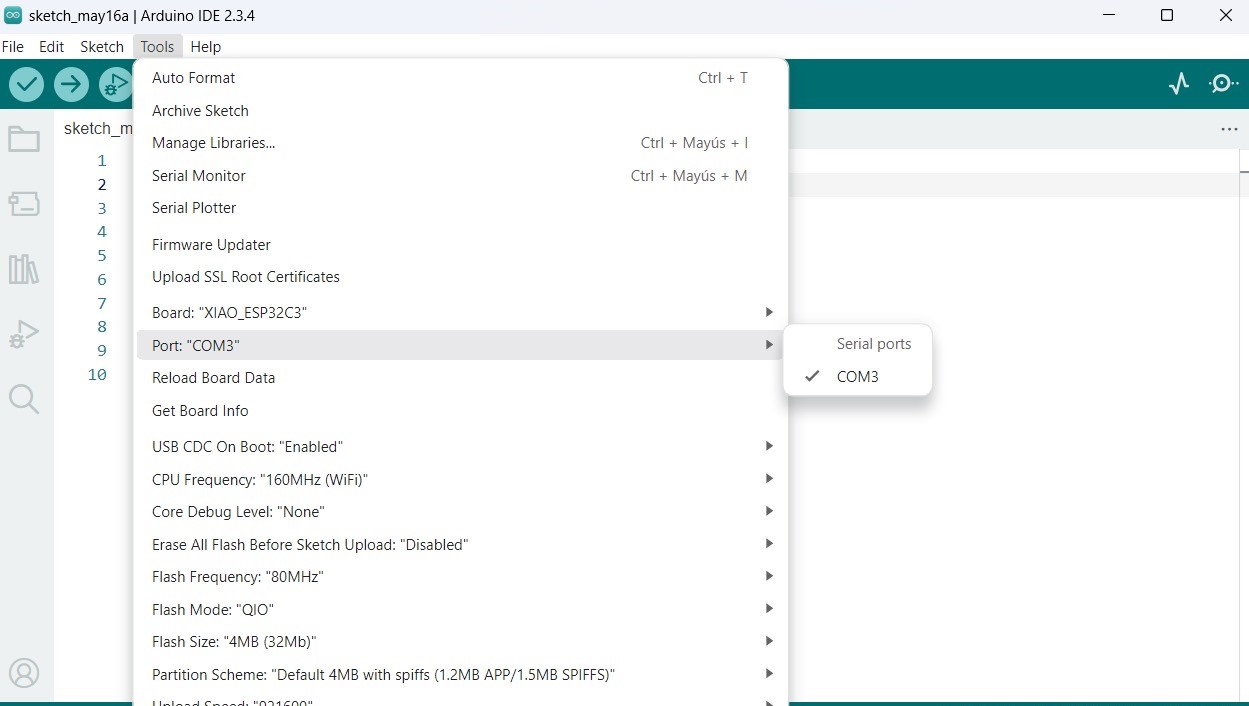
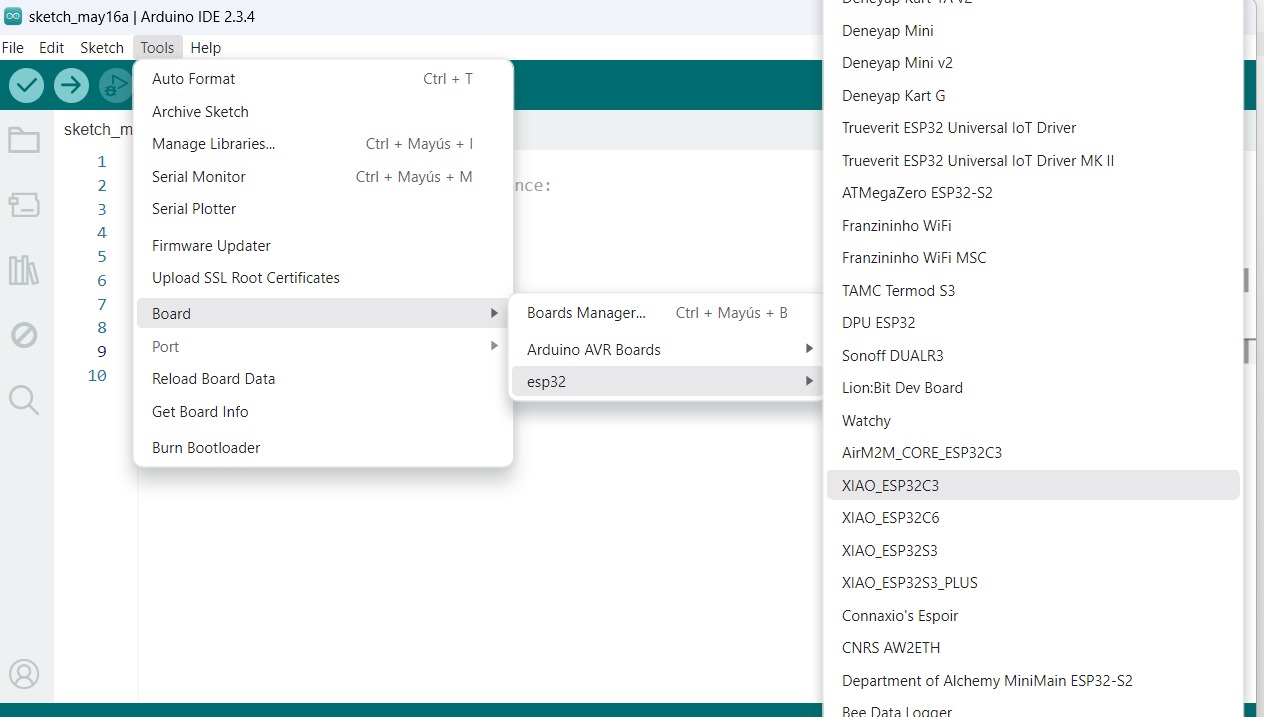
Once the XIAO EP32-C3 board is installed, go to Tools -> Board, search for "Seeed Studio XIAO ESP32C3" and select it. This completes the configuration of Seeed Studio XIAO ESP32C3 for the Arduino IDE. Next, select the serial port.
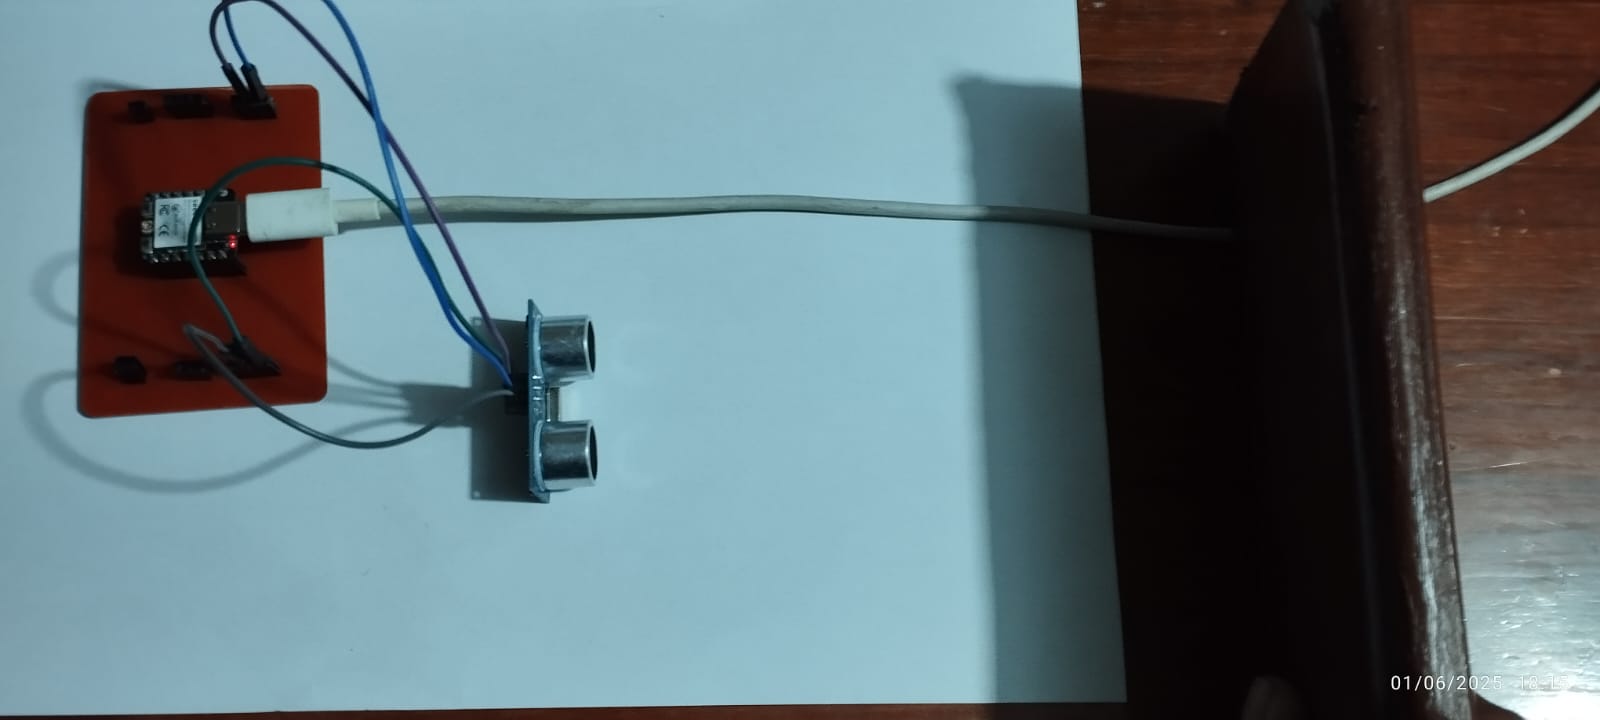
I connected the ultrasonic sensor to the ESP32-C3 XIAO microcontroller, using GPIO pin 3 (D3) as a digital output to send the trigger pulse (TRIG) and GPIO pin 2 (D2) as a digital input to receive the sensor echo (ECHO).
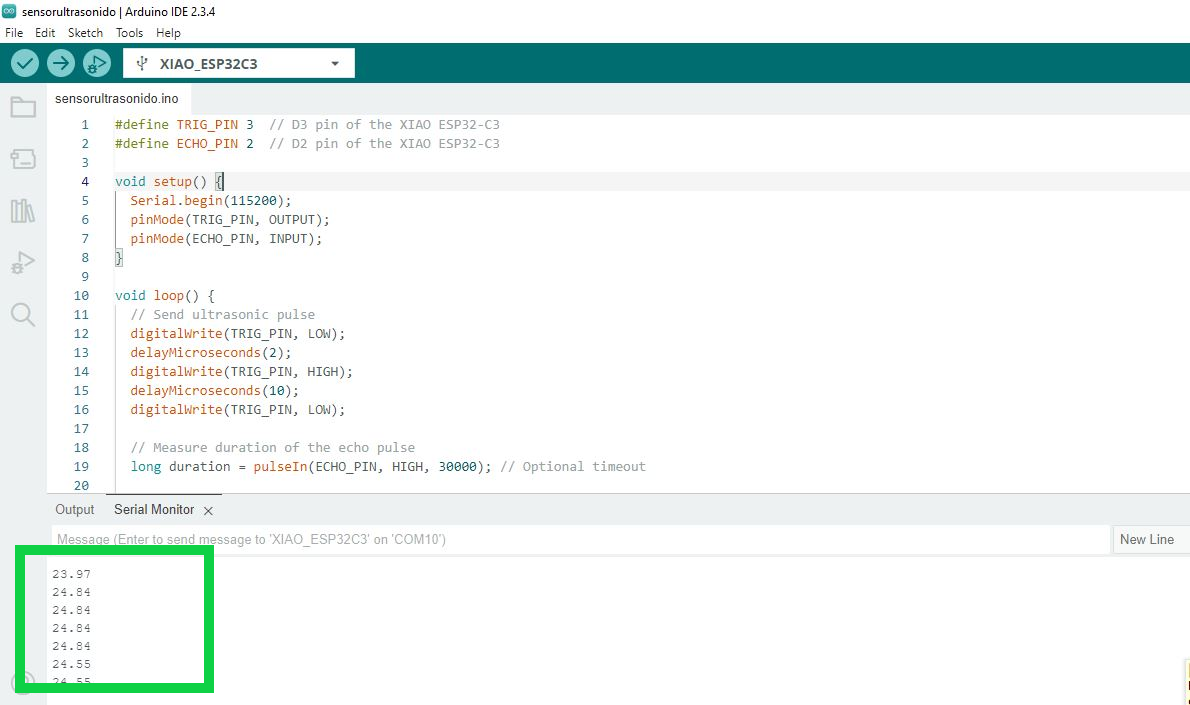
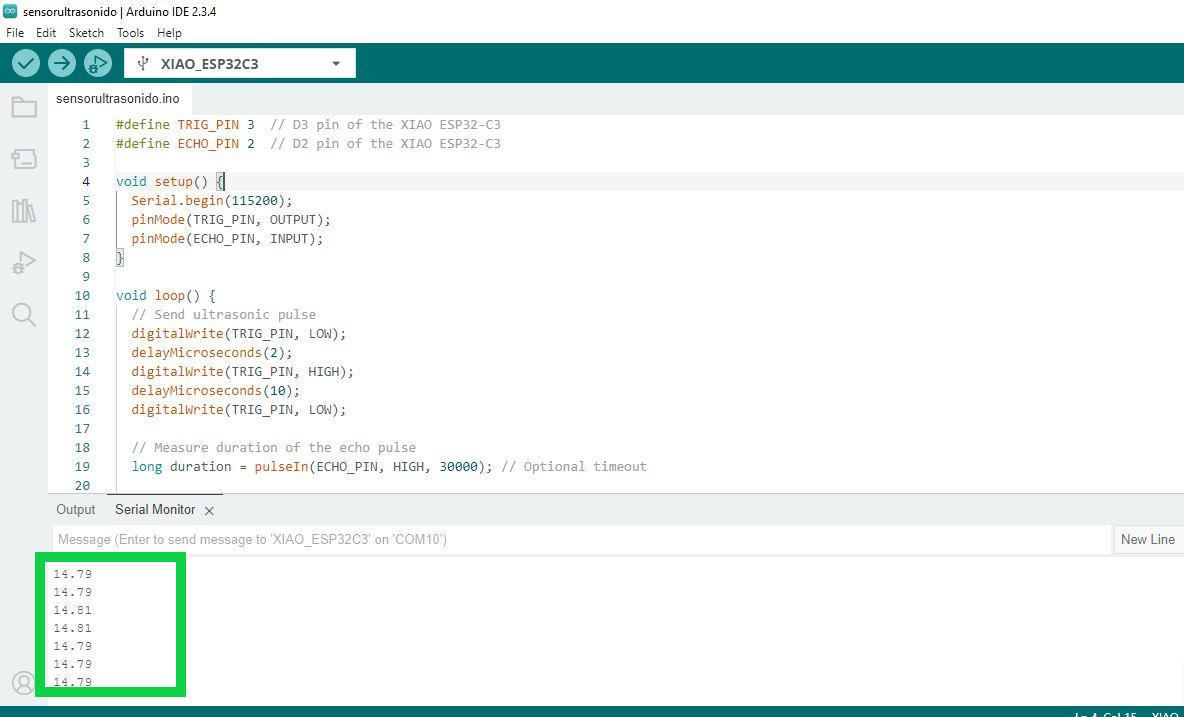
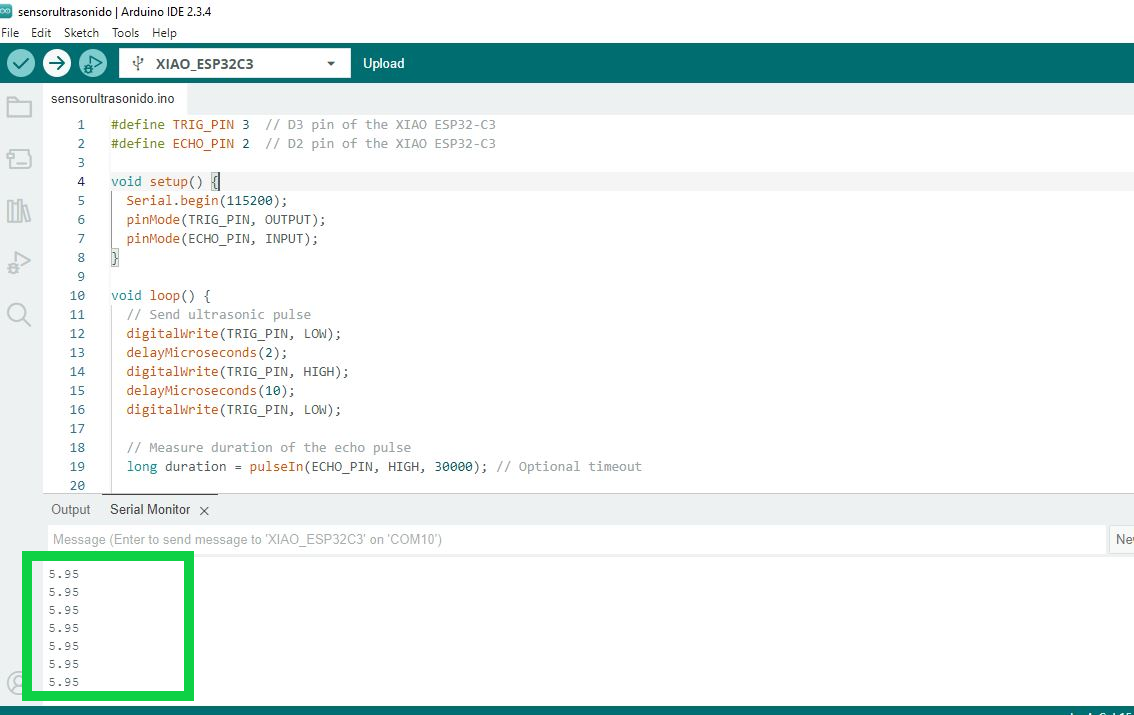
Then, I uploaded the following code to the ESP32-C3 XIAO to display the distance values in real time via the serial monitor in the Arduino IDE:
Ultrasonic Distance Measurement Code for ESP32-C3 XIAO
#define TRIG_PIN 3  // D3 pin of the XIAO ESP32-C3
#define ECHO_PIN 2  // D2 pin of the XIAO ESP32-C3

void setup() {
  Serial.begin(115200);
  pinMode(TRIG_PIN, OUTPUT);
  pinMode(ECHO_PIN, INPUT);
}

void loop() {
  // Send ultrasonic pulse
  digitalWrite(TRIG_PIN, LOW);
  delayMicroseconds(2);
  digitalWrite(TRIG_PIN, HIGH);
  delayMicroseconds(10);
  digitalWrite(TRIG_PIN, LOW);

  // Measure duration of the echo pulse
  long duration = pulseIn(ECHO_PIN, HIGH, 30000); // Optional 30ms timeout

  // Calculate distance (in cm)
  float distance = duration * 0.034 / 2;

  // Print only the distance value (for plotting)
  if (duration > 0) {
    Serial.println(distance);
  }

  delay(100); // Sampling rate
}
Test Examples:
- Test 1: Object placed approximately 25 cm away
- Test 2: Object placed approximately 15 cm away
- Test 3: Object placed approximately 5 cm away
Test 1:
In the first test, the object was placed approximately 24 cm from the ultrasonic sensor. The sensor correctly detected the distance and printed the measurement values on the serial monitor in real time. The readings were stable and consistent, confirming the proper functioning of the sensor and code within this range.
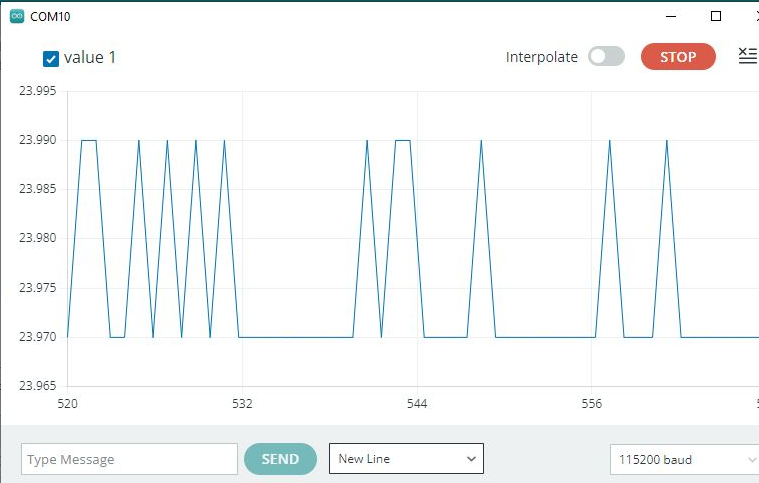
Graph displayed in the Arduino IDE Serial Plotter
The graph displayed in the Arduino IDE Serial Plotter shows the distance values measured by the HC-SR04 ultrasonic sensor connected to the ESP32-C3 XIAO.
Each spike on the graph represents a distance reading based on the time it takes for the ultrasonic pulse to return.
In this case, the values range between 23.97 and 23.99 cm, indicating that the object in front of the sensor remained at a fairly stable distance. Minor fluctuations are expected due to sensor noise or timing variation.
Test 2:
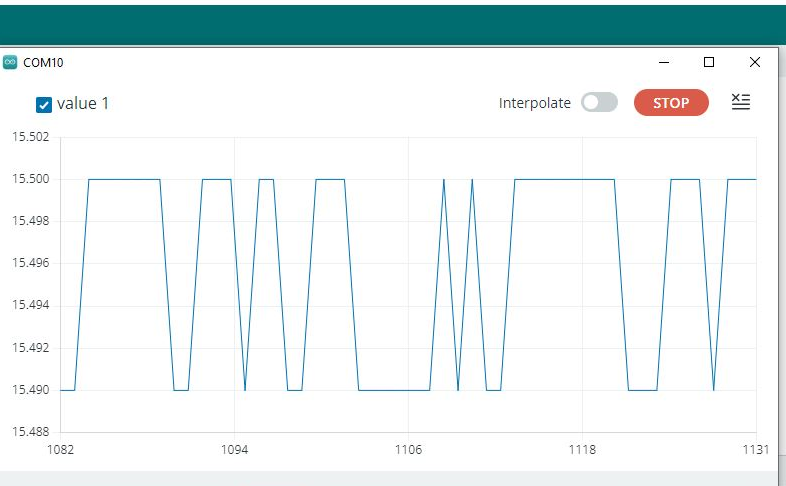
In the second test, the object was placed approximately 15 cm away from the ultrasonic sensor. The sensor measured the distance accurately and displayed the values on the serial monitor. The results remained consistent, demonstrating reliable sensor performance at closer ranges.
The graph shows the data captured by the HC-SR04 ultrasonic sensor connected to the ESP32-C3 XIAO microcontroller, displayed using the Arduino IDE Serial Plotter. In this test, the object was placed at a distance of approximately 15.5 cm, and the measurement values fluctuated slightly between 15.490 and 15.500 cm.
Test 3:
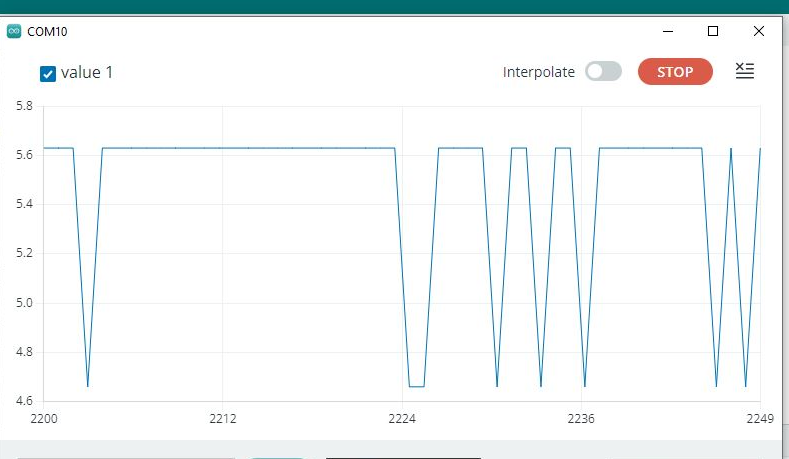
In the third test, the object was placed approximately 5 cm away from the ultrasonic sensor. The sensor was able to detect the close distance and provided consistent measurements in the serial monitor, confirming its effectiveness for short-range detection.
The image shows the data obtained by the HC-SR04 ultrasonic sensor connected to the ESP32-C3 XIAO microcontroller. The data was displayed using the Arduino IDE's Serial Plotter. In this third test, the object was placed at a distance of approximately 5 cm from the sensor. On the graph, the values remained mainly around 5.6 cm, with slight fluctuations around 4.7 cm. These variations are considered normal and may be due to irregular ultrasound reflections off very close surfaces.
Wi-Fi Communication
To observe ultrasonic sensor data on a cloud server via WiFi using the ESP32-C3 XIAO, the goal of this exercise is to send the distance measurements captured by the ultrasonic sensor over a WiFi network to a cloud server (e.g.,ThingSpeak ). This will allow the data to be viewed remotely in real time from a web browser or monitoring dashboard.
Below are the detailed steps to log in and start using ThingSpeak:

We enter the ThingSpeak website
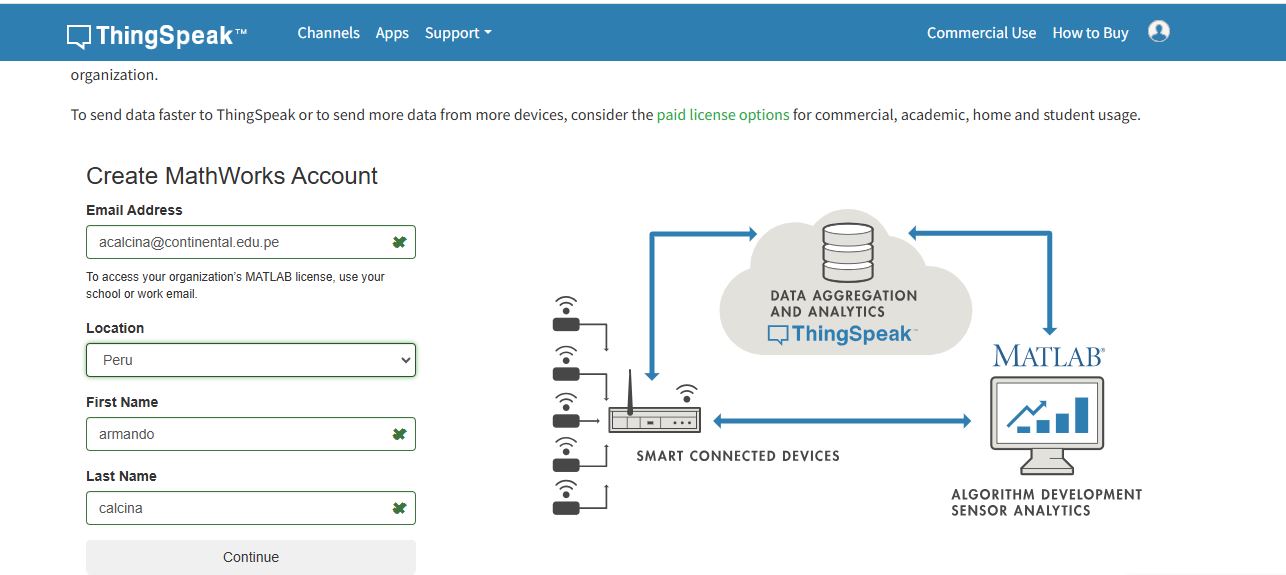
We registered and created an account on ThingSpeak
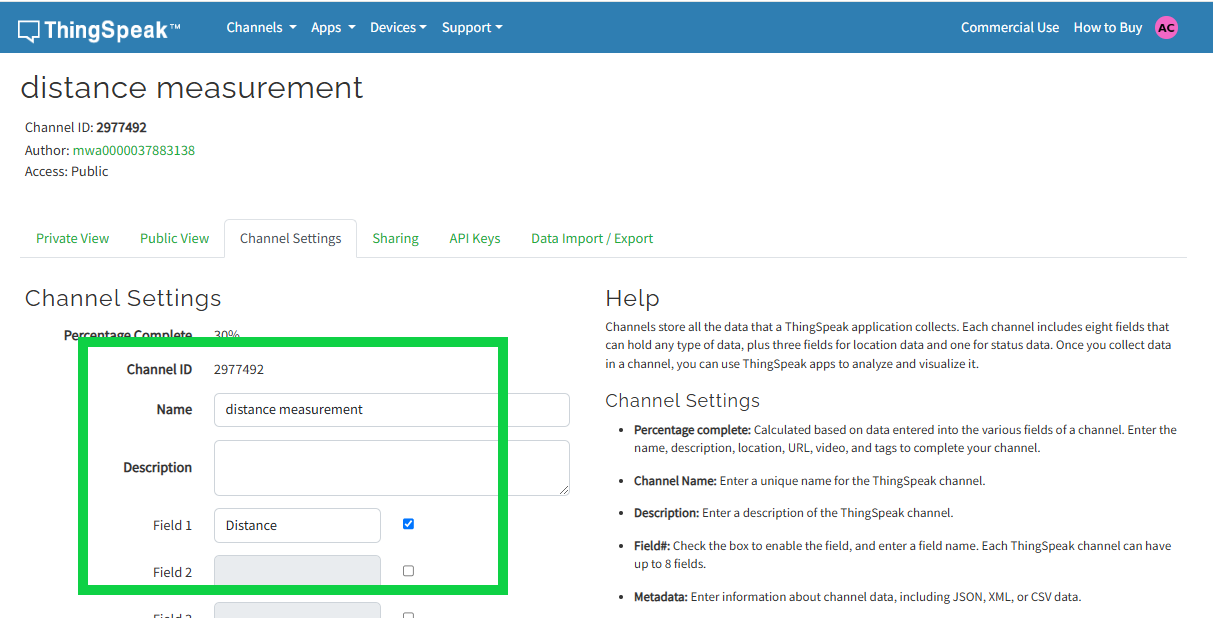
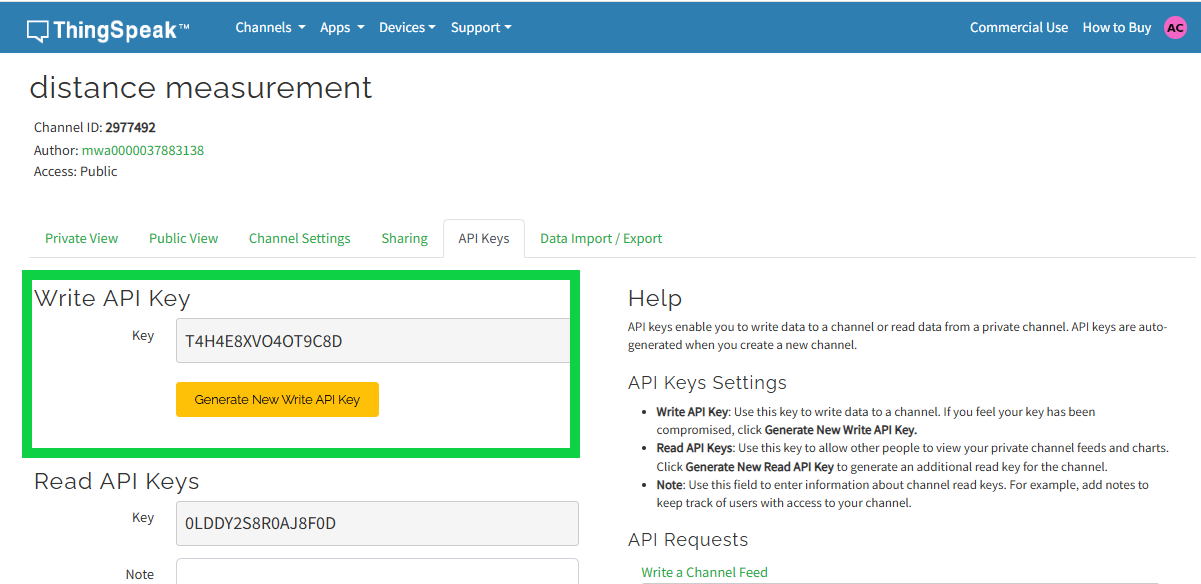
After creating the account, the next step is to set it up and take note of the API key.
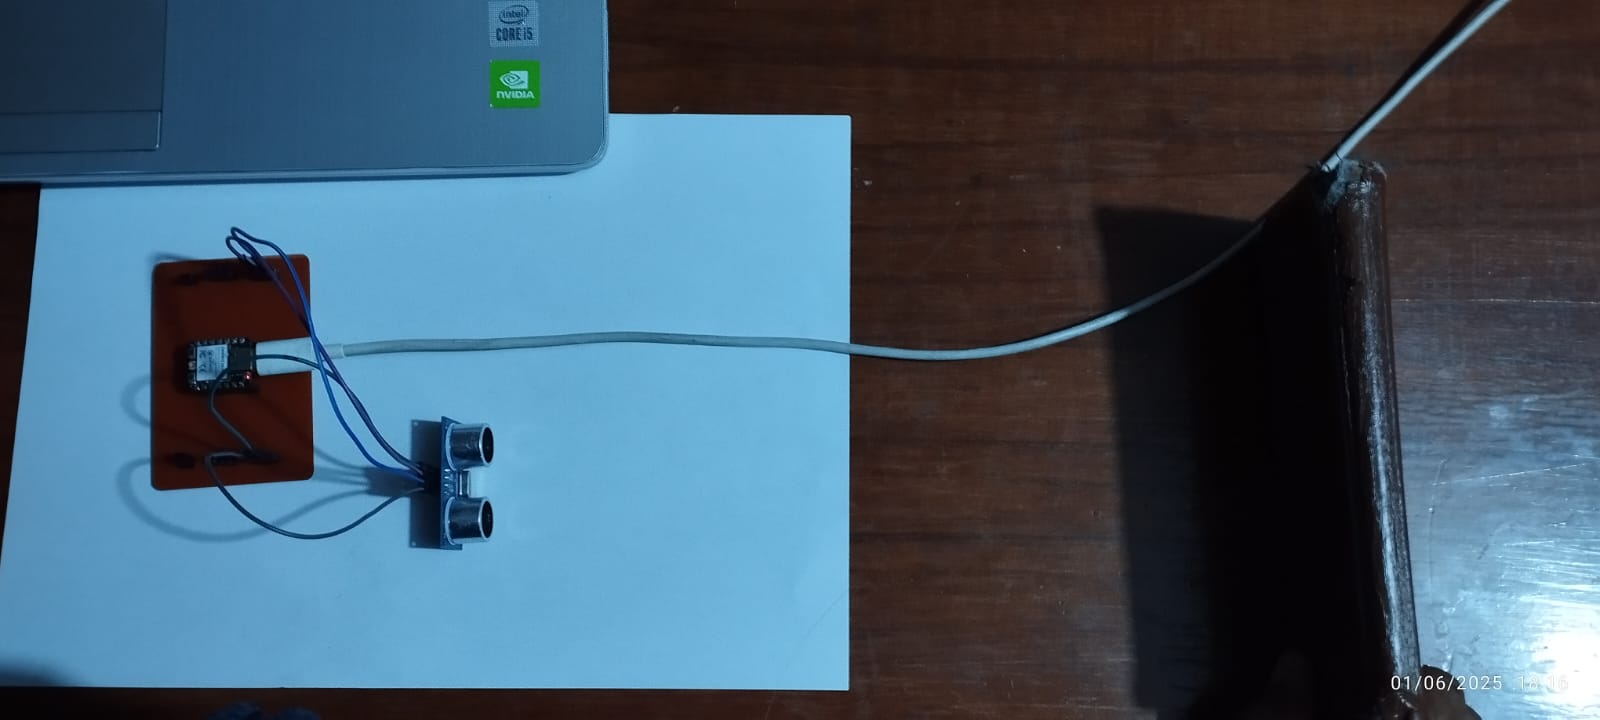
In order to display the distance using the HC-SR04 ultrasonic sensor connected to an ESP32-C3 XIAO microcontroller, using the card that I previously made in the previous weeks, the distance data will be sent to the ThingSpeak platform via WiFi, where they will be stored and graphed in real time for remote monitoring.
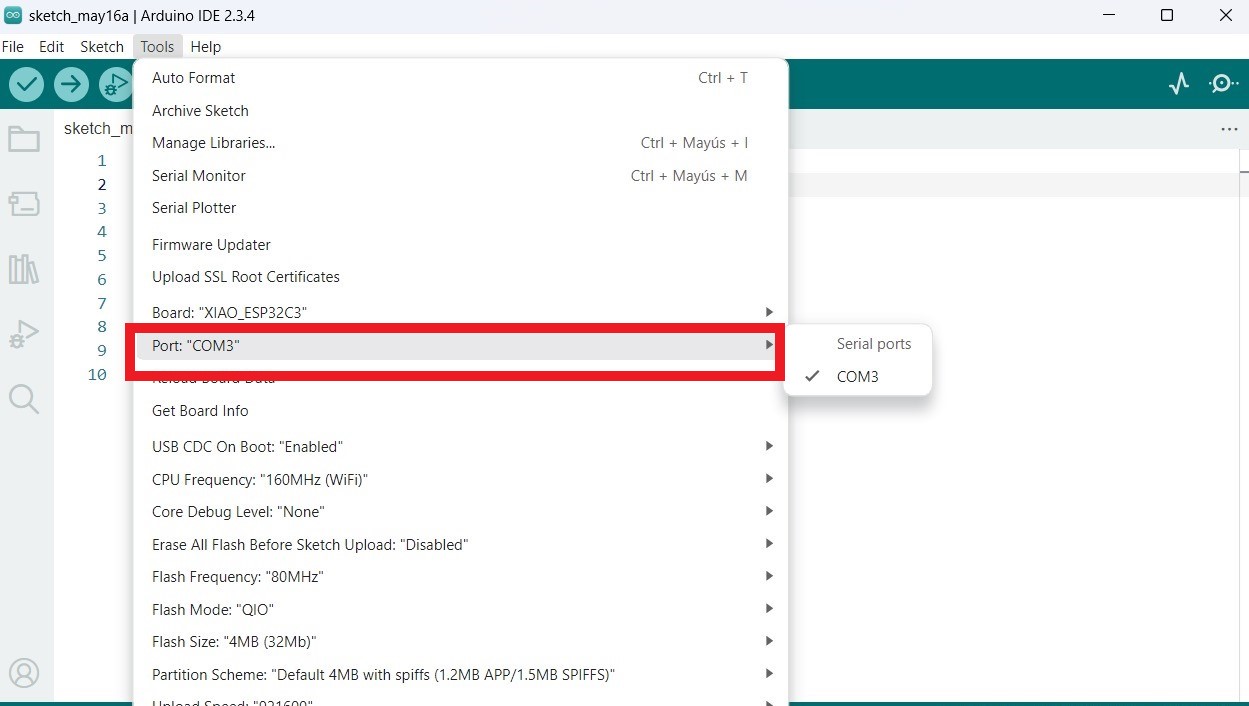
In the Arduino IDE environment we will select the board and the COM port that we will use.
Code to measure distance and send to ThingSpeak
#include <WiFi.h>
#include "ThingSpeak.h"

// HC-SR04 sensor pins
#define TRIG_PIN 3  // D3 on ESP32-C3 XIAO
#define ECHO_PIN 2  // D2 on ESP32-C3 XIAO

// Your WiFi credentials
const char* ssid = "Albert";
const char* password = "19855148A";

// ThingSpeak channel info
unsigned long channelNumber = 2977492;  // Your channel ID
const char* writeAPIKey = "T4H4E8XVO4OT9C8D"; // Replace with your Write API Key

WiFiClient client;

void setup() {
  Serial.begin(115200);

  pinMode(TRIG_PIN, OUTPUT);
  pinMode(ECHO_PIN, INPUT);

  WiFi.begin(ssid, password);
  Serial.print("Connecting to WiFi...");
  while (WiFi.status() != WL_CONNECTED) {
    delay(500);
    Serial.print(".");
  }
  Serial.println("\nConnected to WiFi!");

  ThingSpeak.begin(client);
}

void loop() {
  // Trigger the ultrasonic pulse
  digitalWrite(TRIG_PIN, LOW);
  delayMicroseconds(2);
  digitalWrite(TRIG_PIN, HIGH);
  delayMicroseconds(10);
  digitalWrite(TRIG_PIN, LOW);

  // Read echo time
  long duration = pulseIn(ECHO_PIN, HIGH, 30000); // Timeout: 30 ms
  float distance = duration * 0.034 / 2;

  Serial.print("Distance: ");
  Serial.print(distance);
  Serial.println(" cm");

  // Send data to ThingSpeak
  if (duration > 0) {
    ThingSpeak.setField(1, distance);
    int status = ThingSpeak.writeFields(channelNumber, writeAPIKey);

    if (status == 200) {
      Serial.println("Data sent successfully.");
    } else {
      Serial.print("Failed to send data. HTTP error code: ");
      Serial.println(status);
    }
  }

  delay(20000); // ThingSpeak free limit: every 15–20 seconds
}
Test 1:
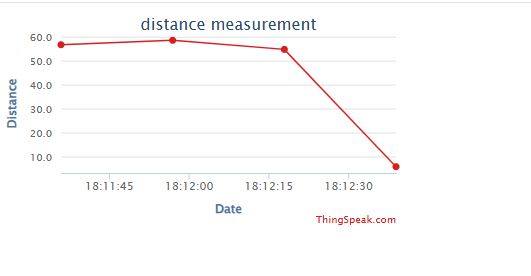
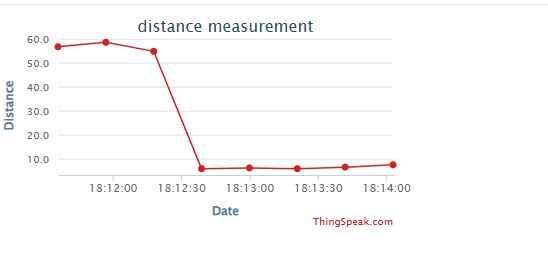
For the first test, I placed an object approximately 50 cm in front of the ultrasonic sensor (HC-SR04). The ESP32-C3 XIAO measured the distance and sent the data to ThingSpeak. The distance values were successfully visualized through the real-time graph available on the ThingSpeak platform.
Test 2:
For the second test, the object was placed approximately 10 cm in front of the ultrasonic sensor (HC-SR04). The ESP32-C3 XIAO recorded the distance and transmitted the data to ThingSpeak. The corresponding change was clearly observed in the real-time graph on the ThingSpeak platform.
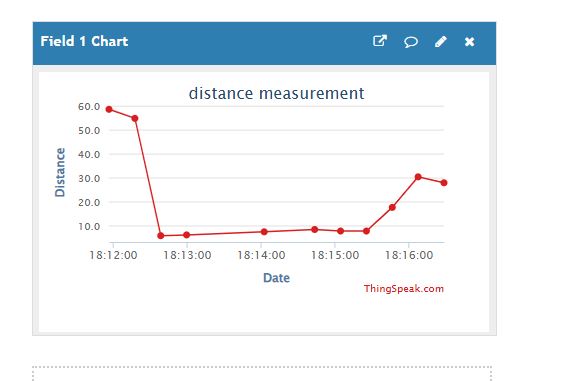
Test 3:
For the third test, the object was placed at a distance of approximately 30 cm from the ultrasonic sensor (HC-SR04). The ESP32-C3 XIAO measured the distance accurately and sent the data to ThingSpeak. The graph on the ThingSpeak platform reflected the new distance value in real time.
Click the button below to access the ThingSpeak channel and view the real-time distance data collected by the ultrasonic sensor.
Open ThingSpeak Channel
Do you have any problem?
Yes, I initially had trouble getting the ESP32-C3 XIAO to connect to WiFi. The problem was due to incorrect pin definitions and unstable power supply. I solved it by double-checking the wiring, using a stable USB cable, and verifying the correct pin numbers in the code. I also made sure the WiFi credentials were entered correctly. After fixing these issues, the device connected and sent data to ThingSpeak successfully.
In this project, I successfully integrated an ultrasonic distance sensor (HC-SR04) with a custom-designed microcontroller board based on the ESP32-C3 XIAO. The sensor accurately measured the distance to nearby objects, and the data was processed and transmitted to the ThingSpeak platform, where it was visualized in real time using dynamic graphs.
This task not only demonstrated the ability to connect and read sensors through microcontroller hardware, but also introduced cloud-based monitoring and data logging, which are essential for IoT applications.
Moreover, this experience is directly applicable to my ongoing development of a surveillance robot. The ability to measure distance reliably and visualize it remotely forms a fundamental part of obstacle detection and autonomous navigation. Integrating cloud platforms like ThingSpeak opens possibilities for remote monitoring, system diagnostics, and performance analysis of the robot during field operation.
Link to files used this week
1. code ultrasonic.ino
2. Distance-ThingSpeak.ino