
In this Group Assignment, I will use an oscilloscope to probe the analog levels and digital signals of an input device.
Analog signals are continuous and can take any value within a specific range. On the oscilloscope, I will see them as a smooth, continuous line that varies over time, representing a physical magnitude that changes gradually, such as temperature or pressure.
On the other hand, digital signals are discrete and can only have certain values, typically 0 or 1. On the oscilloscope, digital signals will appear as pulses alternating between low (0) and high (1) levels, indicating the state of a system, such as a switch being on or off.
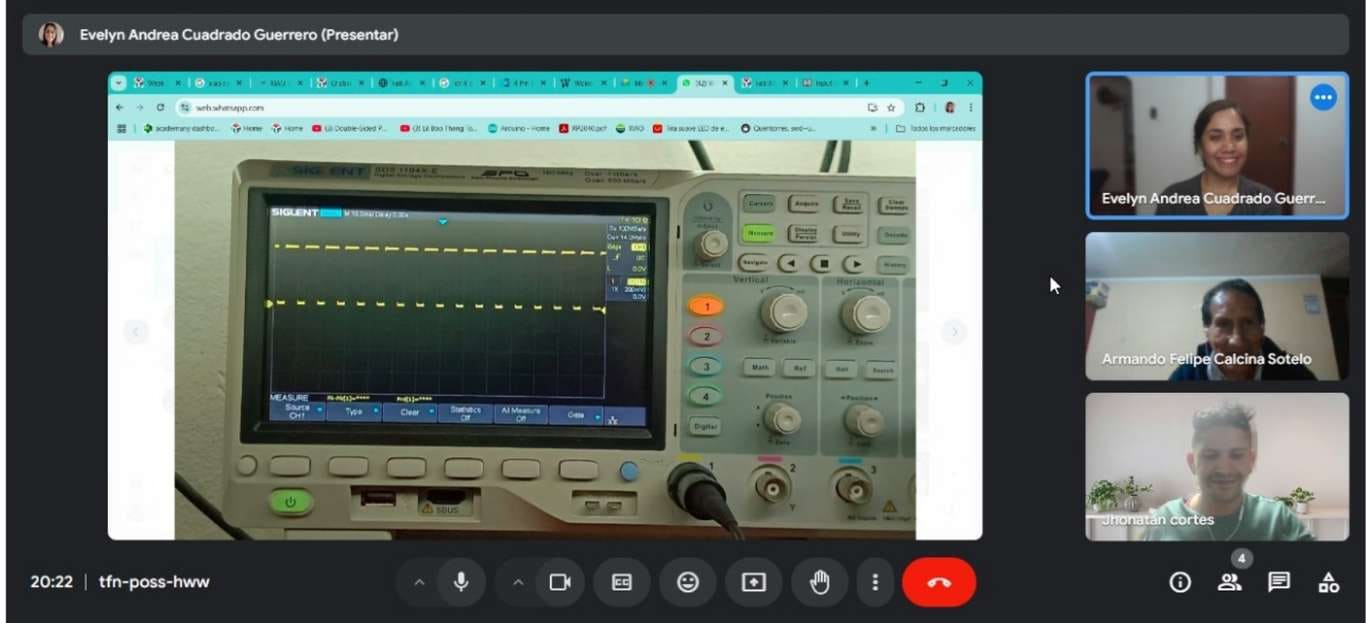
To advance in this project, a virtual meeting was organized to present our progress digitally. During the session, we shared our screens and demonstrated the selected sensors, detailing their characteristics and expected operation. We also discussed and compared the different sensors, analyzing their analog and digital signals based on the chosen devices. This activity allowed us to observe the real-time behavior of the signals generated by the sensors, facilitating the comparison of waveforms and their technical interpretation.
For this activity, I carried out the technical comparison with my colleague Jhonatan, while Armando joined the meeting to accompany us and observe the progress made.
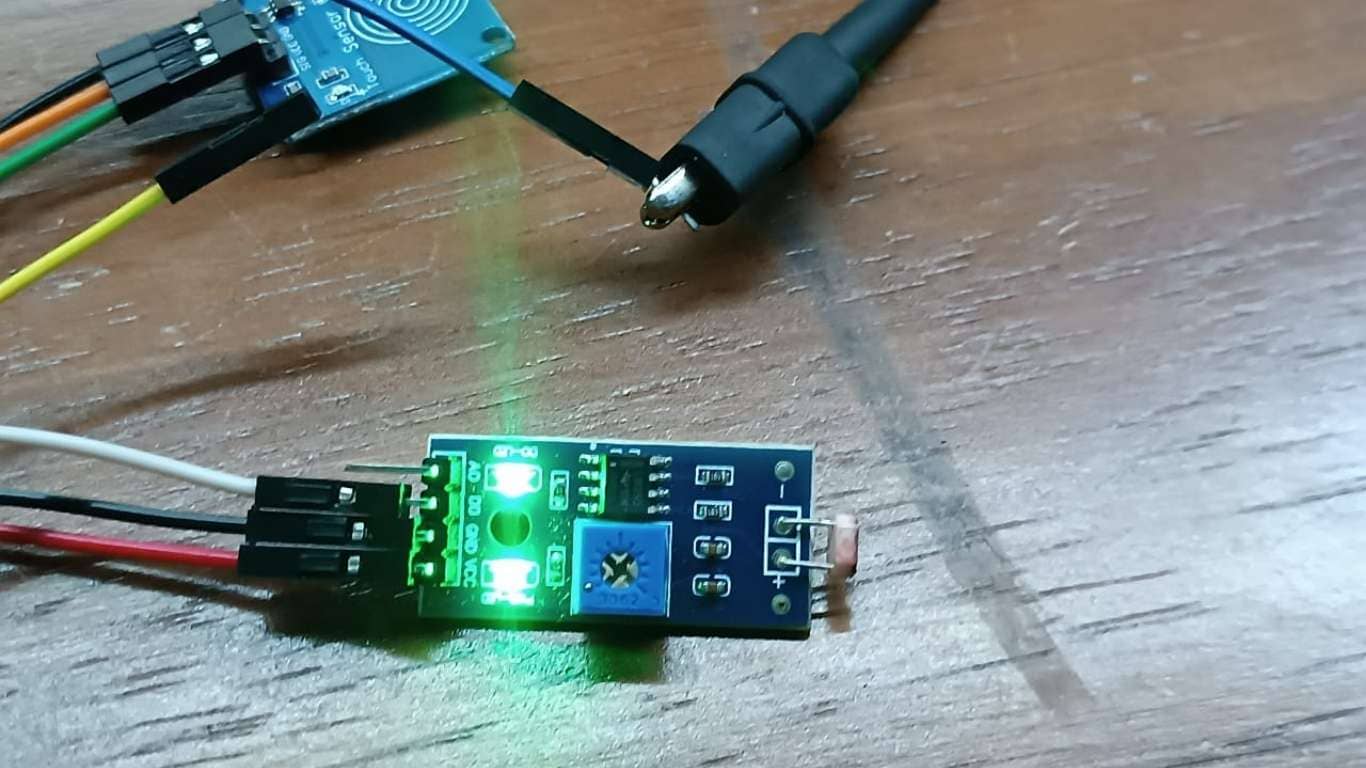
One of the sensors I am using for this comparison is the 4-pin LDR. This sensor, known as a Light Dependent Resistor (LDR), is a semiconductor component whose resistance varies depending on the amount of light that strikes it. In its 4-pin version, this sensor integrates a circuit that makes it easier to connect to other electronic devices, such as microcontrollers, allowing me to measure light intensity.
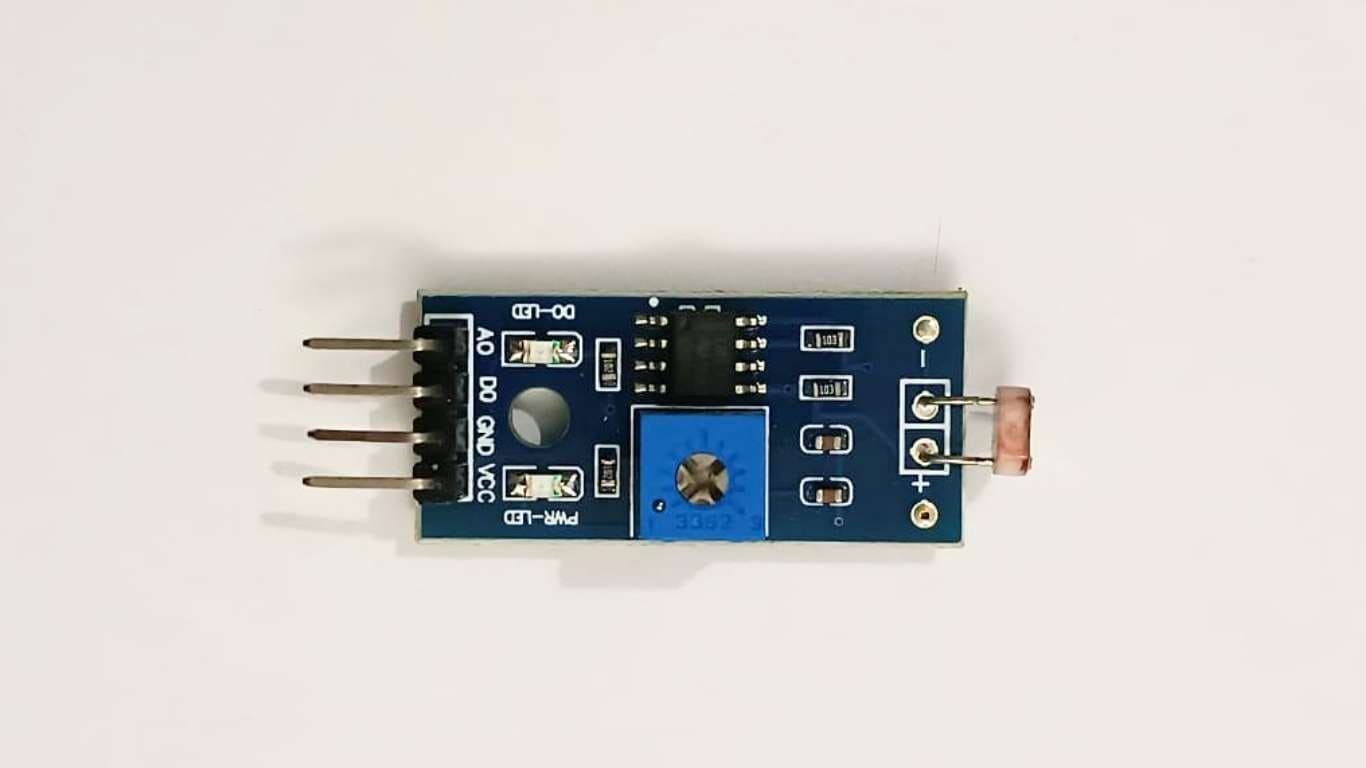
The type of signal that can be obtained from the 4-pin LDR is an analog signal. This means that the output voltage will be proportional to the intensity of the light hitting the sensor. As the light increases, the resistance decreases, and thus the output voltage changes, providing a continuous signal that can be analyzed to gather information about the light level.
Here is the link where you can check the technical details of the sensor: 4 Pin Photo-resistor LDR Light Detection Resistance Sensor Module
(*Data obtained by ChatGPT.)
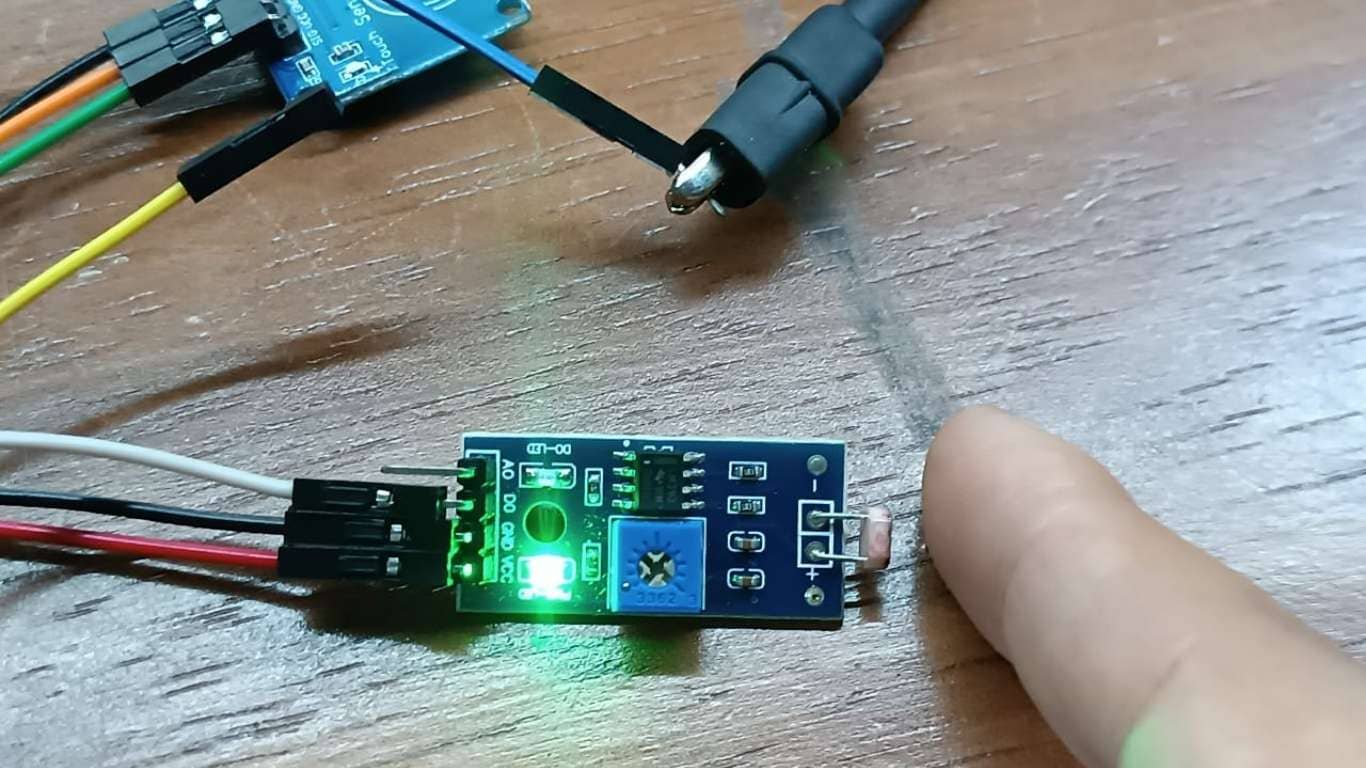
Now, I will proceed to test the sensor with the digital signal, to observe how it responds to changes in light and how the signal varies between levels of 0 and 1 on the oscilloscope.
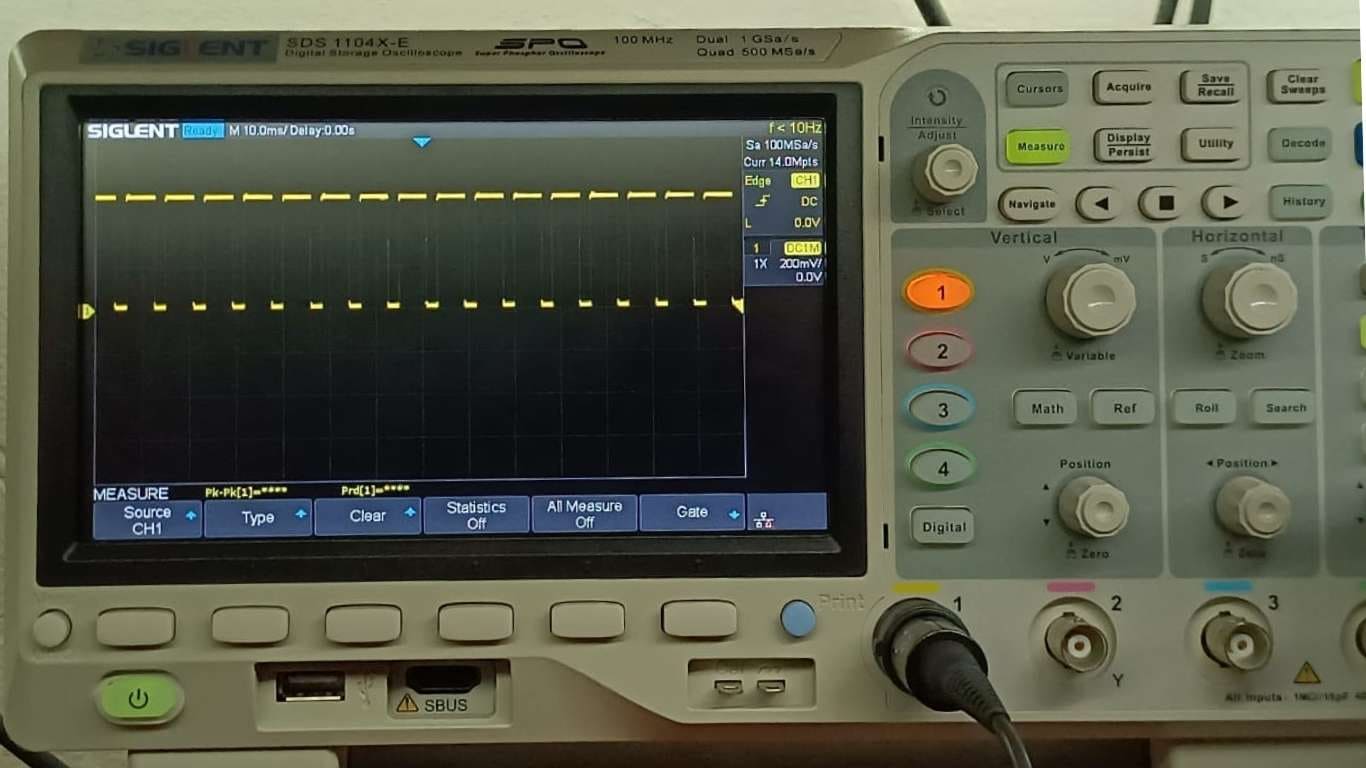
In the photograph, it can be seen that the digital signal appears as pulses that vary over time, with discrete values.
Here, it can be observed that I do not bring my hand closer to create any type of shadow, allowing the digital signal to be seen without additional interference.
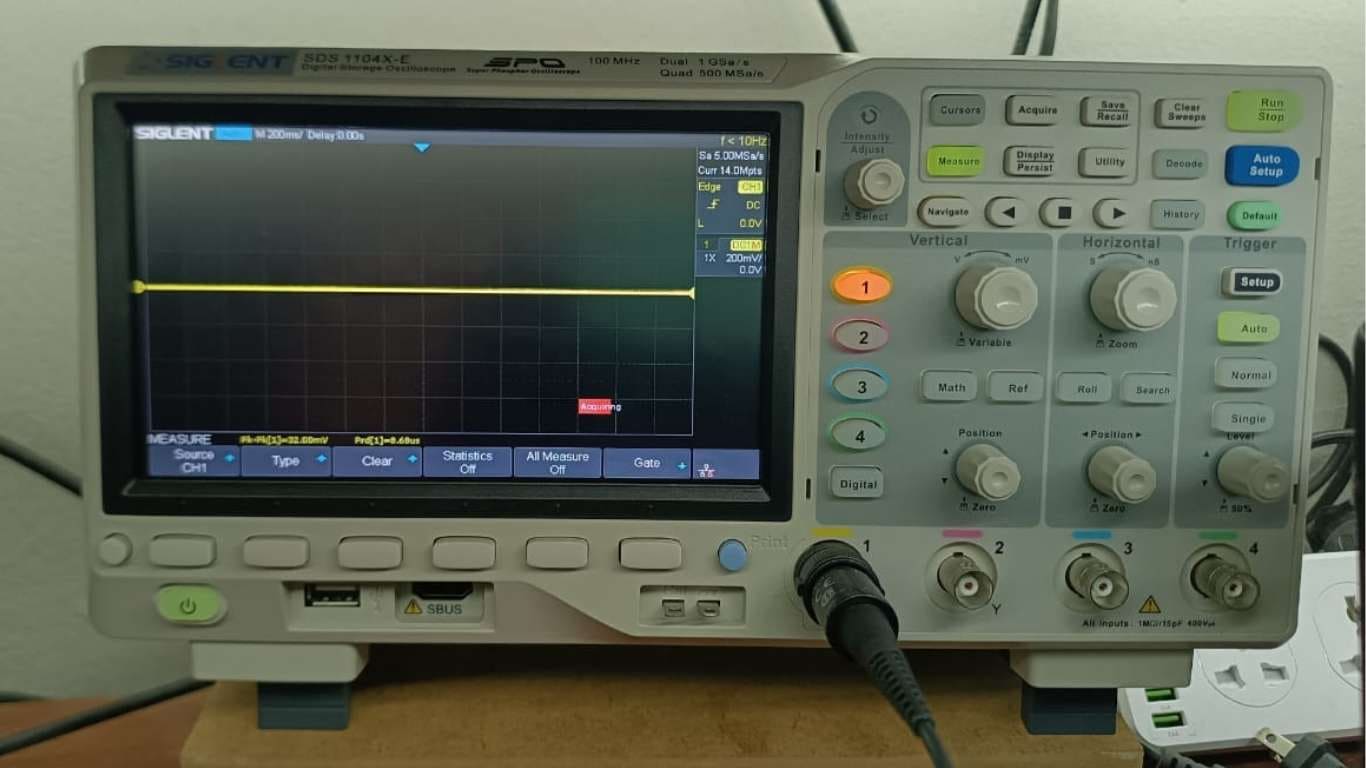
The result on the oscilloscope is a steady line, indicating that there are no interferences and the digital signal remains stable.
Now, I will test the sensor on the oscilloscope with the analog signal. When I don't bring my hand closer, the signal appears without any interference.
I bring my hand closer, and it can be observed on the oscilloscope screen that there is a change in the signal.
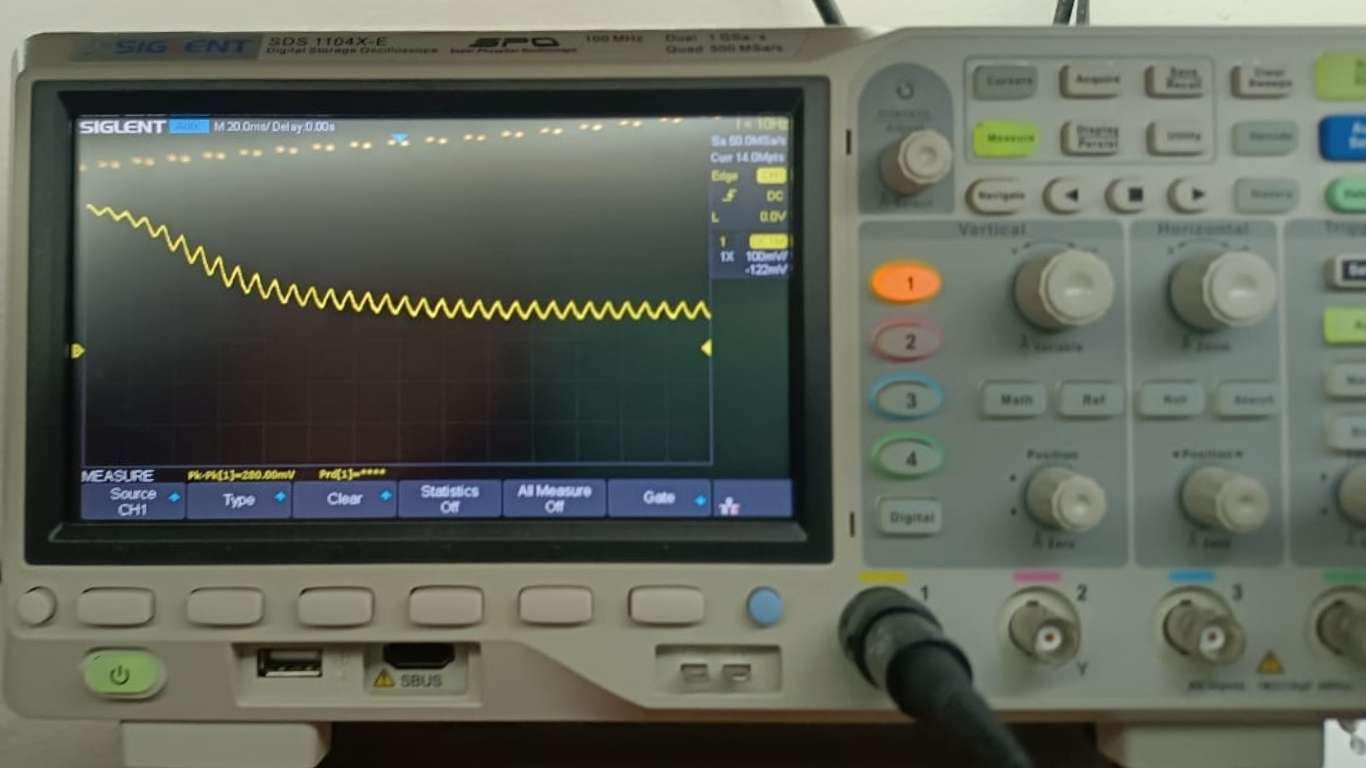
The LDR (Light Dependent Resistor) sensor demonstrated interesting behavior when tested with both analog and digital signals. With the analog signal, it was observed that when there was no interference, the signal remained continuous and stable. However, when the hand was brought closer, an alteration in the signal occurred, indicating that the sensor responded gradually to changes in light intensity.
On the other hand, with the digital signal, pulses alternating between discrete values (0 and 1) were noticed. In this case, interference was also visible when the hand was brought closer, causing a change in the signal pattern, indicating that the sensor detected light variations in a more direct and digital manner.
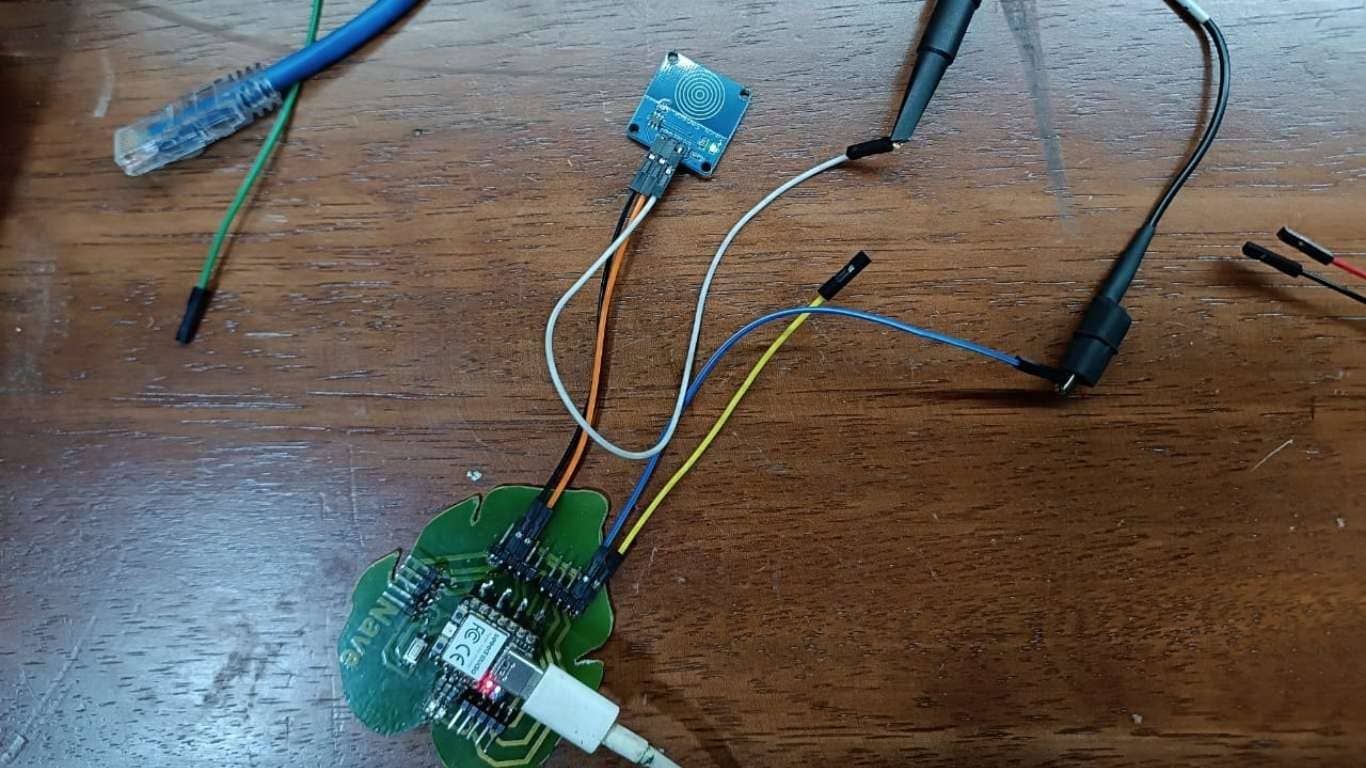
For the next exercise, I will use the touch sensor. This sensor detects physical contact or the proximity of an object, typically human skin, through an electric field. When the surface of the sensor is touched, it generates a signal that can be interpreted by a microcontroller to perform a specific action, such as turning on a light, activating a motor, or carrying out some other type of interaction in a system. Touch sensors are widely used in electronic devices like mobile phones, touchscreens, and contactless control systems.
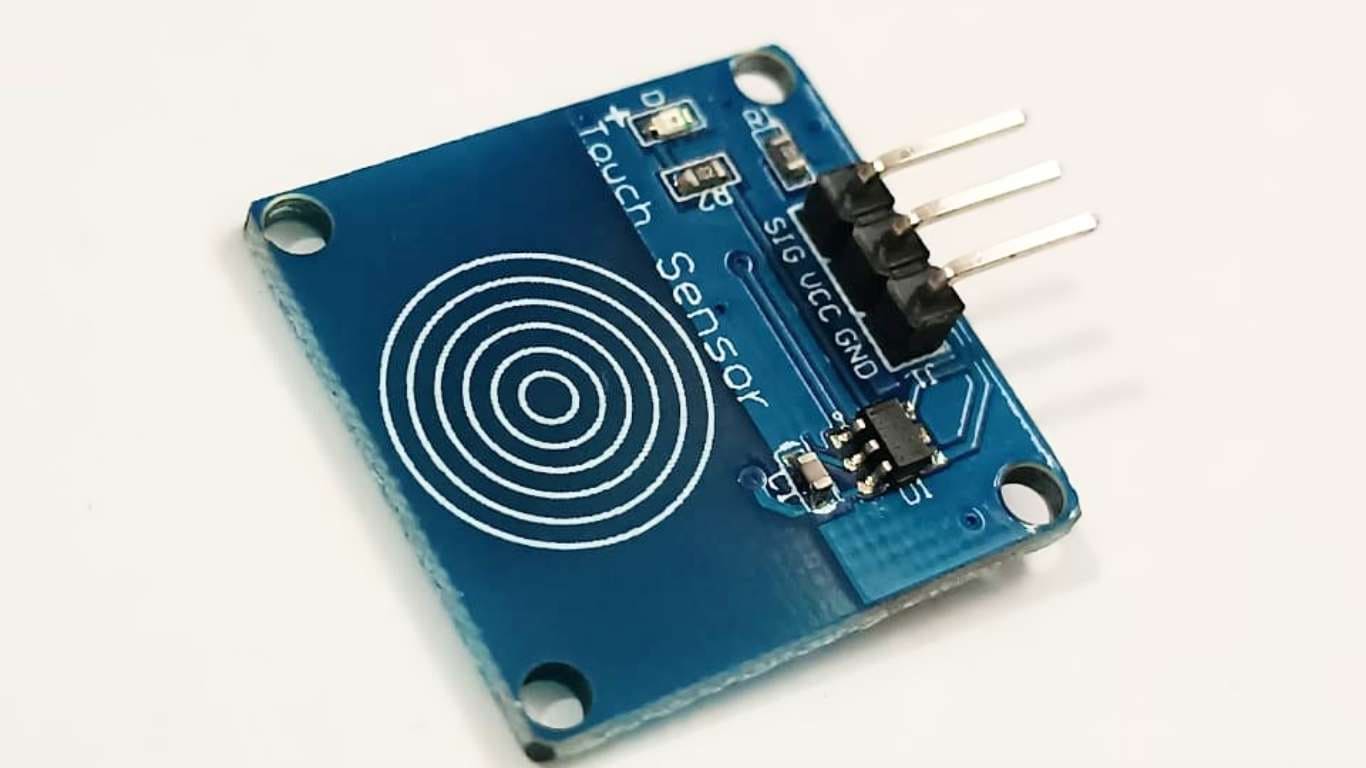
The touch sensor generally has a digital input that responds to two states: activated (when touched) and deactivated (when not touched). This type of sensor provides an efficient solution for interaction in systems without the need for mechanical buttons, offering a fast and precise response to contact.
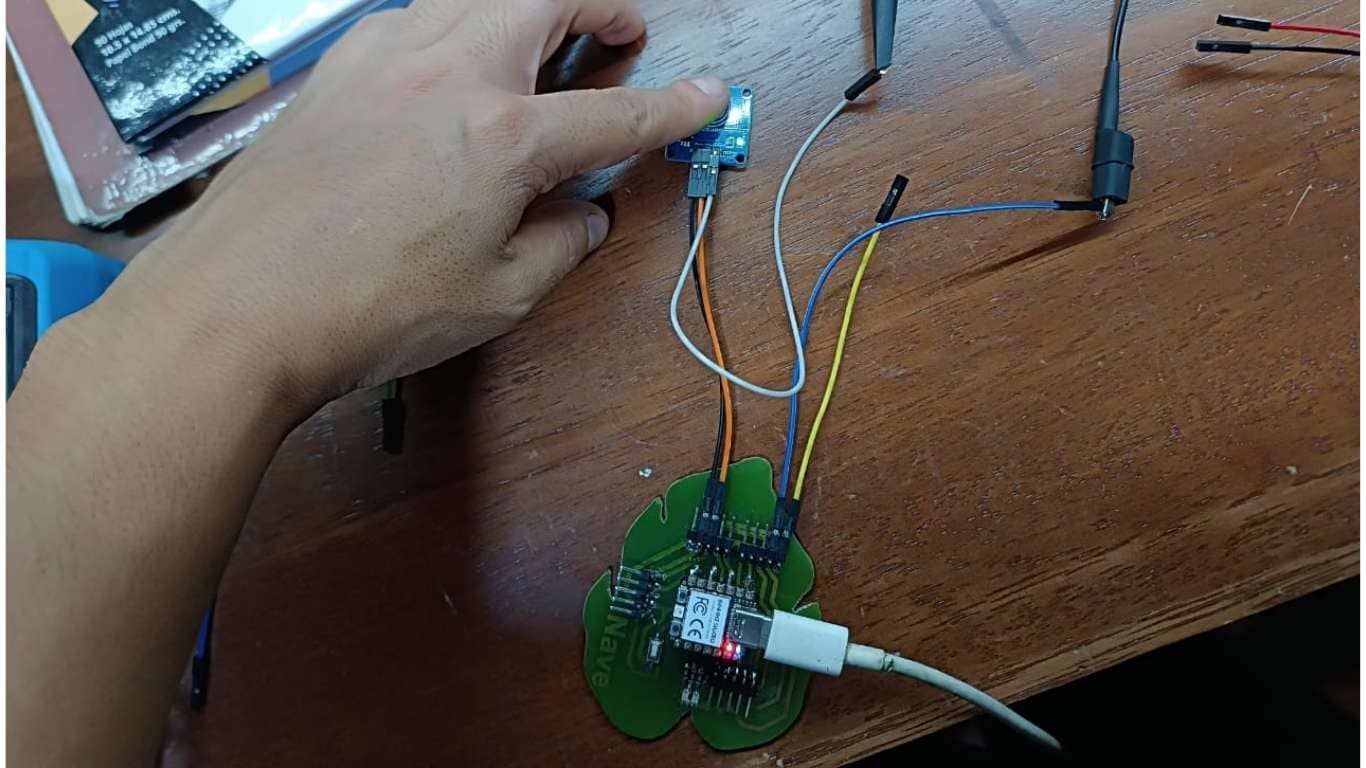
I touched the touch sensor with my hand to see if there was any alteration in the oscilloscope signal.
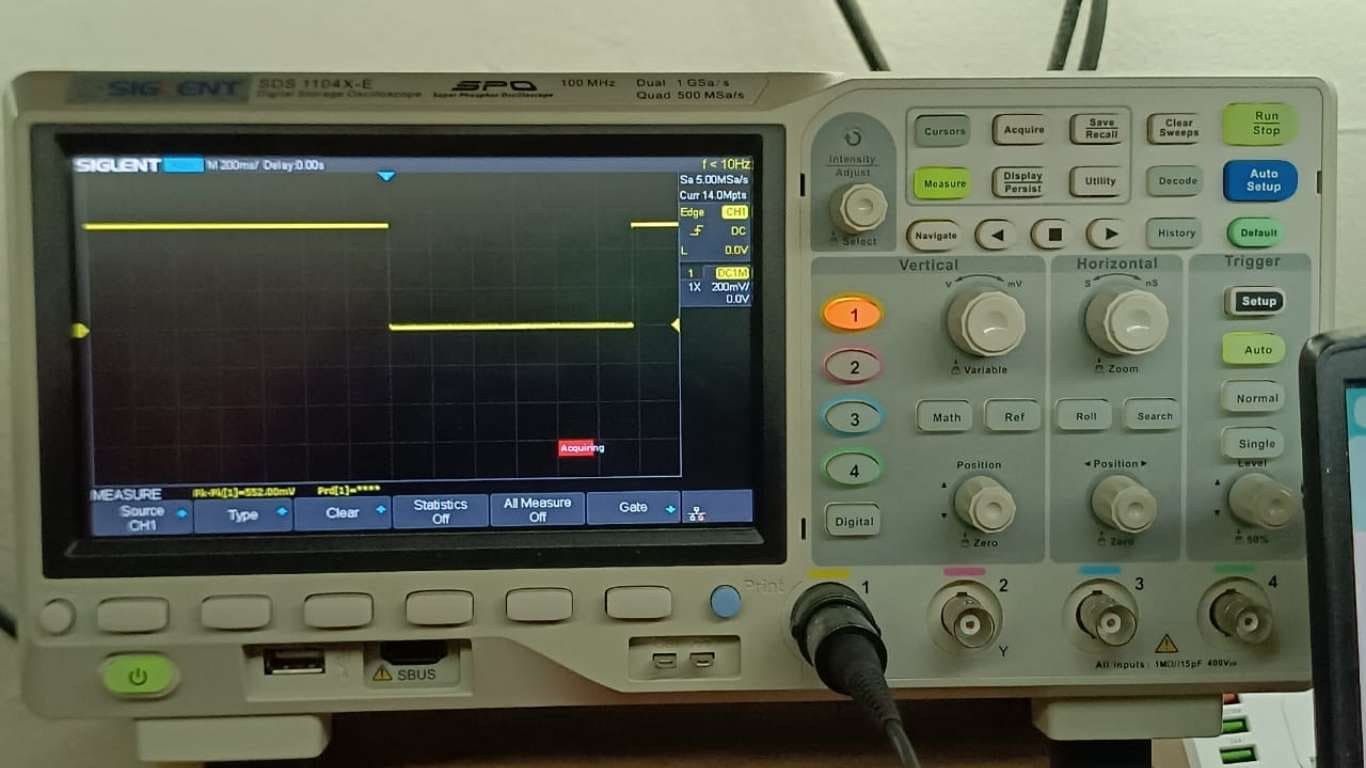
I touched the touch sensor with my hand to see if there was any alteration in the oscilloscope signal. The signal emitted by the sensor is digital, meaning the output fluctuates between two discrete values: high (HIGH) and low (LOW). On the oscilloscope, it can be clearly observed that the signal changes level (from 0 to 1) when the sensor is touched, indicating that the sensor is effectively registering the touch. This digital output is suitable for triggering or deactivating devices, such as switches, in electronic systems. The signal is stable and remains in one of these two states until a new touch is detected.
In the photograph, it can be observed that the touch sensor is not being touched at this moment.
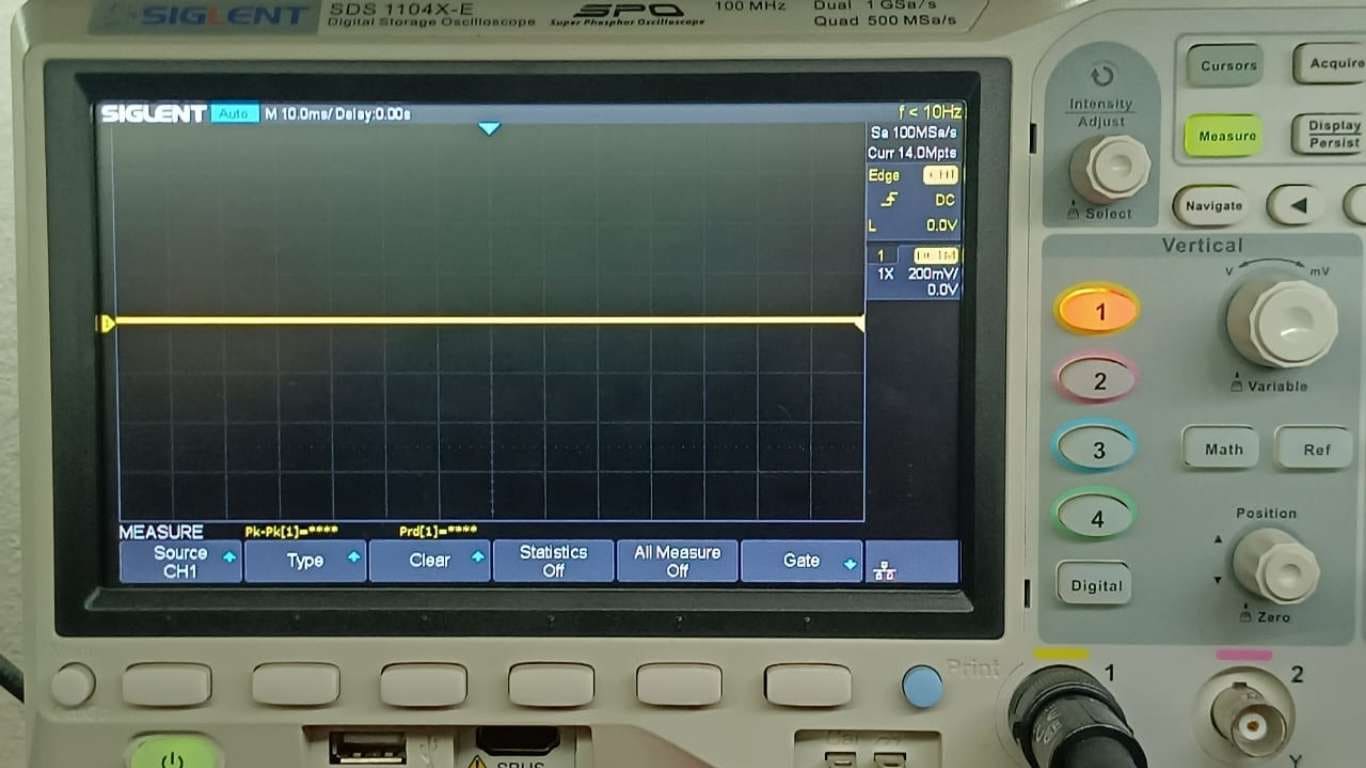
The oscilloscope signal remains at a constant value, indicating that the sensor stays in its low (LOW) state, meaning no alteration in the electric field is detected due to the absence of contact. This behavior is typical of digital touch sensors, where the output remains stable until an action, such as a touch, is detected.
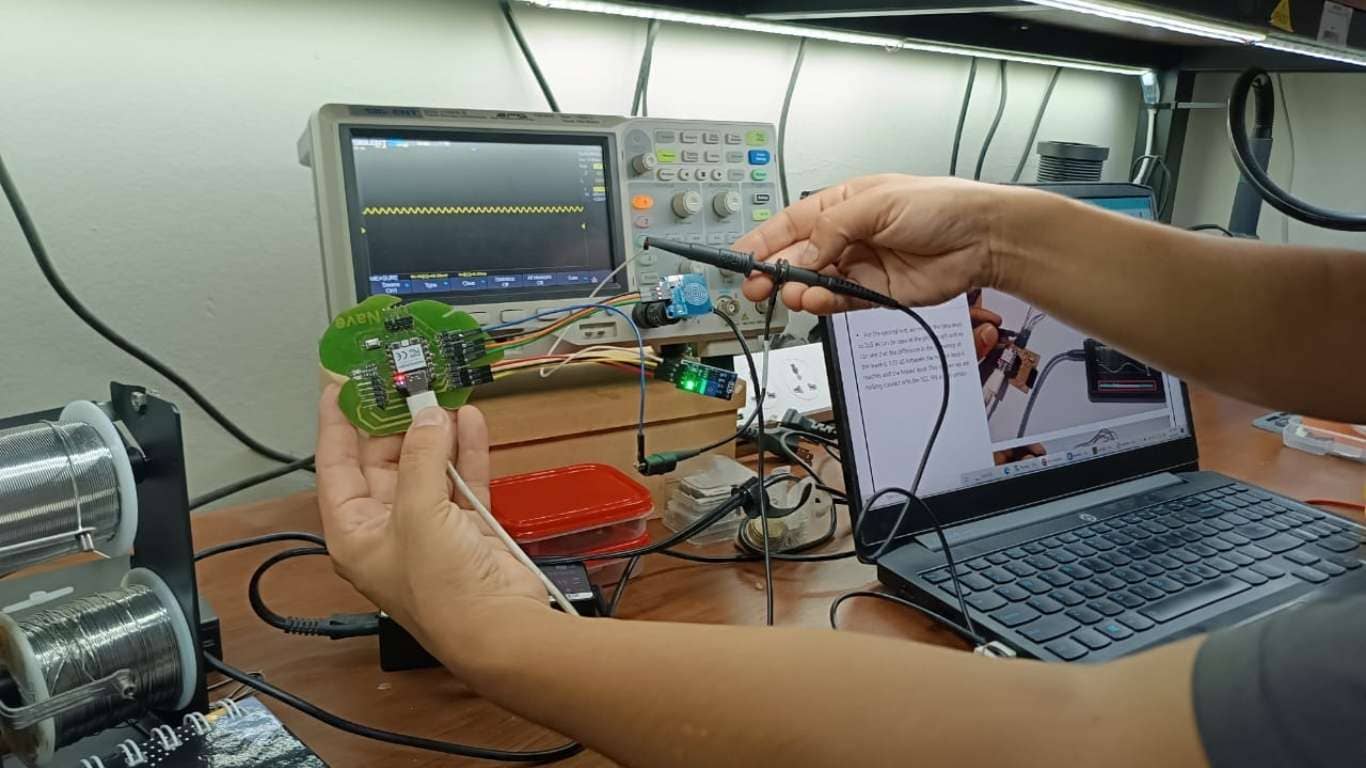
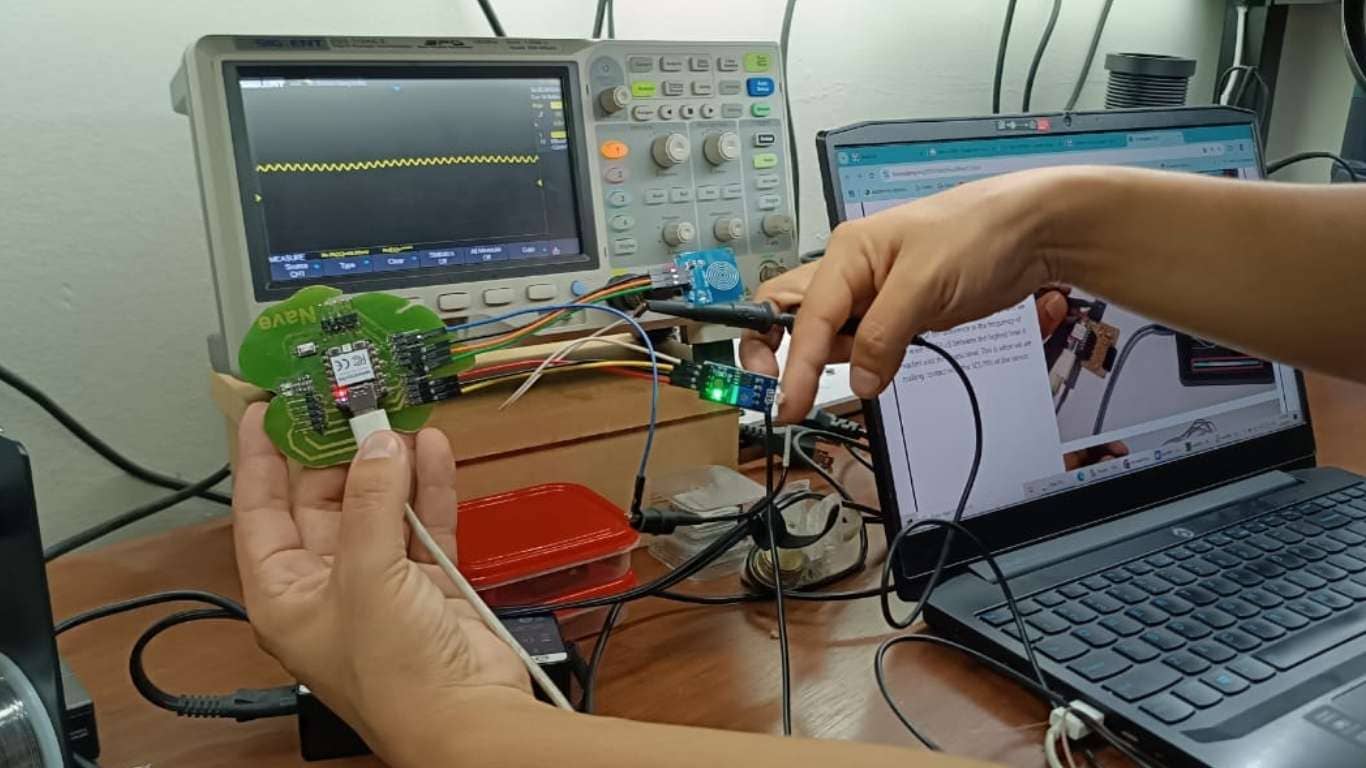
As part of the group assignment for this week, each participant tested a different input device using their custom board. The image and video below show the group testing of the MQ-3 gas sensor, specifically observing the behavior of its analog output (A0). The signal was visualized using an oscilloscope, allowing the team to monitor voltage variations in real time as the sensor responded to changes in gas concentration.
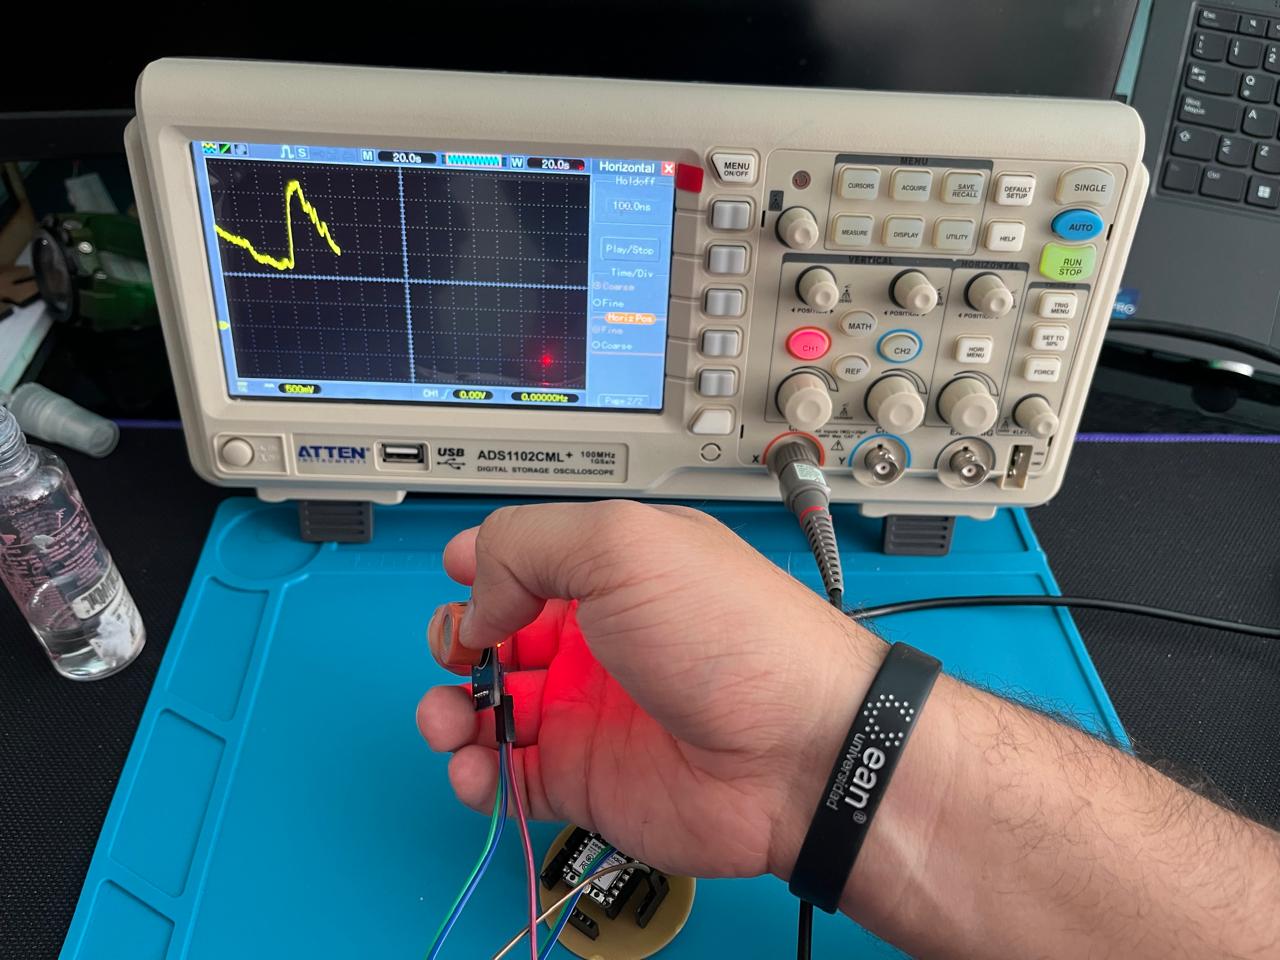
Group observation of the analog signal generated by the MQ-3 sensor during testing.
Oscilloscope recording showing the analog voltage response of the MQ-3 sensor.
Oscilloscope recording showing the analog voltage response of the MQ-3 sensor with different trigger.
I tested a digital touch sensor using my ESP32-C3-based board. The team also observed the digital output signal generated by the sensor. In this test, the oscilloscope shows a clear transition from a LOW level (0) to a HIGH level (1) when the sensor is touched, confirming the expected behavior of a digital capacitive interface.
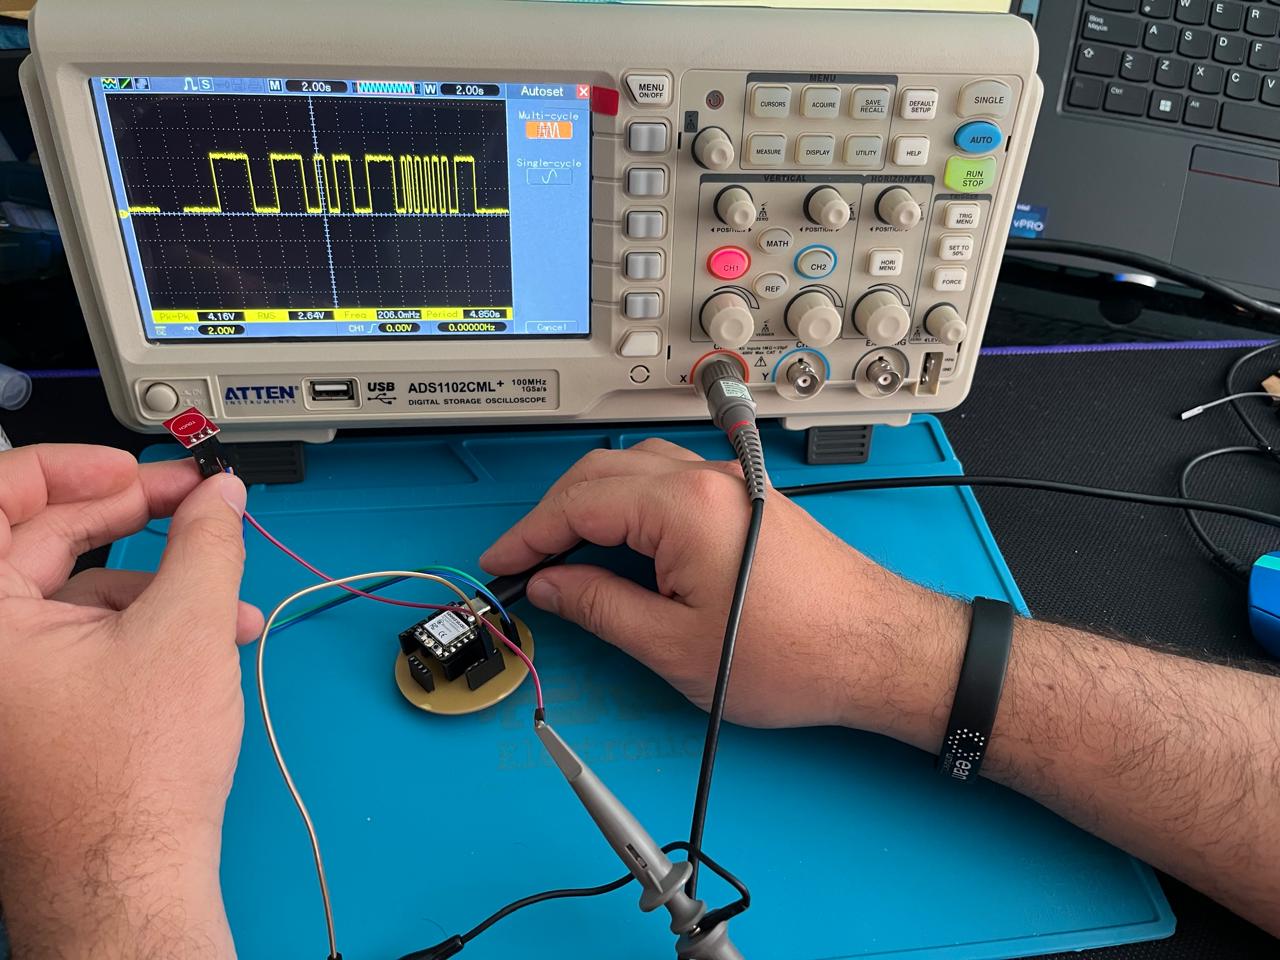
Oscilloscope capture showing a transition from LOW to HIGH on the digital output of the capacitive sensor.
Video showing the digital signal change when the touch sensor is activated.
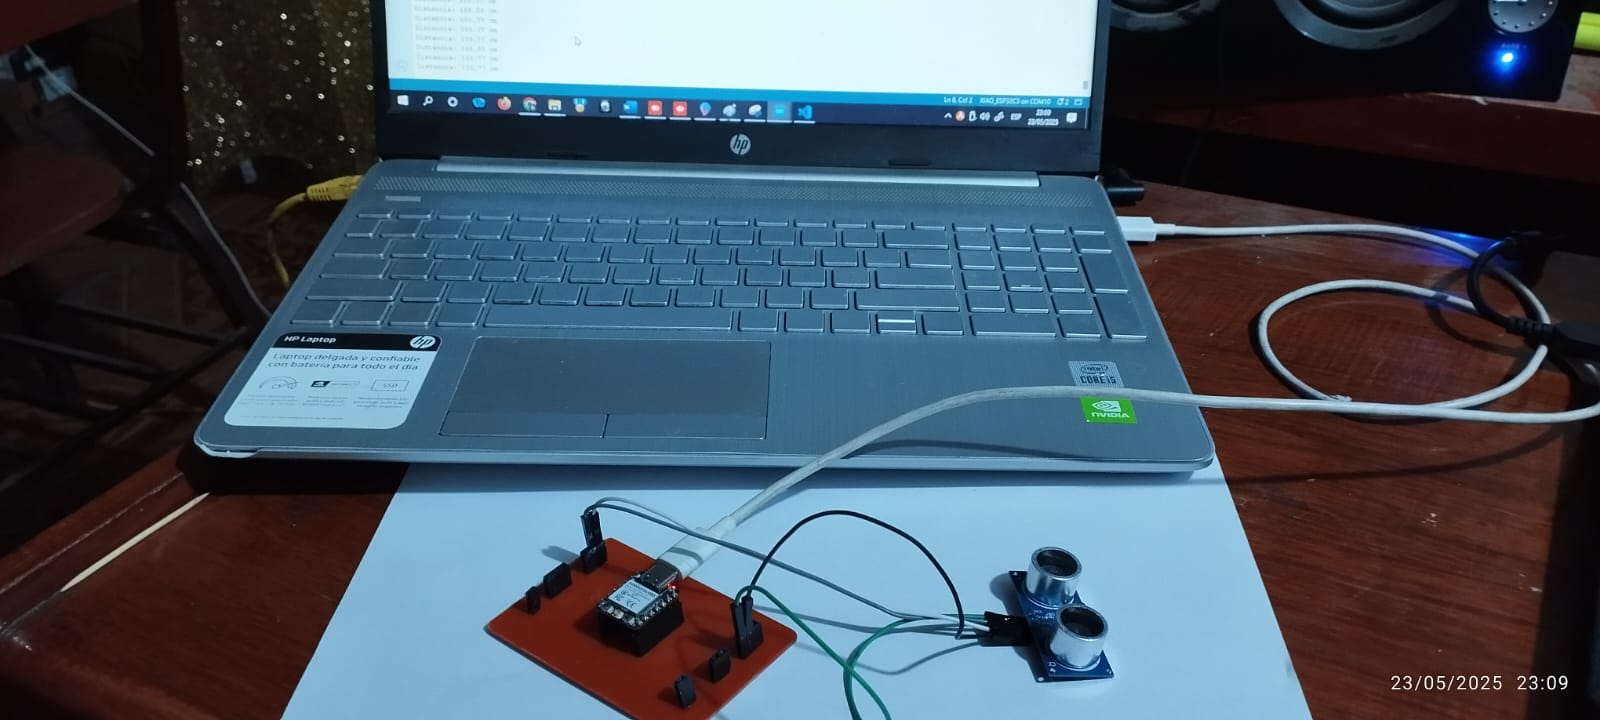
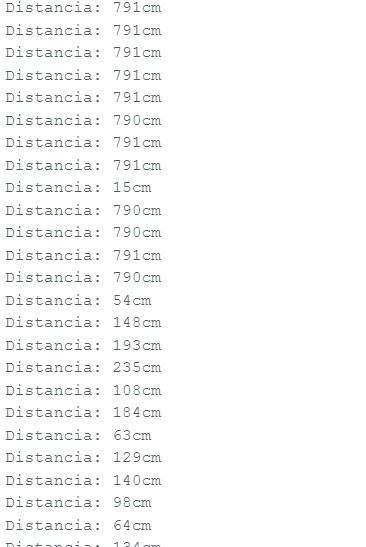
To develop this task, we used the Serial Plotter in the Arduino IDE to visualize the distance measurements obtained by the HC-SR04 ultrasonic sensor connected to the ESP32-C3 XIAO. The plotter allowed us to observe in real time how the distance values changed as objects moved closer to or further away from the sensor. This graphical tool helped us verify the sensor's correct operation and facilitated the analysis of system behavior.
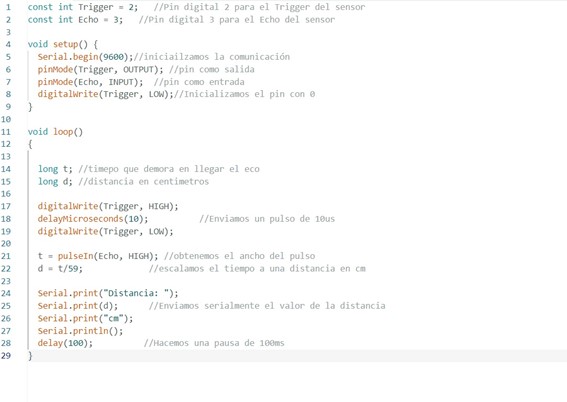
The ultrasonic sensor was connected to the pins used, for example: GPIO3 for Trig and GPIO2 for Echo of the ESP32-C3 XIAO. The implemented code sends an ultrasonic pulse and measures the time it takes to receive the echo, thus calculating the distance to the detected object. The calculated distance values are continuously transmitted to the Serial Monitor using Serial.println().
Below we will describe the HC-SR04 ultrasonic sensor.
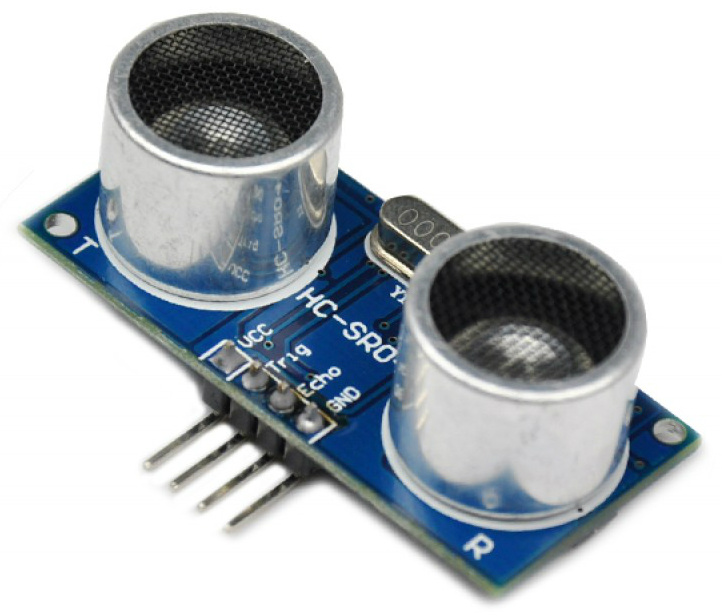
An ultrasonic sensor is a device that measures distances using high-frequency sound waves (ultrasound), which are imperceptible to the human ear. The most common is the HC-SR04.
A sound is said to be ultrasonic when its wave has a frequency that is above the spectrum audible to the human ear, generally above twenty thousand hertz.
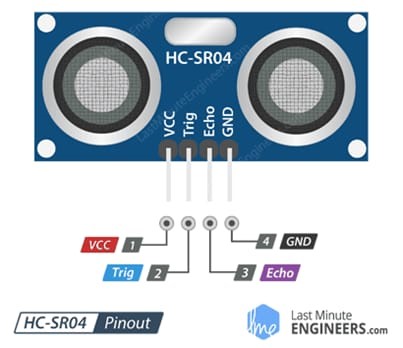
| Part | Function |
|---|---|
| Trig | Input pin (sends the pulse) |
| Echo | Output pin (receives the echo) |
| VCC | Power supply (5V) |
| GND | Ground |
Distance = (Time × Speed of sound (343 m/s)) / 2
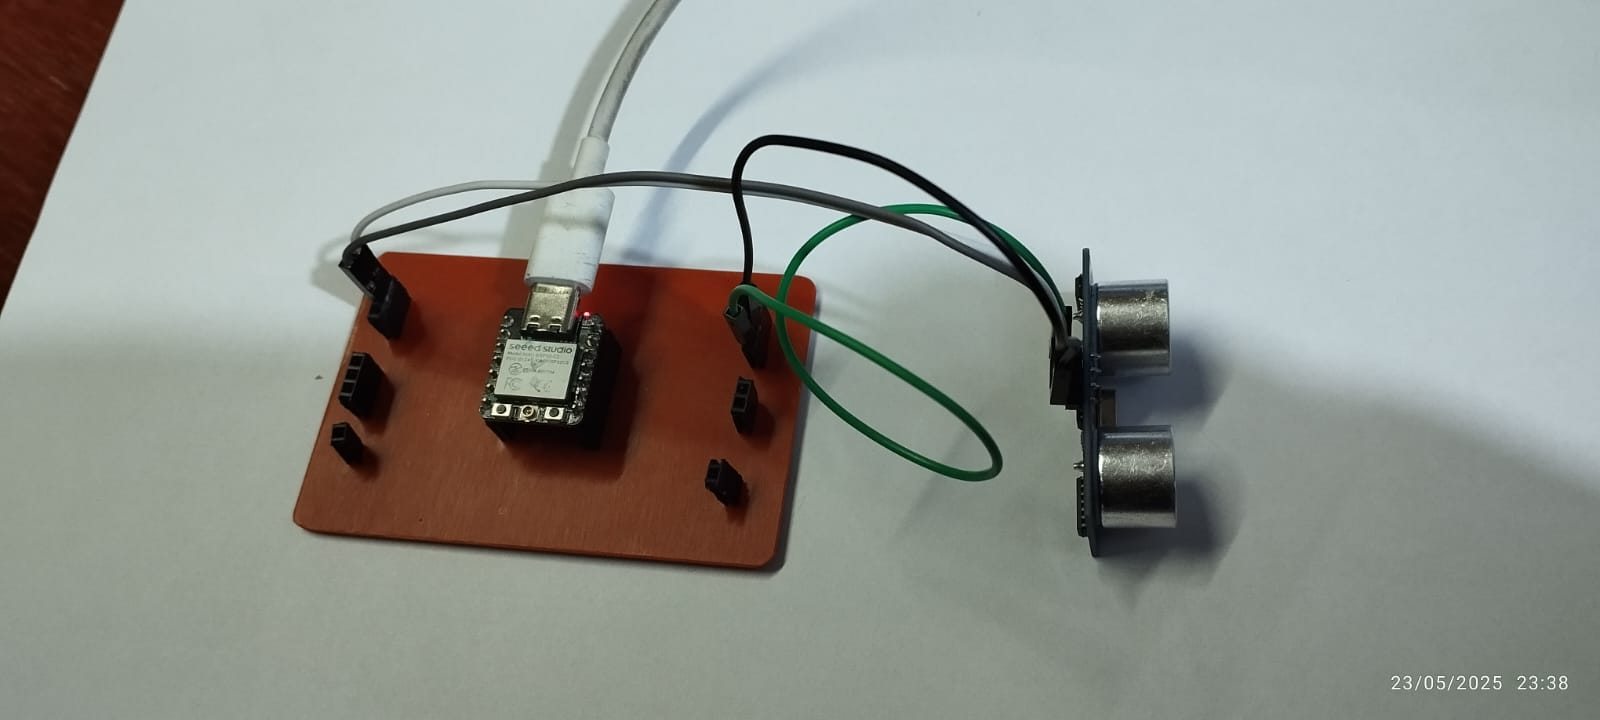
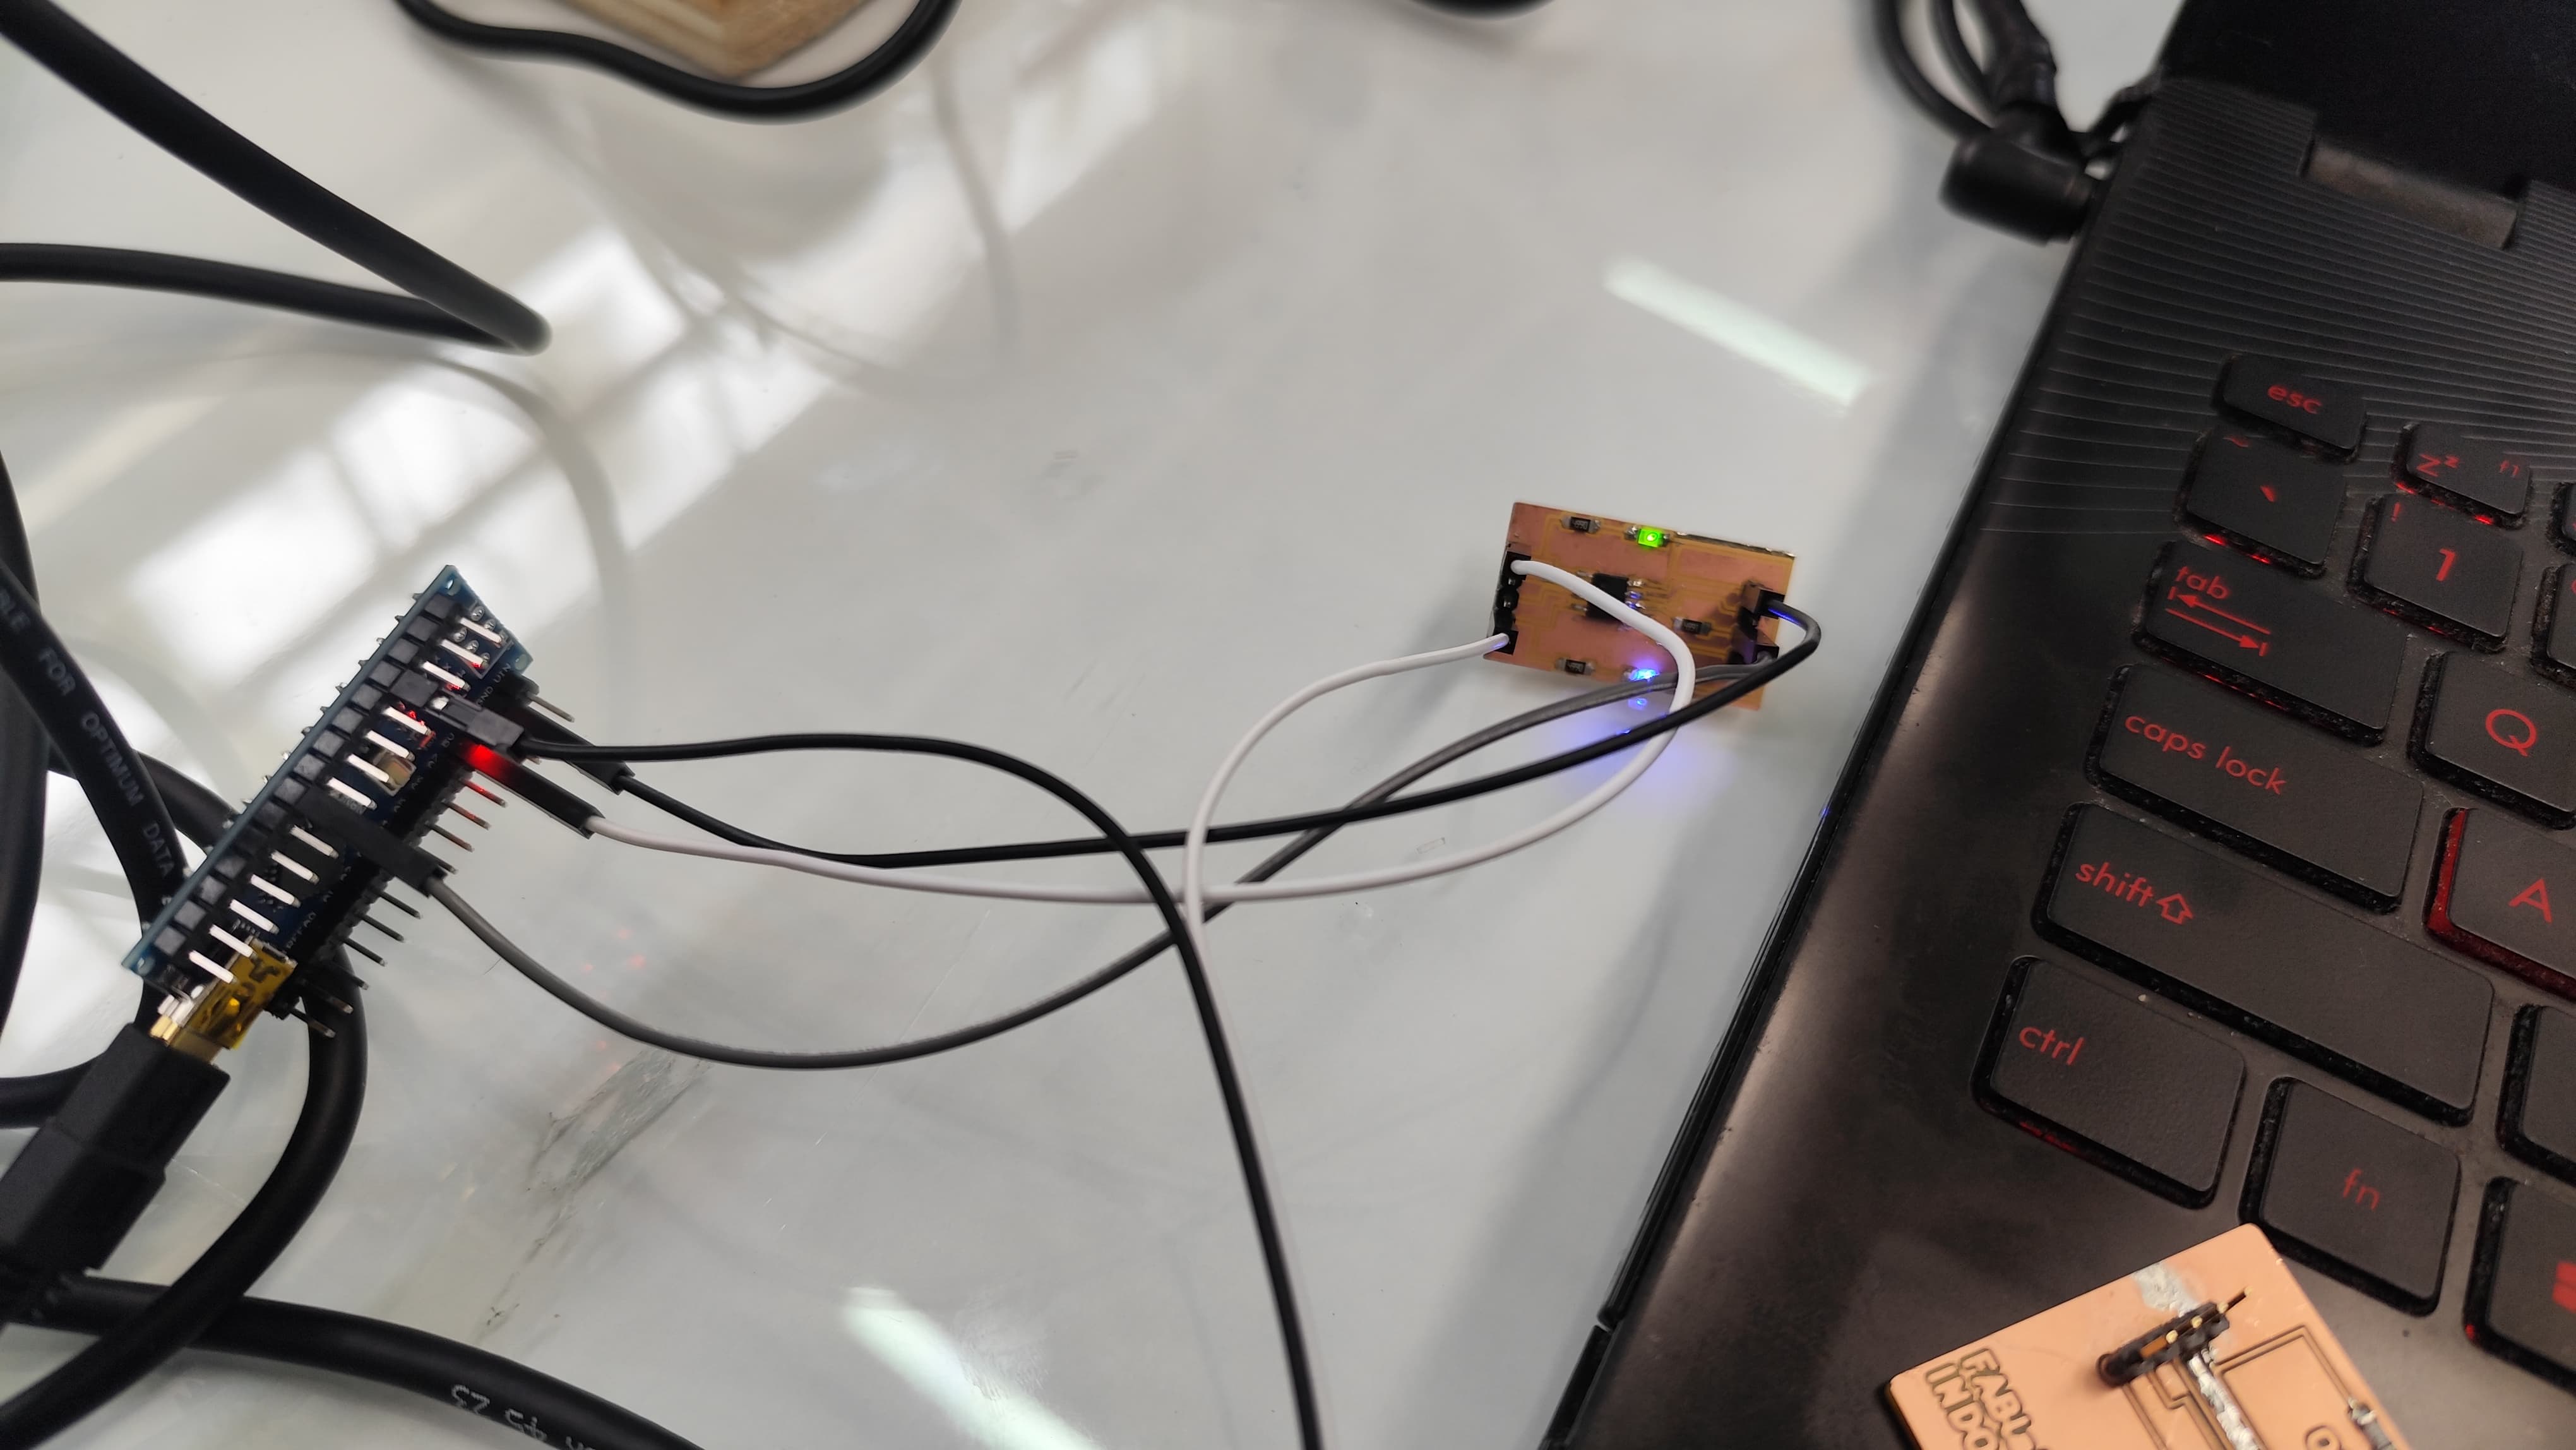
To measure values, in this case distance, the first thing is to assemble our circuit, according to the connections.
The HC-SR04 ultrasonic sensor uses two pins to communicate with the microcontroller:
This video shows the operation of the HC-SR04 ultrasonic sensor connected to the ESP32-C3 XIAO board. Using the Serial Plotter in the Arduino environment, the distance measurements are displayed in real time. The vertical axis shows the measured distance, in our case 160 cm, which varies depending on the approach or distance from the object, allowing the correct behavior of the system to be verified
Group assignment: Probe an input device’s analog levels and digital signals, document the work, and write a personal reflection on the individual page.
Team: Manuel Ayala-Chauvin, Sandra Nuñez-Torres
Institution: Fablab - Universidad Tecnológica Indoamérica
Year: 2025
We used the HCSR04 ultrasonic sensor connected to an Arduino Uno board as follows:
The following Arduino code measures distance using the sensor and prints the results to the serial monitor:
			#define TRIG_PIN 9
			#define ECHO_PIN 10


			void setup() {
			  Serial.begin(9600);
			  pinMode(TRIG_PIN, OUTPUT);
			  pinMode(ECHO_PIN, INPUT);
			}


			void loop() {
			  digitalWrite(TRIG_PIN, LOW);
			  delayMicroseconds(2);
			  digitalWrite(TRIG_PIN, HIGH);
			  delayMicroseconds(10);
			  digitalWrite(TRIG_PIN, LOW);


			  long duration = pulseIn(ECHO_PIN, HIGH);
			  float distance = duration * 0.034 / 2;


			  Serial.print("Distance: ");
			  Serial.print(distance);
			  Serial.println(" cm");
			  delay(500);
			}
We placed different objects at various distances in front of the sensor and recorded the measurements. The readings were consistent, with minimal error at short distances.
We connected the ECHO pin to the oscilloscope to observe the digital signals generated by the sensor. This allowed us to analyze the pulses produced for each measurement.
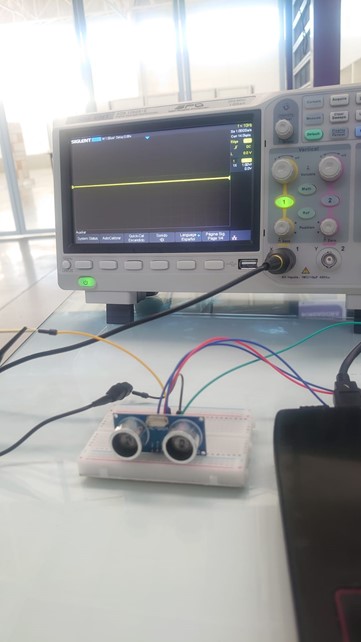
We recorded a short video showing the full setup and real-time signal output:
This assignment helped us understand how sensors convert physical phenomena into digital data and how to visualize these signals using an oscilloscope. Team collaboration was key to sharing ideas, troubleshooting, and completing the project effectively.
I gained a better understanding of how to capture and interpret digital signals and how sensor data can be processed in physical computing projects. I also learned the importance of sensor response time in accurate measurements.