
W9 | Input Devices
📝 Group Assignment:
- Probe an input device(s)'s analog levels and digital signals (As a minimum, you should demonstrate the use of a multimeter and an oscilloscope.)
- Document your work on the group work page and reflect on your individual page what you learned.
What We Did
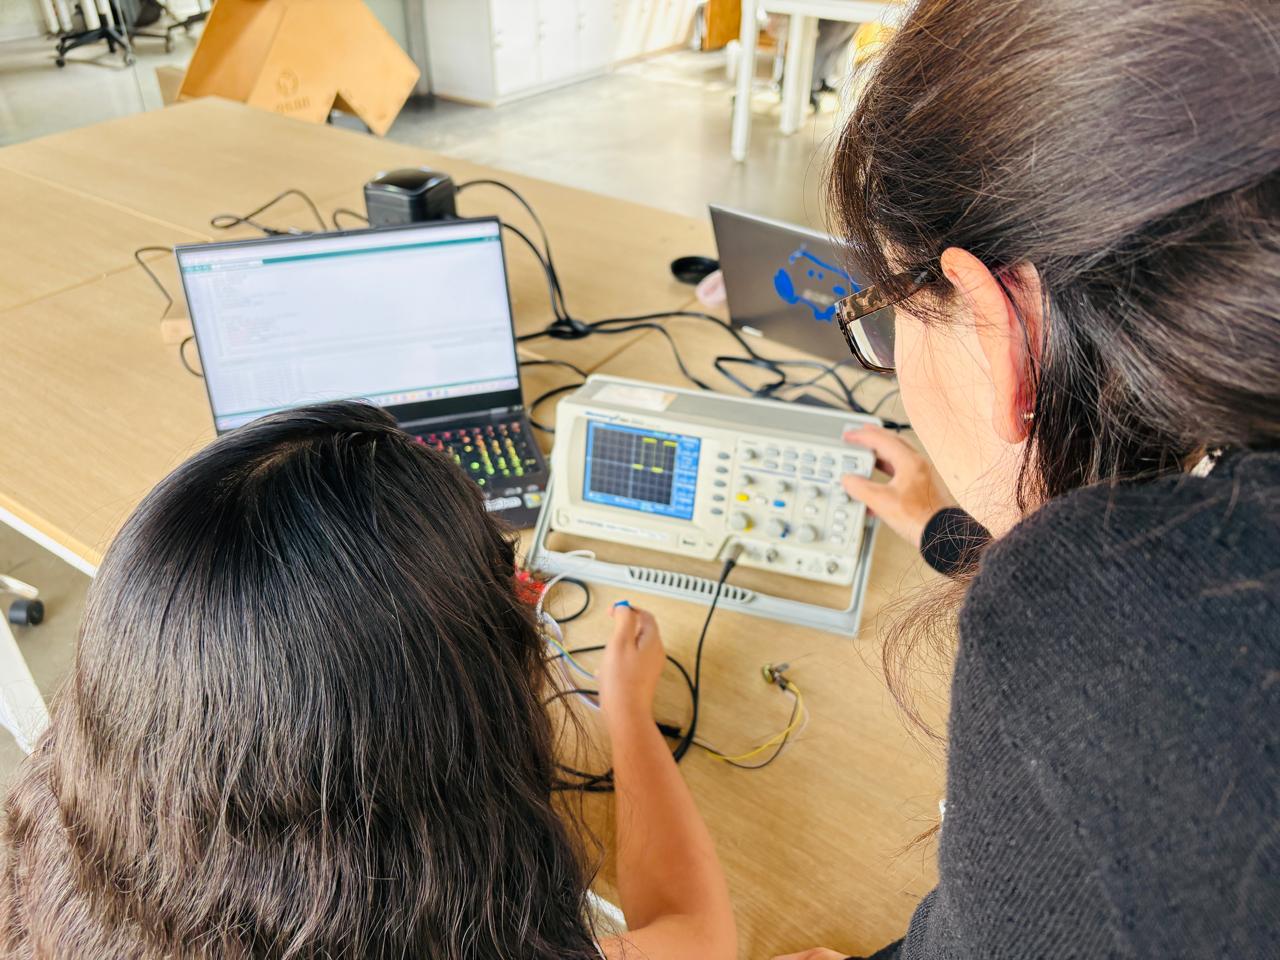
For this group assignment, we used a digital storage oscilloscope to observe and analyze the signals generated by a custom PCB called ESAN XIAO, a board made by Jorge, based on the XIAO RP2040 microcontroller. We tested two types of signals — a digital signal from a push button and an analog signal from a potentiometer. The goal was to understand what these signals look like in real conditions and how to read them using the oscilloscope.
The Equipment
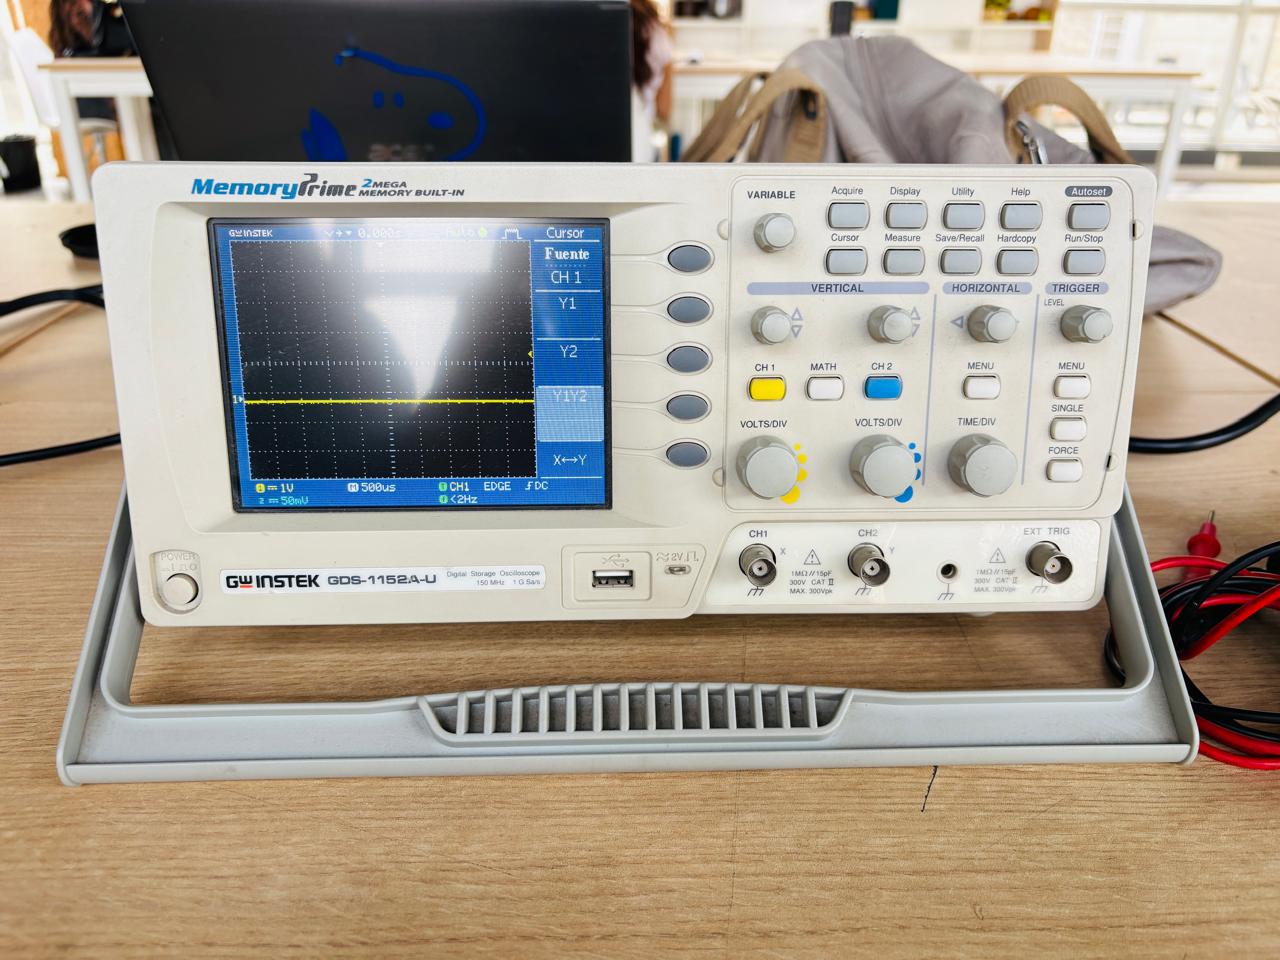
The oscilloscope we used was the GW Instek GDS-1152A-U, a digital storage oscilloscope available in our lab. An oscilloscope is a tool that lets you see electrical signals on a screen — instead of just reading a number like a multimeter would, you can actually see the shape of the signal over time, which makes it much easier to understand what a circuit is doing. The "digital storage" part means it can capture and hold a signal on screen, which is very useful when you want to analyze it carefully.
| Feature | Value |
|---|---|
| Bandwidth | 150 MHz |
| Sampling rate | 1 GSa/s |
| Channels | 2 |
| Memory | 2 Mega points built-in |
These specs define what kind of signals the oscilloscope can measure. The bandwidth tells you how fast a signal can change and still be captured correctly — 150 MHz is more than enough for the signals we worked with. The sampling rate is how many times per second the oscilloscope takes a snapshot of the signal — 1 GSa/s means 1 billion snapshots per second, which gives a very accurate picture of the signal shape. The 2 channels mean we could measure two signals at the same time if needed. And the memory determines how much signal data it can store for analysis.
The screen is divided into a grid of squares called divisions, and two main controls define what you see:
Vertical axis (VOLTS/DIV)
Each square represents a set number of volts. Adjusting this makes the signal appear taller or flatter on screen.
Horizontal axis (TIME/DIV)
Each square represents a set amount of time. Adjusting this zooms in or out on the signal, showing more or fewer pulses at once.
Understanding these two controls is the key to reading any signal correctly on an oscilloscope.
The Circuit
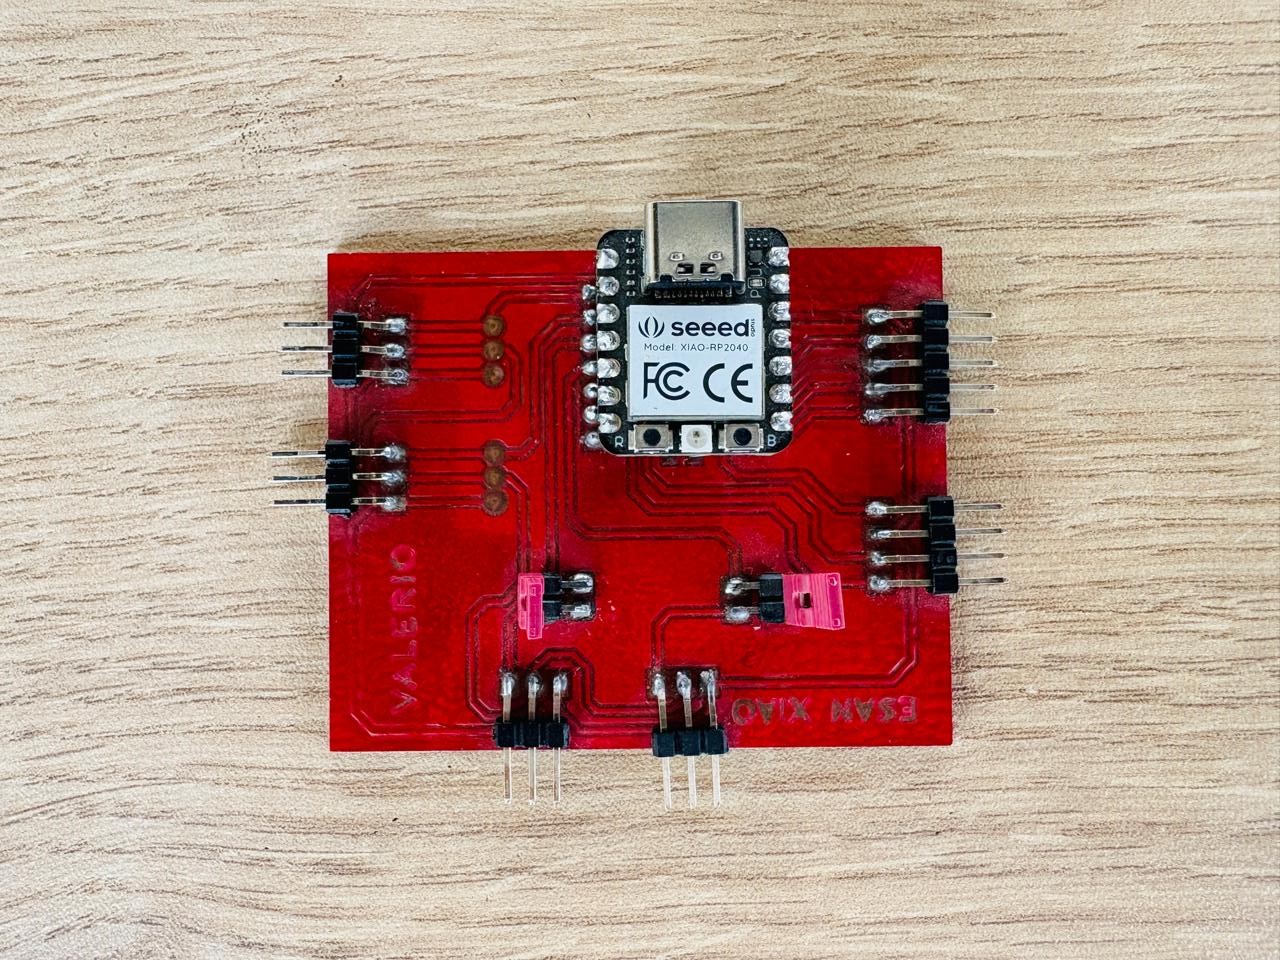
The circuit we tested was a custom-designed red PCB with a XIAO RP2040 microcontroller soldered onto it. The board exposes all pins through headers, making it easy to connect external components and test equipment.
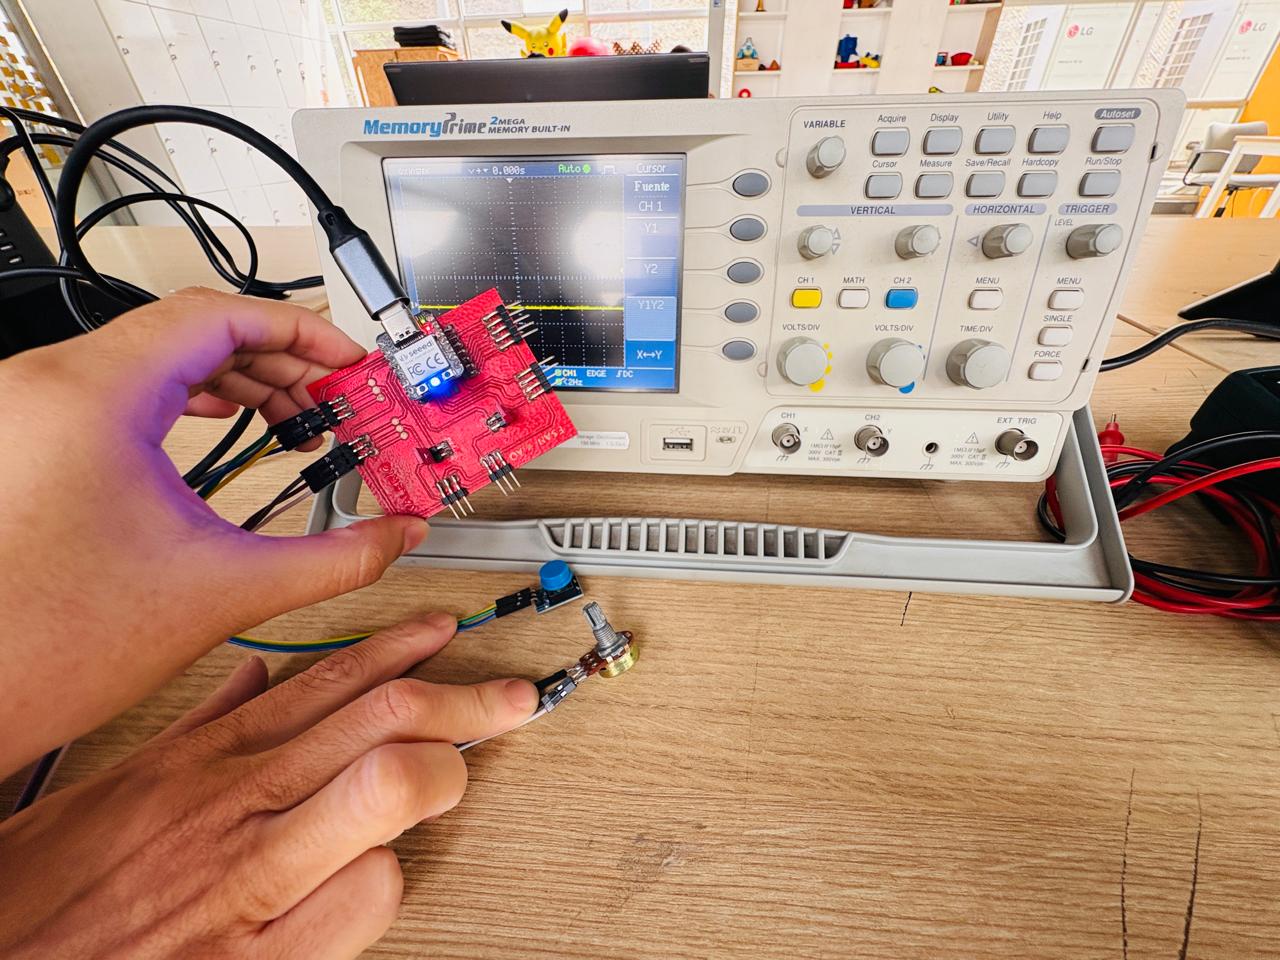
For the tests we connected two components:
🖰 D0— a push button (digital input)🖰 A1— a potentiometer (analog input)
💻 The Code
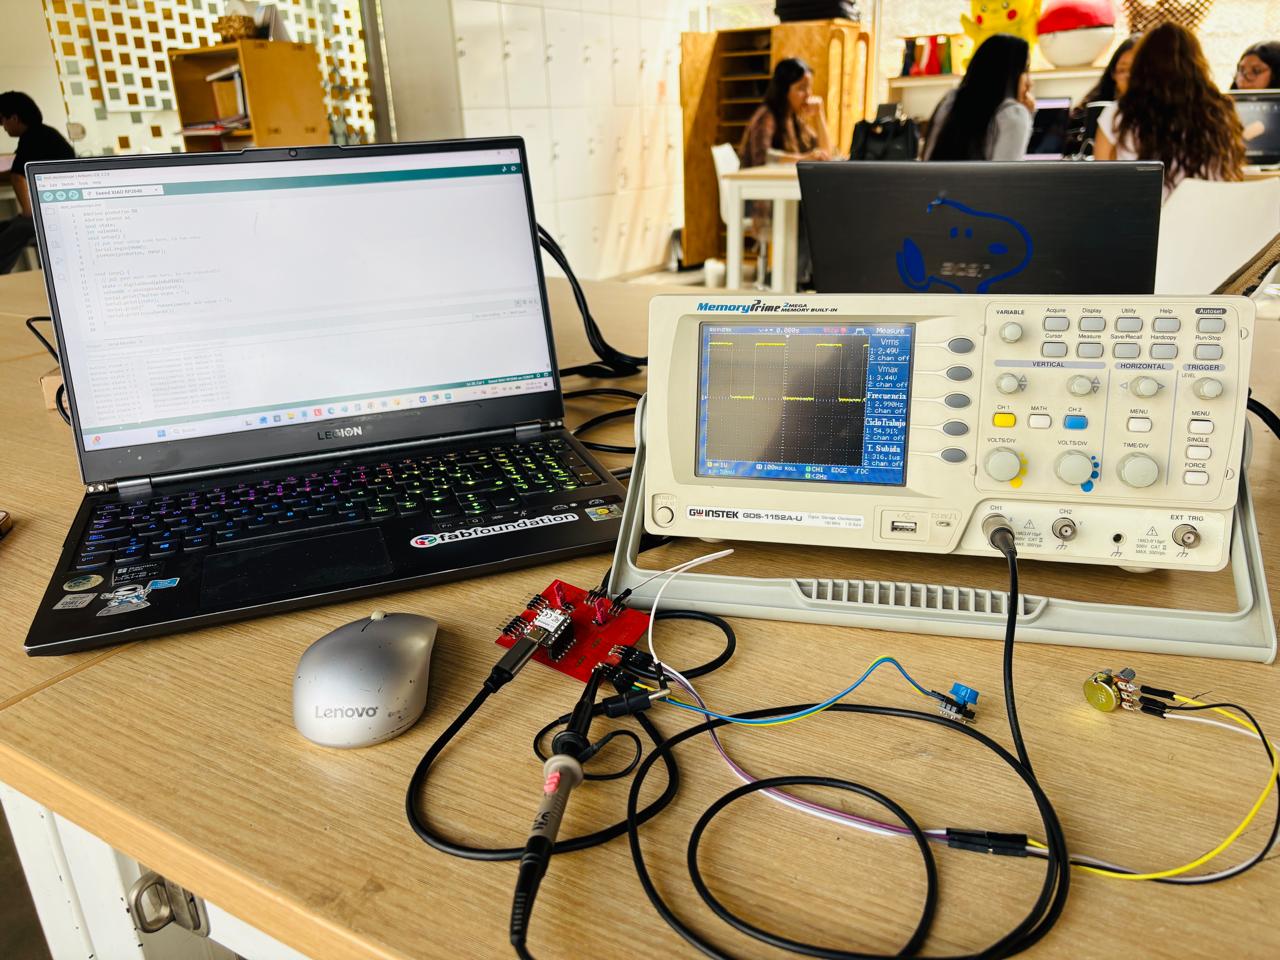
The following program was running on the XIAO RP2040 during the measurements. It reads both components continuously and prints their values to the Serial Monitor:
#define pinButton D0
#define pinPot A1

bool state;
int valueADC;

void setup() {
  Serial.begin(9600);
  pinMode(pinButton, INPUT);
}

void loop() {
  state = digitalRead(pinButton);
  valueADC = analogRead(pinPot);
  Serial.print("Button state = ");
  Serial.print(state);
  Serial.print("     Potentiometer ADC value = ");
  Serial.println(valueADC);
}
How We Used the Oscilloscope
Before taking any measurements, we had to learn how to connect the oscilloscope correctly and how to set it up to display the signal. This process was new for all of us, so we went step by step.
-
Connecting the probe
The oscilloscope probe has two parts: a signal tip and a ground clip. The signal tip connects to the pin being measured, and the ground clip attaches to the GND of the circuit. This step is always necessary — the oscilloscope measures voltage differences and needs a reference point to compare against. Without the ground connection, the measurement is meaningless.
-
Using Autoset
Once connected, we pressed the🖰 Autosetbutton. This automatically adjusts both VOLTS/DIV and TIME/DIV to display the signal correctly on screen. It was a good starting point, especially when we did not know what the signal would look like.
-
Fine-tuning the scales
After Autoset, we adjusted the scales manually to get a clearer view:- If the signal looked too tall or too flat → adjust VOLTS/DIV
- If the signal looked too compressed or too stretched → adjust TIME/DIV
-
Reading the measurements
The Measure function automatically calculates values like Vmax, Vrms, frequency, duty cycle, and rise time. We did not have to calculate anything manually — the oscilloscope did it for us and displayed the values on the right side of the screen.
Test 1 — Digital Signal: Push Button
The first test was with the push button on pin 🖰 D0. A digital signal has only two possible states — 0 (LOW, 0V) or 1 (HIGH, 3.3V). There is nothing in between. Every time the button was pressed, the signal jumped instantly from 0V to 3.3V, and when released it dropped back to 0V.
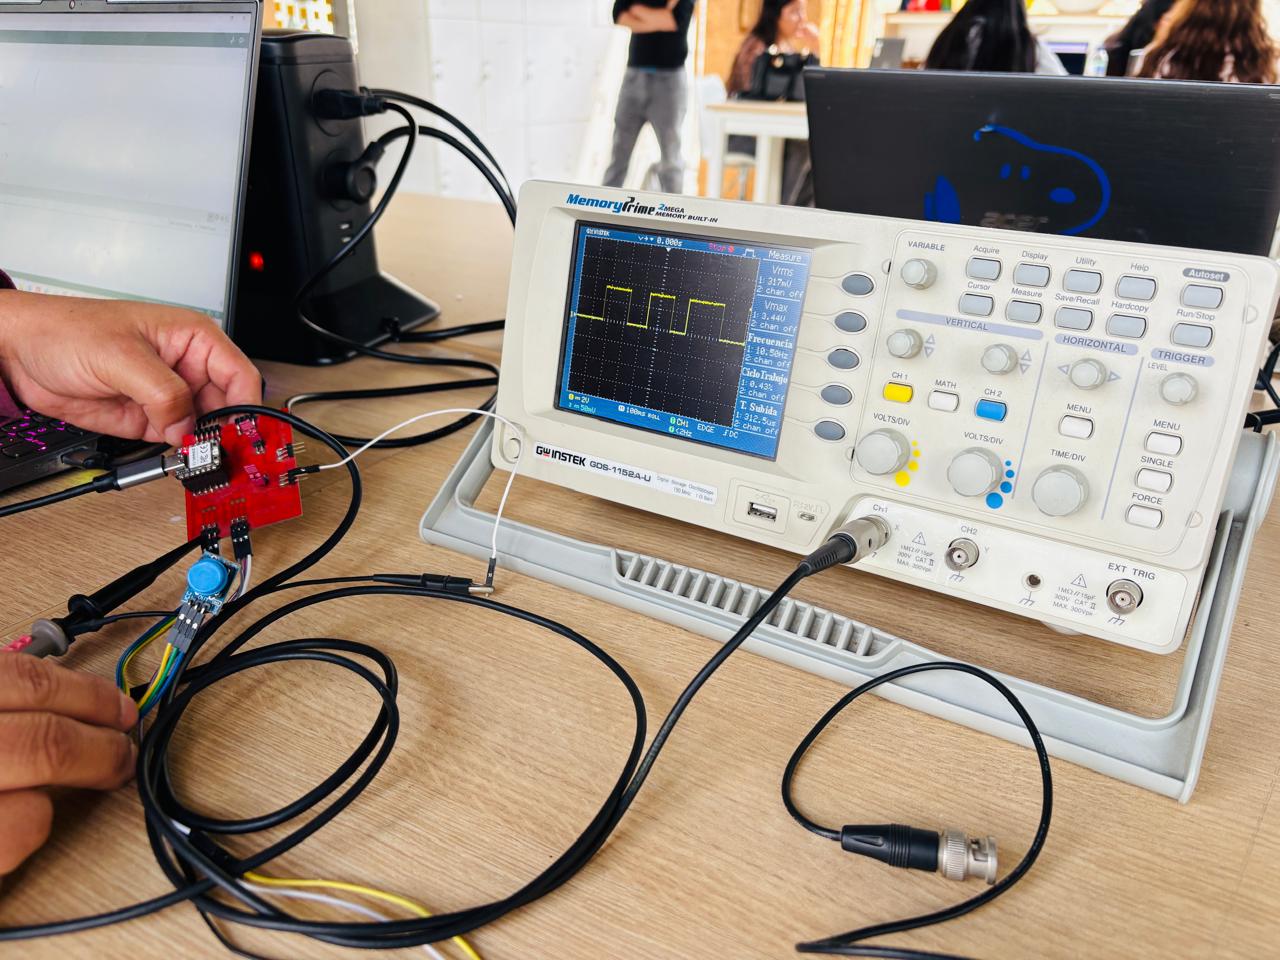
On the oscilloscope screen, this looked like a series of clean square pulses. By adjusting TIME/DIV we could zoom in to see individual presses more clearly, or zoom out to see multiple pulses at once. We also used the trigger function to freeze a specific moment of the signal on screen, which made it easier to analyze.
The automatic measurements gave us the following readings:
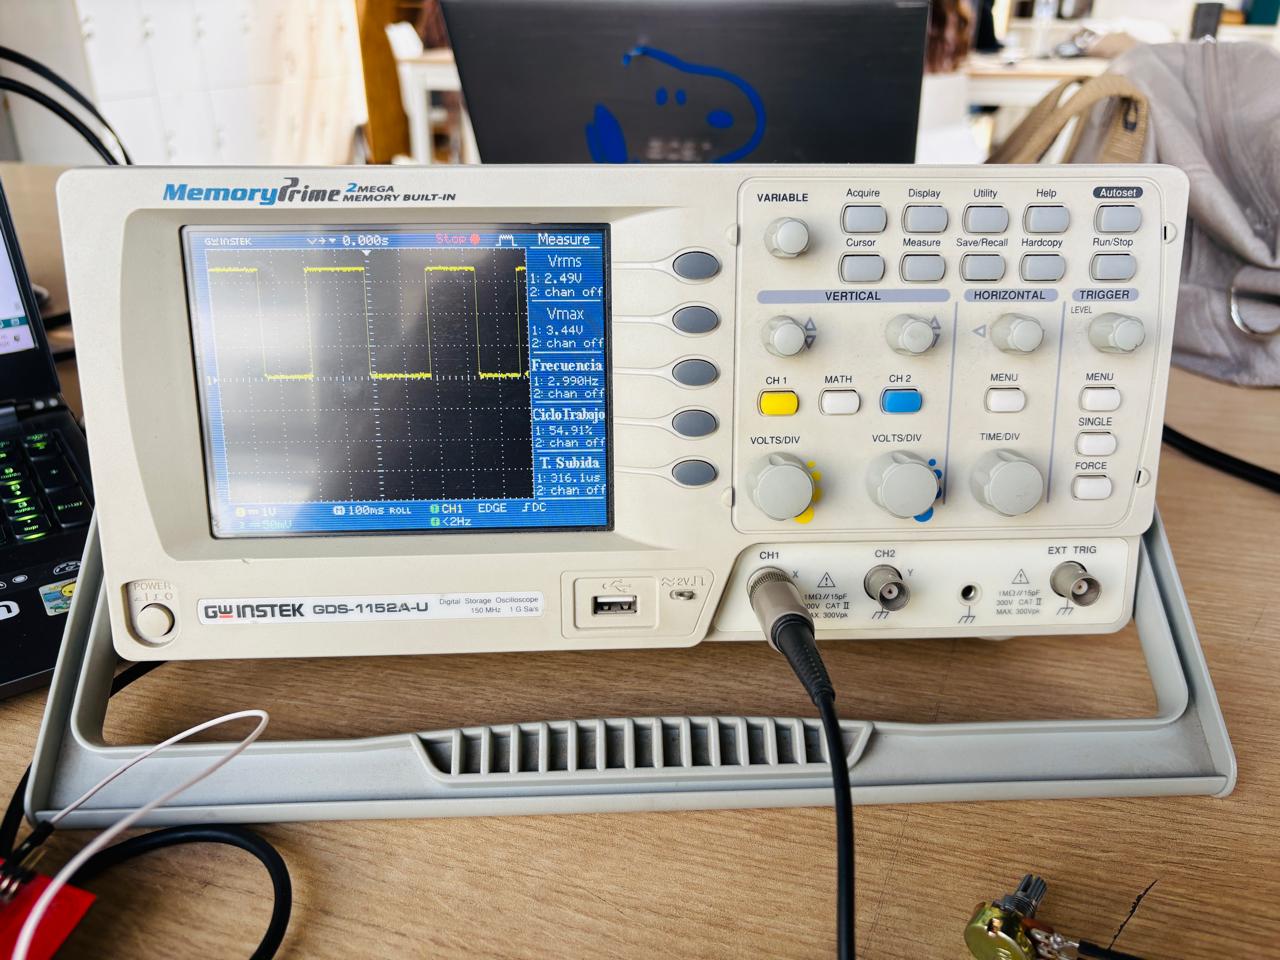
| Measurement | Value | What it means |
|---|---|---|
| Vmax | 3.44V | Peak voltage including small noise spikes |
| Vrms | 2.49V | Effective voltage value |
| Frequency | 2.990 Hz | How often the button was pressed per second |
| Duty cycle | 54.91% | Proportion of time the signal was HIGH vs LOW |
| Rise time | 316.1 µs | How long it took the signal to go from 0V to 3.3V |
Looking at these values, a few things stand out. The Vmax of 3.44V is slightly above 3.3V — that small difference comes from tiny noise spikes in the signal, which is completely normal. The frequency of 2.990 Hz tells us the button was being pressed about 3 times per second. The duty cycle of 54.91% means the signal was HIGH slightly more than half the time — which makes sense since we were holding the button down for roughly equal amounts of time as releasing it. The rise time of 316.1 µs shows that even though a digital signal looks like an instant jump on screen, it actually takes a tiny fraction of a second to transition — something you can only see with an oscilloscope.
Something worth noting is that the XIAO RP2040 operates at 3.3V, unlike the Arduino UNO which operates at 5V. The oscilloscope confirmed this directly — the signal topped out at 3.3V as expected. If we had been using an Arduino UNO, the signal would have reached 5V instead.
Test 2 — Analog Signal: Potentiometer
The second test was with the potentiometer on pin 🖰 A1. Unlike the button, the potentiometer generates a continuously varying signal — it can be any value between 0V and 3.3V depending on how far it is rotated.
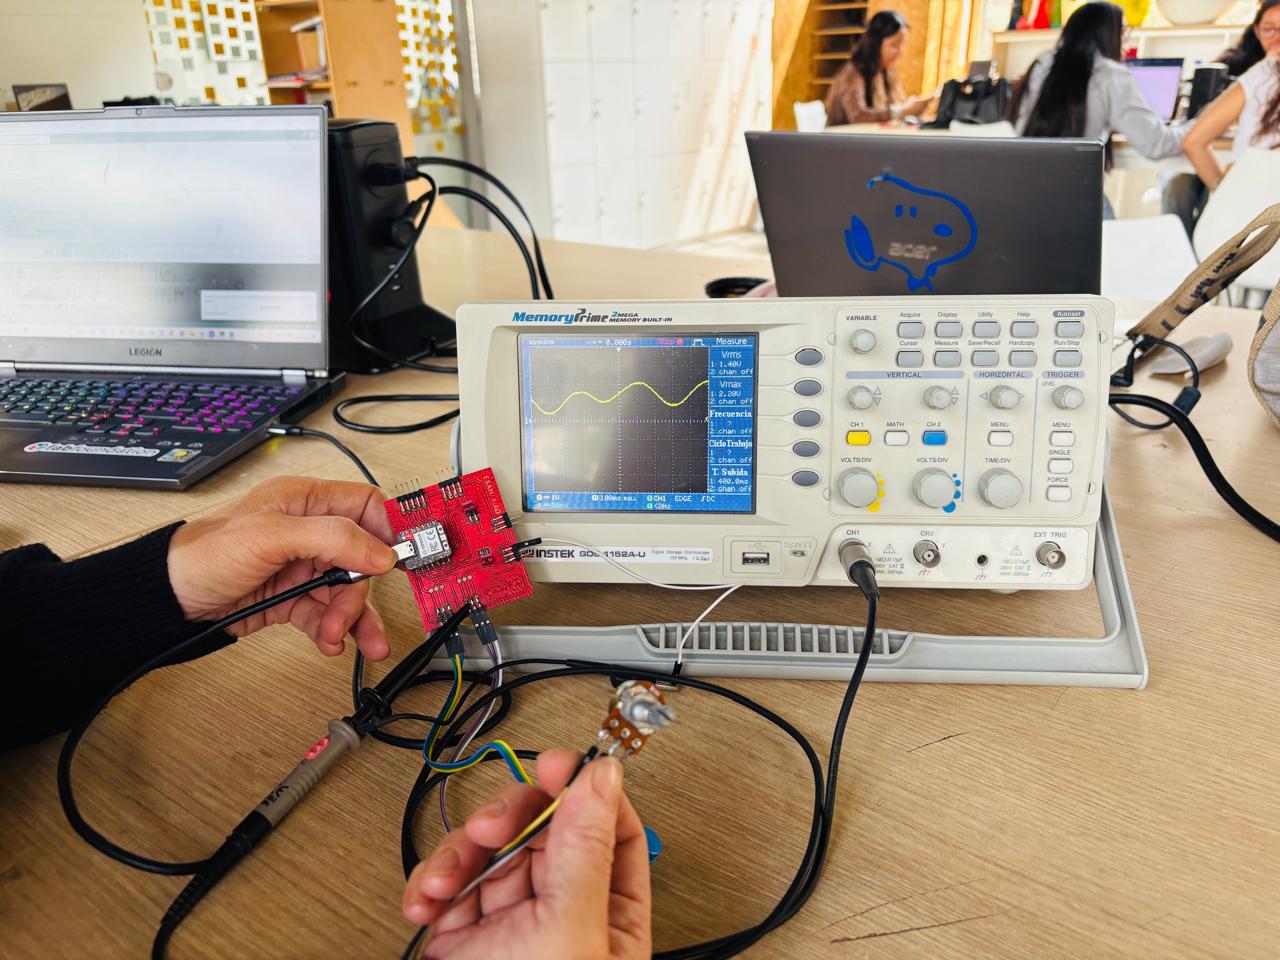
On screen, this looked completely different from the button. Instead of square pulses, we saw a smooth curve that changed as the potentiometer was turned. Rotating slowly produced a gradual wave, and rotating quickly produced a steeper one. The signal never snapped to a fixed value — it always transitioned smoothly, which is exactly what an analog signal is.
The automatic measurements gave us the following readings:
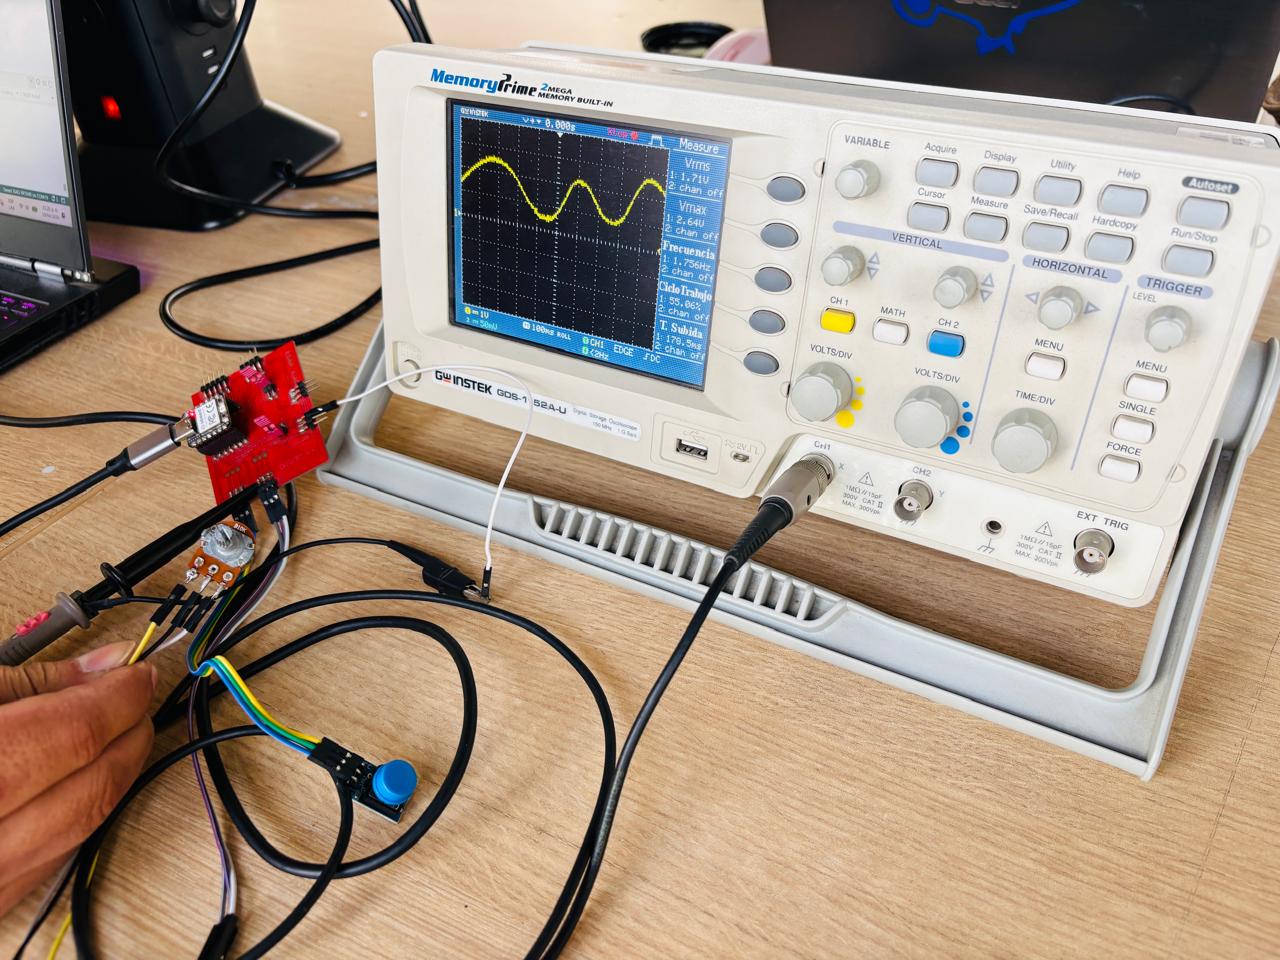
| Measurement | Value | What it means |
|---|---|---|
| Vrms | 1.71V | Effective voltage of the varying signal |
| Vmax | 2.64V | Maximum voltage reached during rotation |
| Frequency | 1.756 Hz | How fast the potentiometer was being rotated |
| Duty cycle | 55.06% | Proportion of time the signal was above the midpoint |
| Rise time | 179.5 ms | How long it took the signal to rise |
These values tell a different story than the button. The Vmax of 2.64V shows that during this measurement the potentiometer was not rotated all the way to its maximum — if it had been, the signal would have reached the full 3.3V. The Vrms of 1.71V reflects the average effective voltage across the entire rotation, which is lower than the peak because the signal was constantly varying. The duty cycle of 55.06% means the signal spent slightly more than half the time above the midpoint voltage, which reflects how the potentiometer was being turned. The frequency of 1.756 Hz simply reflects how fast the potentiometer was being turned back and forth during the test — not a fixed frequency like a digital signal. And the rise time of 179.5 ms is much longer than the button's 316 µs — which makes sense, because an analog signal changes gradually rather than jumping instantly.
Digital vs Analog — What the Oscilloscope Showed
| Digital (Push Button) | Analog (Potentiometer) | |
|---|---|---|
| Signal shape | Square pulses | Smooth curve |
| Values | Only 0V or 3.3V | Anywhere between 0 and 3.3V |
| Behavior | Instant jumps | Gradual variation |
| Pin used | D0 (digital) | A1 (analog) |
| Code function | digitalRead() | analogRead() |
Putting both signals side by side made the differences very clear. The button always produced a clean square shape — the signal either jumped to 3.3V or dropped to 0V, with nothing in between. The potentiometer produced a smooth curve that could land anywhere between those two values depending on how far it was rotated.
This also showed up in the code. For the button we used digitalRead() — a function that only returns 0 or 1. For the potentiometer we used analogRead() — a function that returns a number between 0 and 4095, representing the full range of the analog signal. The oscilloscope made it easy to see exactly why those two different functions exist.
🧠 What I Learned
This assignment helped me understand the difference between digital and analog signals more clearly. Seeing the signals directly on the oscilloscope made it easier to relate what the code does with what is actually happening in the circuit. I also learned how basic oscilloscope controls such as VOLTS/DIV, TIME/DIV, Trigger, and Autoset affect the visualization of the signal and help obtain more stable and readable measurements. Finally, I understood that the oscilloscope is useful not only for measuring signals, but also for debugging and verifying how a circuit behaves in real time.
📝 Individual Assignment:
- Measure something: add a sensor to a microcontroller board that you have designed and read it.
What is an Input Device?
In electronics, an input device is any component that allows a microcontroller to receive information from the physical world. Without input devices, a microcontroller can only execute a fixed set of instructions. Input devices can measure different physical quantities such as temperature, light, distance, pressure, sound, or motion. The microcontroller reads this data, processes it, and uses it to make decisions. The data always flows in one direction: from the physical world into the microcontroller. This is what defines it as an input, in contrast to output devices like LEDs or motors, where the flow is reversed.
Some common examples of input devices include:
- A button — detects when it is pressed
- A temperature sensor — measures ambient temperature
- A distance sensor — measures proximity or range
- An accelerometer — measures acceleration and movement
🔎 In this week's assignment, the input device used is an accelerometer, which will be explained in the following sections.
Why This Board Was Built
My final project is a therapeutic robot designed to interact with children and respond according to their emotional state. One of the emotions it addresses is anger, which is divided into three intensity levels — low, medium, and high — since the response needs to match how the child is feeling at that moment.
To measure this in a physical way, the robot uses a toy accessory that the child interacts with during the session. The idea is simple: when a child is angry, they tend to move or handle objects with greater force. An accelerometer can capture this behavior by measuring the intensity of movement — higher acceleration corresponds to more intense motion.
Based on these readings, the robot can trigger different therapy responses.
This Week's Goal
This week's work focused on adding a sensor to a custom-designed microcontroller board and reading its output. The goal was to verify that the MPU-6050 can reliably detect three levels of movement using the board and translate them into a clear visual output through an RGB LED — green, blue, or red — before integrating this logic into the full robot.
Board Design and Fabrication
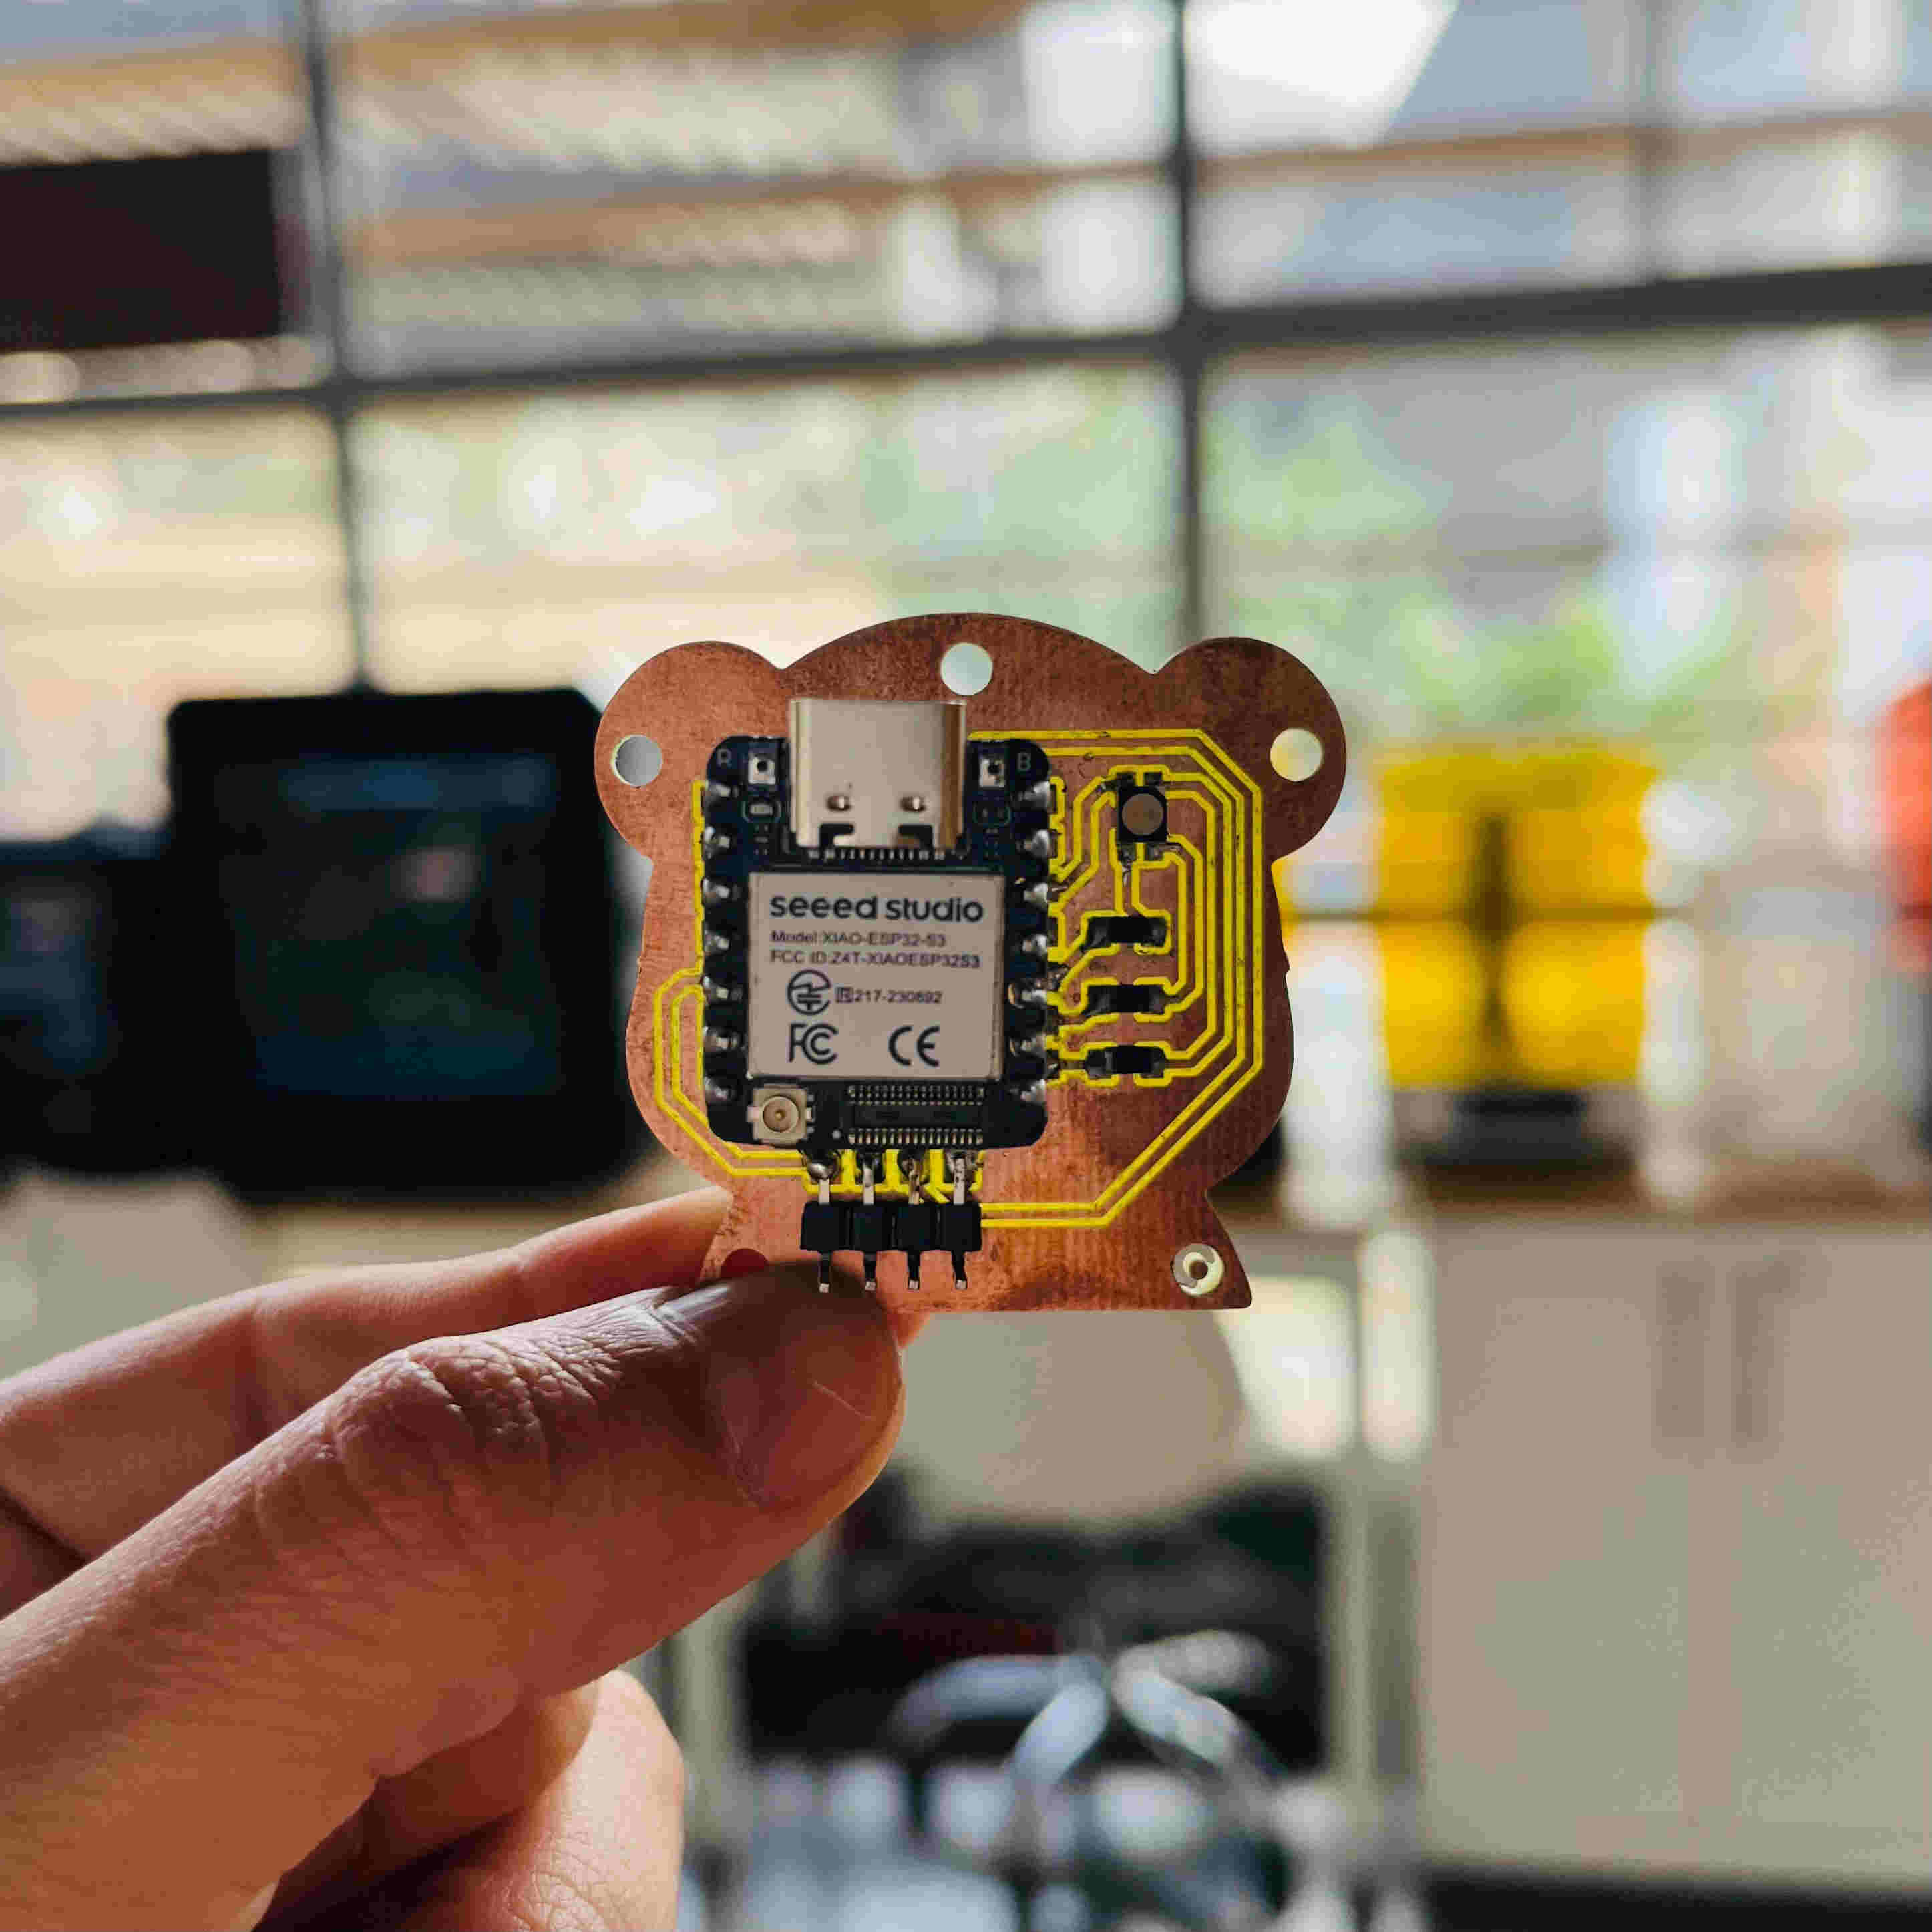
The design and fabrication process for this board followed the same workflows covered in Week 6 (Electronics Design) and Week 8 (Electronics Production). The schematic was created in KiCad, the PCB was routed, and the board was milled and assembled in the fab lab. For more detail on these steps, refer to Week 6 and Week 8 documentation.
The accessory board was designed to be compact and to connect directly to the main robot board. Its main components are:
- XIAO ESP32S3 — the microcontroller that reads the sensor and controls the LED
- MPU6050 — the accelerometer sensor, connected via a 4-pin cable header (J1)
- RGB LED (common anode) — gives visual feedback for each movement level, with current-limiting resistors R1, R2, R3
The MPU6050 Sensor
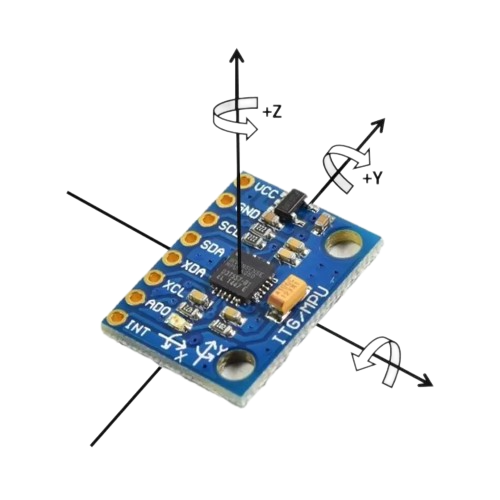
The MPU6050 is a 6-axis Inertial Measurement Unit (IMU). It combines a 3-axis accelerometer and a 3-axis gyroscope in a single chip. For this project, only the accelerometer is used.
The accelerometer measures forces along three axes — X, Y, and Z — and returns a value for each. By combining these three values into a single magnitude, we get a number that represents the total intensity of movement regardless of direction:
|A| = √(ax² + ay² + az²)
⚠️ An important detail to understand: at rest, the sensor always reads approximately 9.8 m/s² because gravity is constantly acting on it. This is completely normal. Any movement adds to this baseline, so the code works by detecting how much the reading rises above that resting value.
How it communicates — SDA and SCL
The MPU6050 communicates with the microcontroller using I2C (Inter-Integrated Circuit), a two-wire serial protocol designed for short-distance communication between chips on the same board:
- SDA (Serial Data Line) — carries the actual data back and forth between the sensor and the microcontroller
- SCL (Serial Clock Line) — provides the timing signal that keeps both devices synchronized
Connecting the Sensor to the Board
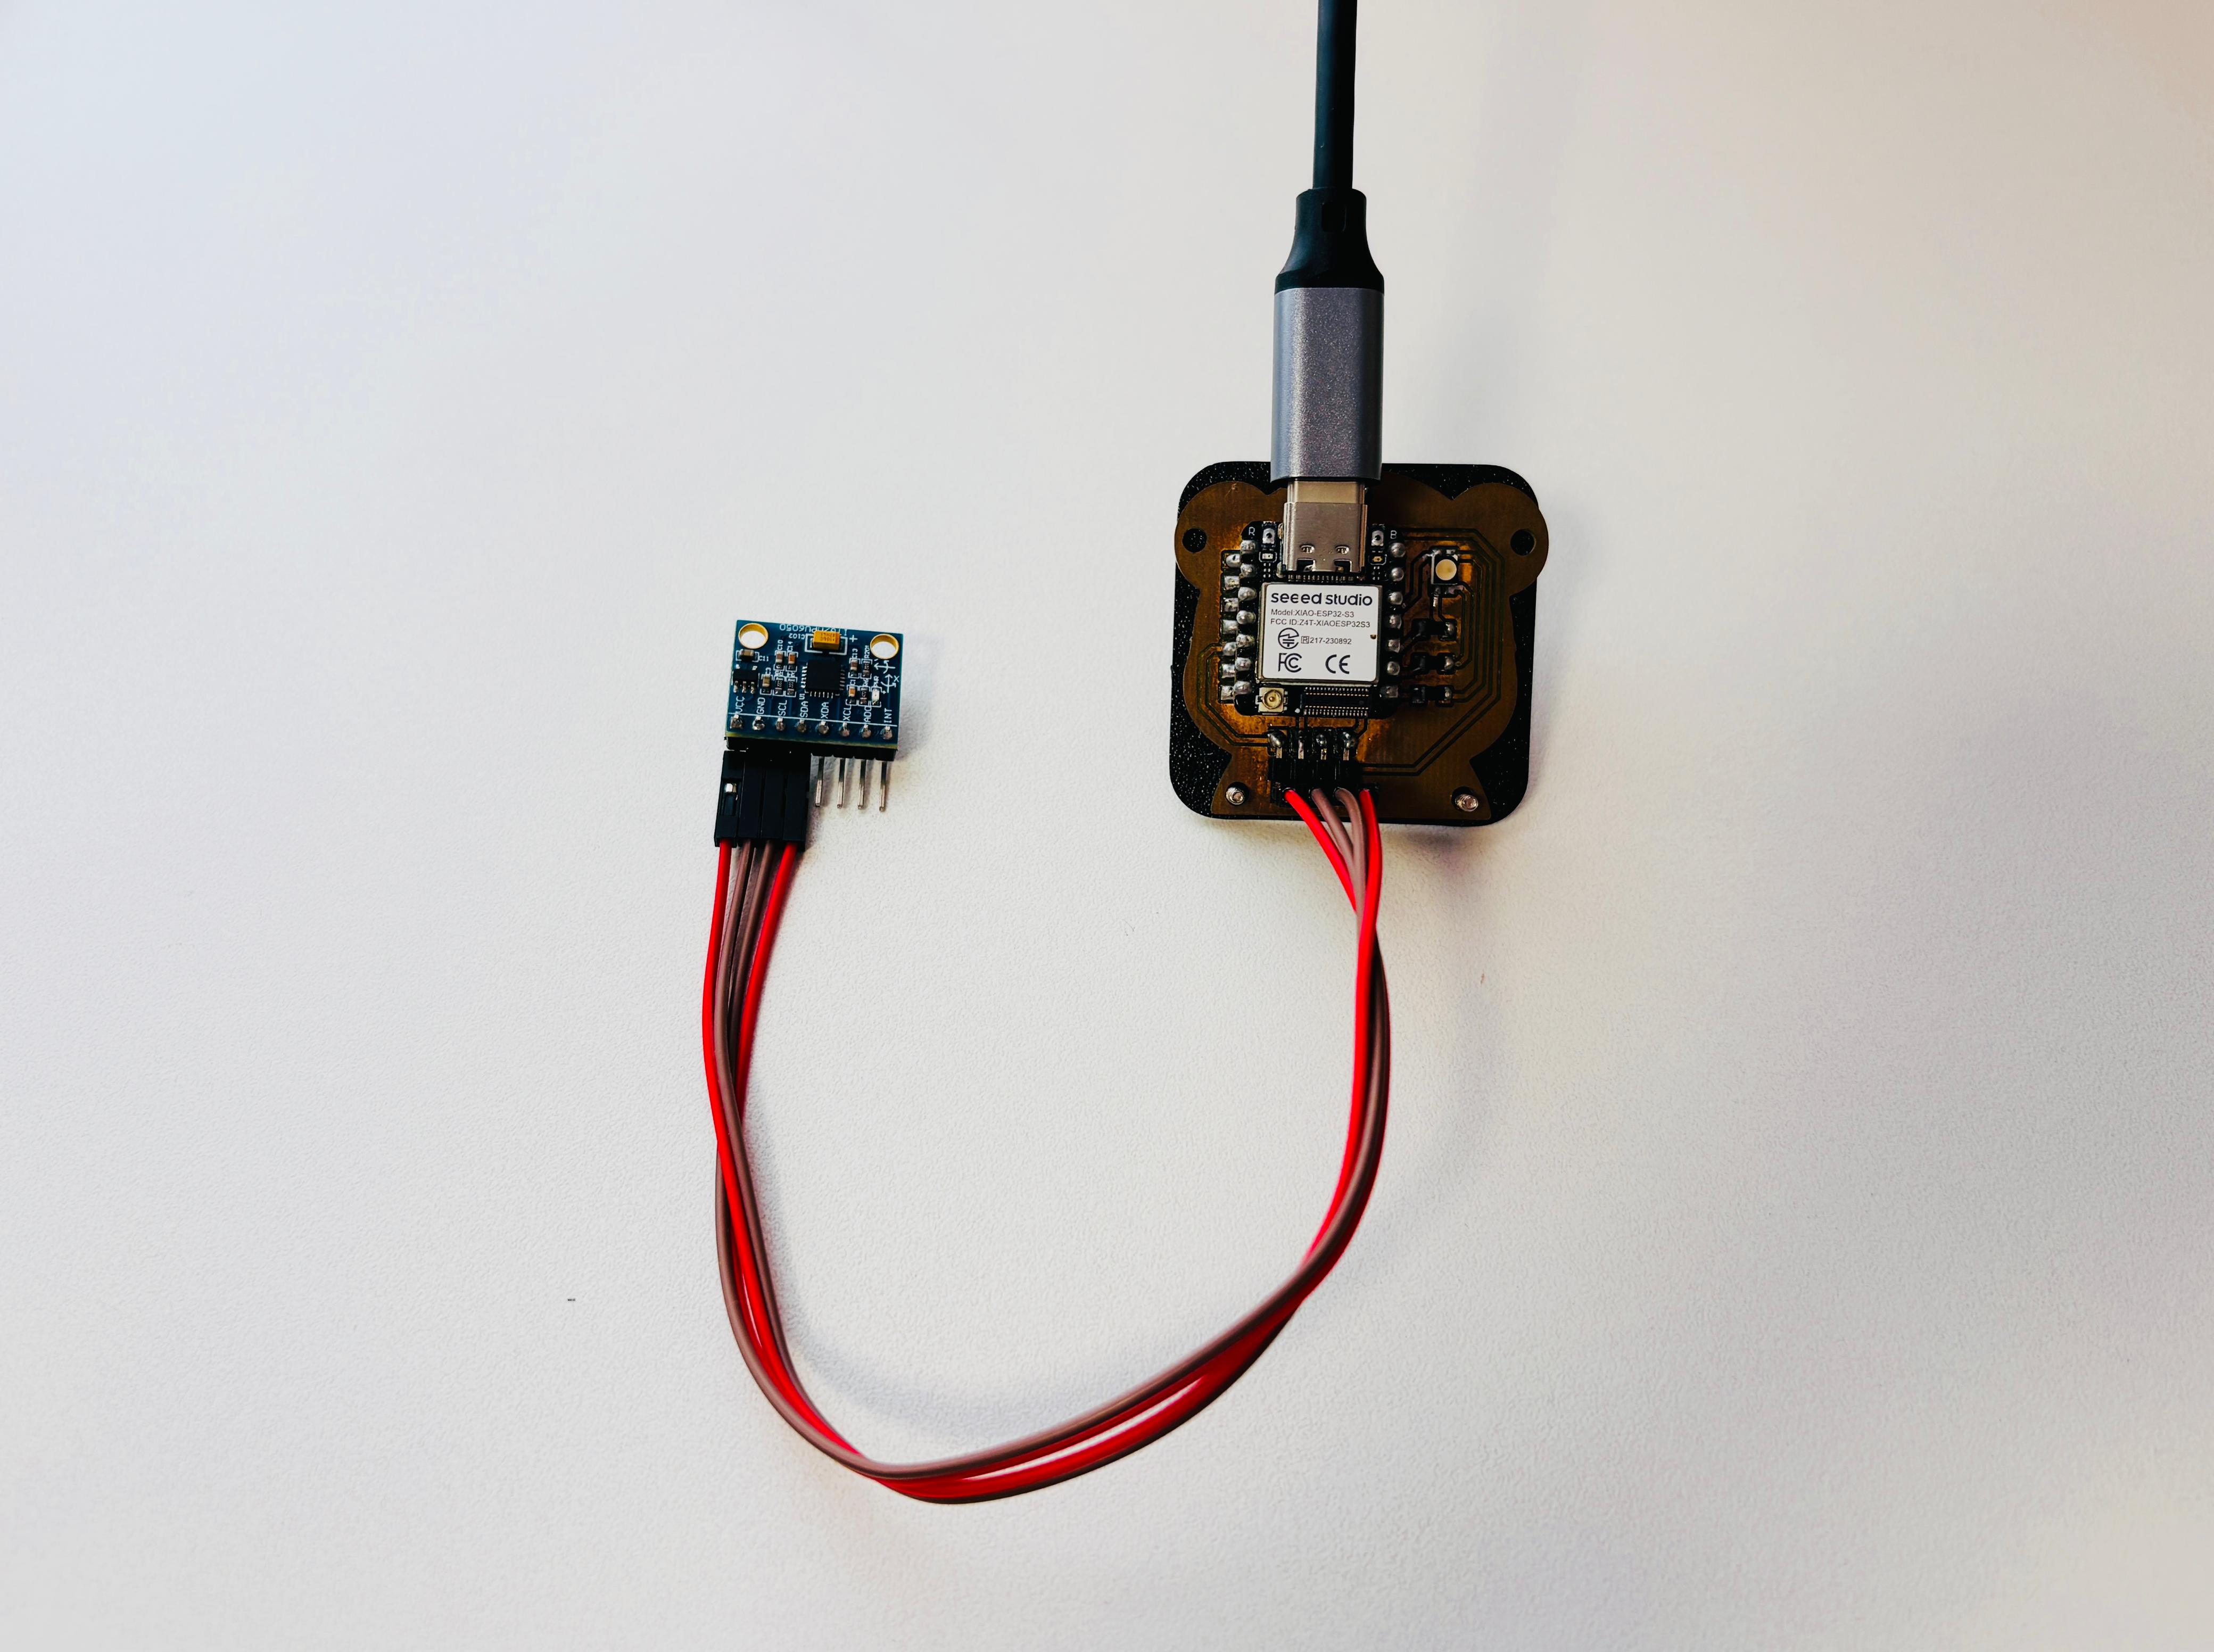
The MPU6050 module has 8 pins, but only 4 are needed for basic operation: VCC, GND, SDA, and SCL. The remaining pins (XDA, XCL, AD0, INT) are left unconnected. The module connects to the board through the J1 connector using four cables:
| Signal | MPU6050 Pin | |
|---|---|---|
| Pin 1 | 3.3V | VCC |
| Pin 2 | GND | GND |
| Pin 3 | D5 | SCL |
| Pin 4 | D4 | SDA |
How the Code Works
The code does four things: reads the sensor, smooths the data, decides the level, and controls the LED color.
#include <Wire.h>
#include "I2Cdev.h"
#include "MPU6050.h"
1. Libraries
- Wire.h — handles the I2C communication between the XIAO and the MPU6050
- MPU6050.h + I2Cdev.h — give us simple functions to talk to the sensor, so we don't have to write complex low-level code ourselves
2. Reading the Sensor
The MPU6050 gives us three numbers: the acceleration on the X, Y, and Z axes. Instead of working with three separate values, we combine them into one single number that represents the total movement intensity, regardless of direction.
3. Smoothing the Data
Sensor readings are not perfectly stable — they can jump slightly from one reading to the next even without real movement. To fix this, the code keeps a list of the last 5 readings and works with their average instead of reacting to each one individually.
4. Deciding the Level
Once we have the smoothed value, the code decides which level it belongs to — Green, Blue, or Red. To avoid flickering at the boundaries, it uses different thresholds to go up versus go down between levels.
5. Controlling the LED
Finally, the code turns on the correct color based on the current level. Because the RGB LED is common anode, the logic is inverted — a pin set to LOW turns the color ON, and HIGH turns it OFF. The setRGB() function handles this internally.
⚠️ Problems & How I Fixed Them
Problem 1 — Compilation error with pin numbers and MPU6050 not detected
When defining the LED pins at the top of the code using plain integers, Arduino threw this error when trying to compile: "wrong type argument to unary minus". This was confusing because the numbers looked correct. The issue is that on the XIAO ESP32S3, plain integers like 7, 8, 9 are not always interpreted as GPIO pin numbers — the board package needs the D prefix to resolve them correctly. The same problem appeared with the I2C initialization. Wire.begin(4, 5) compiled without errors but the sensor was never found.
✅ Fix
Replace the plain numbers with the D notation — D7, D8, D9 for the LED pins, and Wire.begin(D4, D5) for the I2C bus. Both issues were caused by the same root problem and were fixed the same way.
Problem 2 — LED flickering between Green and Blue
The LED kept switching rapidly between green and blue even without any real movement. The sensor at rest already reads ~9.8 m/s² due to gravity, and the threshold to switch to Blue was set at 11 m/s². That gap is very small, so tiny natural vibrations were enough to cross it back and forth dozens of times per second.
✅ Fix
The solution was hysteresis — instead of one threshold for both directions, two different values are used: one to go up and a lower one to come back down. Because these two values are different, the LED cannot flicker between them.
| Transition | Threshold | Meaning |
|---|---|---|
| Green → Blue | > 10.5 m/s² | Any movement detected |
| Blue → Green | < 10.0 m/s² | Absolute rest only |
| Blue → Red | > 20.0 m/s² | Strong fast movement |
| Red → Blue | < 17.0 m/s² | Movement decreasing |
How the physical property relates to the measured results
The physical property being measured is acceleration — the force generated when the child moves or shakes the accessory. When the sensor is still, it mainly measures gravity, which is approximately 9.8 m/s². When movement is introduced, the sensor measures both gravity and the additional acceleration caused by motion, increasing the overall value. The relationship is direct: stronger and faster movements produce higher acceleration readings.
- Gentle movement → small increase above 9.8 → Blue
- Strong shake → large increase above 9.8 → Red
The goal is not to measure displacement, but the intensity of interaction. The MPU-6050 captures that force, and the system translates it into three clear response levels.
Hero Shot 🎉
The system works as intended. At rest the LED shows green. Any light movement immediately switches it to blue, and it only returns to green when the accessory is completely still. Shaking the accessory firmly triggers red. The Serial Monitor confirms the values in real time, making it easy to see exactly what the sensor is reading at any moment.
This test confirms that the MPU6050 can reliably detect three movement intensity levels on this custom board, and that the logic is stable enough to be integrated into the therapeutic robot in the final project.
System working — green at rest, blue on light movement, red on strong movement
Final Thought
As part of the 2026 cycle, in this assignment, I learned how to use the oscilloscope to observe analog and digital signals in real time, which made the behavior of the circuits easier to understand. I also learned how to interface an input device — the MPU-6050 — with a microcontroller board that I designed myself. I understood that sensors allow us to measure physical phenomena from the environment by converting them into data that the microcontroller can read and process.