For this week assignment the objectives were:
- group assignment:
- probe an input device’s analog levels and digital signals.
- individual assignment:
- measure something: add a sensor to a micro controller board that you have designed and read it.
1. Group Assignment
The full group assignment can be found
here
For the group assignment I was in charge of measuring digital signals
produced by pressing a button. Below, I use the digital logical analizer
to measure the digital signals generated when a button is pressed. For
this test, I used a button board designed during the electronics
production week. The digital analyzer was connected to the board’s
ground and to pin number 8, which is linked to the button circuit. When
the button was pressed, the signal read as a logical high (1); when it
was not pressed, the signal remained low (0). The high signal persisted
for the duration of the button press.
The setup includes a
pull-down resistor connected between the microcontroller’s input pin and
ground. The button itself is connected between the same input pin and
the positive power supply. When the button is not pressed, the resistor
pulls the pin voltage low (logic ‘0’). When the button is pressed, it
connects the pin to the positive supply, pulling the voltage high (logic
‘1’).
2. Individual Assignment
For my individual assignment, I chose the DHT11 sensor. This sensor is capable of measuring both temperature and relative humidity. My primary interest lies in temperature, as it plays a critical role in insect development.
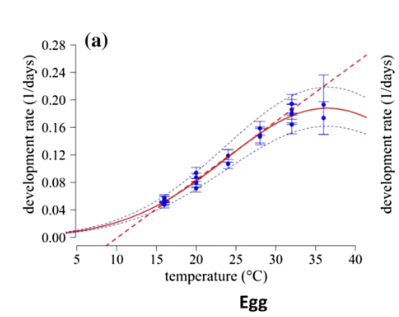
In poikilotherms—organisms that cannot regulate their body temperature internally—development is heavily influenced by environmental temperature. This, in turn, affects their developmental rates, which refer to the time it takes for an insect to progress from one life stage to another (e.g., the emergence of a butterfly from a chrysalis).
Generally, higher temperatures accelerate developmental rates up to an optimal point, beyond which further increases can slow development or even become lethal. If the date of infestation is known—based on the observation of a specific life stage—it is possible to predict the timing of future stages. This can help in optimizing control measures, whether biological or chemical.
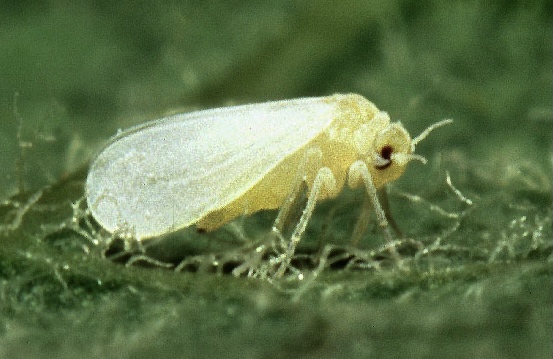
To illustrate, the image below shows an adult whitefly, a common pest feeding from various plant species. Also shown is a chart of developmental rates (1/time) at different temperatures. For example, at 27°C, an egg laid by an adult whitefly would take approximately 6 days to hatch.
The DHT11
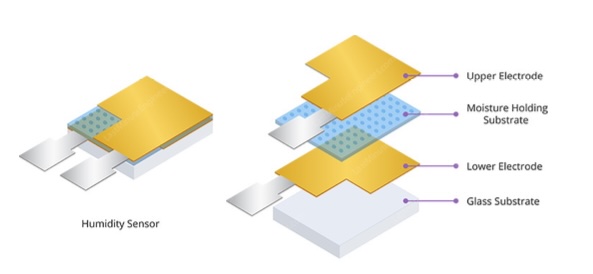
For my assignment, I worked with the DHT11 sensor, which is commonly used to measure both temperature and humidity. The humidity sensing component operates using two electrodes and a moisture-sensitive substrate—typically a salt or conductive plastic polymer—placed between them.
As the substrate absorbs water vapor from the air, it releases ions that increase the conductivity between the electrodes. This change in conductivity alters the resistance between the electrodes. In essence, higher humidity levels decrease resistance, while lower humidity levels increase it. This change in resistance is then interpreted to determine the relative humidity of the environment.
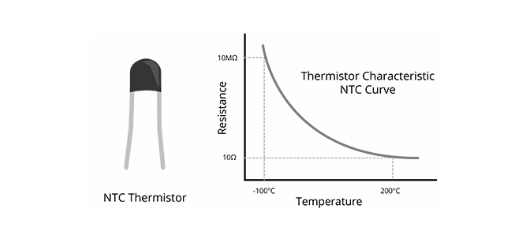
The DHT11 sensor measures temperature using an NTC (Negative Temperature Coefficient) thermistor—a type of resistor whose resistance decreases as temperature increases. Unlike standard resistors, thermistors exhibit substantial changes in resistance, often varying by 100 ohms or more per degree Celsius. This sensitivity makes NTC thermistors well-suited for accurately detecting temperature changes. (Summary adapted from AZ Electronics)
Below is the technical datasheet for the DHT11 sensor, which provides detailed specifications and operational characteristics of the device.
Specifications
source: mouser electronics
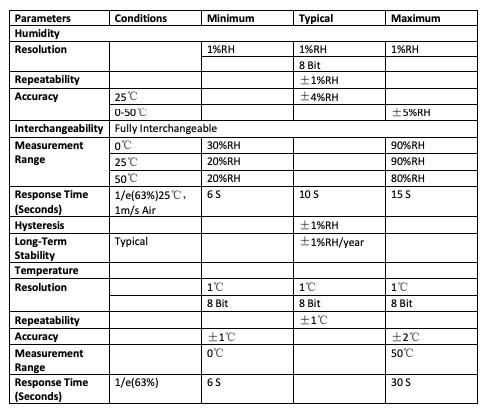
From the datasheet, several points stand out. First, the sensor’s resolution is limited to 1°C for temperature and 1% for relative humidity (RH), meaning it cannot detect changes smaller than these increments. Additionally, the performance of the RH sensor is affected by the ambient temperature—it has certain sensing limitations depending on the temperature at which it operates.
We can also observe that the typical accuracy is around ±4% for relative humidity and ±1°C to ±2°C for temperature. These values are important to consider when assessing the sensor’s reliability in applications that require precise environmental monitoring.
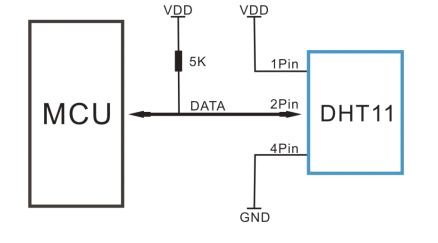
The DHT11 sensor requires three pins for operation: a voltage (VCC) pin, a ground (GND) pin, and a data pin. It’s important to note that the data pin should be connected to an SDA-compatible pin on the microcontroller.
From a circuit design perspective, it is recommended to include a pull-up resistor on the data line to ensure reliable communication. This is something I did not include in my test board design and will need to address in future iterations to improve stability and performance.
Single-bus data format is used for the communication and synchronization between the MCU and the DHT11. There is a 40 bit transmission consisting of:
- 8 bit of integral data RH
- 8 bit of decimal data RH
- 8 bit of integral data T
- 8 bit of decimal data T
- 8 bit check sum.
Communication Process:
- Start Signal send from MCU [this is necessary]
- DHT11 changes from low power to running mode and waits for MCU to complete signal
- DHT11 sends 40 bit data.
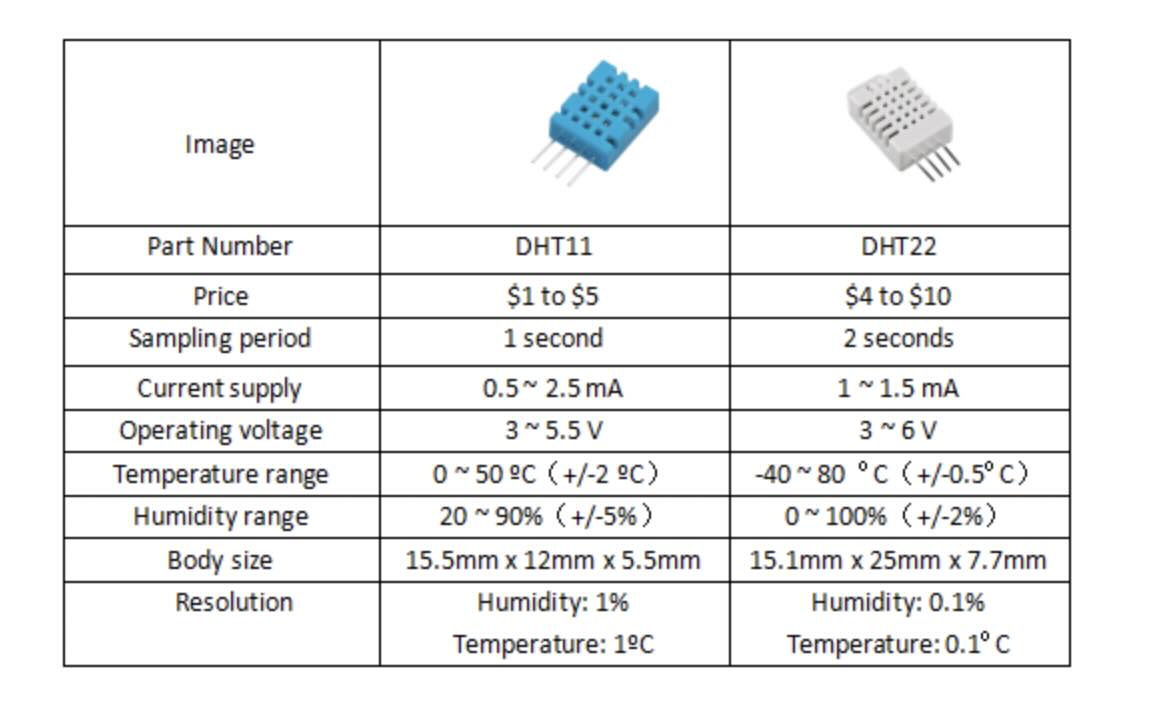
Finally, some additional points on the differences between DHT11 and DHT22 sensors (ariat tech) You can see from the chart that the error rate higher in the DHT11 specially for RH. Also there a finer resolution for measuring temperature in the DHT22. However the price is higher in the latter.
Sensor testing
For testing the sensor I used the board I developed in the electronic production week (link):
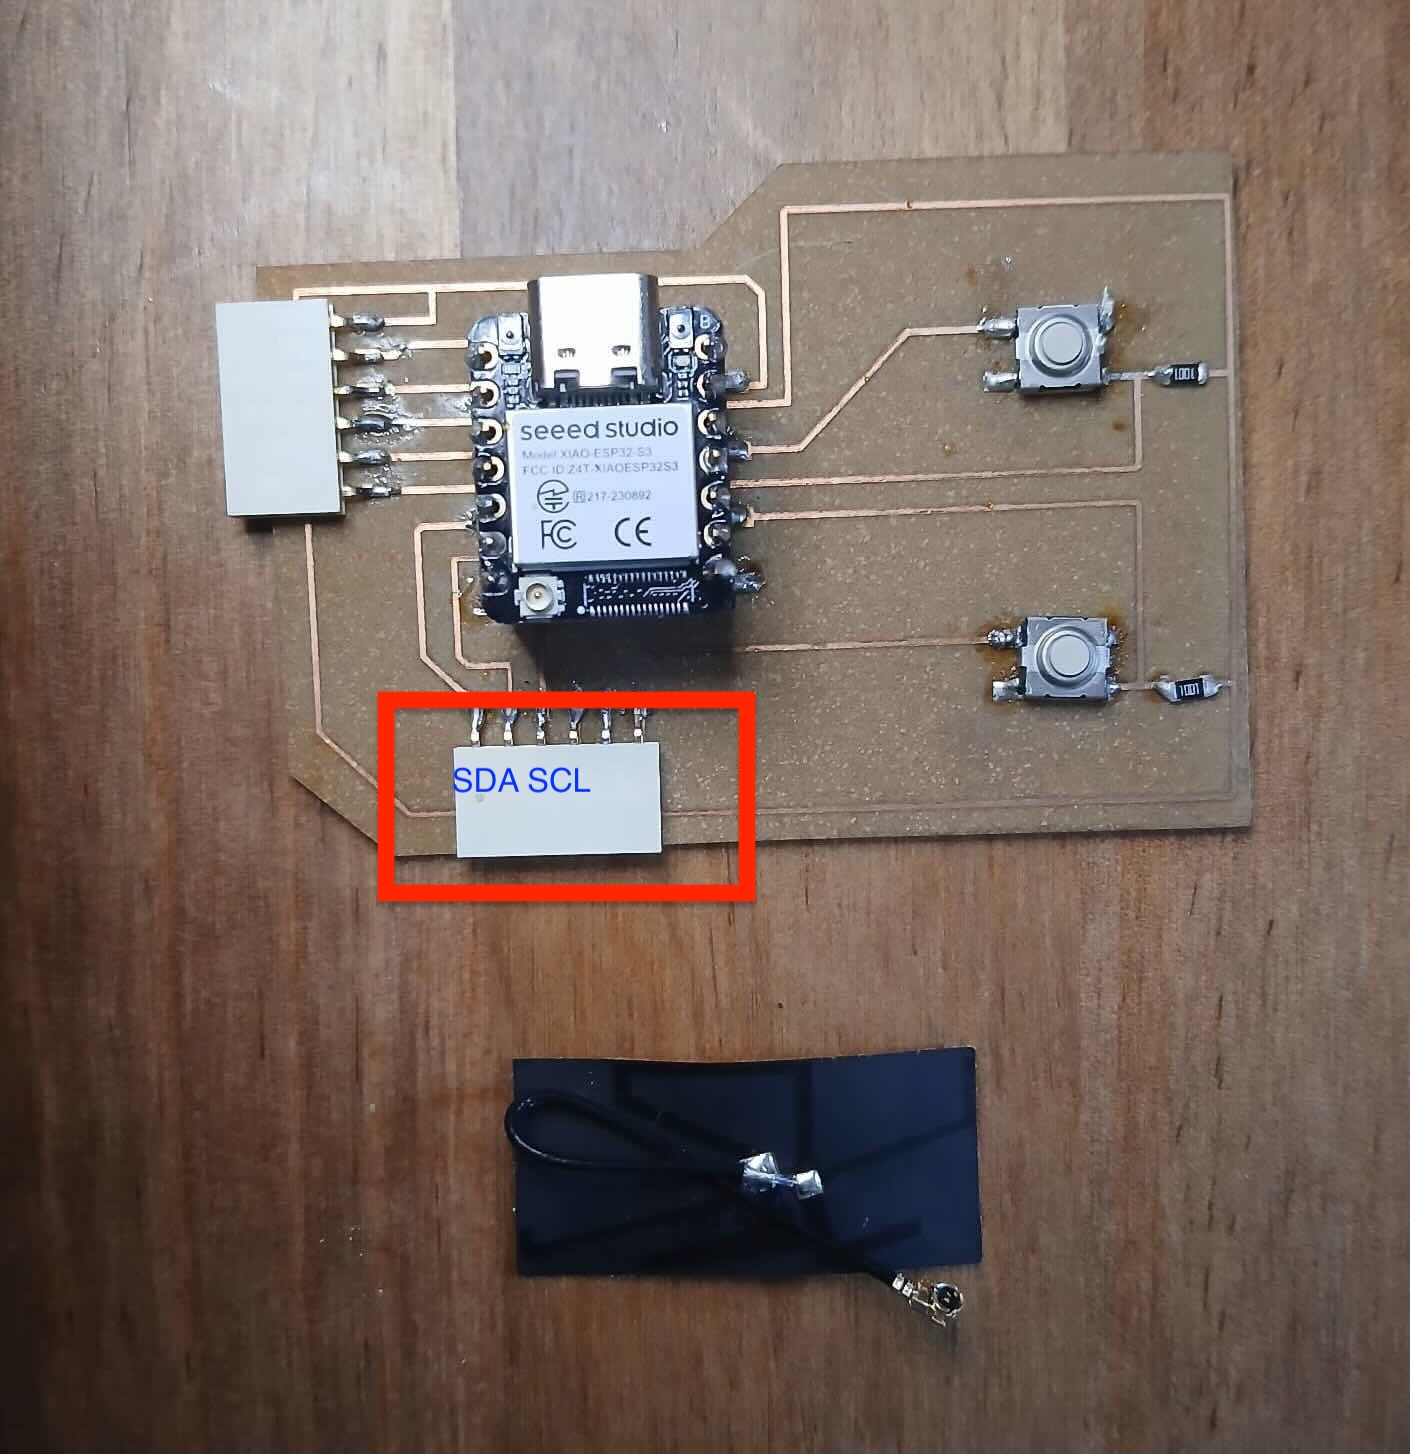
and coded the following script in micropython.
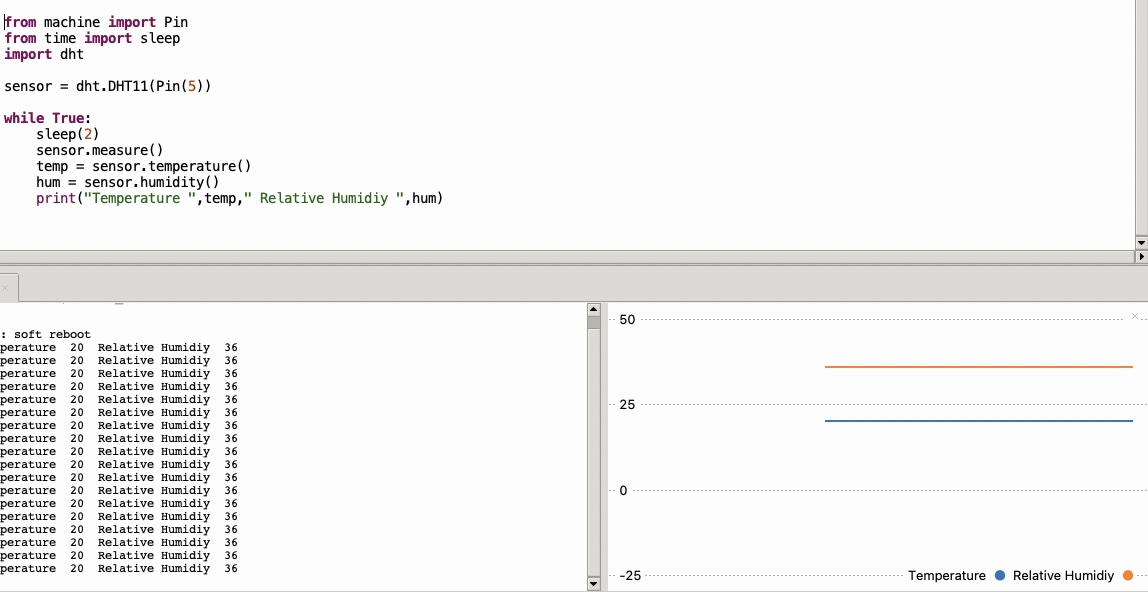
from machine import Pin
from time import sleep
import dht
sensor = dht.DHT11(Pin(5))
while True:
    sleep(2)
    sensor.measure()
    temp = sensor.temperature()
    hum = sensor.humidity()
    print("Temperature ",temp," Relative Humidiy ",hum)
here you can see the results:
I also looked at some tutorial to set up the XIAO as a server for displaying a value of temperature and a value humidity connecting to Wifi (link ).
I wanted to have a more complete view of how these parameters evolved and I modified the script to record values every 10 seconds and plot them using a neat javascript interactive library called “Plotly”.
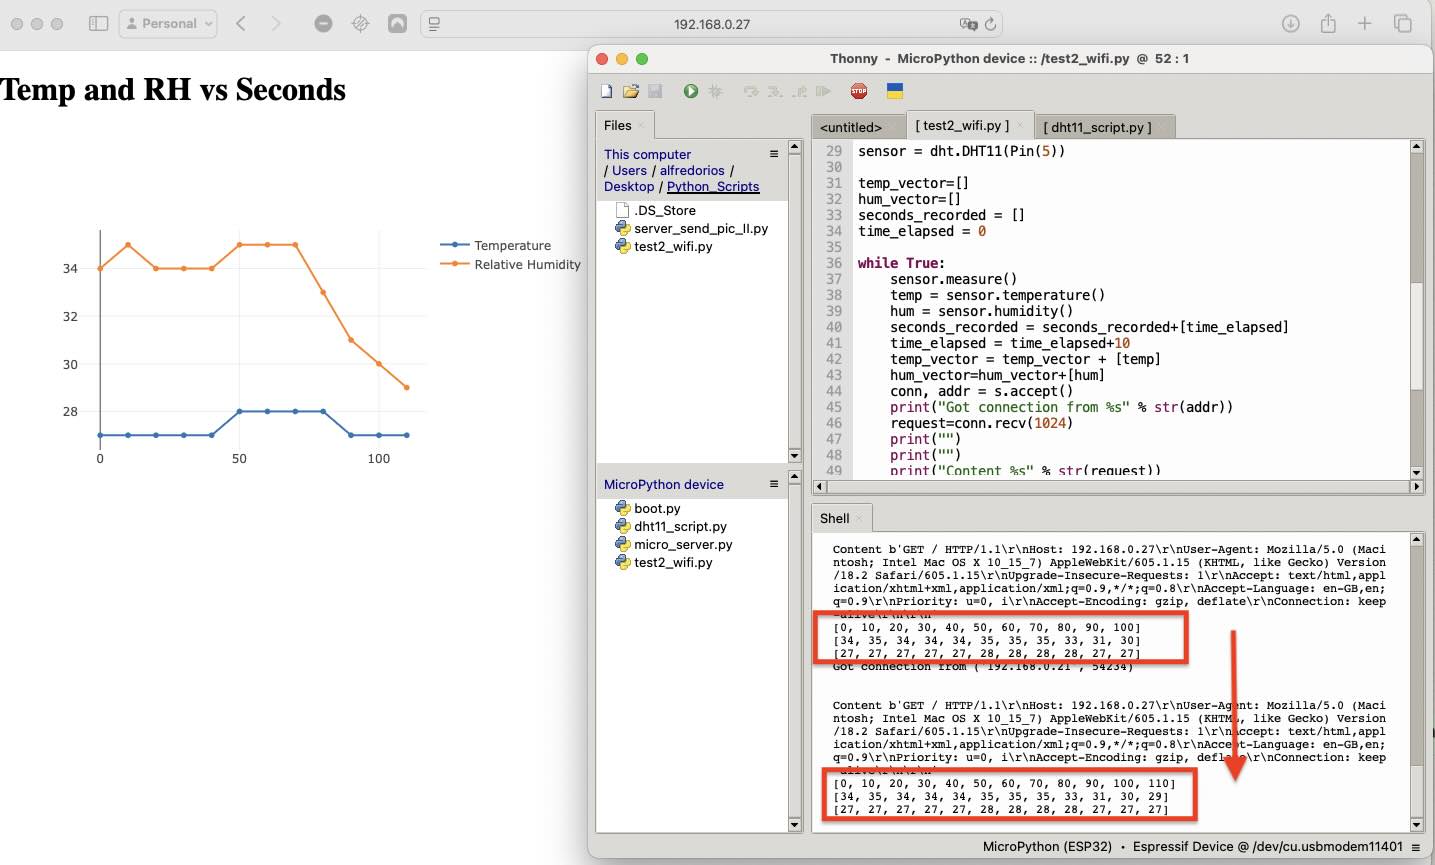
Something to note here is the sharp drop in RH, possibly this might be due to the precision of the sensor.
Xiao ESP32S3 sense Camera
For my project, I need to use a camera for object detection. The camera should be mounted inside the trap, facing the sticky tape. The Xiao Sense comes with a detachable OV2640 sensor (link ), which has a resolution of 1600x1200 pixels. It is possible to upgrade to the OV5640 camera, which offers a 5MP resolution and reportedly features autofocus—although I still need to find someone who has successfully tested this. The camera OV2640 has a 65-degree field of view.
Testing and considerations:
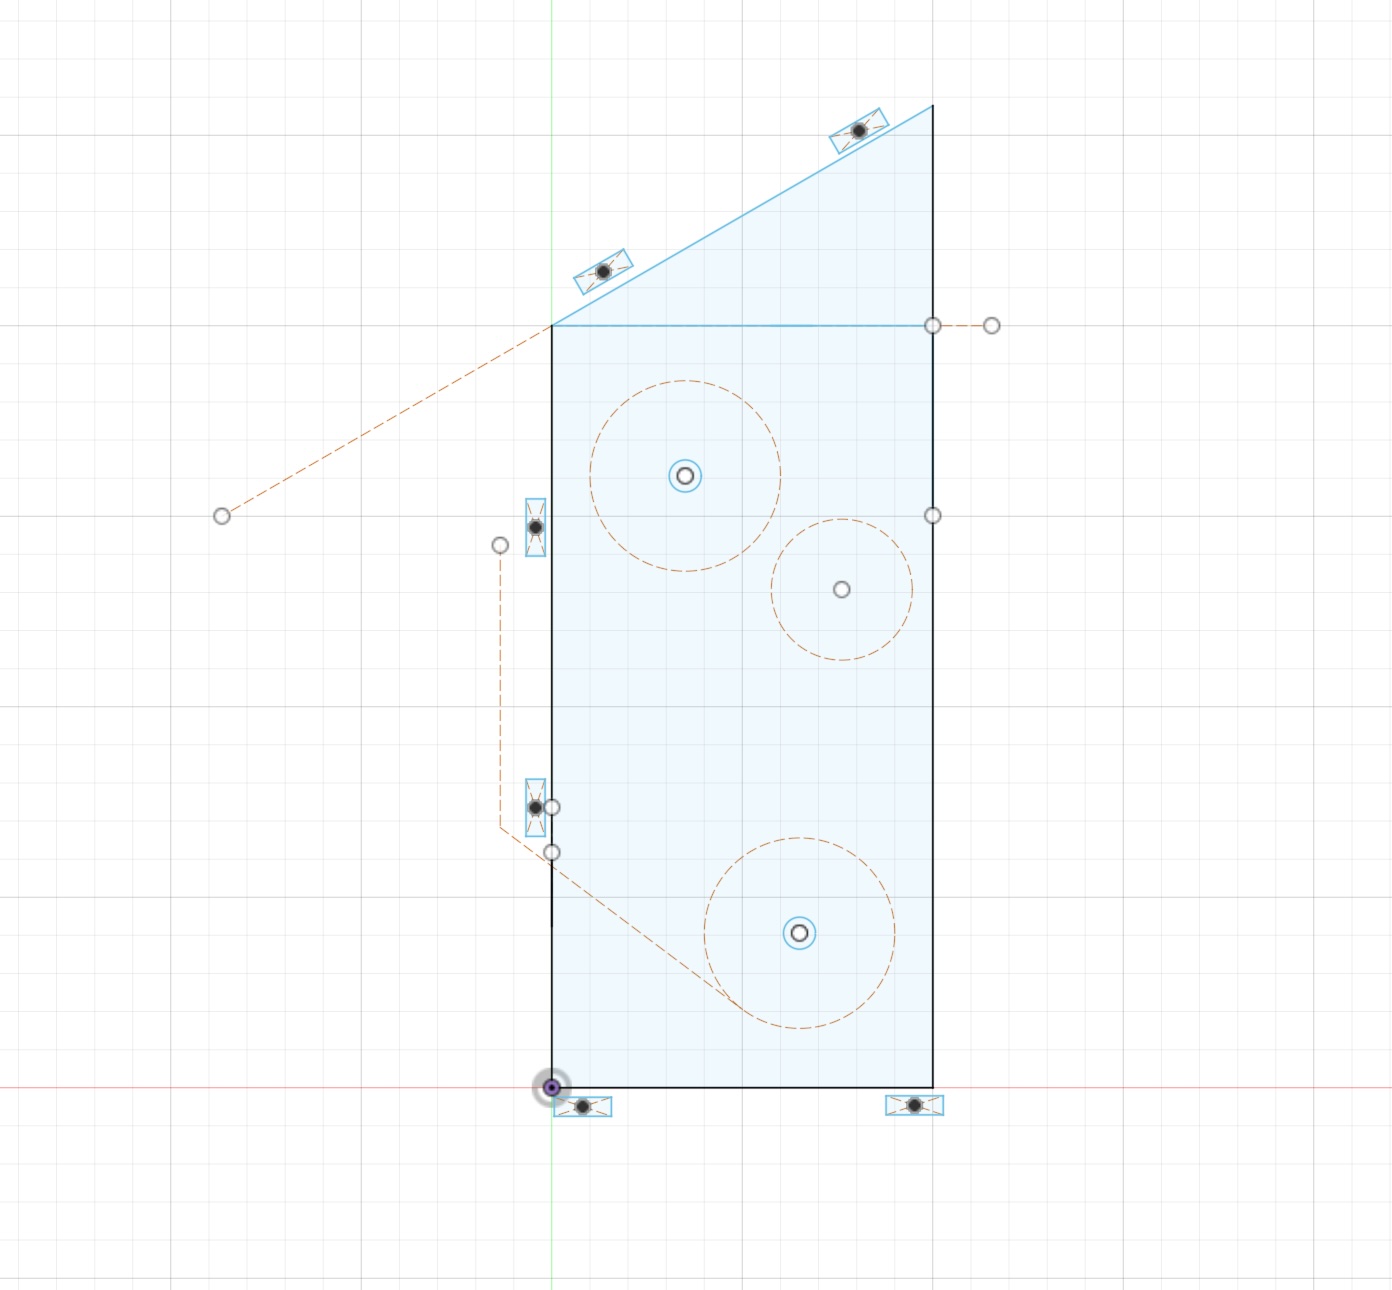
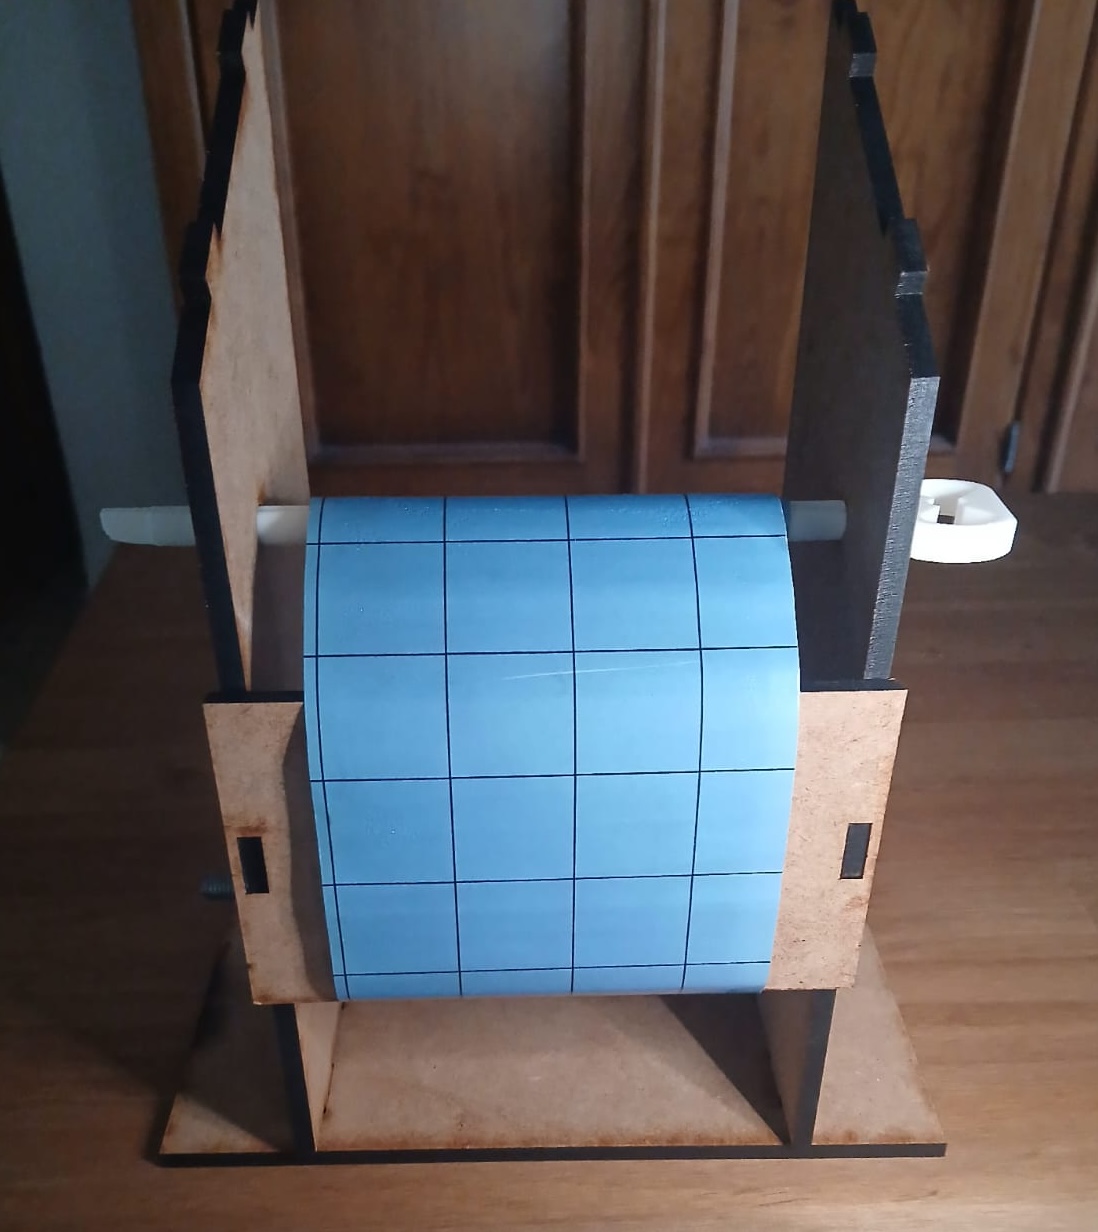
In the smart trap, the mounted tape will be positioned quite close to the lens. It is also essential to verify that the field of view is wide enough to capture a sufficient portion of the tape. Additionally, image brightness needs to be assessed to ensure that the photos are neither too dark nor overexposed. Here you can see the testing set up. For this set up I built a quick prototype composed of a house like structure using MDF. Below, you can see some of the Fusion 360 sketches that guided my fusion design.
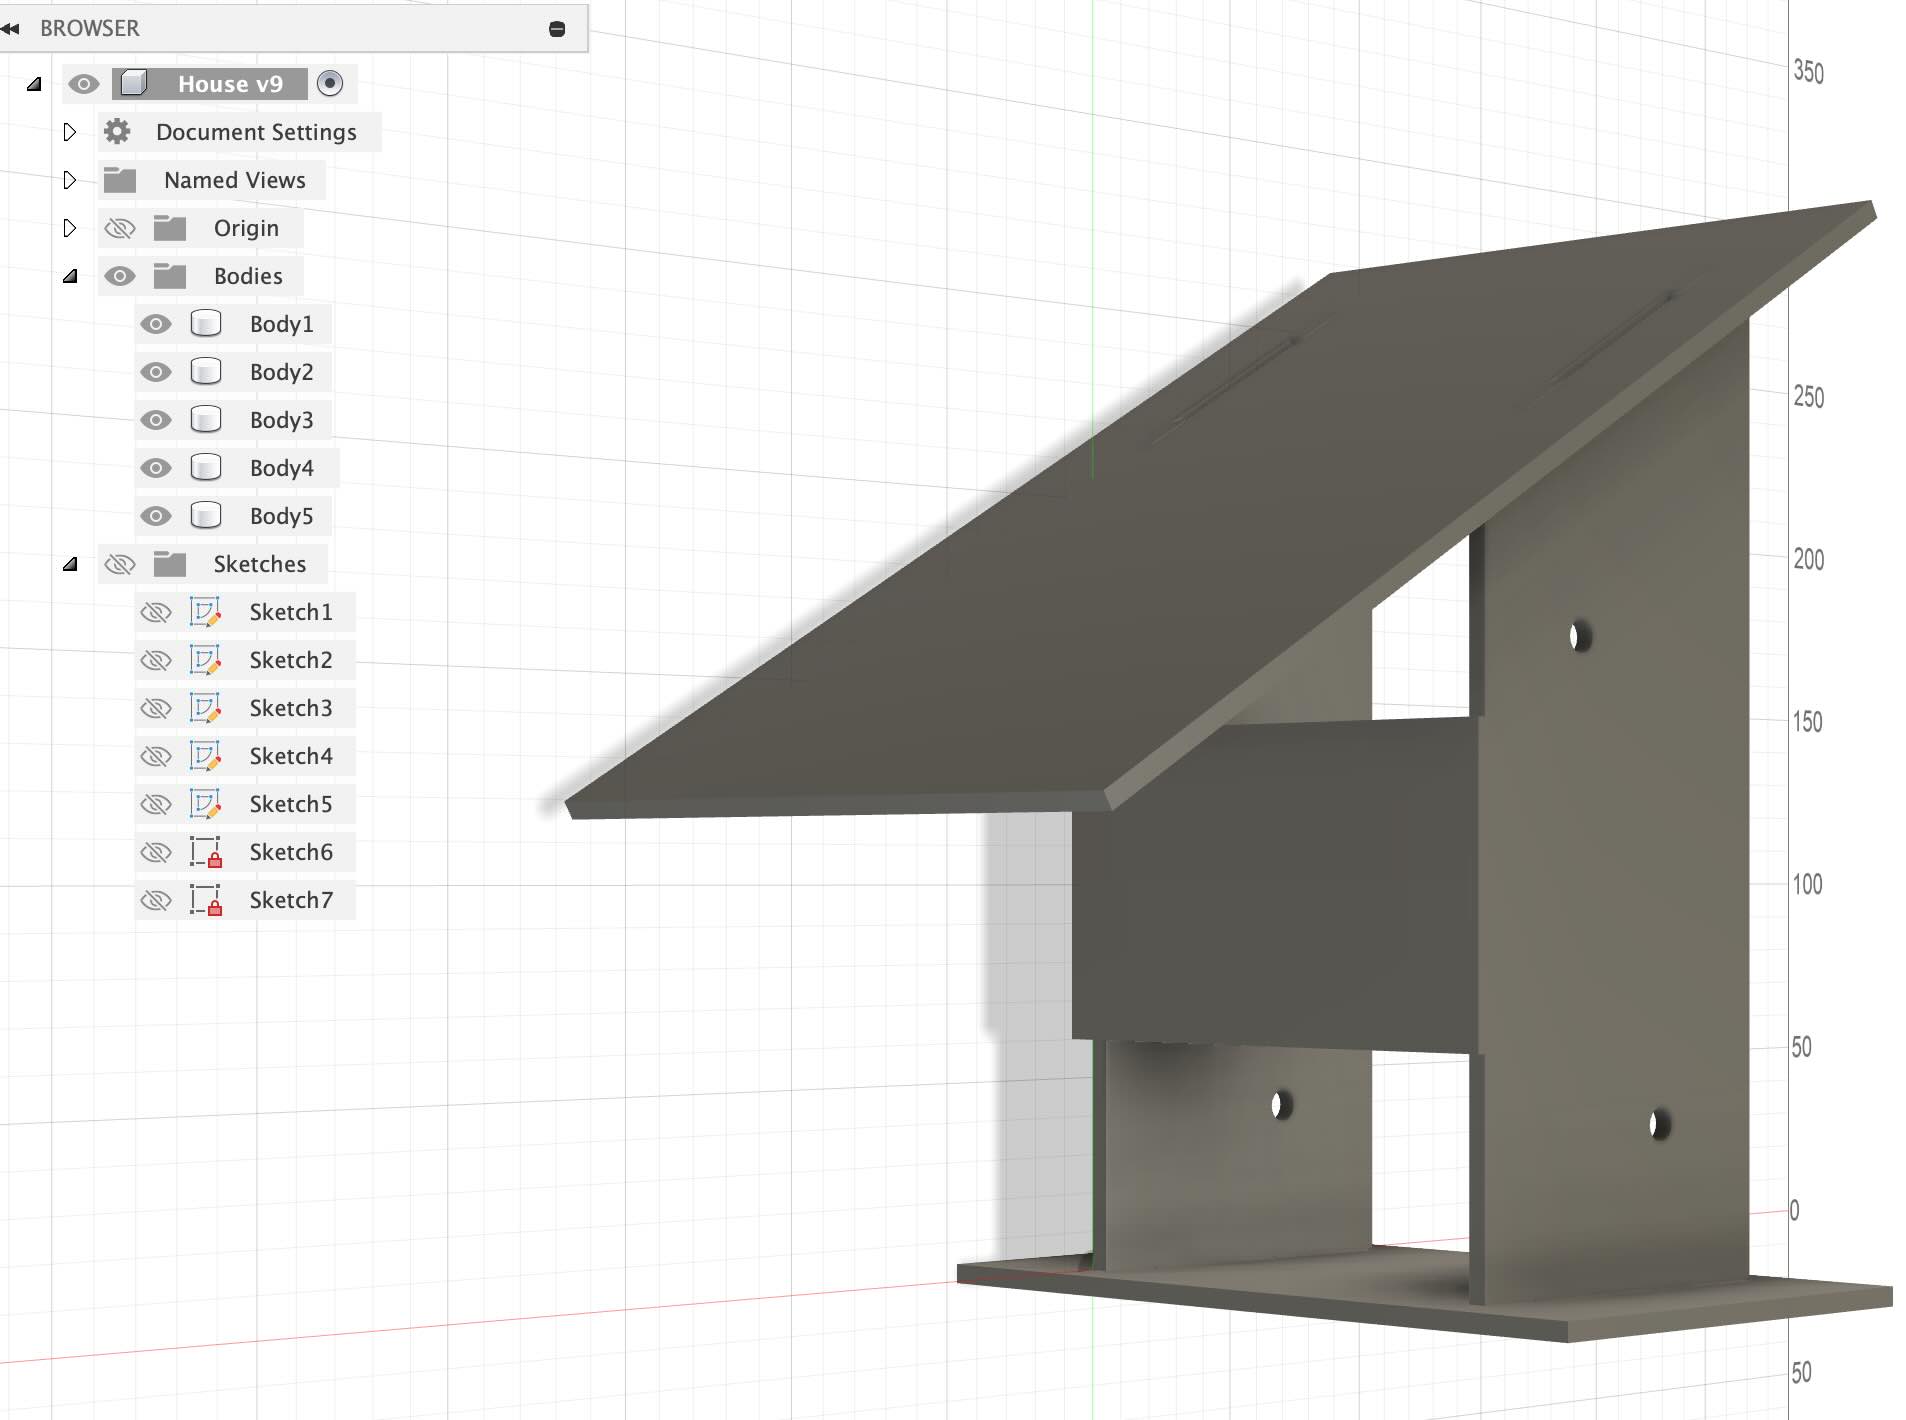
And here you can find the implementation
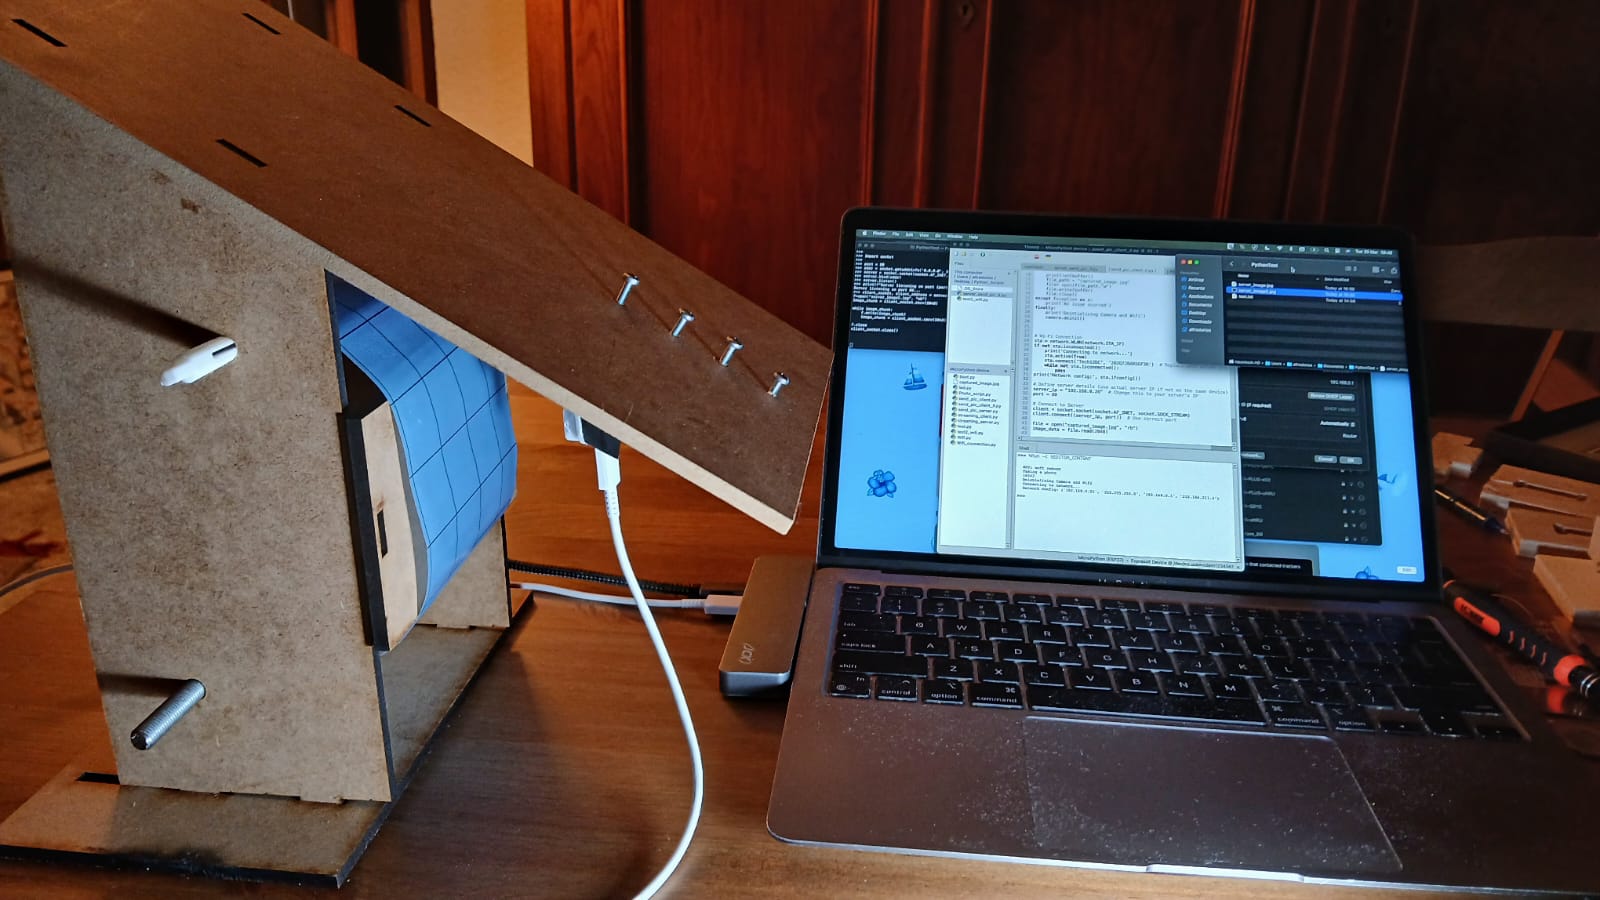
which houses a roll of sticky tape.
and camera mounted in the roof with case I found here: link
Next, I needed to operate the camera and transmit the captured images over the internet. I chose to implement this part using MicroPython, as it offers a more intuitive and accessible programming experience compared to C++. Staying within the Python ecosystem is also advantageous, given its robust support for deep learning libraries and as well it can connect to openCV for image processing capabilities.
I found the following websites particularly helpful for understanding how to connect to Wi-Fi and exchange data between devices. Much of the code I used below is either adapted from or directly based on examples from these sources. (video, link 1, link 2 ). I also used ChatGPT to correct or provide suggestions on how to solve certain issues/errors.
Camera Control
I watched this video and this was the code they used to operate the Camera.
https://www.youtube.com/watch?v=TDgM8eMTpIw
import camera

try:
    print('Taking a photo')
    camera.init()
    buffer = camera.capture()
    print(len(buffer))
    file_path = "captured_image.jpg"
    file= open(file_path,"w")
    file.write(buffer)
    file.close()
except Exception as e:
    print('An issue ocurred')
finally:
    print('Deintializing Camera and Wifi')
    camera.deinit() ### this seems to be quite important if not done might bring problems later
Server Side
import socket
port = 80
address = socket.getaddrinfo('0.0.0.0', port)[0][-1] ### this is to listen to all incoming connections incoming connections
server = socket.socket(socket.AF_INET, socket.SOCK_STREAM)
server.bind(address)
server.listen()
print(f"Server listening on port {port}...")
client_socket, client_address = server.accept()
f=open("server_image2.jpg", "wb")
image_chunk = client_socket.recv(2048)

while image_chunk:
    f.write(image_chunk)
    image_chunk = client_socket.recv(2048)
f.close
client_socket.close()
listen 0.0.0.0 instructs the server to listen to all the available IP addresses.
Client Side
import network
import socket
import time

# Wi-Fi Connection
sta = network.WLAN(network.STA_IF)
if not sta.isconnected():
    print('Connecting to network...')
    sta.active(True)
    sta.connect('*****', '*****')  # Replace with actual credentials
    while not sta.isconnected():
        pass
print('Network config:', sta.ifconfig())

server_ip = "192.168.0.26"  # This is the IP address of the computer.
port = 80

### This for connecting
client = socket.socket(socket.AF_INET, socket.SOCK_STREAM)
client.connect((server_ip, port))  # Use correct port

file = open("captured_image.jpg", "rb")
image_data = file.read(2048)

while image_data:
    client.send(image_data)
    image_data = file.read(2048)
file.close()
client.close()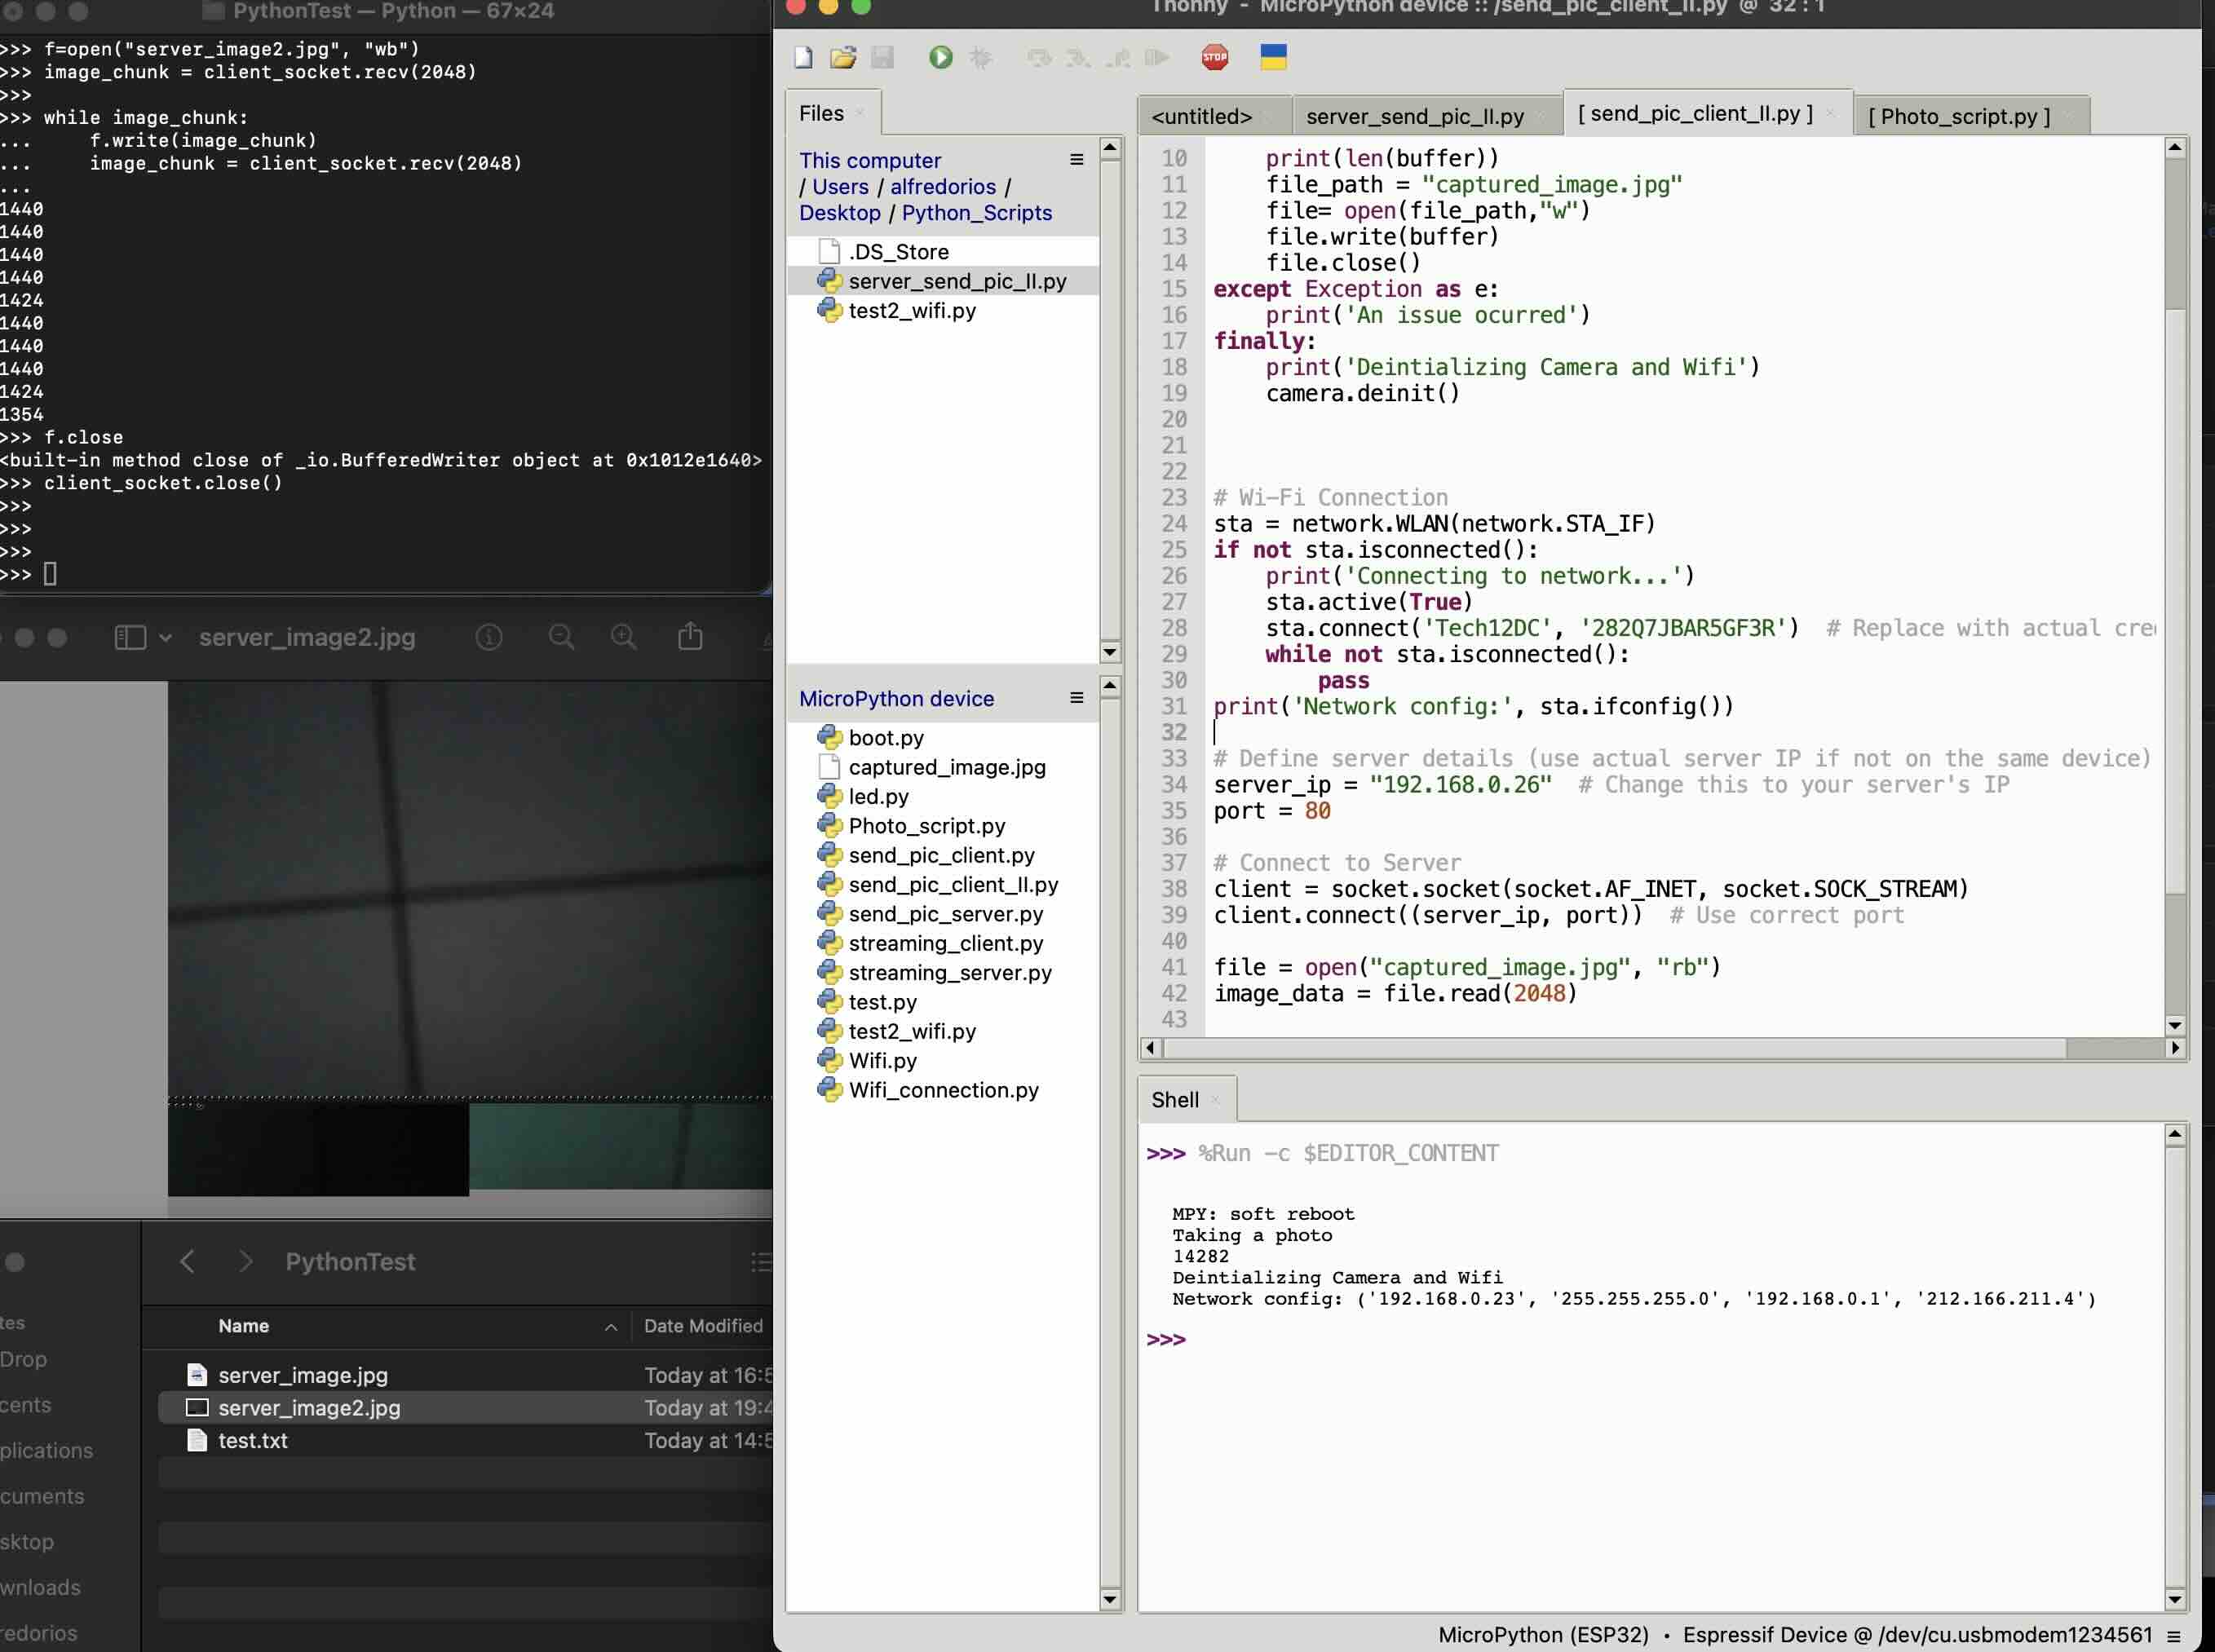
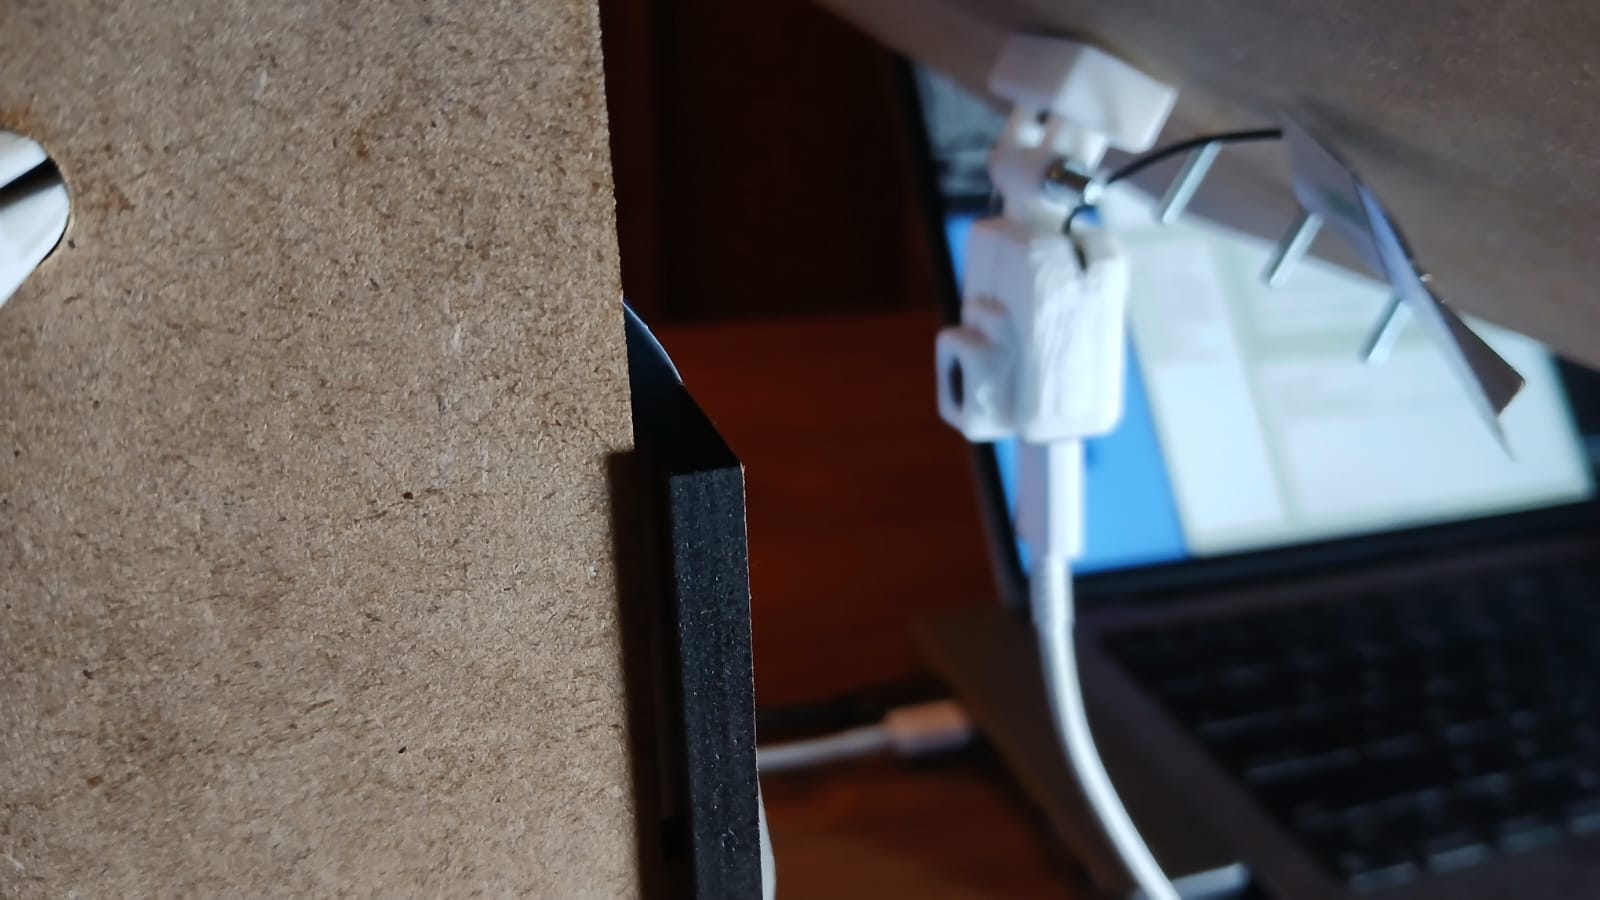
After I sorted out the programming I took some pictures. I placed the camera at different distances from the edge. I found that the position the furthest away from the tape was best as it allow to cover a good amount of the area. It was evident that the light was not enough (see above), however, it remains to see if by using an acrylic roof or a lead this could be improved.
Below you can find a link to the final project development page for this week: link
Key learning
- A pull-up resistor is required for the DHT sensor to function reliably.
- Considering the resolution and error rate, upgrading to a DHT22 could provide more accurate and stable readings.
- For the OV2640 camera module, consistent lighting is critical for capturing high-quality images.
- It may be beneficial to explore a wider-angle camera to improve the field of view, depending on how much of the tape needs to be captured.
- To ensure even lighting and prevent shadows, a transparent roof—possibly made of acrylic—will likely be necessary for the camera enclosure.
Have you:
- Linked to the group assignment page.
- Documented what you learned from interfacing an input device(s) to your microcontroller and optionally, how the physical property relates to the measured results.
- Documented your design and fabrication process or linked to the board you made in a previous assignment.
- Explained the programming process(es) you used.
- Explained any problems you encountered and how you fixed them.
- Included original design files and source code.
- Included a ‘hero shot’ of your board.
References
Aregbesola, O. Z., Legg, J. P., Lund, O. S., Sigsgaard, L., Sporleder, M., Carhuapoma, P., & Rapisarda, C. (2020). Life history and temperature-dependence of cassava-colonising populations of Bemisia tabaci. Journal of Pest Science, 93, 1225–1241. https://doi.org/10.1007/s10340-020-01249-z