WEEK 14: INTERFACE AND APPLICATION PROGRAMMING
This week the task was to create an application that would interact with the board through Wi-Fi. I built dashboard to visualize the data from the my board.
In the way of continue with making progress on my final project, I tried to make a dashboard to visualize data from my designed PCB Board.
Group Assignment
In this group assignment, we focused on Interface and Application Programming by implementing I2C communication with the board and controlling an actuator using the Blynk app. We compared them to find the most effective solutions for our needs. This task enhanced our understanding of various tools and their applications in real-world scenarios.
Click here to open the group page
Personal work to do
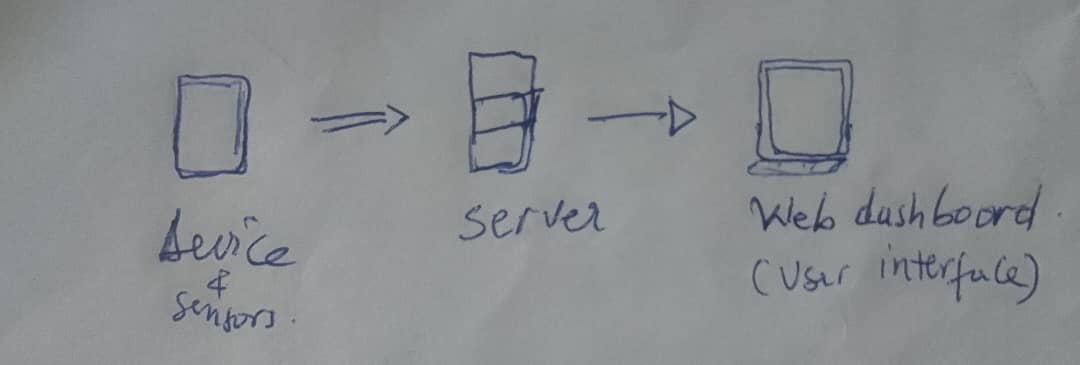
The web dashboard
A web dashboard is an online interface that visually presents key information and data metrics, allowing users to monitor, analyze, and manage various aspects of their business or operations in real-time from any device with internet access.
I have decided to develop a web dashboard to visualize data sent from a device. This device will be equipped with sensors, including the MQ135 and DHT22. The dashboard will be used to display all the data collected by these sensors, providing a comprehensive view for my project.
The code for my dashboard was put my git because it is 41.7MB, this include database and user-friendly dashboard. https://github.com/Wilsonndayisaba/fabacademy-airquality-monitoring/
I initially built the dashboard and tested it locally before pushing it to GitHub.
Tools to use to build backend
- Postgress
- Node Js
Tools to use to User Interface
- Node Js
- Tailwind CSS
- HTML Template Engine handlebars (HBS)
- Chart Js
Dashboard pages developed
You can access the dashboard where it is hosted here: https://fabacademy-airquality-monitoring.onrender.com
How to access the dashboard?
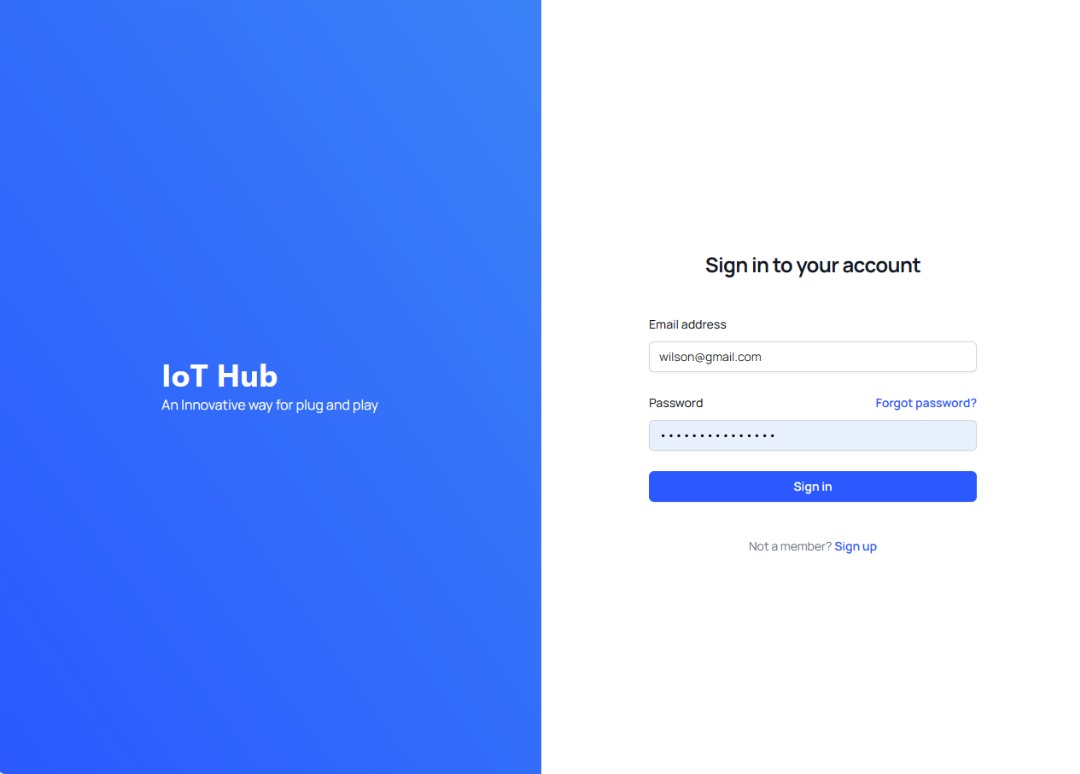
To access the dashboard, it requires login. You can create an account to access the dashboard or use the already created account here: Email Address: ndayisabawilson@gmail.com , password: wilson
Hosted dashboard on render.com
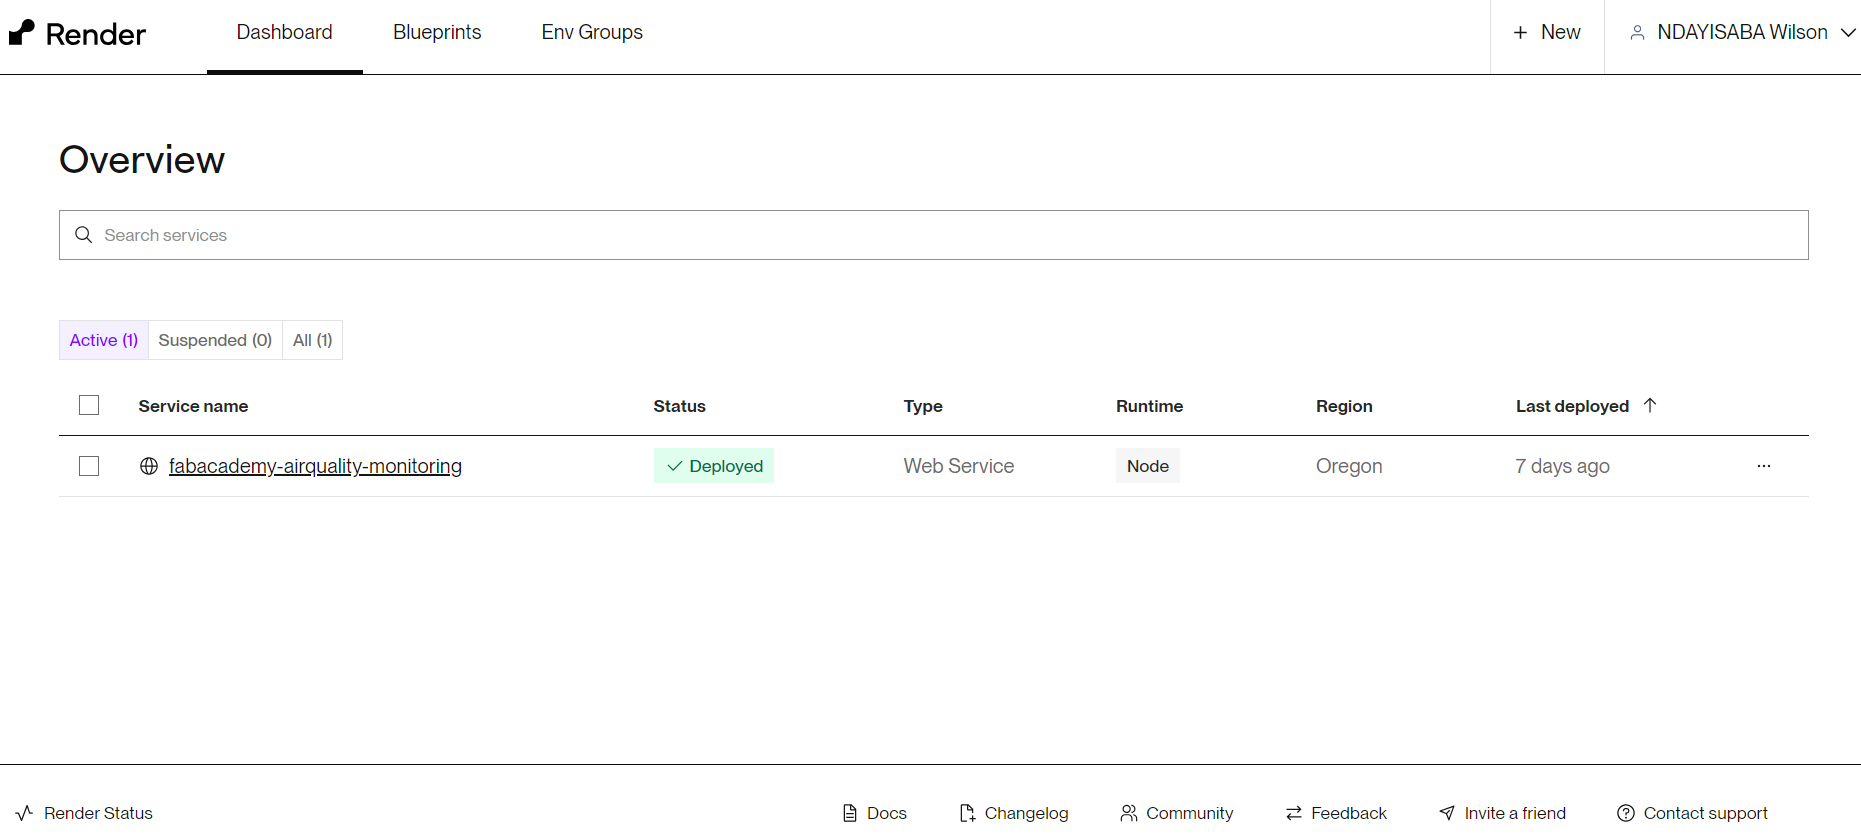
Login page
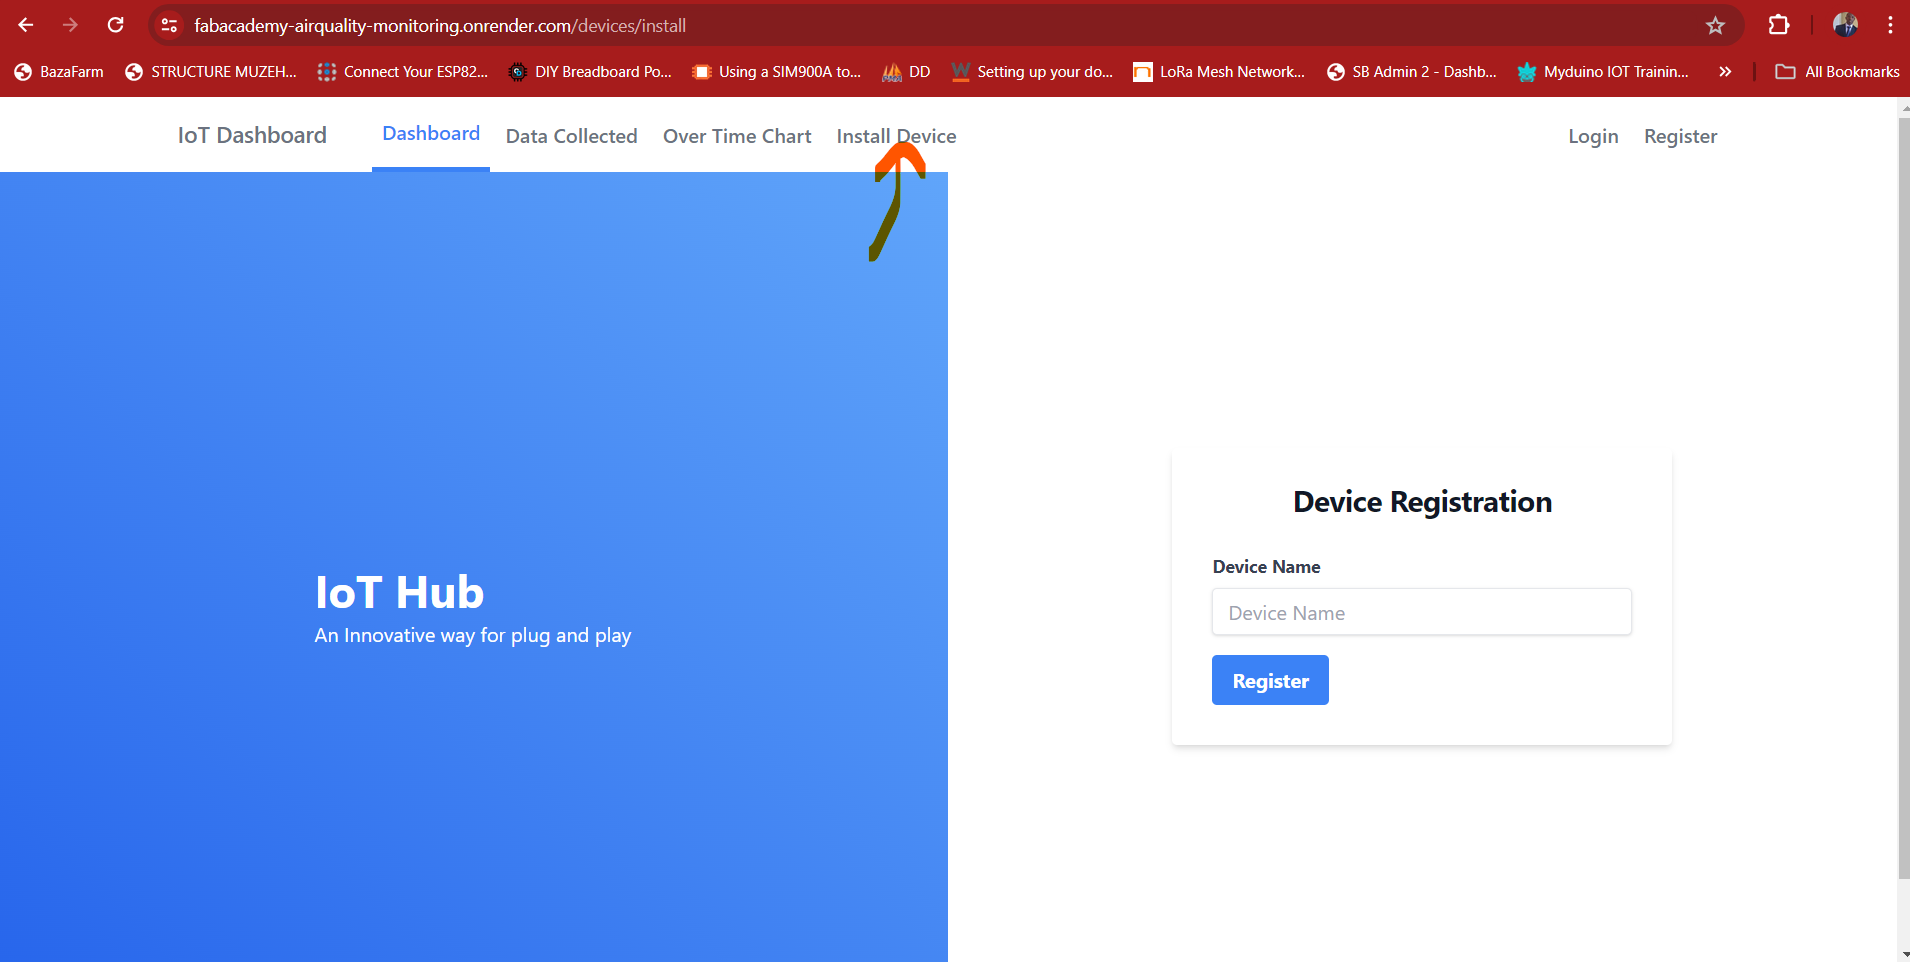
Page of device registration
Dashboard page

All data table

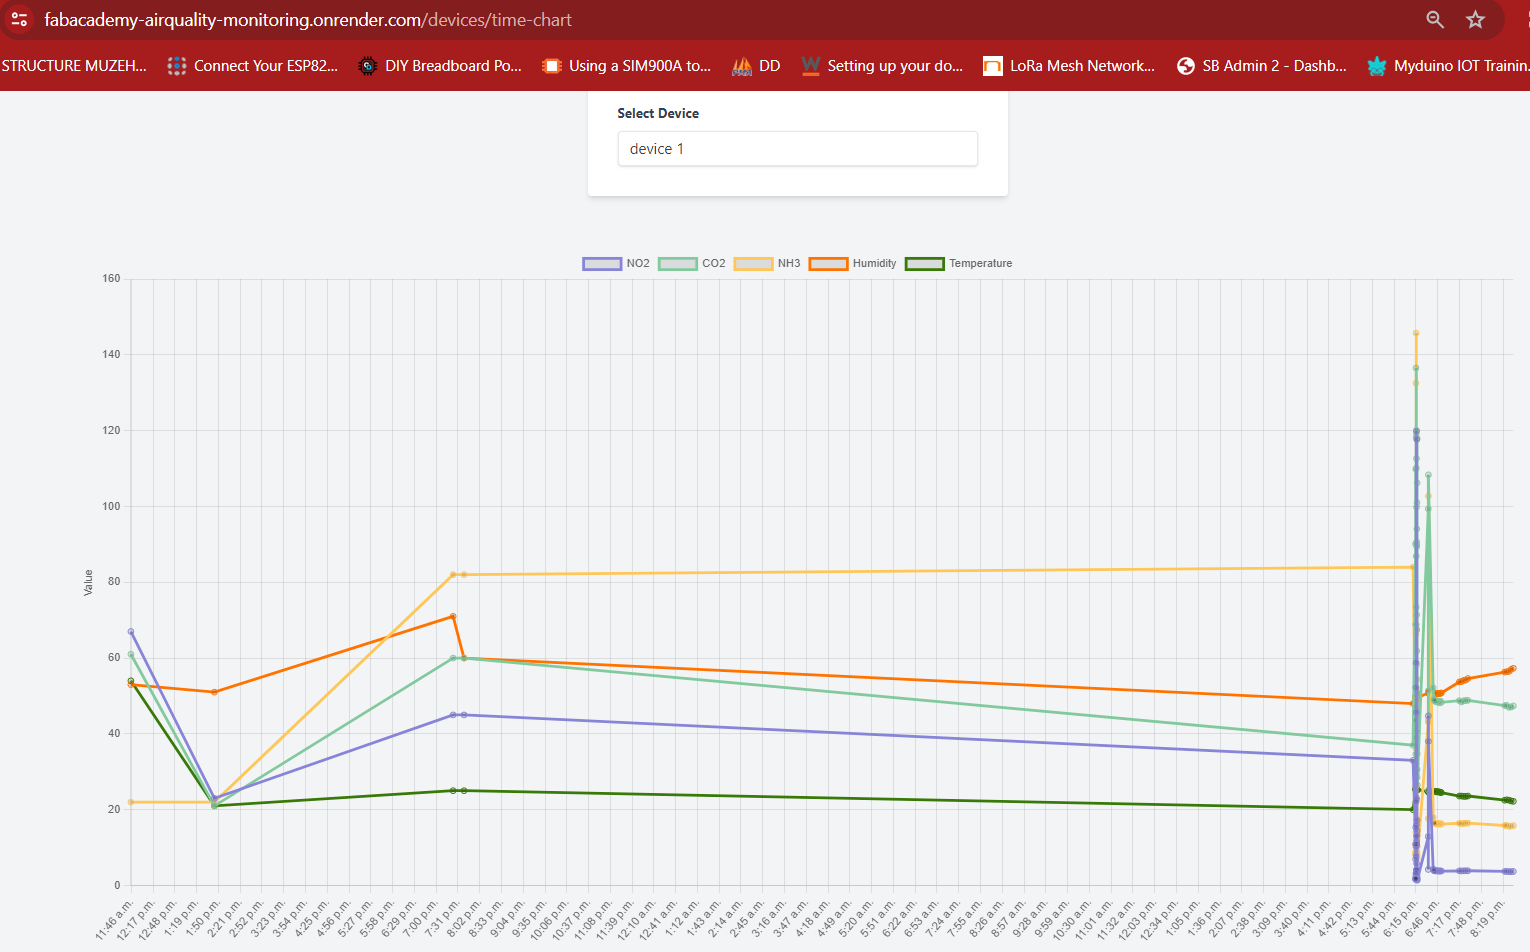
Chart Visualization of all data
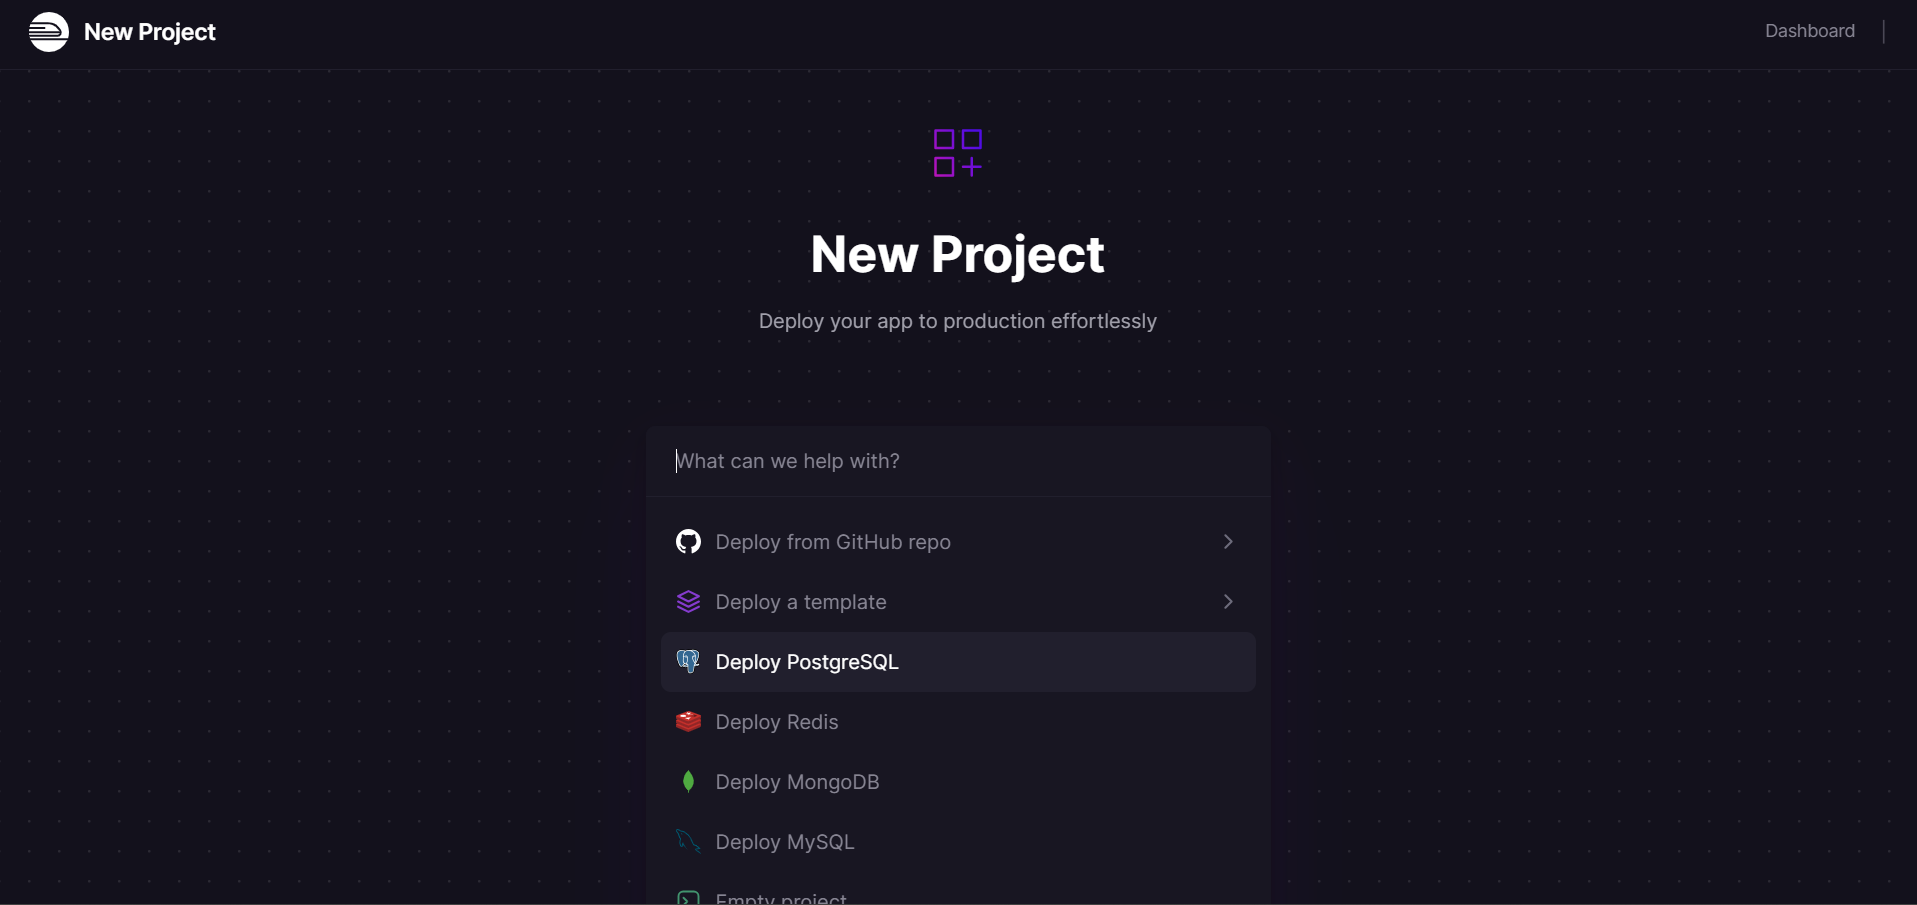
Database hosted on railway.app
Hosting database on built in postgress
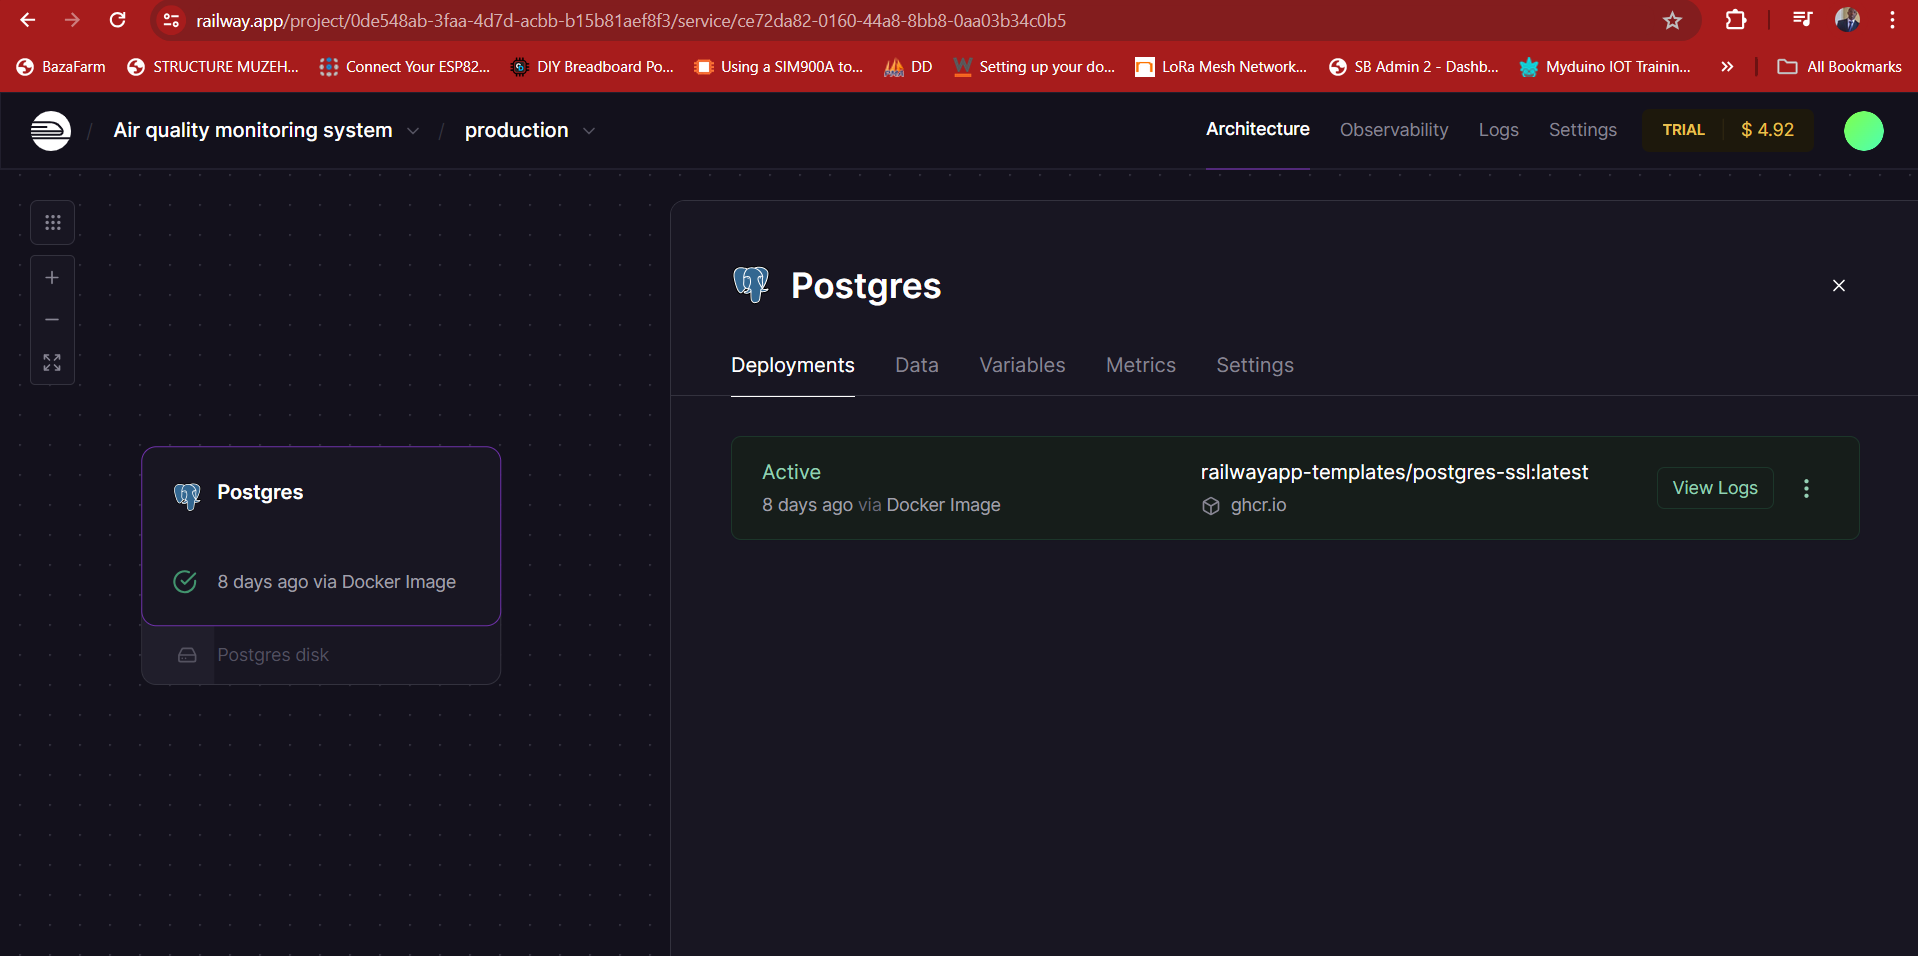
Hosted Database
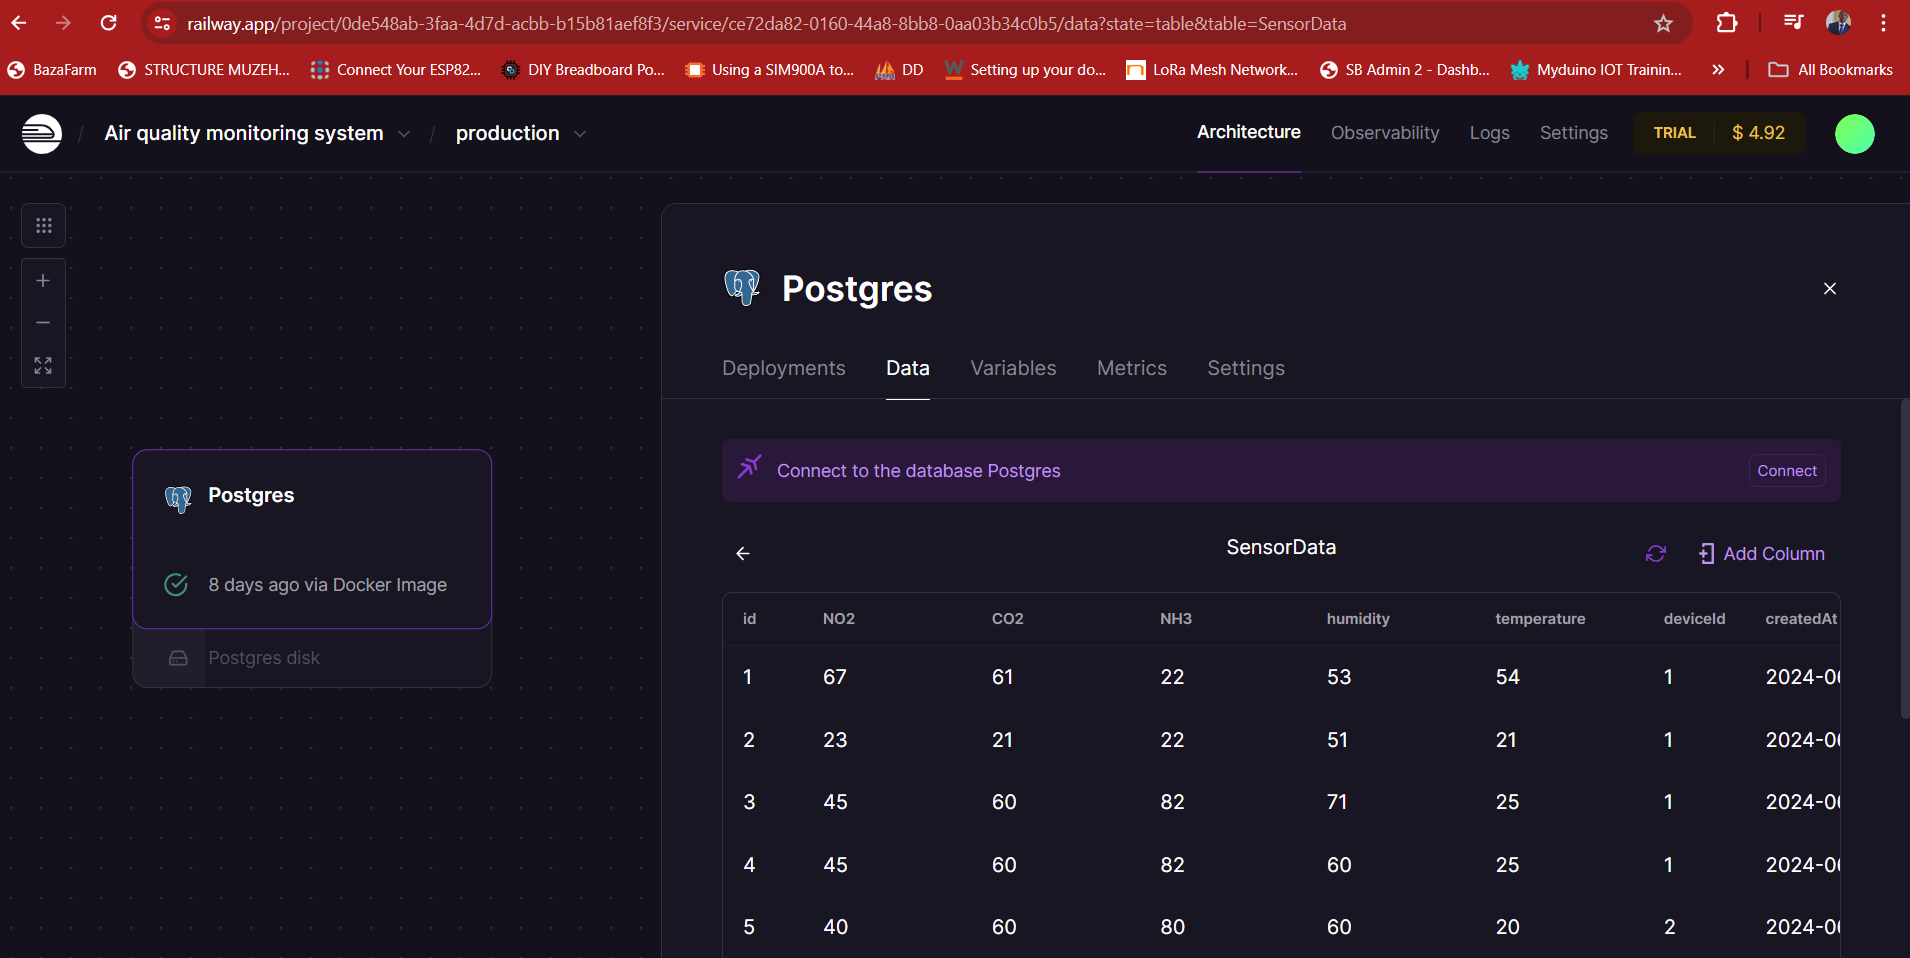
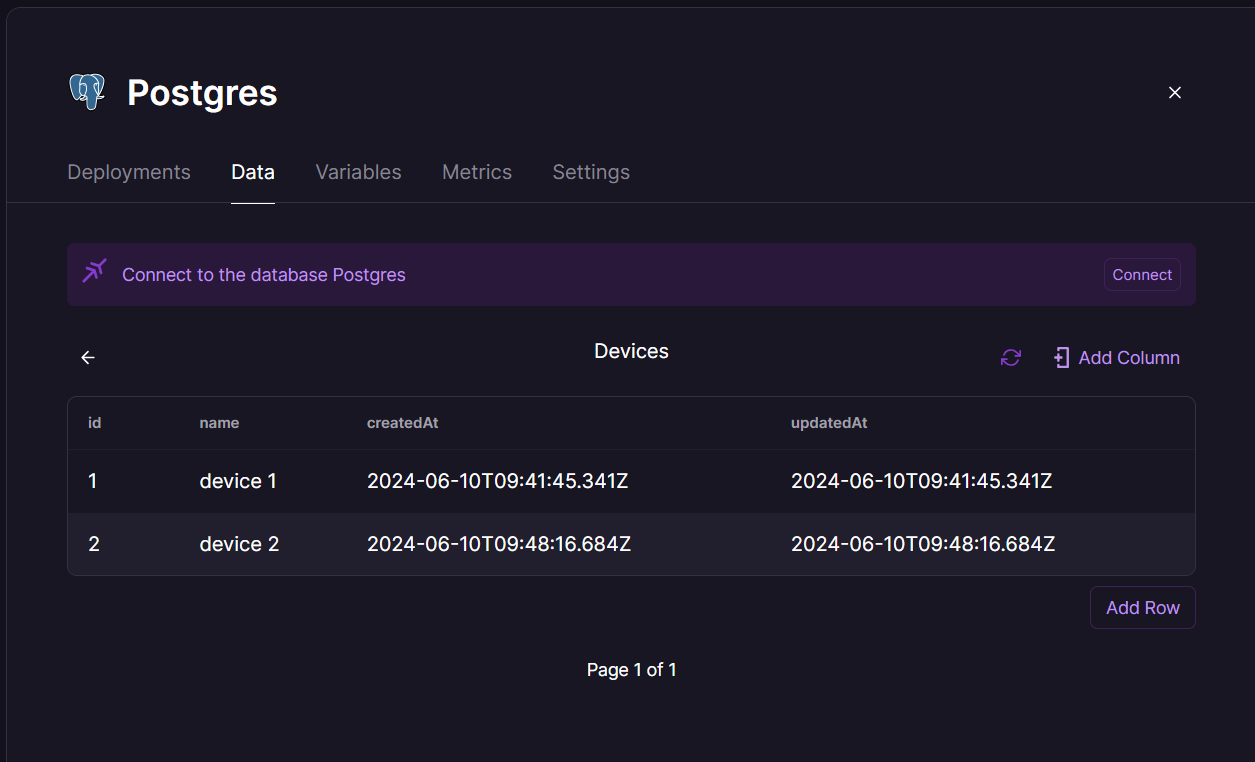
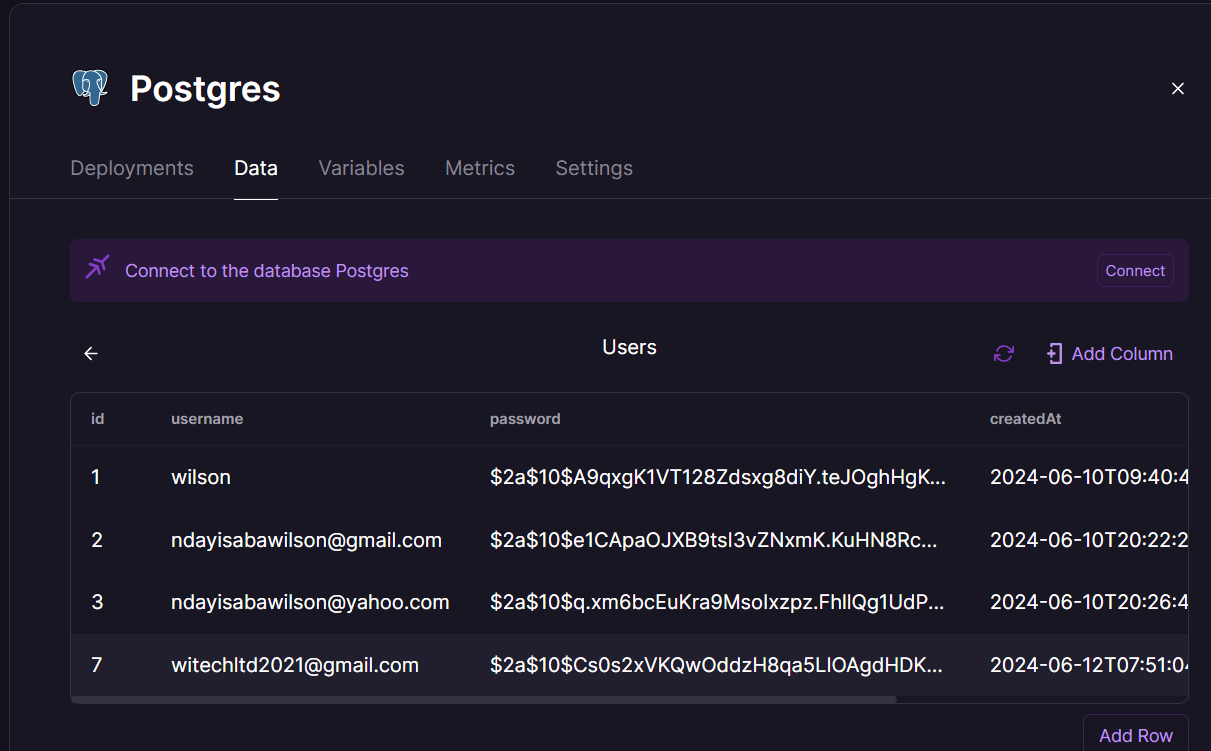
Tables in My Database
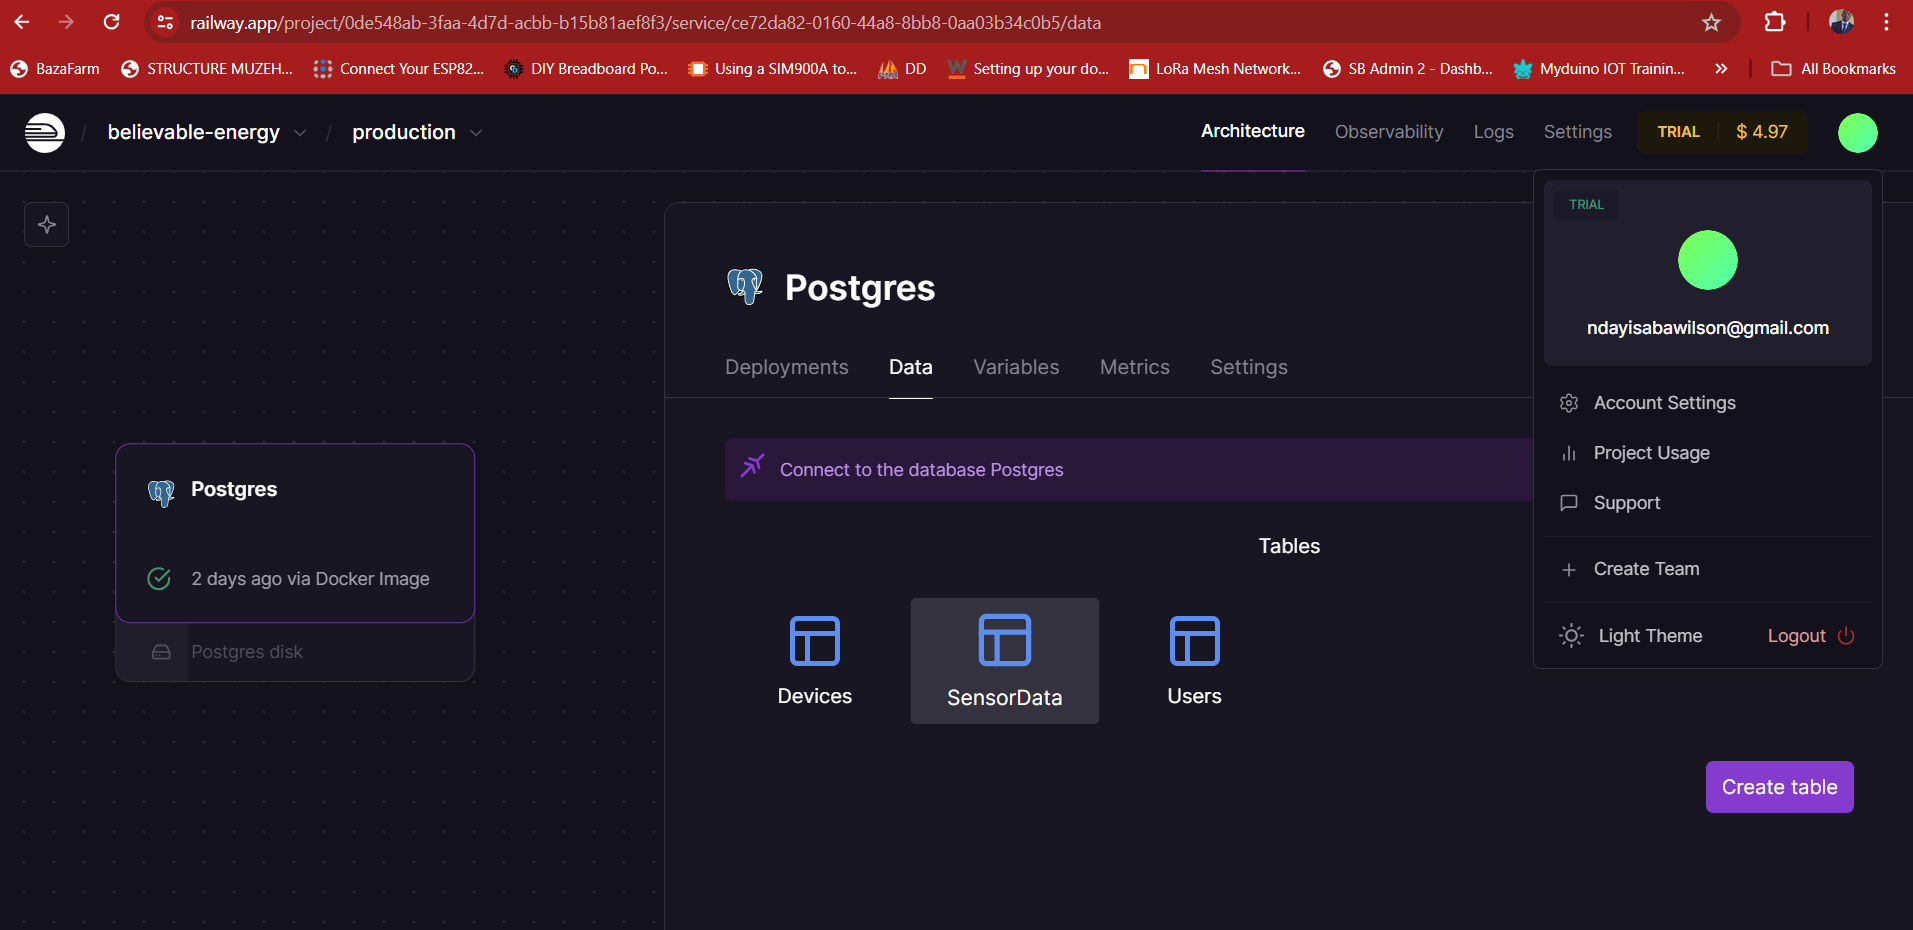
Sensor Data Table
Device Table
Users Table
Source code directory
All the code can be found on my github here: https://github.com/Wilsonndayisaba/fabacademy-airquality-monitoring
PROGRAMMING A DEVICE OF MY PROJECT
Main components of the device
- Seeed Studio XIAO Esp32_C3
- MQ135 Gas Sensor
- DHT22 Sensor
- LCD 20X4 With I2C
Code for the device
                #include <Wire.h>
                #include <LiquidCrystal_I2C.h>
                #include <RTClib.h>
                #include <DHT.h>
                #include <WiFi.h>
                #include <HTTPClient.h>
                #include <ArduinoJson.h>

                #define DHTPIN D2
                #define DHTTYPE DHT22
                #define MQ135_PIN A0
                #define FAN_PIN D9
                #define LAMP_PIN D10

                const char* ssid = "xxxxxxxxx"; // Here you have to put username of your WiFi
                const char* password = "xxxxxxxxx"; // Put Password of Your WiFi

                const char* serverName = "https://fabacademy-airquality-monitoring.onrender.com/sensordata";

                DHT dht(DHTPIN, DHTTYPE);
                RTC_DS3231 rtc;
                LiquidCrystal_I2C lcd(0x27, 20, 4); // Adjust the address if needed

                float Ro = 30.7;           // Initial Ro value, which will be calibrated which sensor resistor recorded
                float RL = 10.0;           // Load resistance on the board
                float cleanAirFactor = 3.6; // Sensor's Rs/Ro ratio in clean air

                unsigned long lastTime = 0;
                unsigned long timerDelay = 180000; // 180 seconds

                void setup() {
                  Serial.begin(115200);
                  lcd.init();
                  lcd.backlight();
                  dht.begin();

                  if (!rtc.begin()) {
                    Serial.println("Couldn't find RTC");
                    while (1);
                  }

                  if (rtc.lostPower()) {
                    rtc.adjust(DateTime(F(__DATE__), F(__TIME__)));
                  }

                  Ro = calibrateMQ135(); // Calibrate MQ135 sensor

                  pinMode(FAN_PIN, OUTPUT);
                  pinMode(LAMP_PIN, OUTPUT);

                  WiFi.begin(ssid, password);

                  while (WiFi.status() != WL_CONNECTED) {
                    delay(1000);
                    Serial.println("Connecting to WiFi...");
                  }

                  Serial.println("Connected to WiFi");
                }

                void loop() {
                  DateTime now = rtc.now();

                  float sensorResistance = getResistance();
                  float ratio = sensorResistance / Ro;

                  // Estimate gas concentrations
                  float co2 = calculateCO2(ratio);
                  float no2 = calculateNO2(ratio);
                  float nh3 = calculateNH3(ratio);

                  // Read DHT22 sensor
                  float humidity = dht.readHumidity();
                  float temperature = dht.readTemperature();

                  // Display on LCD
                  lcd.setCursor(0, 0);
                  lcd.print("Time: ");
                  lcd.print(now.hour(), DEC);
                  lcd.print(':');
                  lcd.print(now.minute(), DEC);
                  lcd.print(':');
                  lcd.print(now.second(), DEC);

                  lcd.setCursor(0, 1);
                  lcd.print("Date: ");
                  lcd.print(now.year(), DEC);
                  lcd.print('/');
                  lcd.print(now.month(), DEC);
                  lcd.print('/');
                  lcd.print(now.day(), DEC);

                  lcd.setCursor(0, 2);
                  lcd.print("CO2: ");
                  lcd.print(co2);
                  lcd.print(" ppm");

                  lcd.setCursor(0, 3);
                  lcd.print("NO2: ");
                  lcd.print(no2);
                  lcd.print(" ppm");

                  lcd.setCursor(0, 4);
                  lcd.print("NH3: ");
                  lcd.print(nh3);
                  lcd.print(" ppm");

                  lcd.setCursor(0, 5);
                  lcd.print("Temp: ");
                  lcd.print(temperature);
                  lcd.print(" C");

                  lcd.setCursor(0, 6);
                  lcd.print("Humidity: ");
                  lcd.print(humidity);
                  lcd.print(" %");

                  // Control actuators based on time
                  if ((now.hour() > 18 || (now.hour() == 18 && now.minute() >= 30)) && now.hour() < 24) {
                    digitalWrite(FAN_PIN, HIGH);
                    digitalWrite(LAMP_PIN, HIGH);
                  } else {
                    digitalWrite(FAN_PIN, LOW);
                    digitalWrite(LAMP_PIN, LOW);
                  }

                  // Send data to server every 60 seconds
                  if (WiFi.status() == WL_CONNECTED && (millis() - lastTime) > timerDelay) {
                    HTTPClient http;
                    http.begin(serverName);
                    http.addHeader("Content-Type", "application/json");

                    StaticJsonDocument<200> doc;
                    doc["NO2"] = round(no2 * 100) / 100.0;
                    doc["CO2"] = round(co2 * 100) / 100.0;
                    doc["NH3"] = round(nh3 * 100) / 100.0;
                    doc["humidity"] = round(humidity * 100) / 100.0;
                    doc["temperature"] = round(temperature * 100) / 100.0;
                    doc["deviceId"] = "1";

                    String jsonData;
                    serializeJson(doc, jsonData);

                    int httpResponseCode = http.POST(jsonData);

                    if (httpResponseCode > 0) {
                      String response = http.getString();
                      Serial.println(httpResponseCode);
                      Serial.println(response);
                    } else {
                      Serial.print("Error on sending POST: ");
                      Serial.println(httpResponseCode);
                    }

                      http.end();
                      lastTime = millis();
                    }

                    delay(1000); // Update every second
                  }

                  // Calculate resistance of the sensor
                  float getResistance() {
                    int sensorValue = analogRead(MQ135_PIN);
                    float voltage = sensorValue / 4095.0 * 3.3;
                    float resistance = (3.3 - voltage) * RL / voltage;
                    return resistance;
                  }

                  // Calibrate the MQ135 sensor
                  float calibrateMQ135() {
                    float val = 0;

                    for (int i = 0; i < 50; i++) {
                      val += getResistance();
                      delay(100);
                    }
                    val = val / 50.0;
                    return val / cleanAirFactor;
                  }

                  // Placeholder functions for gas concentration calculations
                  float calculateCO2(float ratio) {
                    // Use the appropriate formula based on the MQ135 datasheet
                    return pow(10, ((-0.42 * log10(ratio)) + 1.92));
                  }

                  float calculateNO2(float ratio) {
                    // Use the appropriate formula based on the MQ135 datasheet
                    return pow(10, ((-0.71 * log10(ratio)) + 0.98));
                  }

                  float calculateNH3(float ratio) {
                    // Use the appropriate formula based on the MQ135 datasheet
                    return pow(10, ((-0.57 * log10(ratio)) + 1.53));
                  }
Here is the result in Serial Monitor after waiting for some hours to wait for sensor to be stable
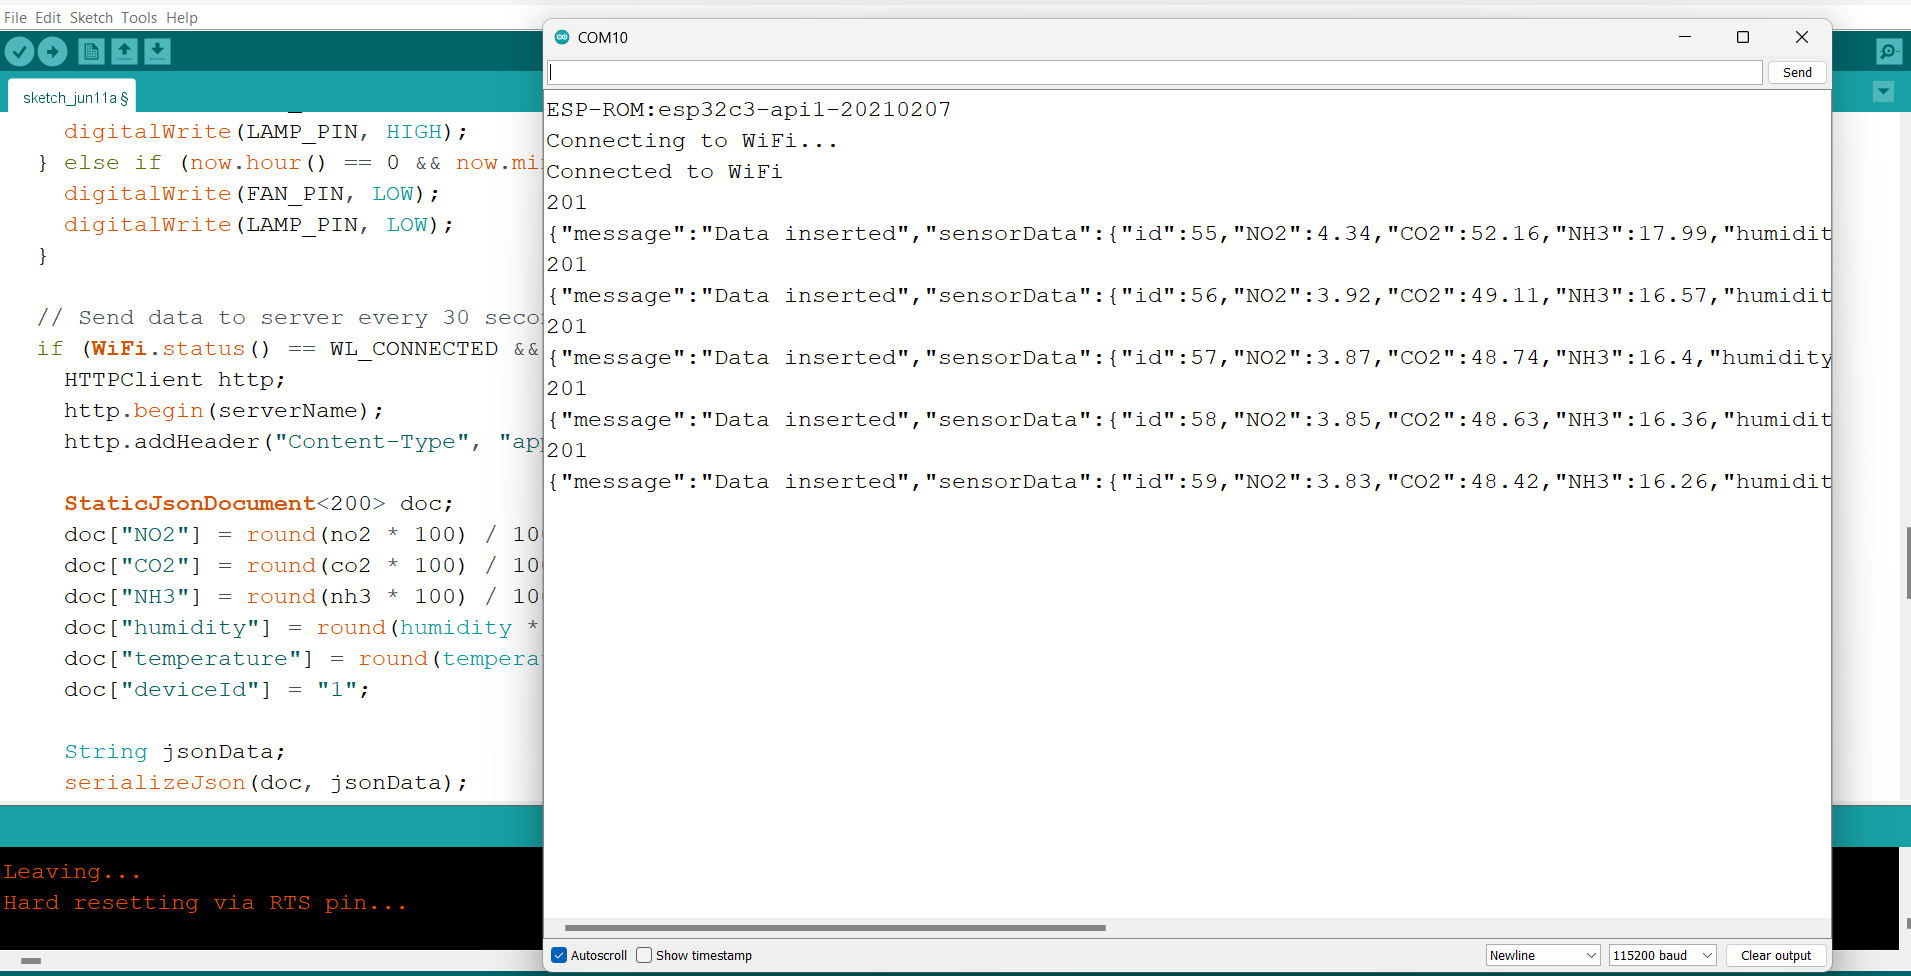
The image above shows how the device is sending data in the cloud with the code shown
Original files below;
-
All the dashboard code is available on GitHub here: https://github.com/Wilsonndayisaba/fabacademy-airquality-monitoring
- Device code in Arduino IDE