14. Interface and application programming


An interface is what makes the bridge between a computer system and the users. It's usually digital and how users can interact with the machines. Interfaces can be visual (apps and screens) or for example voice (Alexa). There are different code languages that allow us to generate interfaces and they can be combined together too. For example, an interface can be based on javascript but also uses HTML and CSS.

This week's class taught us about a few programming languages (javascript, python, etc) that allow us to program microcontrollers as inputs or outputs into an application/interface.


Group assignment

There are many programming languages and software that allow us to create interactive applications, at the end it comes down to what project we are working on and what output we want to have. For example, if I want to create something within the VR (Virtual Reality) world I would use Blender/Python due to the potential it has to work with 3D objects. If I wanted to work with a smart house system I would definitely use NODE-RED. There is also some software that allows us to create apps like the MIT app inventor and Blynk.

For my project, I decided to use Processing as I wanted to do something more visual and artistic for this week and also for my final project.

→ Group Page here


The input with a capacitive sensor and Arduino IDE

I have been trying to use every week's assignment to explore things that are close to my final project and this week was no different. I decided to use the input work I have done before as the input for my interface.

This image wanted to break free...

The capacitive sensor

So I started by getting back to my board and the mini board I did for the inputs week. I used a capacitive sensor (using my own body) to be the input on the circuit. A capacitive sensor is able to collect and hold a charge of energy. A capacitive circuit changes its charge if a finger touches it because the human body also holds the charge of energy, therefore the capacitive circuit will increase the charge if we touch it.


This image wanted to break free...

Getting the input data right

I uploaded the same code I used before, but this time I needed to get only the reading of the energy charge values, so I went ahead and removed the time and the line breaks, and so on until all I got was the value readings separated by line break.


This image wanted to break free...

The serial port

Now, before I went into Processing I needed to check the serial port I was using. We can only use a serial port at the time and I needed to access this data coming from the SAMD11 in my board from Processing, therefore I needed to access the serial my SAMD11 was using to send the data8.


The interface output with Processing

Processing is a free, open-source software that enables visualizing data through programming. Processing is based in JAVA and it has an incredible community that makes it really easy to find libraries and tutorials.

This image wanted to break free...

Getting data from Arduino IDE in Processing through the serial port

To get the data from serial coming to Processing I first imported the serial library "processing.serial.*", then I defined a Serial variable "Serial myPort;" and then in my setup function, I defined the serial port address and the baud rate in the variable defined before.

Then in the loop function, I said that if the serial port was available to fetch data from it I would then translate it into a number (instead of a string), using teh function "Integer.parseInt()". I also said that the values would be read together until there is a line break (myPort.readStringUntil('\n')).


This image wanted to break free...

Visualizing the data

I used an example from the class to test the input with a visualization. I knew that when the capacitive sensor was not being touched when the values were around 380 and when it is touched they are above that. So I adapted the code adding an if condition saying that if the values are above 380 then the color of the rectangle was red.


This image wanted to break free... This image wanted to break free... This image wanted to break free...

Visualizing the data using a simple particle system

So, now it was time to do something close to what I could have for my final project, I wanted to have a more ethereal animation that could represent the touching in the sensor, so I used a Processing example, the simple particle system, and changed a few things.

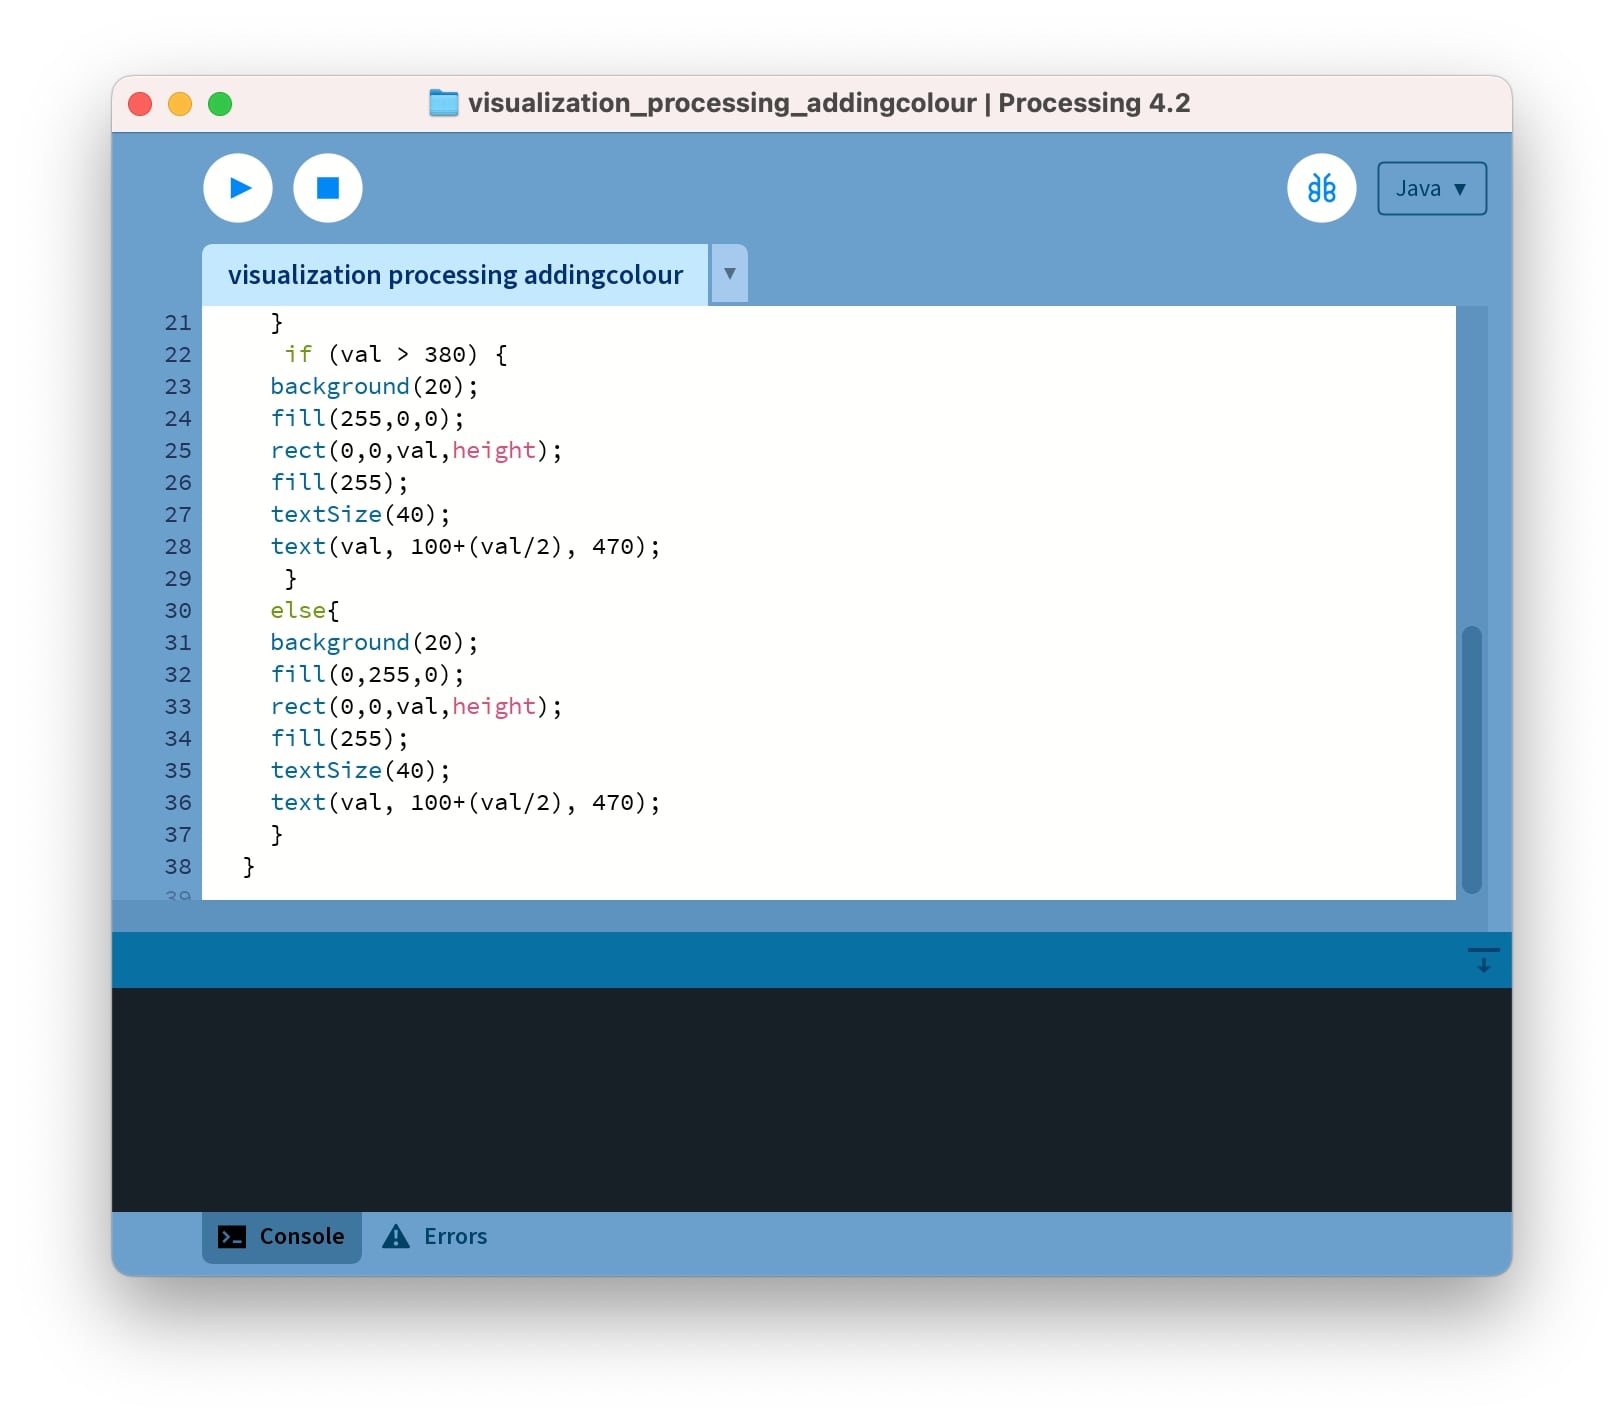
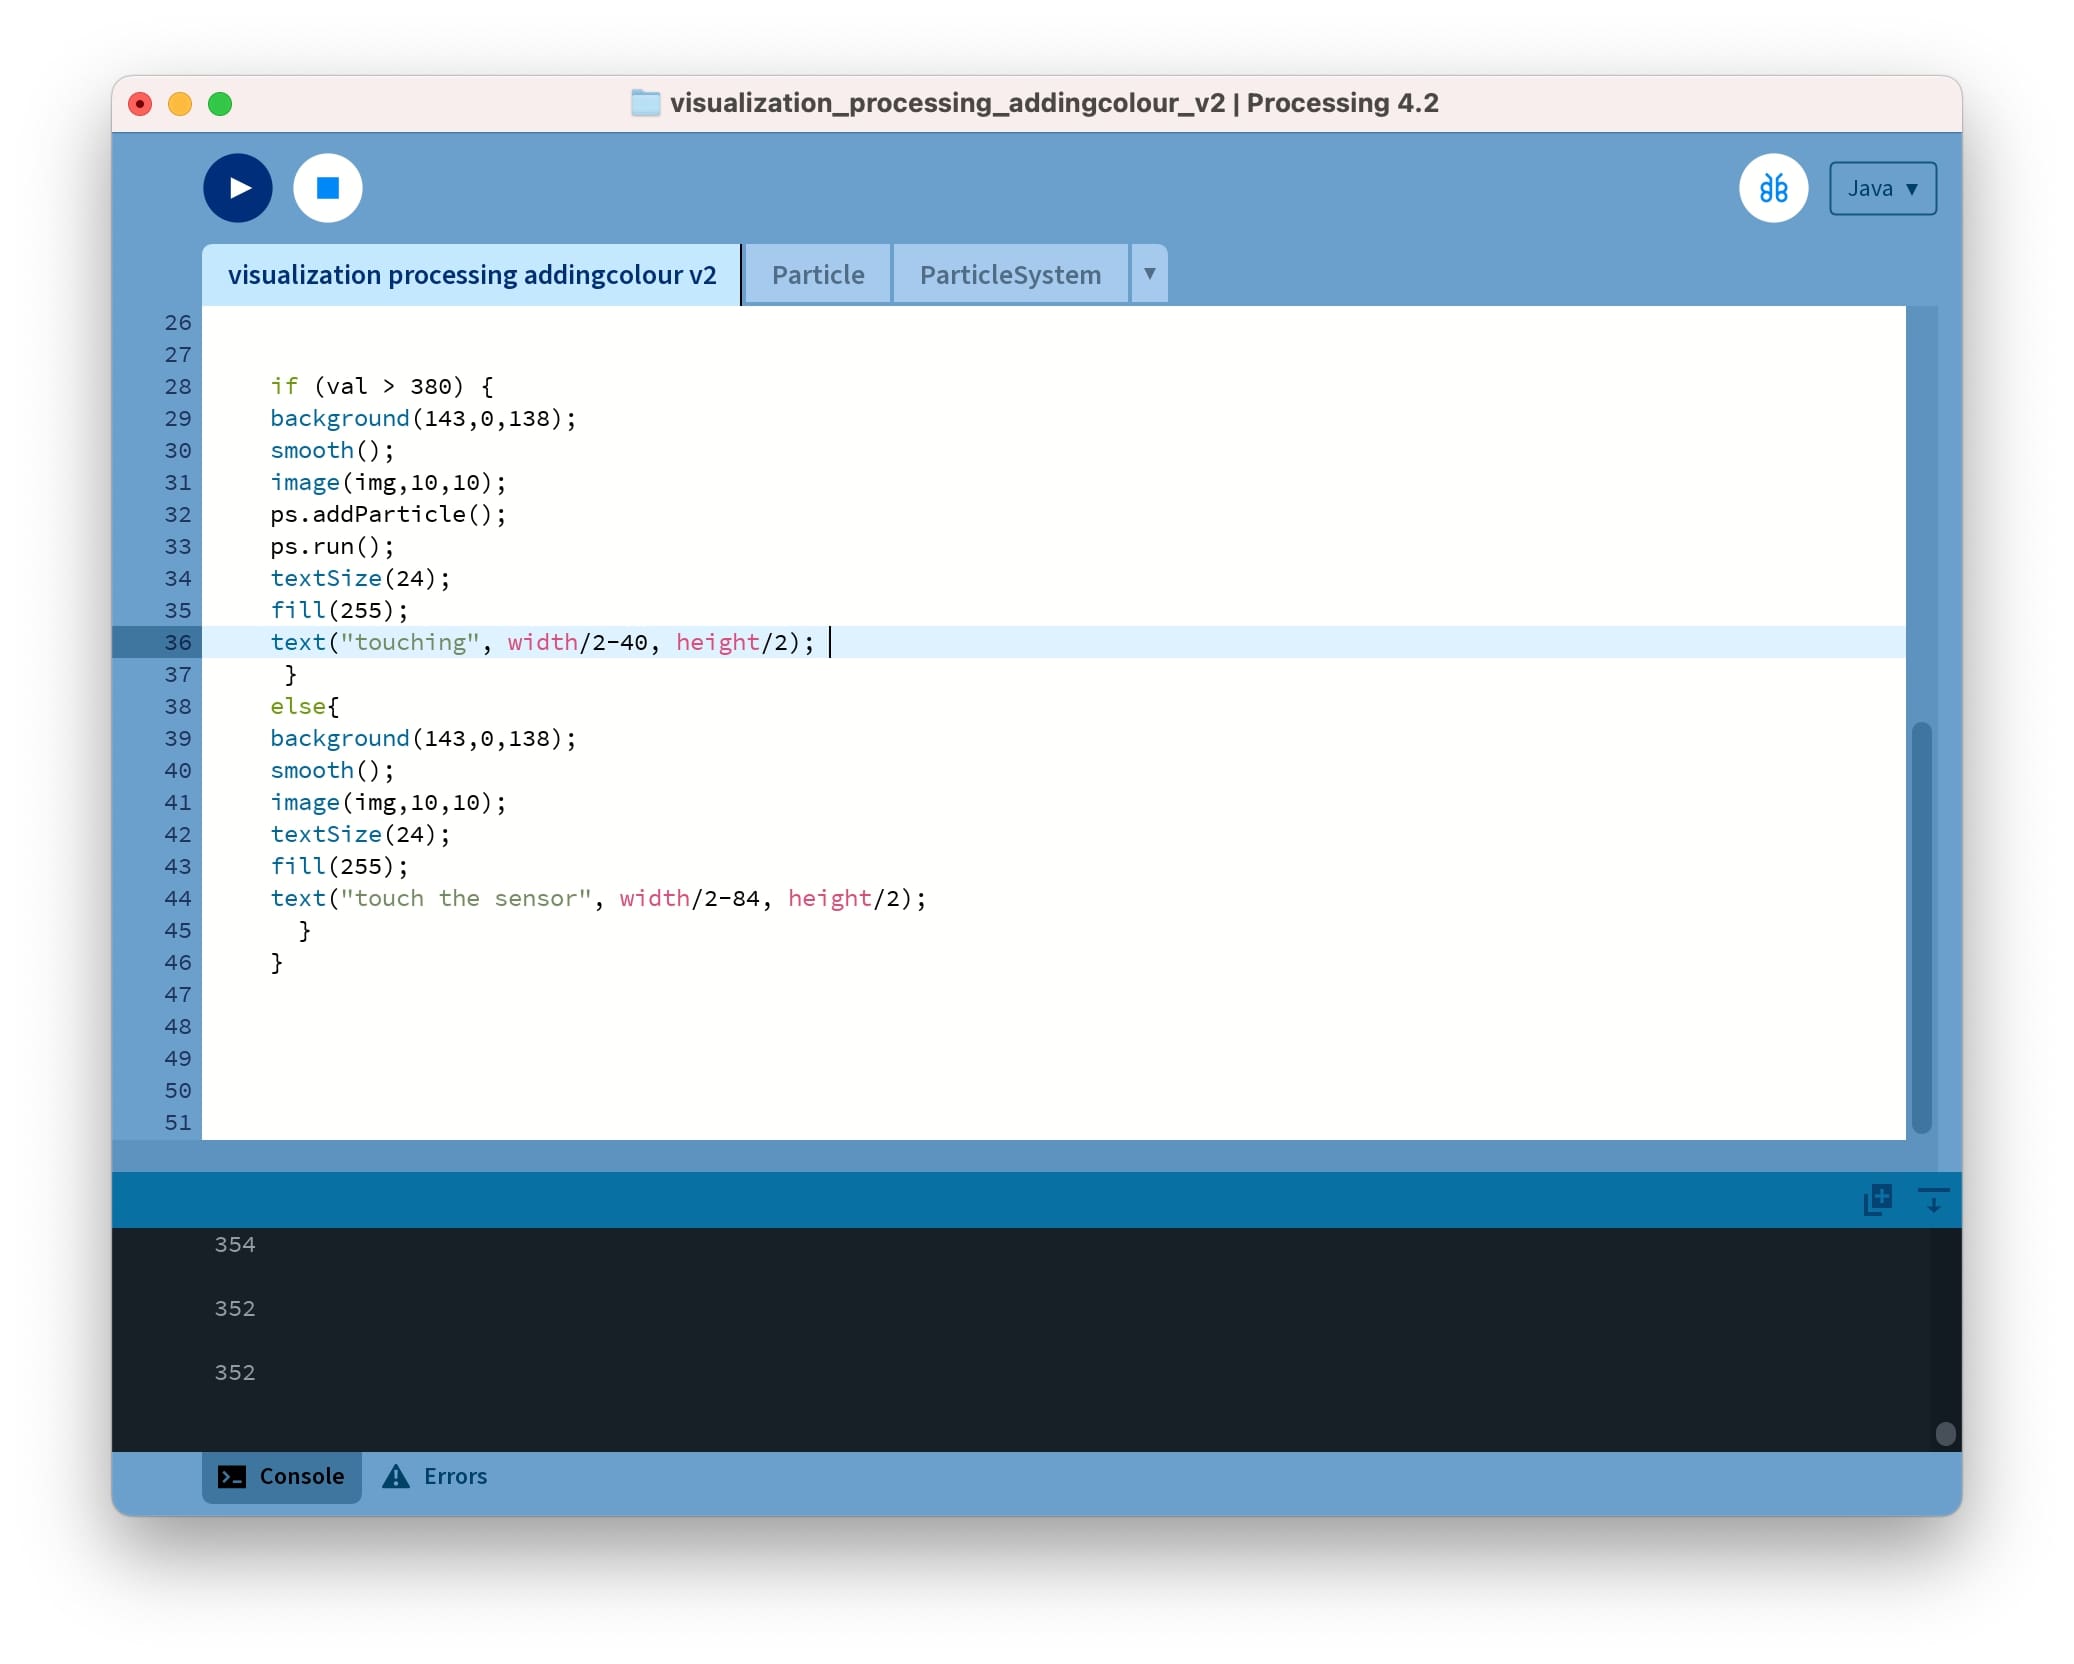
I used the same logic has before using an if condition, but this time what changed was what was happening when touched. When touched the particle system would start, if not touched there was nothing on the screen.

I also added text, envisioning that it could be displayed as an installation inviting people to interact with it. To add the text I check this example.

I also wanted to add my litle eye icon to this project (the same one I have on my website and PCBs), so I folowed this example to add it.

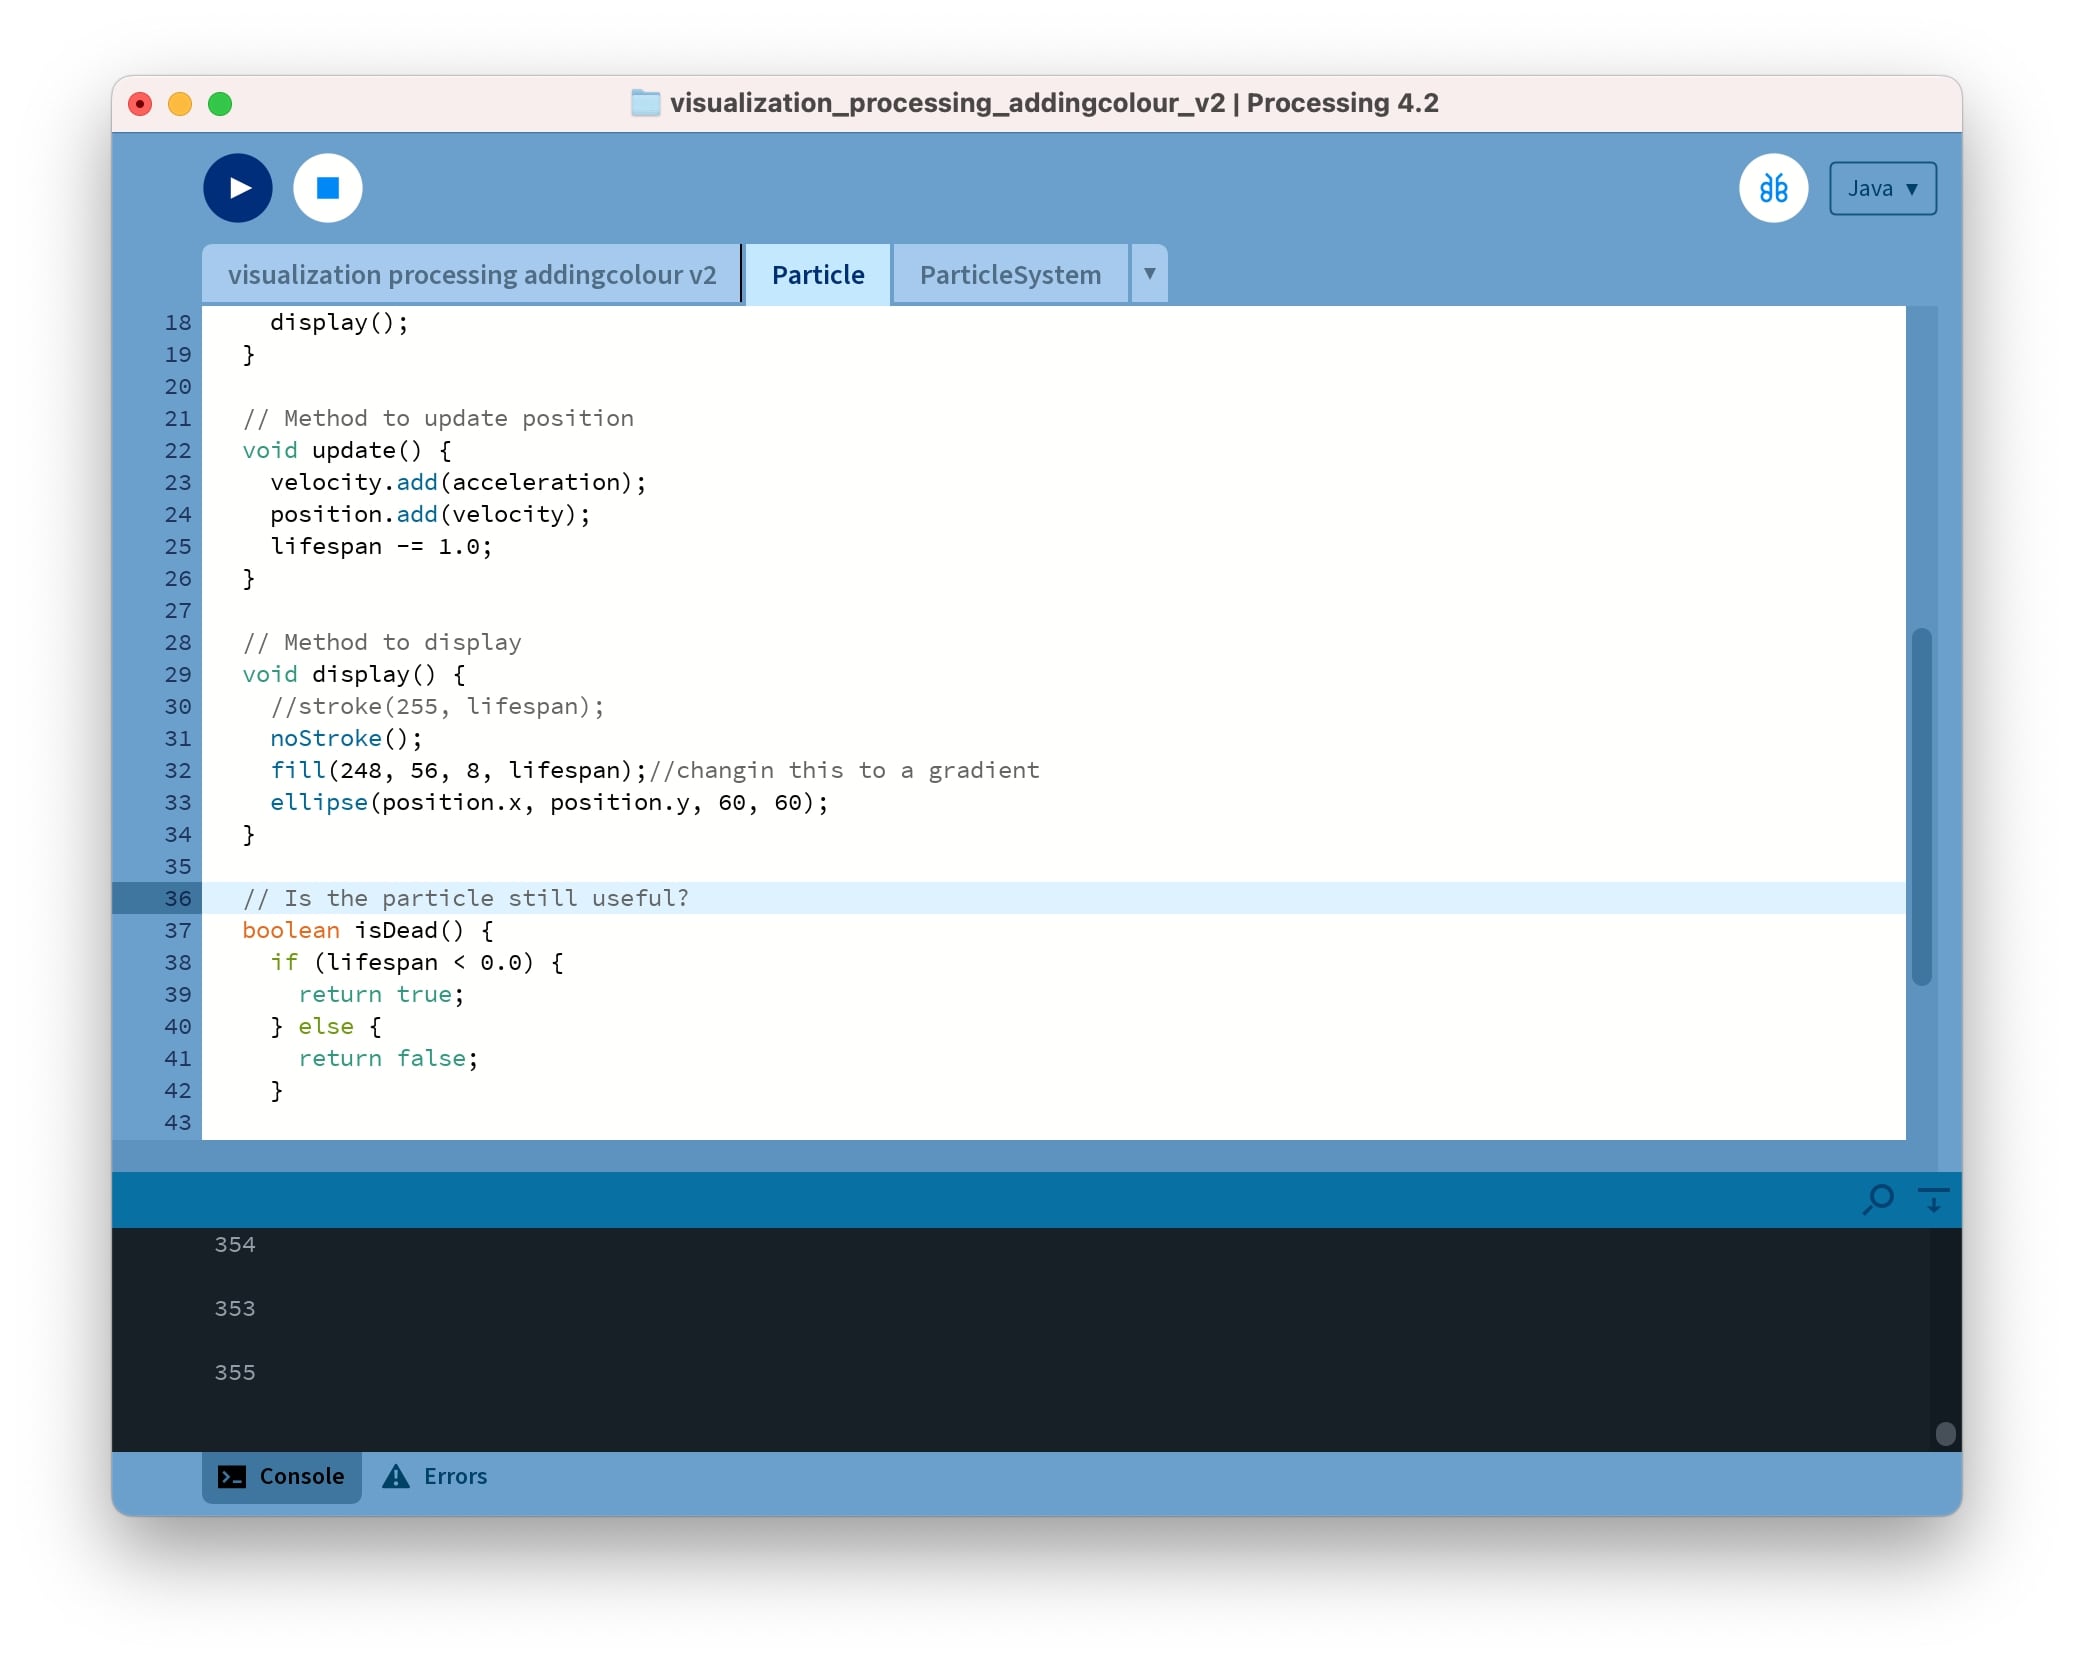
For this code, we use 2 extra files, the particles, and the particle system (class that holds all the particles). In the particle file, some variables are defined so that each particle has a lifespan, velocity, acceleration, and position. Those values will create the movement for each individual particle being created.

There are 3 functions here, one to update the position (because they are always in movement), another function to display the particle (in this case it draws an ellipse), and another one to check if the particle is not viewed anymore so that we can remove it.

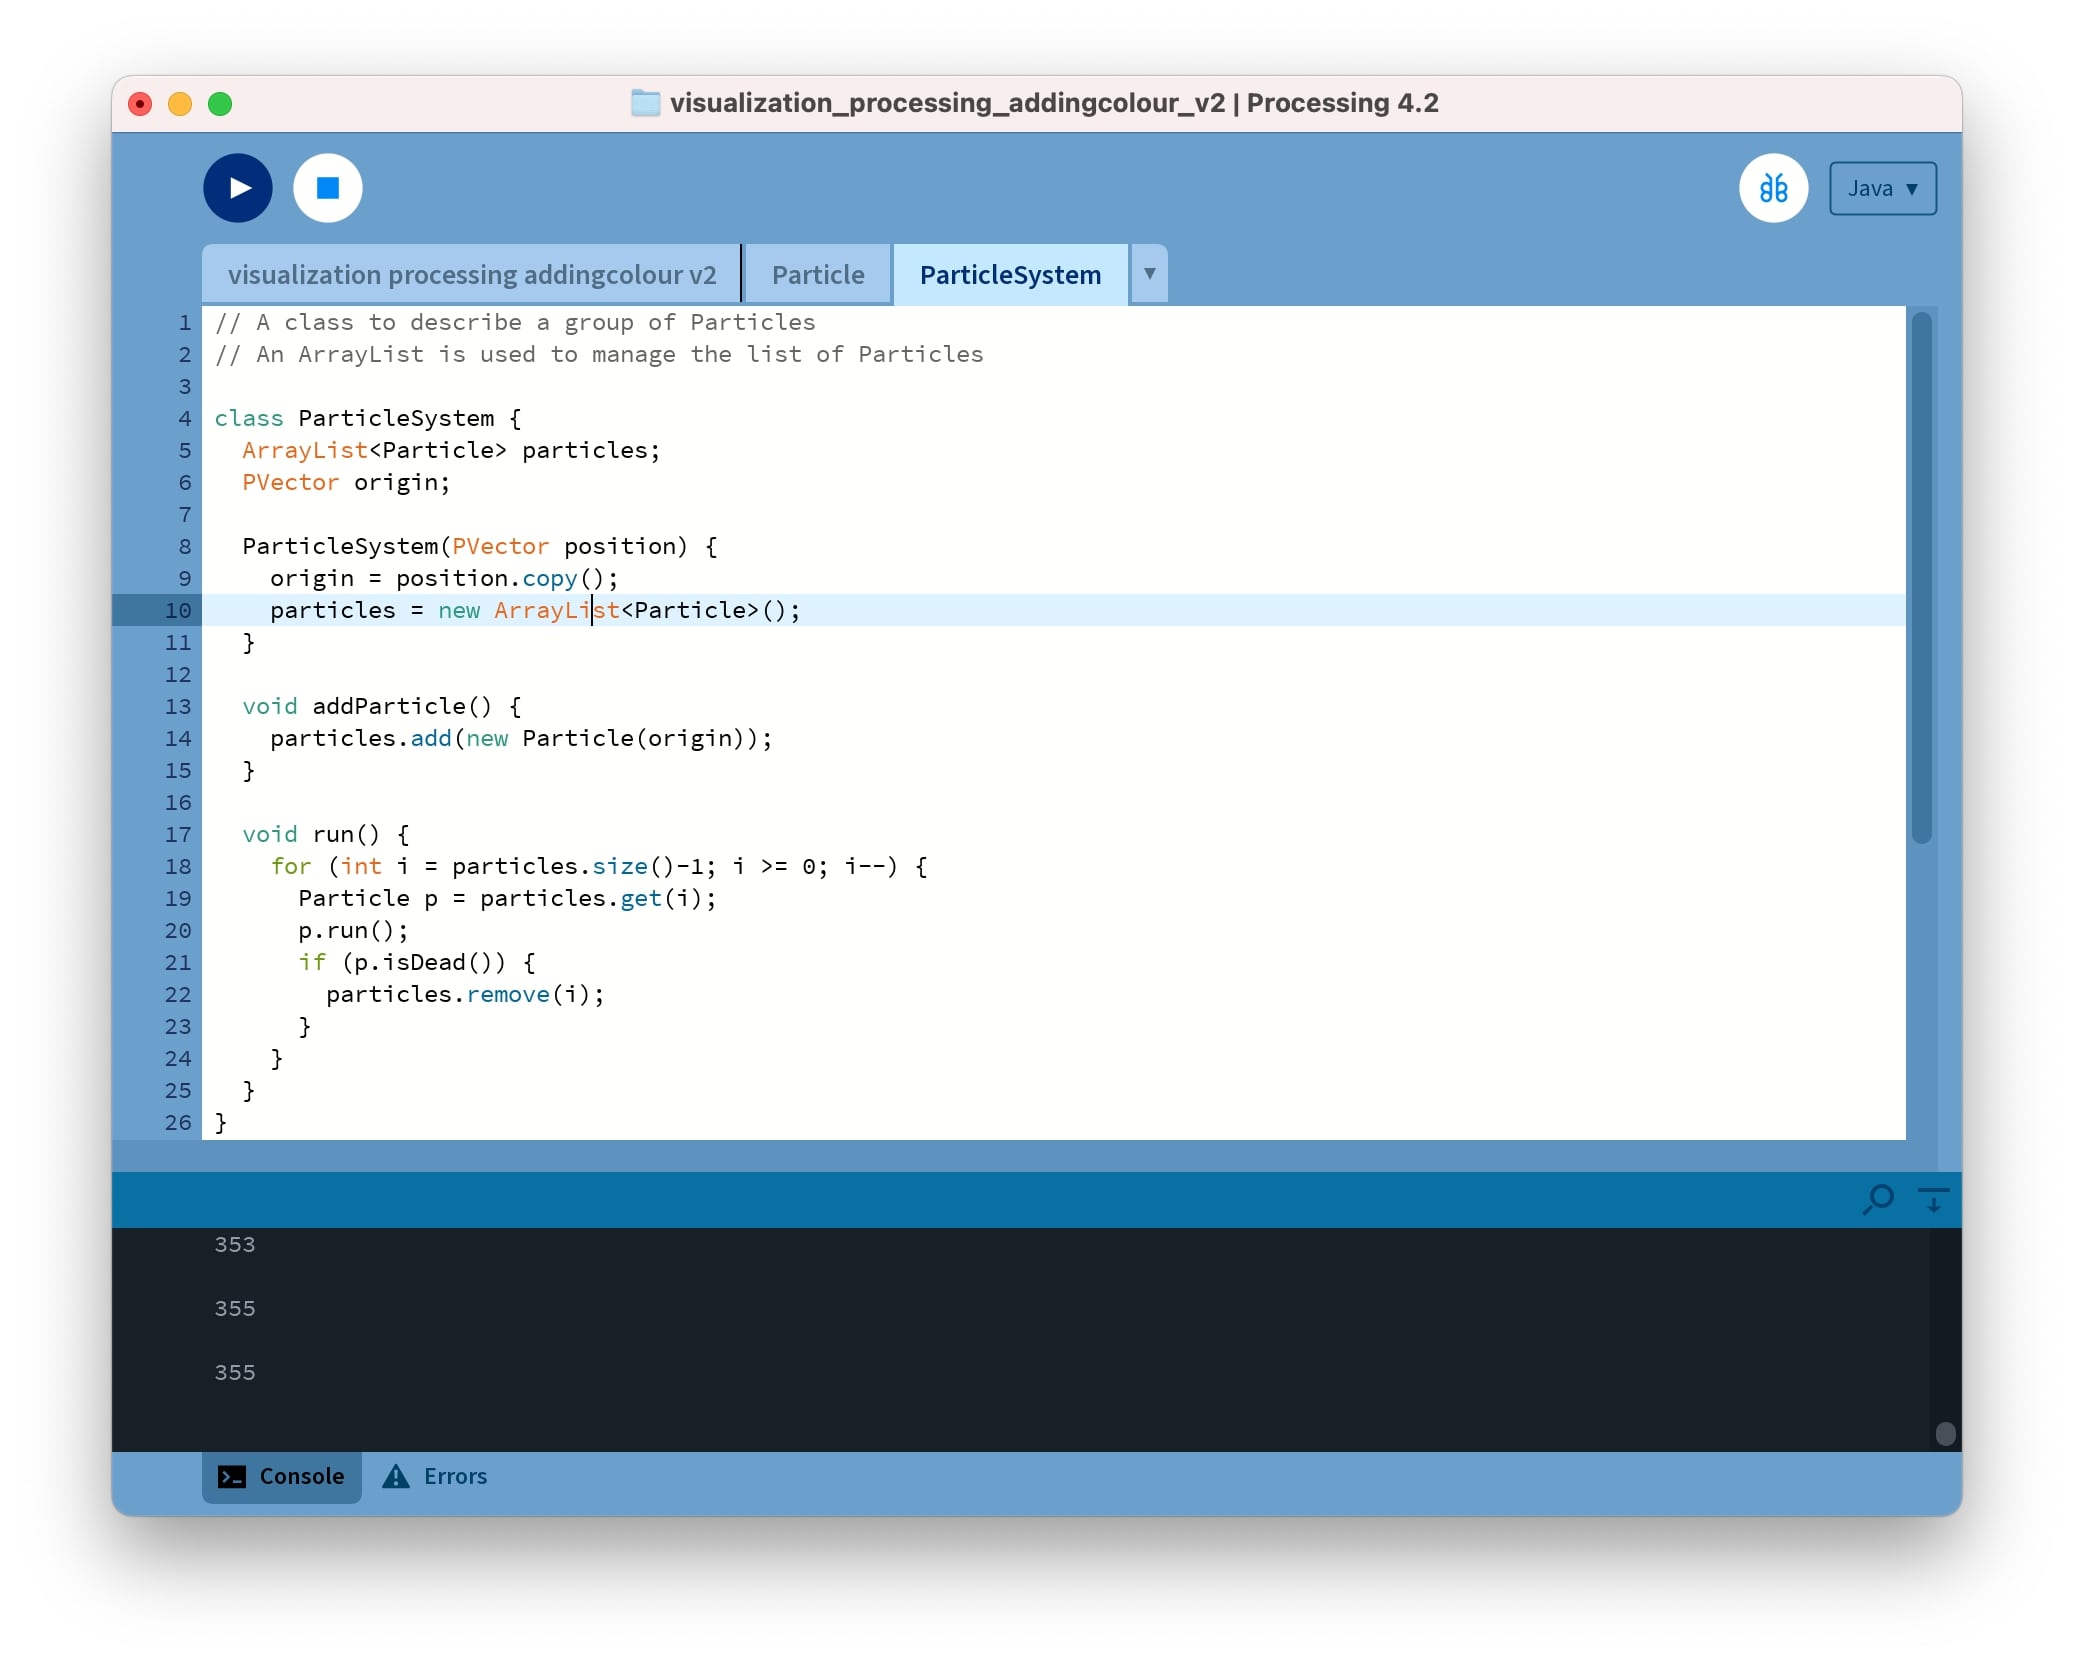
In the class ParticleSystem we define it. So we have a function to add particles (the same ones defined before) and position and for how long this system should run (otherwise it keeps on filling the screen with particles).

The result

So then I just run the code and it worked really nice!


→ Files here


Reflection

I really liked this week, probably because of my background as a designer its easier for me to get more excited with visual outcomes I guess. Also just has Blender, Processing was something I worked with 20 years ago in University so I was really happy to put my hands back again into it! I probably will continue exploring it after.


Final project and interface and application programming

I see using this for visualizing color depending on the input in my hybrid musical instrument, maybe even some words, I will do this by mapping out the data coming from the input device, which will be a capacitive sensor.