Appearance
Final Project - Bio-signal Data Collection & Analyzation Tool Kit for Motion Sickness Prediction
In this webpage I present the detail work in my final project - How to build a Bio-signal Data Collection & Analyzation Tool Kit for Motion Sickness Prediction. The detail making process for this project is documented in my system integration site.
Final Result
Motion sickness has long been recognized as an important factor affecting a person's car riding experience. In this project, I developed a bio-signal data collection and analysis tool kit that can be further developed for predict the occurrence of motion sickness based on human physiological signals. This device will be used in a car riding environment, anyone who is likely to encounter car-sickness will be a potential user.
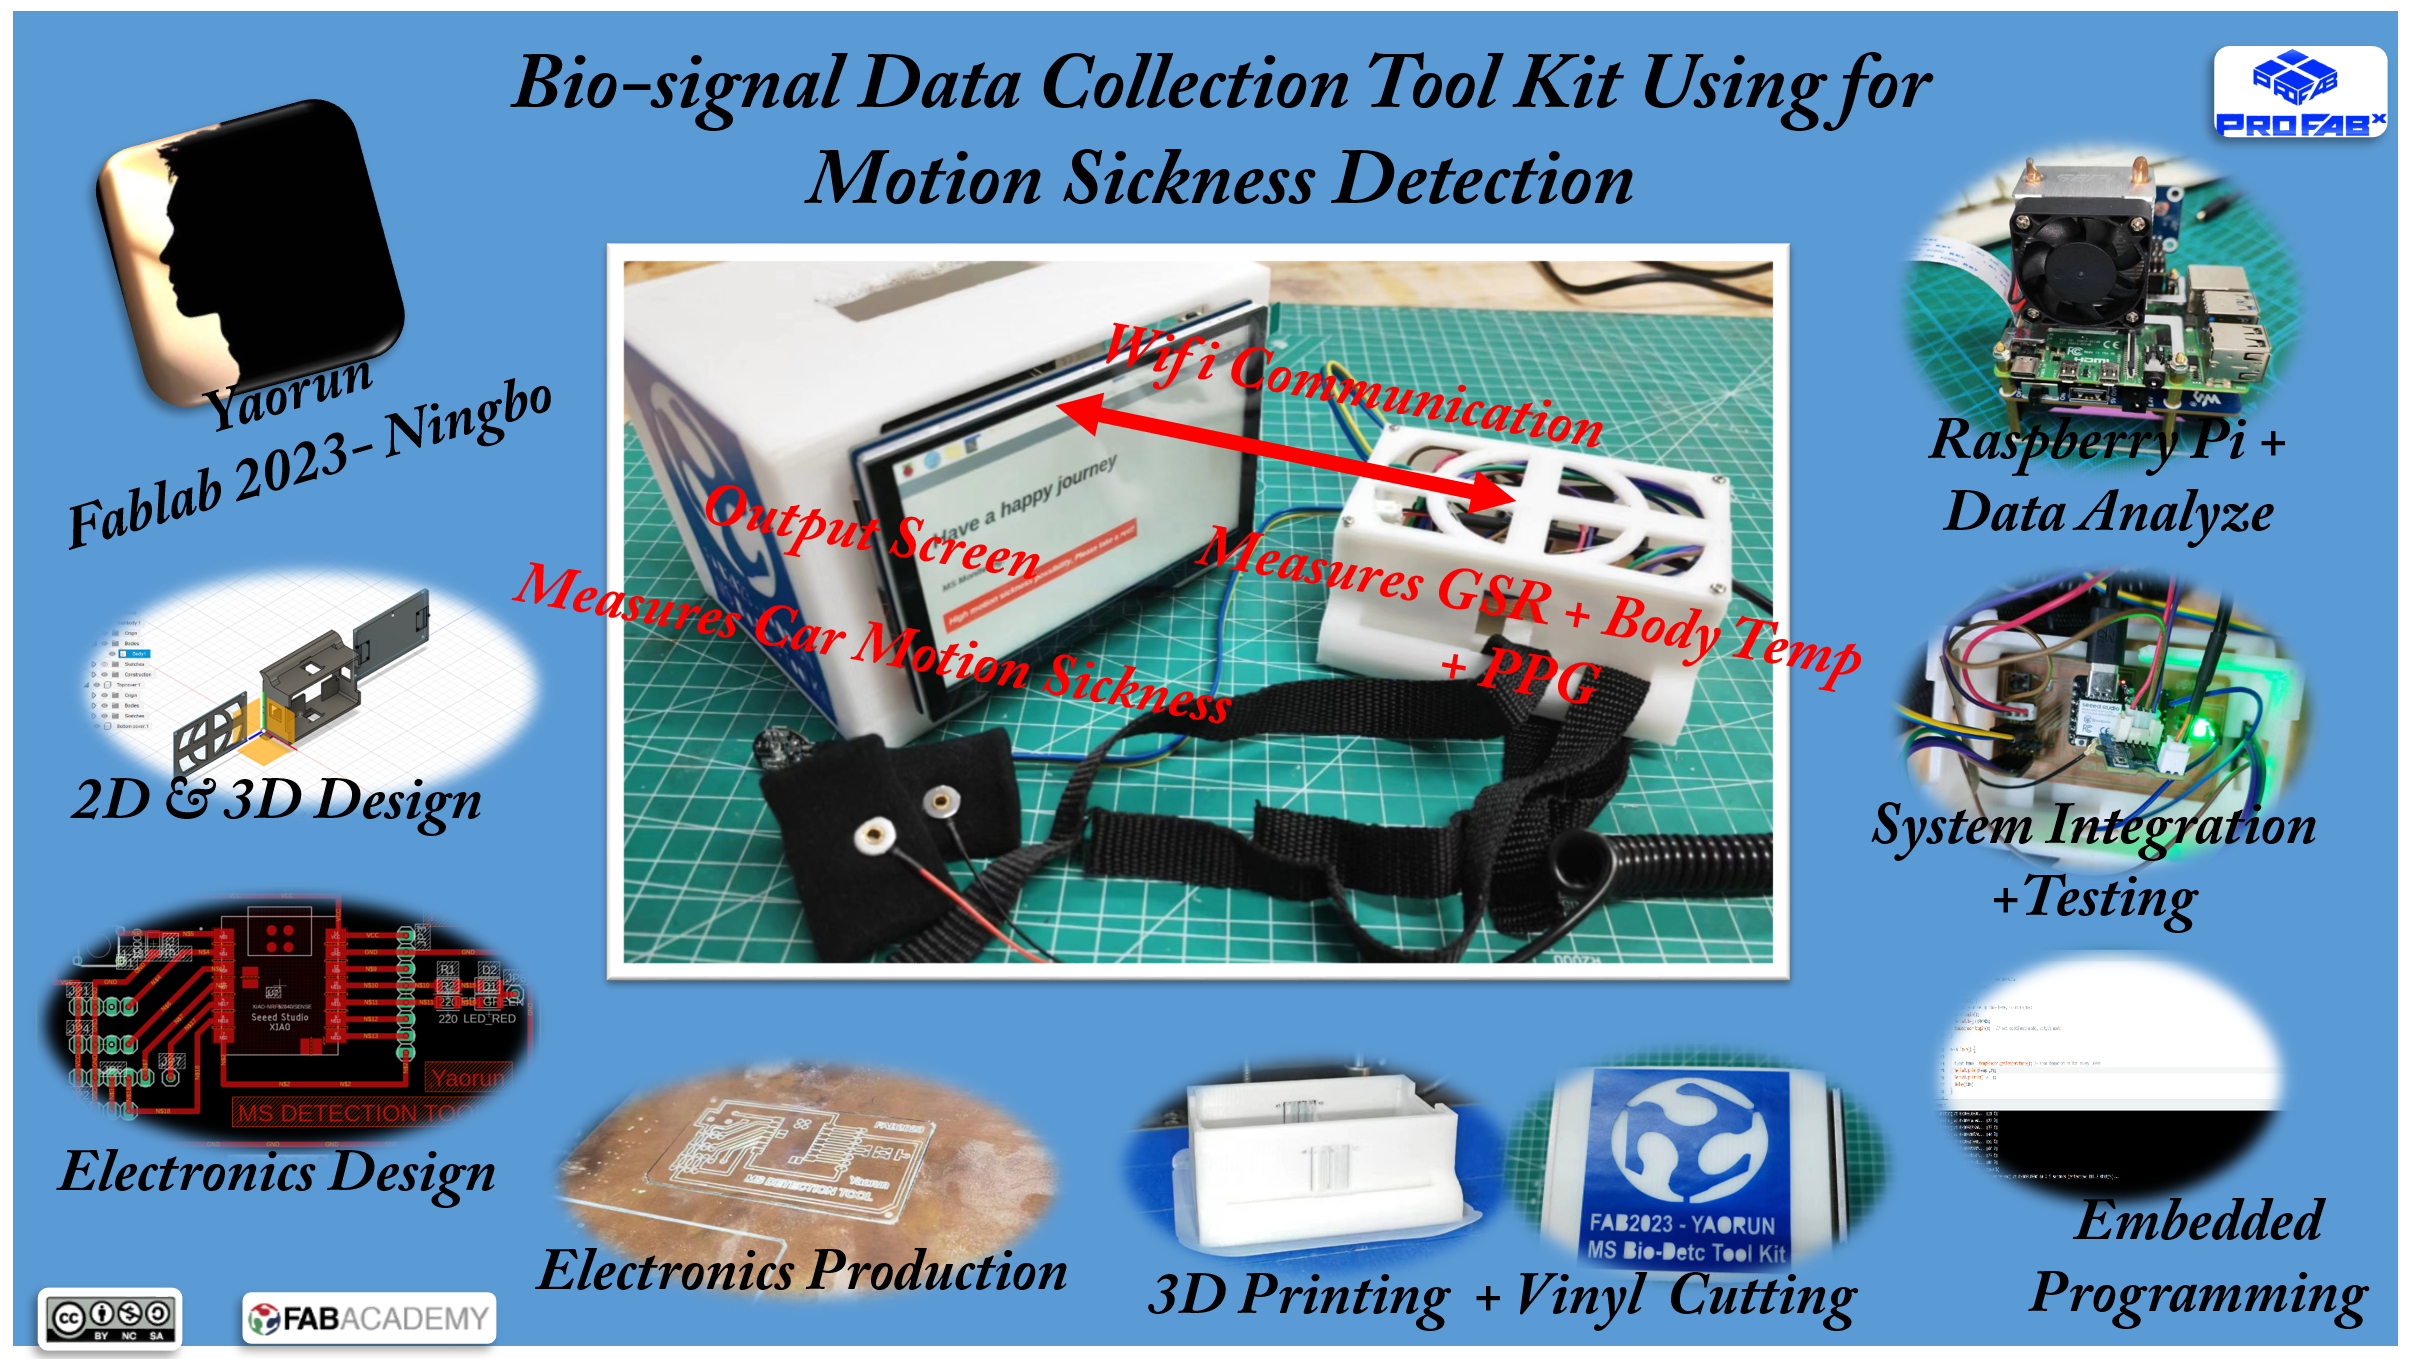
Summary Slide:

Video of final system:
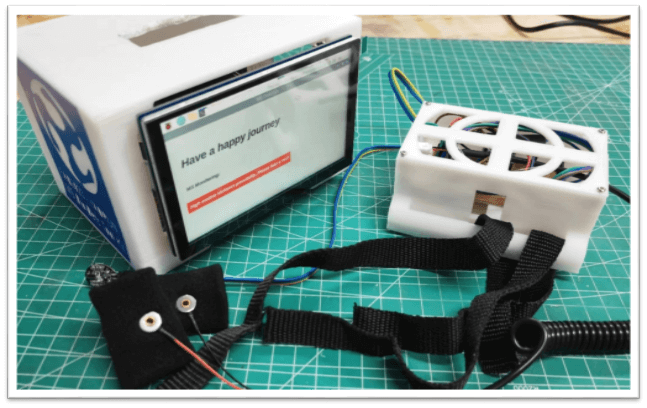
Hero shots
The hero shot and video below provide an overview of the system.

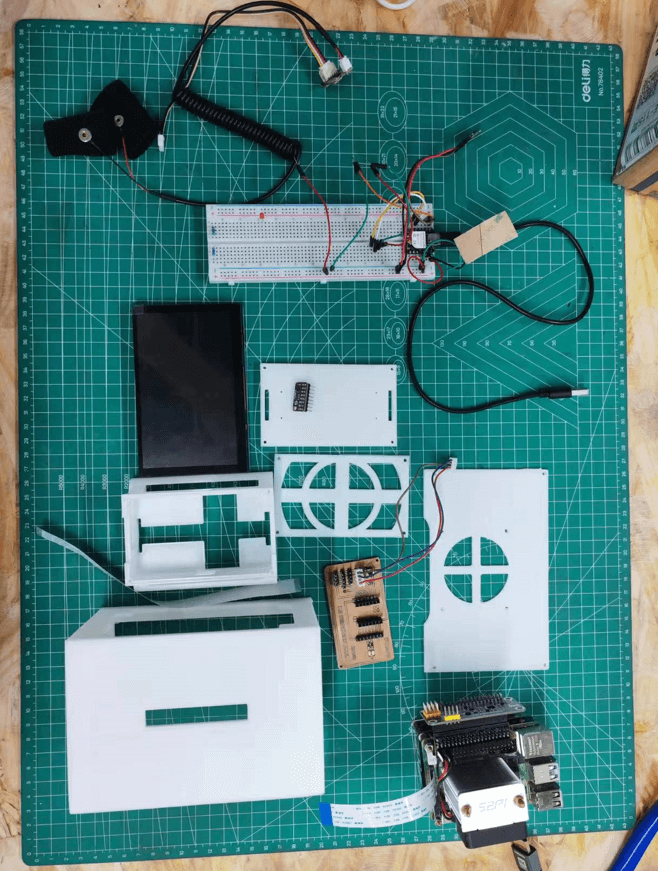
The system components before assemble.

The detail making process for this project is documented in my system integration site.
Project development timeline with links
Input Device Testing (5.22 - 5.26) Testing various biosensors (e.g., motion, PPG, SKT) to ensure accurate signal collection from physiological inputs.
Output Device Testing (5.24 - 5.26) Verifying the functionality of the screen display to show motion sickness values accurately.
Electronic Design (5.25 - 5.26) Designing the connection setup for biosensors to interface with the micro-controller unit (MCU). This task ensures proper sensor integration and data flow.
Electronic Production (5.28) Producing the Printed Circuit Board (PCB) for sensor connections, highlighted in yellow, marking a key step in finalizing the hardware.
Embedded Programming (5.28 - 5.31) Developing and testing the bio-signal detection and data processing programs, deployable on the Raspberry Pi, and involving wifi data transmission.
Networking (6.1 - 6.3) Setting up wifi communication between the Raspberry Pi and bio-signal detection module, allowing real-time data transfer.
Interface Programming (6.2 - 6.4) Developing a user interface to display analyzed bio-signal data, making results accessible for end users.
CAD Housing Design (6.3 - 6.6) Creating the housing design for the detection module using CAD, with a focus on ergonomics and durability.
Computer-Aided Cutting (6.5 - 6.8) Cutting the logo sticker for device branding, enhancing visual appeal and project identity.
3D Printing (6.6 - 6.9) Producing the physical housing for the bio-signal detection module using 3D printing, creating a secure casing for the components.
Assemble & Test (6.10 - 6.13) Documenting the project process, including demonstration videos for the final toolkit.
BOM list
The purchase list involved in this project is shown as table below, with a total cost of 1968.5 CNY.

Questions Answered
What does it do?
The project is a motion sickness detection toolkit that collects and analyzes human physiological signals (such as motion, PPG, and skin temperature) to help predict the onset of motion sickness. It is intended for use in a car riding environment to assist individuals prone to motion sickness.Who’s done what beforehand?
Previous research has focused on understanding motion sickness and detecting it through biosignal analysis. There are some existing tools and devices for general health monitoring, but they are often not specialized for real-time motion sickness prediction, especially in vehicle settings.What did you design?
The project involved designing:
- A sensor system to collect relevant physiological signals.
- A data processing module based on a Raspberry Pi to manage and process the collected data.
- A user interface with a screen to display the motion sickness dose value.
- A housing to securely contain the biosignal detection module, with branding elements like a logo sticker.
- What materials and components were used?
Materials and components included:
- Sensors: for measuring motion, PPG (photoplethysmography), and skin temperature.
- Raspberry Pi: for data processing and Wifi communication.
- Screen: to display motion sickness values.
- Housing materials: for the 3D-printed casing.
- Miscellaneous electronics: for sensor connections and PCB production.
Where did they come from?
These components were sourced from various electronics suppliers, such as online electronic stores (e.g., Adafruit, SparkFun), 3D printing services or local labs, and general hardware suppliers for materials like acrylic sheets for cutting.How much did they cost?
The costs is approximately 3000 CNY including materials and fabrication cost.What parts and systems were made?
- The sensor system for data collection.
- The data processing and communication system on the Raspberry Pi.
- The display interface showing motion sickness values.
- The housing and logo sticker for branding and protection.
- What processes were used?
Key processes included:
- Embedded programming for sensor data processing.
- Electronic design and assembly for integrating sensors and the Raspberry Pi.
- 3D printing for the housing.
- Computer-controlled cutting for the logo sticker.
- Interface programming to display processed data on the screen.
- What questions were answered?
The project answered:
- Can physiological signals reliably predict motion sickness?
- Is it feasible to build a compact, portable toolkit for real-time use in a car?
- What combination of sensors and processing techniques provides the most accurate detection?
What worked? What didn’t?
Worked: Data collection from sensors, basic data processing, Wifi communication, and initial testing in a controlled environment.
Didn’t work: The original plan was to use AI models deployed on raspberry-pi to predict the motion sickness, this was not realized since the time is limited.How was it evaluated?
The toolkit was evaluated through:
- Controlled testing of sensor accuracy and data processing.
- User feedback on the display interface and usability.
- Performance tests in a car environment to assess real-world reliability.
- What are the implications?
This toolkit could advance real-time motion sickness detection technology in automotive settings, making it useful for both passengers and automotive companies. It opens up possibilities for developing more personalized, adaptive vehicle environments and for future studies on motion sickness mitigation techniques.
Reference
- All 3D print housing & PCB design files can be found in link here:https://gitlab.fabcloud.org/academany/fabacademy/2023/labs/ningbo/students/yaorun-zhang/-/tree/main/docs/assignments/week18/designfiles?ref_type=heads
- The vinyl cutting design file at link here:https://gitlab.fabcloud.org/academany/fabacademy/2023/labs/ningbo/students/yaorun-zhang/-/tree/main/docs/assignments/week3/design-file?ref_type=heads
- All code are upload to page here:https://fabacademy.org/2023/labs/ningbo/students/yaorun-zhang/assignments/week18/