Week 14: Interface and application programming
Assignments:
-
Group assignment: Compare as many tool options as possible.
-
Individual assignment: Write an application that interfaces a user with an input and/or output device that you made
What to learn:
- Interpret and implement design and programming protocols to create a Graphic User Interface (GUI).
Have you?
-
Linked to the group assignment page
-
Documented your process
-
Explained the UI that you made and how you did it
-
Outlined problems and how you fixed them
-
Included original code (or a screenshot of the app code if that’s not possible)
-
Included a ‘hero shot/video’ of your application running with your board
DOUBT: Do we have to interface to a board for the group assignment? Answer: No, but you need to learn how to create user interfaces.
DOUBT: Is it ok to use Command Line Interface (CLI)? Answer: Yes, as long as it’s GUI-like.
Understanding interfaces
What types of languages can we use?
-
Hello world the most basic way to interface.
-
Go, Rust, Flutter, Dart these 4 are newer, they target issues in security vulnerabilities, they are platforms to build software.
-
Java, OpenJDK, IcedTea, Android
-
APL: Neil’s favourite, beautiful language to represent mathematical content)
-
Haskell, Scala, Julia: functional language, you express things as a series of things and relationships
-
Processing, Wiring, Arduino, p5.js (if you like Arduino you will like processing)
-
LabVIEW, Simulink, Max, Pd, Scratch, App Inventor(good choice for this weeks assignment), Grasshopper, Firefly: these are visual data flow, you make a picture of the logic and then execute this. Very good when starting but there is a limit in complexity. You can also build code modules which you then build in these servers.
-
Python: beautiful language, strongly recommended out of all of these, you can do everything in python, it also has very good tutorials), Perl and Ruby are similar
-
JavaScript tutorial on Javascript Javascript is a scripting language from the web, worth knowing it to be web native), Node.js, V8, npm, asm.js,
-
WebAssembly, CoffeeScript
-
Node-RED, mods
Neil recommends learning Python because it is a beautiful language and javascript because it is web native.
How do we interface between devices?
Frameworks to get data between devices:
-
This week we will probably use serial: RS/EIA/TIA 232/422/485, these are the devices we have been using lately, pySerial, Serialport is the package for node to talk to serial port), there is also serial and Web Serial.
-
We can also use FTDI like we have done before, libFTDI this is a library to talk to FTDI chips. The Firmata library sits on top of it, higher packaging of sending messages.
-
We can also use USB, the PyUSB provides for Python easy access to the host machine’s Universal Serial Bus (USB) system, …
-
IrDA, python-irda
-
GPIB, VISA, PyVISA: commercial test equipment uses this
-
MQTT, XMPP, IFTTT, UPnP, Wemo
-
Socket(how you talk to the internet), dgram, net, ws
How do we talk/interface between data?
Datasheet emerged when data records where bigger than computer memory. You will need to send data to a device and get data back, you can store data in spreadsheets like: Calc, Sheets, Pyspread, but this is not recommended as you can’t handle much data like this.
For most interfaces like the ones we are doing you can have unstructured databases = flat files. Flat files stores data in a single table with no relationships between data.
Common apps will use database which work with MySQL
How to build user interfaces (key part from this week):
-
ncurses: programming library providing an application programming interface that allows the programmer to write text-based user interfaces in a terminal-independent manner. You can do very good interactive graphics with terminal (uses very low memory).
-
Tk: has a very mature user interface library, graphical user interface toolkit that can produce rich, native applications.
-
Tkinter binding between tk and pyhthon. You tell python to read in tk.
-
wxWidgets, wxPython; these are also builders for user interface applications. They have many widget elements.
-
Kivy: Open source Python library for rapid development of applications that make use of innovative user interfaces, such as multi-touch apps.
Any of these work, they all do the same
-
forms: the earliest html included form
-
Different javascript libraries that you will have to work along javascript: jQuery, dat.GUI, Bootstrap, Flat UI, Material
-
Backbone, Require, Angular, Handlebars, Ember
-
Meteor, Babel, React, React Native, Cordova, Ionic, Electron, Blynk, Firebase (versions of cross-platforms development)
Check all control platforms here
To add graphics to interface (draw lines, images, 3D, …)
The following are recommended to create graphics:
-
paperjs.org is quite cool for 2D graphics
-
Canvas: html standard for putting pixels on the screen.
-
SVG: you always have resolution because it is independent of resolution of pixels, it works with mathematical equations. The downside though is that your browser will stutter if there are too many SVG elements on the page moving, then going to Canvas is better.
-
Three.js: standard for doing 3D graphics on the web, you can do lots of things for js, it is a very fine choice for this weeks assignment.
-
OpenGL, GLUT, GLEW, GLFW, Dear ImGui, PyOpenGL
-
RenderMan, cgkit
-
VTK (for visualizing data in 3D), pyvtk, Mayavi
-
OpenVDB
-
Unity, Unreal, Godot, Blender Physics (these are all for game makin)
To add audio and video to interface
-
SDL: platform to code audio and video, Pygame(binding between python and SDL to let python do audio and video)
-
OpenFrameworks framework to handle multimedia, ofpython
-
HTML5: web extensions, includes standards for audio and video.
-
Web Audio audioline.html
-
TouchDesigner for multimedia programming
To add VR/AR/MR/XR to interface
-
WebXR THREE.VRController
-
ARCore
-
Forge
-
three.ar.js three.xr.js it has an extension to go from 3js to VR
-
AR.js
-
A-Frame
To add math, machine learning to interface
-
Netlib, BLAS, LINPACK, LAPACK
-
NumPy, SciPy
-
matplotlib: visualization with python, Seaborn: statistical data visualization
-
Anaconda, IPython, Jupyter, Colab
-
R, RPy, ggplot2
-
Mathematica, SymPy, Sage, Scilab
-
D3: I really like this data driven environment (look at it it looks very nice), jqPlot, Highcharts, Chart.js, mpld3
Performance
To make websites/apps run faster performance is important. This is a link to an article on why performance is important
Check all performance platforms here
Deploy: what do you need if you need to run a service on the cloud?
Deployment is all that makes a software system to be available for use. There are a few options to make this:
-
Amazon AWS, EC2, Lambda, ParallelCluster(different ways ro run GUI), remote desktop
-
Google Cloud
-
Microsoft Azure
-
DigitalOcean
-
Linode
-
Heroku (to push your app to the cloud)
-
Docker, Kubernetes, Auto DevOps
Security
Also security is important, check all possible problems to everything we write here
Group assignment: compare as many tool options as possible
The aim of the group assignment is to try different options for this week’s programming. Henk said if we do not have much programming experience we should keep it simple.
Nadieh gave a short introduction in what she used to create data visualisations, she uses the following to convert data into something visual:
- d3.js is a JavaScript library for manipulating documents based on data. D3 helps you to combine powerful visualization components and a data-driven approach. D3.js is usually done with SVGs, which is what Neil was explaining yesterday about how every svg element is its own thing and from this you can make them interact. D3 has a very steep learning curve. It is very hard to do something easy but it is vert easy to do something hard (once you know how to use the basics you can do many things).
Nadieh went over some examples like this interactive bar chart where she went through the different code. It works by first setting up a svg canvas and then on top of that canvas you start putting things in. You first, before creating, have do a series of defaults like for example; make a scene, and place a camera in the scene.
-
Html 5 Canvas. With Canvas you are still creating a canvas but you are working with pixels, it is like painting, you draw a line but you can’t do anything with it. In D3 you can interact with them because they are SVGs. Canvas is a good point to start.
-
The problem with SVGs is that is works very slow, Canvas is much faster in the web, but WebGL is the the fastest. if you want to show even more data.
-
Observable is also a way to code online to make small prototypes and make things. it also has a very big repository of other people’s work with notebooks explaining everything that is happening.
-
Nadieh also introduced P5.js where you can edit different types of drawings online but you can also include HTML5 objects for text, input, video, webcam, and sound.. p5.js is a JavaScript library for creative coding, with a focus on making coding accessible and inclusive for artists, designers, educators, beginners, and anyone else! Tips on how to get started and also some references
Setting up a local host
If you want to setup your interface with javascript you have to do a local web server. I am not sure I will use this for my individual assignment but it nice to know for the future. The idea is that you have your sites folders in your local computer which you can access and preview with the local host option and you can also access it offline which is also beneficial when creating interfaces.
As a group we followed this page on how to setup you local host
- First type in the terminal
sudo apachectl start
It is important to know that apache is a webserver, if you are on the same wifi as other people they will also be able to access your local host folder.
-
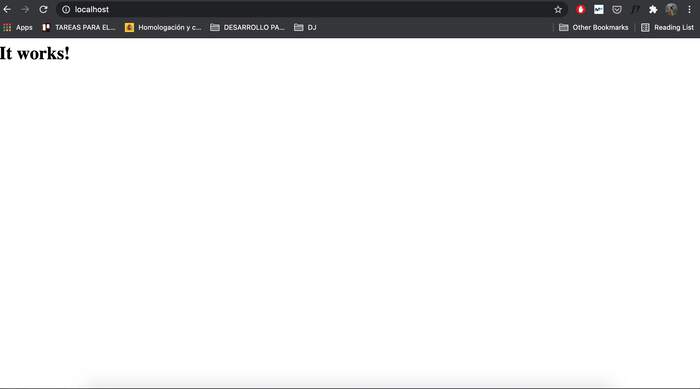
Then type in localhost in the search bar of the browser and it should appear “It works!”
-
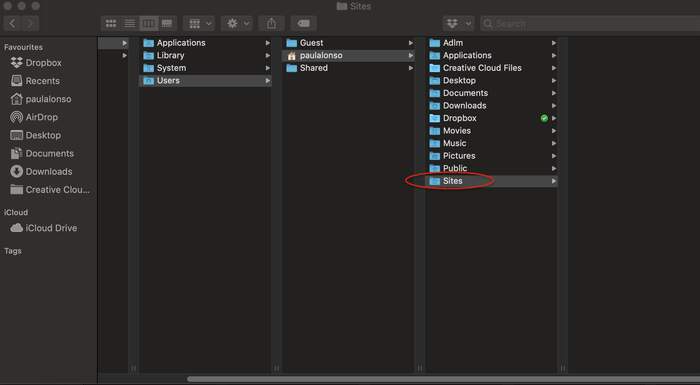
Create a folder named “sites” under Users. This directory will be your document root for any web-related stuff.
-
If you write in terminal:
open .
It opens the folder you are in.
-
Then we will create a username.conf file. To be able to recognize the files putting into Sites directory, username.conf needed to be setup.
-
Type
whoami
-
Press enter. This is my username. In my case it is paulalonso. For example, my .conf file will be paulalonso.conf under /etc/apache2/users which will create now:
-
Type the following and press enter:
cd /etc/apache2/users
-
Type ls and press enter. Check if there is an existing username.conf file (username is your account name)
-
If there is an existing username.conf, make a backup copy by typing:
sudo cp username.conf username.conf.bak
-
Type sudo nano username.conf and press enter (note: username will be your account name e.g. developer.conf, so in my case paulalonso)
-
Copy and paste the following configuration and changed developer by paulalonso which is my username
<Directory "/Users/developer/Sites/">
AllowOverride All
Options Indexes MultiViews FollowSymLinks
Require all granted
</Directory>
-
Press Control + o and press enter to save the file.
-
Press Control + x to exit the nano editor (editor inside your terminal)
-
We will now configure the httpd.conf file. Open the Terminal app and type the following and press enter:
Type cd /etc/apache2 and press enter.
-
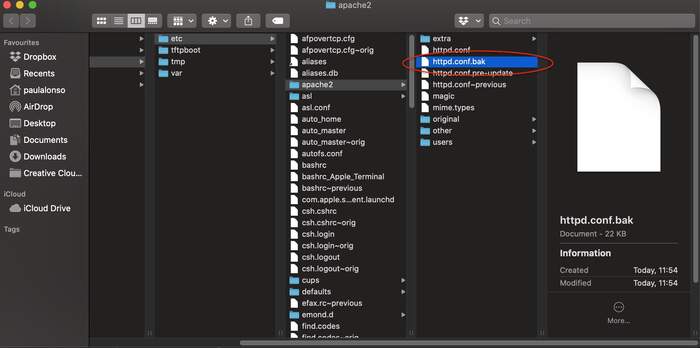
Type sudo cp httpd.conf httpd.conf.bak and press enter. (This step is optional if you want to keep the copy of the original config file but I would recommend keeping one just in case.)
-
Type sudo nano /etc/apachae2/httpd.conf and press enter. Instead of doing it from my terminal I pressed ctrl + x to close the nano editor and we opened the conf.file from the folder with text editor:
-
I had to duplicate this cause you can’t overwrite the original one. We skip step 5 and go directly to step 6. We will have to uncomment the following modules. The # you see in front of each line means that line is commented out. That means that a specific line or module on that line will be ignored. What we want to do is, uncomment this so the module is enabled. We use command+f to open the search bar in the text edit, we look for the following modules and remove the hashtag from the start of the line:
LoadModule authn_core_module libexec/apache2/mod_authn_core.so
LoadModule authz_host_module libexec/apache2/mod_authz_host.so
LoadModule userdir_module libexec/apache2/mod_userdir.so
LoadModule include_module libexec/apache2/mod_include.so
LoadModule rewrite_module libexec/apache2/mod_rewrite.so
Include /private/etc/apache2/extra/httpd-userdir.conf
We also comment the 2 following lines:
DocumentRoot "/Library/WebServer/Documents"
<Directory "/Library/WebServer/Documents">
We then add below it the same but instead of webserver I place my username: paulalonso, I add these without #
DocumentRoot "/Users/paulalonso/Sites/"
<Directory "/Users/paulalonso/Sites/">
-
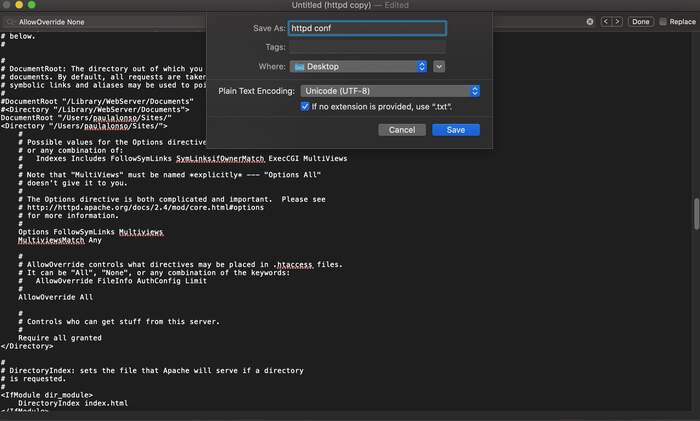
We also replace the phrase AllowOverride None to AllowOverride All
-
We save the file with the same name as the original one (make sure to untick the .txt saving format)
-
We now save it to the original folder and replace it by the original file we had to duplicate.
-
Last step will be configuring the httpd-userdir.conf file We type back in the terminal cd /etc/apache2/extra and press enter.
-
Type sudo cp httpd-userdir.conf httpd-userdir.conf.bak and press enter. (this step is optional if you want to keep the copy of original file.)
-
Type sudo nano httpd-userdir.conf and press enter.
-
We again open it with text edit (just to avoid terminal), and uncomment the following line:
Include /private/etc/apache2/users/*.conf
-
Save it and replace it by the original file.
-
Now we can type in the terminal:
sudo apachectl restart
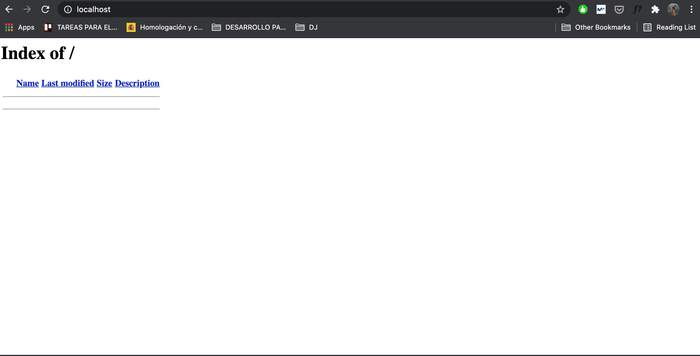
- This step will restart the Apache server to take effect of the changes made in the config file and now if we go to the web browser and type localhost we can see this:
Individual assignment: write an application that interfaces a user with an input and/or output device that you made
We should make an interface that reacts from data coming either from input or output of a board we have made in previous weeks. It could run on a desktop, phone, etc but the main thing is that it interfaces a user.
I am planning to work with my gas sensor board, from my input devices week. The interface will alert if there is too much gas in the air?
What are the most simple options for this week’s assignment? - App Inventor? - Processing: processing is creating code to create an inteface for data from Arduino.
TO-DO regarding my gas sensor board
- I have to change the buzzer because the one I put to the board does not work properly (it needs more voltage).
- I also have to re-write/re-check the board code
- How do I connect the Interface to my board?
- Check if I can check other gases: from datasheet MQ-2 Description :
Recommendations from Henk are: 1. Try to get data from my working board (I will always get output in the form of a number between 0-1023) 2. Try to place this data in someone’s else work and see how my data displays in their work. 3. Make the interface either with App inventor or with processing (processing is the creator of the interface of Arduino), see this example
Get board to work and receive data from:
Checking board from input devices week:
-
So first get the board working. This link is a very similar project of what I have. I will test the MQ-2 sensor first, not with propane but with another gas, as I read in the MQ-2 Datasheet: “They are suitable for detecting of LPG, i-butane, propane, methane, alcohol, Hydrogen, smoke.” So I can use any of these to check the gas sensor.
-
From the previous link I got the following code:
*******

 All the resources for this project:
 https://randomnerdtutorials.com/

*******/

int redLed = 12;
int greenLed = 11;
int buzzer = 10;
int smokeA0 = A5;
// Your threshold value
int sensorThres = 400;

void setup() {
  pinMode(redLed, OUTPUT);
  pinMode(greenLed, OUTPUT);
  pinMode(buzzer, OUTPUT);
  pinMode(smokeA0, INPUT);
  Serial.begin(9600);
}

void loop() {
  int analogSensor = analogRead(smokeA0);

  Serial.print("Pin A0: ");
  Serial.println(analogSensor);
  // Checks if it has reached the threshold value
  if (analogSensor > sensorThres)
  {
    digitalWrite(redLed, HIGH);
    digitalWrite(greenLed, LOW);
    tone(buzzer, 1000, 200);
  }
  else
  {
    digitalWrite(redLed, LOW);
    digitalWrite(greenLed, HIGH);
    noTone(buzzer);
  }
  delay(100);
}
-
From this code I will have to modify some things to adapt it to my board, to start with I just have one gas sensor, one buzzer and one red light. I looked into my input devices week documentation. I first tried the whole code just changing the pin numbers and removing the green led (as I do not have one). This did not work. The program would get loaded to the chip but nothing would appear in the serial monitor. I tried changing the gas sensor value to “2” but still nothing appeared.
-
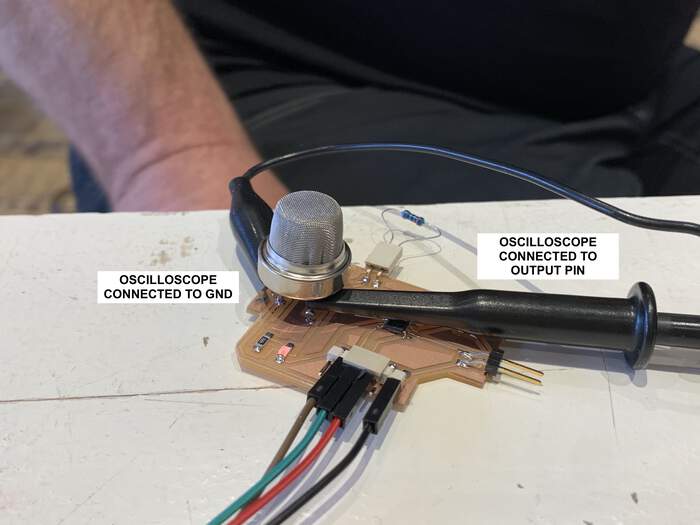
I will try to use the logic analyzer to see if we can see something coming through. Oh no! Logic analyzer is for digital outputs so we will use the oscilloscope as the gas sensor is a analog input: depends on the amount of gas around it! We attach the pins from the oscilloscope to GND and the PIN connected to the chip (in my case PA6).
-
In the oscilloscope we could see there was a signal (it was working). We also learned that when we put a lighter near the gas sensor the signal would start increasing in size until there was no fire and then it would start lowering again.
- Zoomed in signal:
- We removed the resistor from the gas sensor and we realised that without the resistor the signal would keep working but it would be more messy. The resistor made the signal more stable:
-
The conclusion of using the oscilloscope came to understanding that the resistor gave more accuracy to the signal and also that the serial monitor should be working because I have data coming out from the sensor.
-
So we go back again to Arduino IDE (Henk helped me with this weird-no-signal showing up). We first tried modifying the code from before to just leave the gas sensor (ignoring the buzzer and red light).
// Modified code from https://randomnerdtutorials.com/

//int redLed = A7;
//int buzzer = A3;
#define smokeA0 (2)
// Your threshold value
//int sensorThres = 400;

void setup() {
//  pinMode(redLed, OUTPUT);
 // pinMode(buzzer, OUTPUT);
  pinMode(smokeA0, INPUT);
  Serial.begin(9600);
}

void loop() {
  analogRead(smokeA0); // this command is what shows the values coming from the sensor

//  Serial.print("Pin A0: "); // PRINTS Pin A0 sensor and it says value for gas sensor coming from the analog read
  Serial.println(analogSensor);
  // Checks if it has reached the threshold value
//  if (analogSensor > sensorThres)
//  {
//    digitalWrite(redLed, HIGH);
//    tone(buzzer, 1000, 200);
//  }
//  else
//  {
//    digitalWrite(redLed, LOW);
//    noTone(buzzer);
//  }
  delay(100);
}
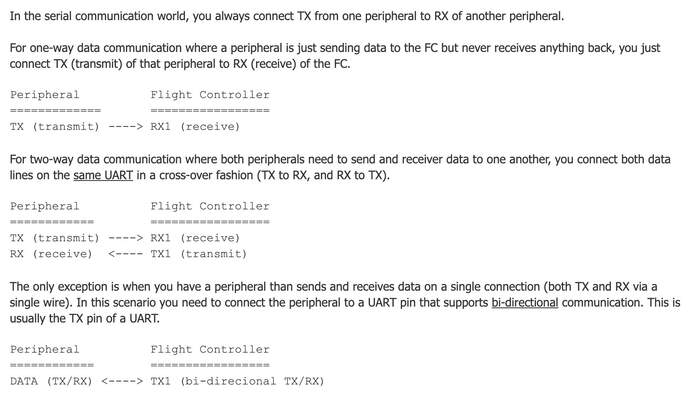
- This again did not work. We now used another code from this link, including serial swap because we realized I had put TX and RX in TXD and RXD so I was using the alternative RX and TX pins. The way this works is that the chip by default works with RX and TX but if you assign it RXD and TXD you have to serial swap these signal in the code or otherwise you won’t receive any signal from it. We added serial swap so that the TXD and RXD lines would now act as serial.
#define MQ2pin (2)

float sensorValue;  //variable to store sensor value

void setup()
{
  Serial.begin(9600); // sets the serial port to 9600
  Serial.swap(1);
  Serial.println("Gas sensor warming up!");
  delay(20000); // allow the MQ-6 to warm up
}

void loop()
{
  sensorValue = analogRead(MQ2pin); // read analog input pin 0

  Serial.print("Sensor Value: ");
  Serial.print(sensorValue);

  if(sensorValue > 300)
  {
    Serial.print(" | Smoke detected!");
  }

  Serial.println("");
  delay(2000); // wait 2s for next reading
}
-
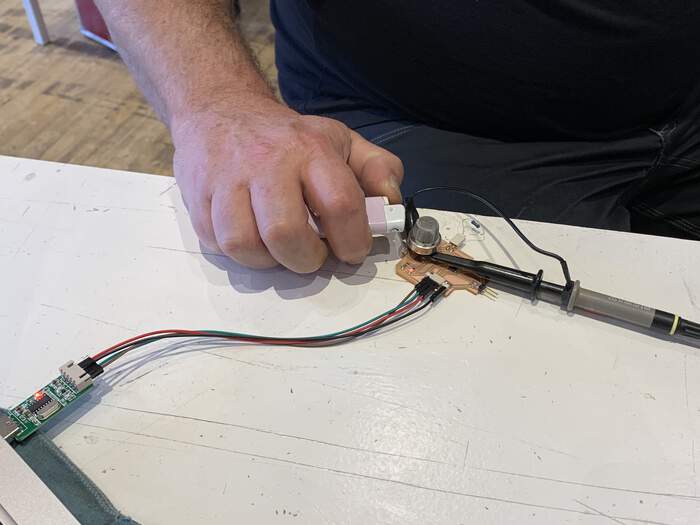
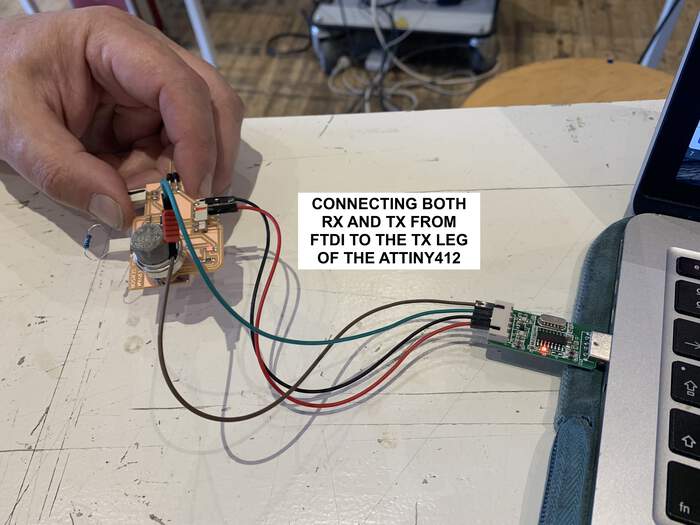
This code still did not work, so what Henk did was attach a pin to pin 2 (TX-the transmitter) connecting both jumping wires; one to the RX and one to the TX pin from the FTDI:
-
Suddenly the signal came in. It worked on the TX data line because it was only transmitting. The signal said smoke was always detected because of the threshold stated. We tried putting fire with a lighter and the values came up but still they were not really accurate.
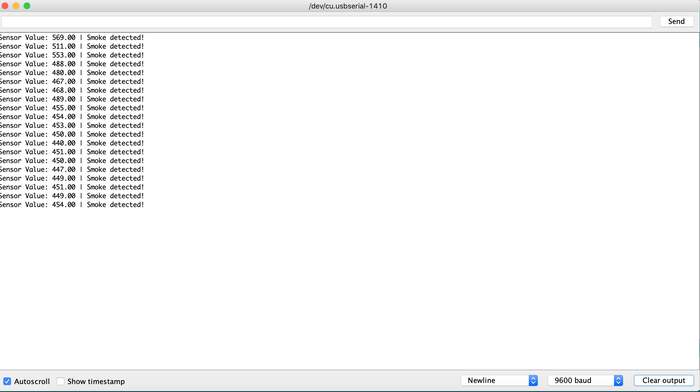
- Something that confused us is that it worked on the TX data line(we pinned it to pin2) which meant the serial swap had not worked in the code. I researched into this and found some people use
Serial.swap(1);
and some used:
Serial.swap(0);
- Maybe this was the difference? I maybe should have done serial.swap(0). I have to check this.
In conclusion the gas sensor works but the signal from the gas sensor is not that accurate because the TX transmitting signal interfered with the input data coming from the sensor on the same pin. This is why I have decided to make a new board for the gas sensor and change the following:
-
Put TX and RX in pinouts 2 and 3 (from arduino pinout image), therefore there will be no need to do serialswap
-
DOUBLE CHECK TX AND RX
-
Move the input signal from the gas sensor to another pin from the IC
-
Double check on what resistor should I use but better accuracy?
-
add a different buzzer footprint to schematic and to board. In the end I am leaving the same footprint. I will attach this later.
-
Look into the serial swap why did it not work? Nadieh said there are two types of serial swap:
Serial.swap(0); (This is )
and
Serial.swap(1); ()
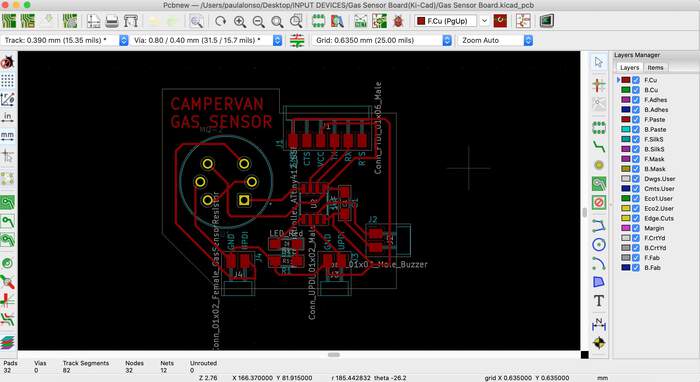
Modifying board and re-doing it:
-
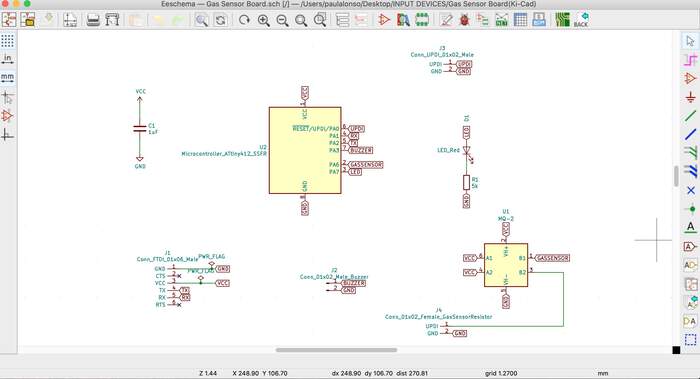
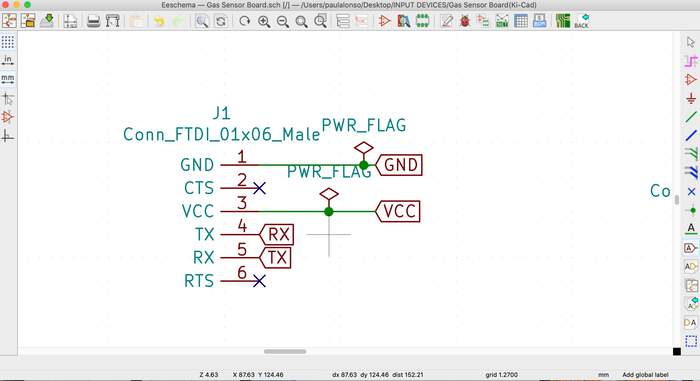
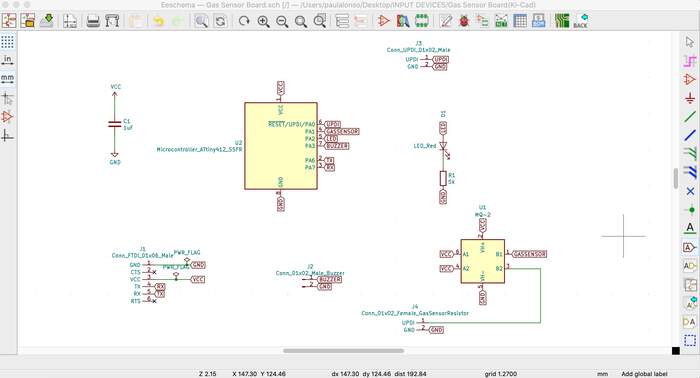
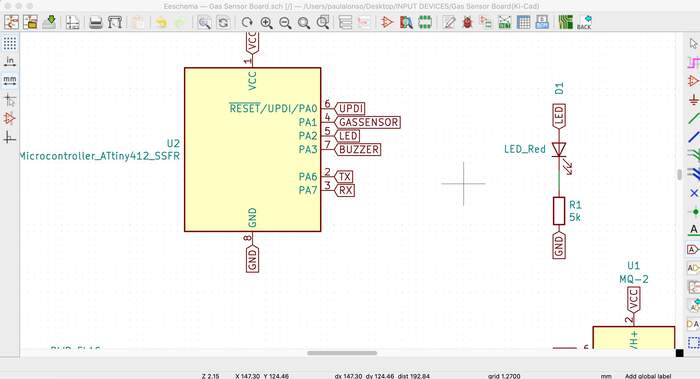
I open up the schematic from my input devices week for the gas sensor board:
-
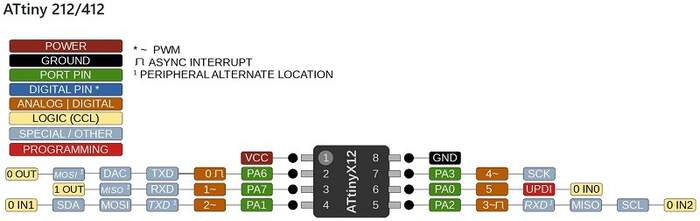
I change the TX and RX and also the gas sensor and led pins I did this double checking with the ATtiny412 arduino pinout. From now on my plan is to place RX and TX swapped in the FTDI pins so that I can double check they are the other way around and assign TX and RX to the corresponding pins in the IC, in the case of the ATtiny412; 2 and 3. I will also try to assign them to the default ones instead of the alternative as this will eventually save me from problems and headaches.
-
I then update the pcb and this gives me new traces I have to do:
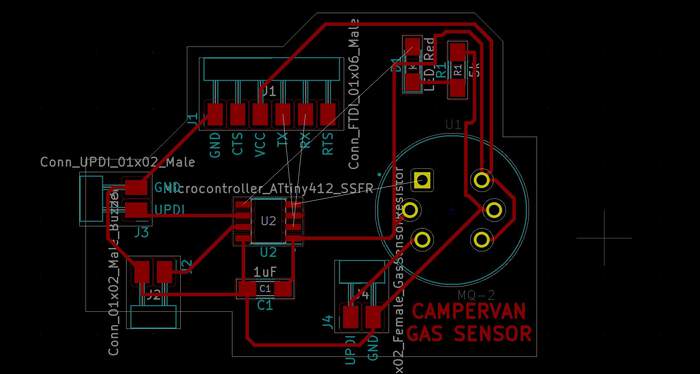
-
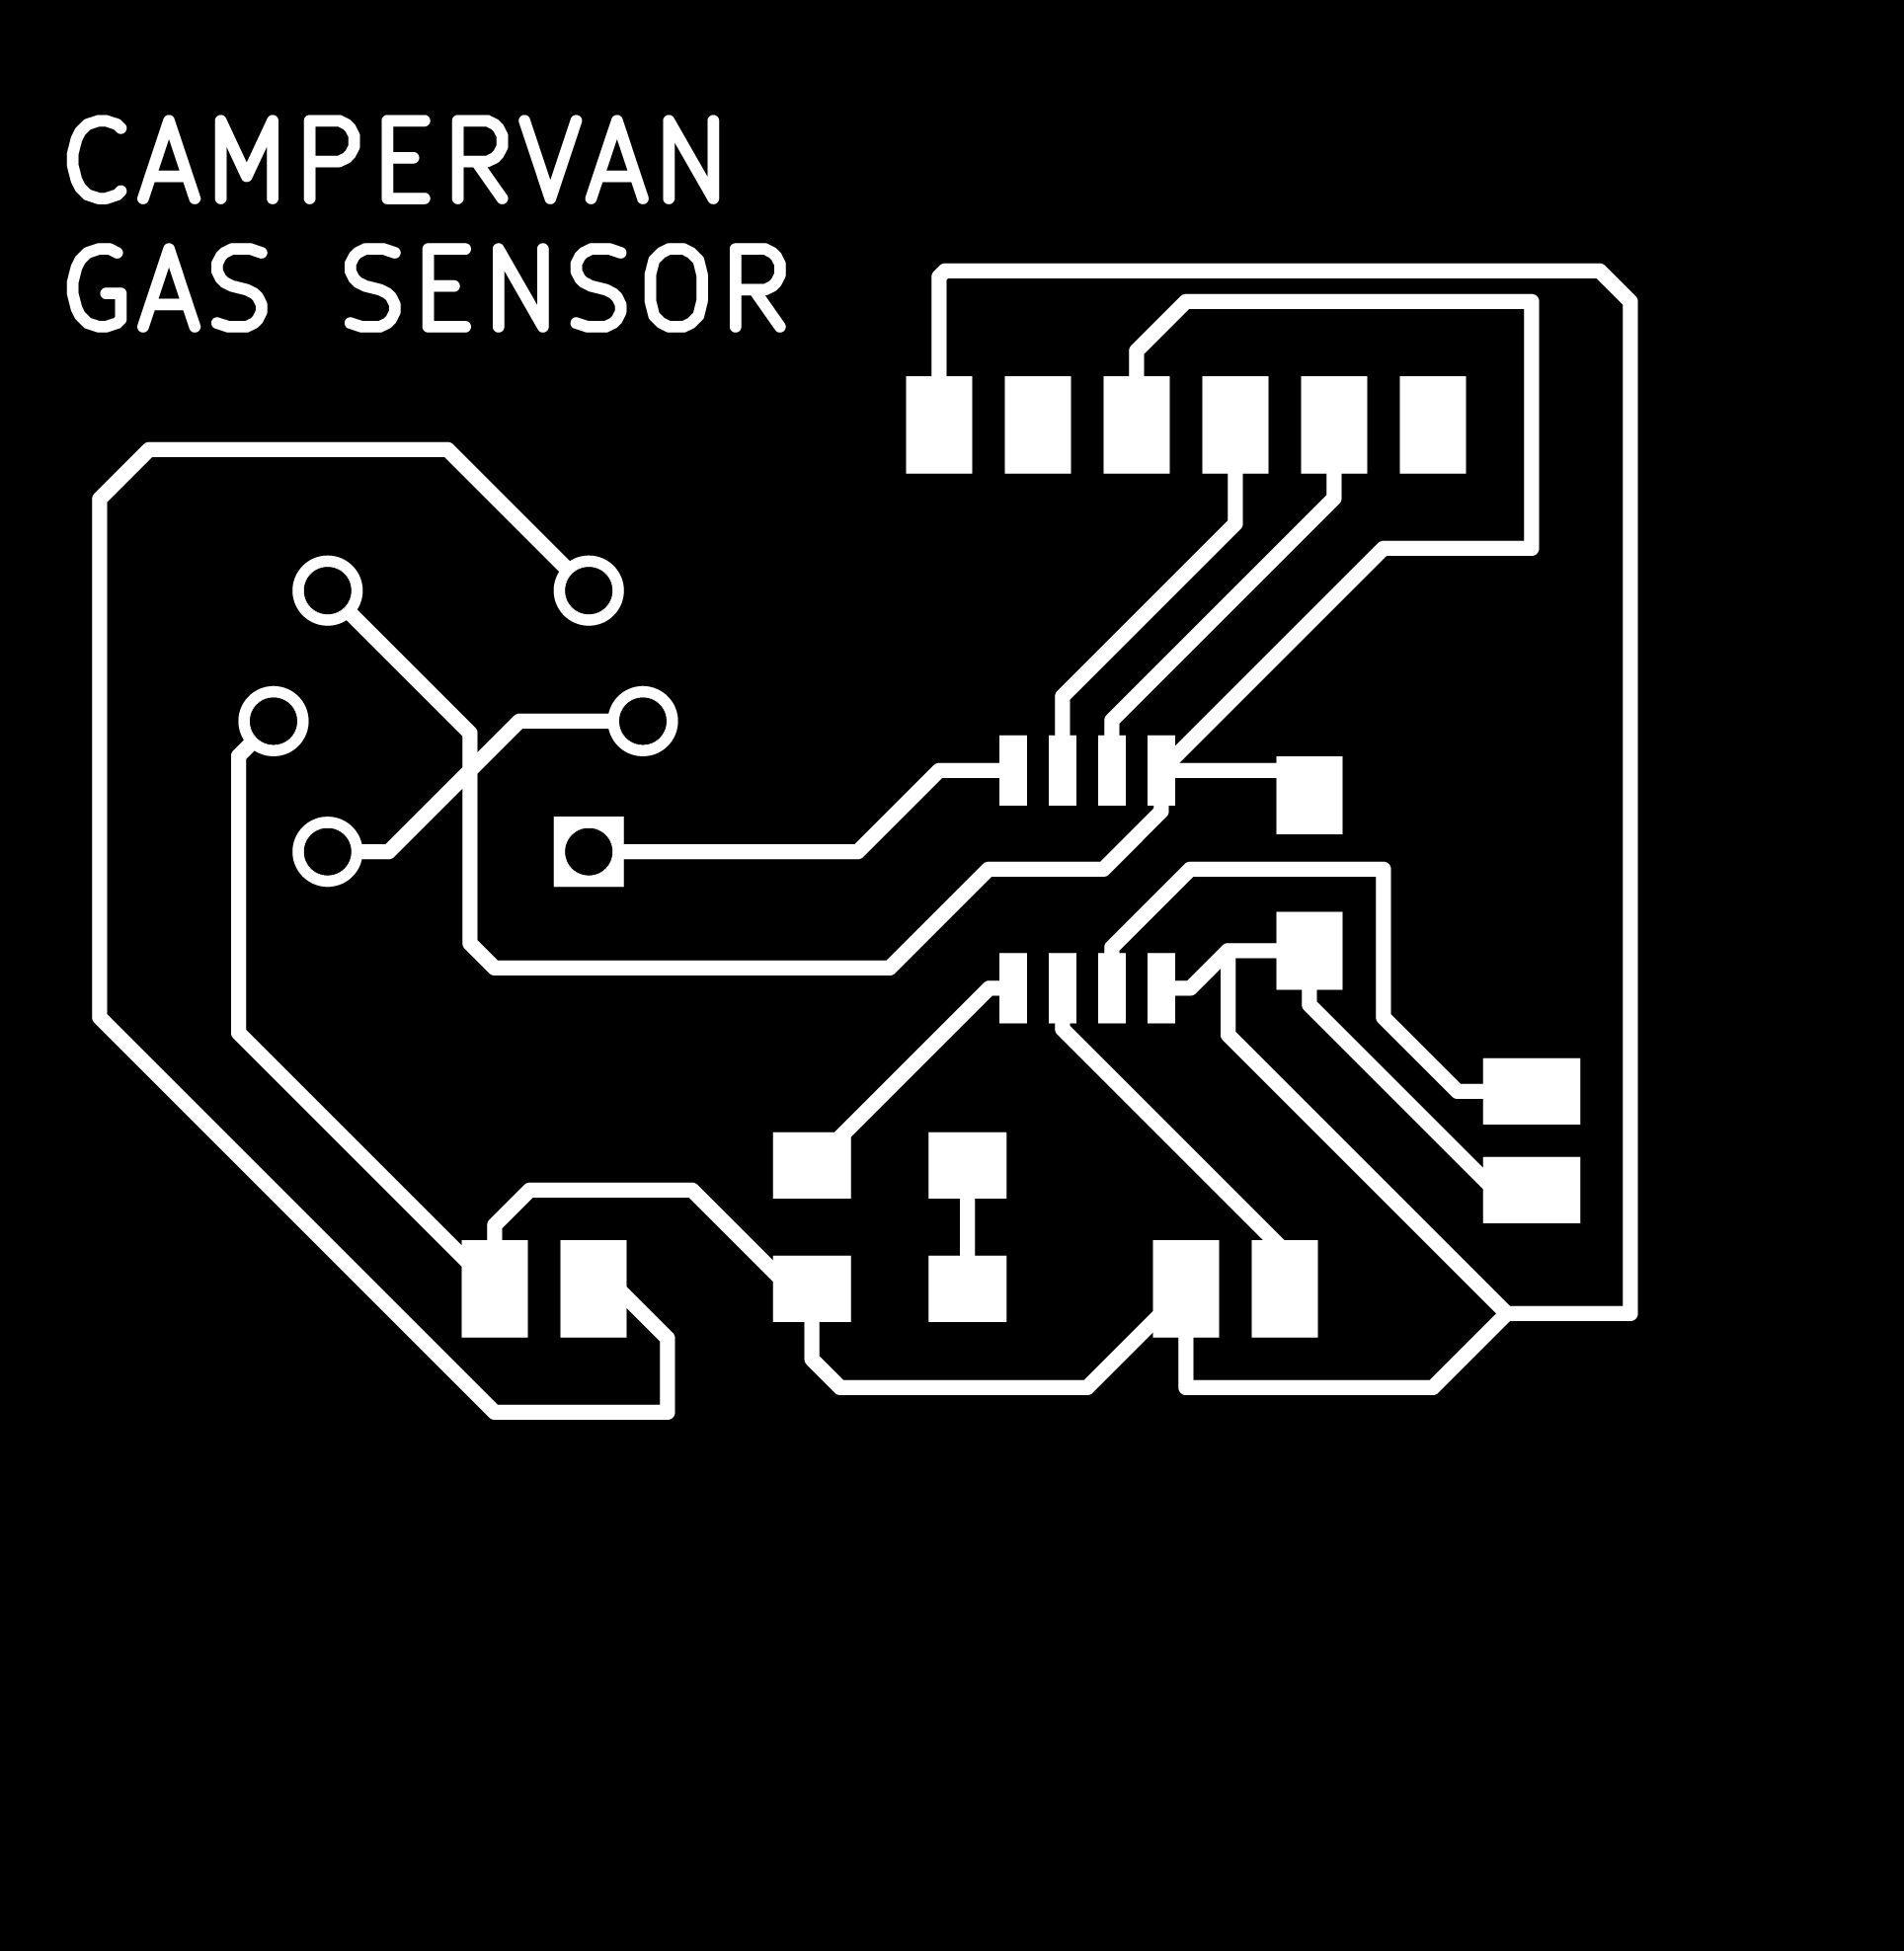
In the end I deleted all traces and re-did the arrangement of the whole board:
-
I milled the three following pngs in the following order:


-
Soldering board:
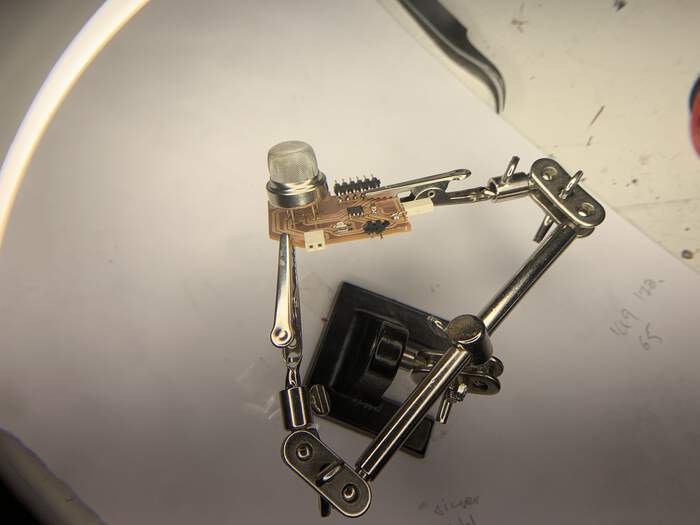
Testing new board
- I will now check if data is coming in from the board, it does!
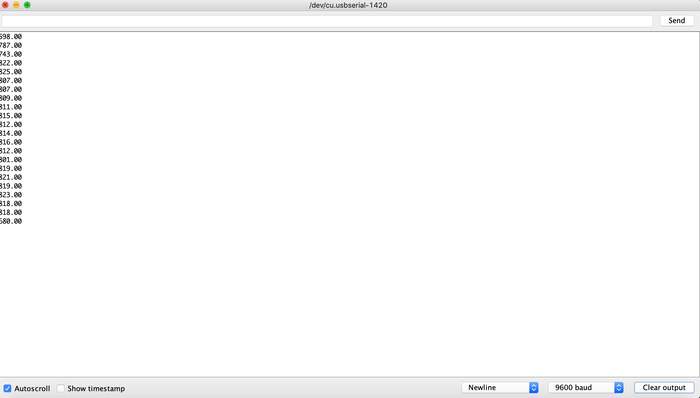
- Henk told me that in order to place this in processing it has to contain just numbers so that the output is numbers and not phrases “smoke detected”. I can also do it with letters but then I would have to look for a whole example to start from. So for the new code we hide most of the things that do not give out numerical output:
#define MQ2pin (4)

float sensorValue;  //variable to store sensor value

void setup()
{
  Serial.begin(9600); // sets the serial port to 9600
 // Serial.println("Gas sensor warming up!");
  delay(20000); // allow the MQ-6 to warm up
}

void loop()
{
    sensorValue = analogRead(MQ2pin); // read analog input pin 0

 // Serial.print("Sensor Value: ");
  Serial.print(sensorValue);

 // if(sensorValue > 300)
 // {
 //   Serial.print(" | Smoke detected!");
  //}

  Serial.println("");
  delay(2000); // wait 2s for next reading
}
- The code now gives output like this:
Try to place this data in someone’s else work and see how my data displays in their work:
-
I first downloaded processing from here. Neil said that Arduino IDE and Processing are quite similar, if you like one, you will like the other. It is an open source computer programming language and integrated development environment (IDE) built for the electronic arts, new media art, and visual design communities with the purpose of teaching the fundamentals of computer programming in a visual context. The Processing language builds on the Java language, but uses a simplified syntax and a graphics user interface.
-
I got the code from the fabacademy student I found as inspiration and tried to understand the different parts of the code:
/**********************************************
Termometro ed Umidità su piattaforma Processing
Progetto di Giovanni Gentile
http://www.0lab.it
Ottobre 2013
Creative Common License

**********************************************/


import processing.serial.*; // this gets the data from the USB port directly

Serial commPort;

float tempC = 0;
float tempF = 0;
float RH;
float y, h, msbyte, lsbyte;

int yDist, xx=-15;

PFont font12;
PFont font24;

void setup() // void setup is runned once and it sets the setup for the graphic you are going to do
{
font12 = createFont("Helvetica", 13);
font24 = createFont("Helvetica",20);

size(345, 330);
commPort = new Serial(this, Serial.list()[1], 9600);
}

void draw() // void draw is executed continuously. Each run of draw () draws a frame into the application window.
{
background(800);
//Thermometer
//
fill(200, 0, 0);
smooth();
stroke(0, 46, 200);
strokeWeight(8);
ellipse(250, 250, 58, 50);

// Thermometer
noStroke();
fill(0, 46, 200);
arc(250, 30, 30, 20, PI, PI+PI);
rect(235.2,30,30,200);

// Ausführung
fill(250, 250, 250);
rect(245,30,10,200);

// Thermometer numerische Werte
stroke(245, 240, 220);
strokeWeight(1);
textAlign(RIGHT);
fill(0,46,250);

// Farenheit
stroke(0);
for (int i = 0; i < 5; i += 1) {
line(222, 190-40*i, 232, 190-40*i);
if(i < 4) line(225, 170-40*i, 230, 170-40*i);
textFont(font12);
text(str(40+20*i), 218, 195-40*i);
}

// Celsius
textAlign(LEFT);
for (int i = 0; i < 6; i += 1) {
line(268, 204-35*i, 278, 204-35*i);
if(i < 5) line(268, 187-35*i, 273, 187-35*i);
textFont(font12);
text(str(0+10*i), 282, 210-35*i);
}

// Quecksilber
fill(200,0, 0);
smooth();
strokeWeight(0);
y = -2.0*tempF + 268;
h = 240-y;
rect(245.2, y, 10, h);

// Rechteck Umweltdaten
fill(120);
stroke(0);
strokeWeight(1);
rect(10,10,180,140,7);
rect(10,160, 180, 150, 7);
fill(0,0,0);
textFont(font24);
textAlign(LEFT);
text("Fabacademy 2017", 20,35);
text("°C", 70, 70);
text(nfc(tempC, 1), 20, 70);
text("°F", 70, 100);
text(nfc(tempF, 1), 20, 100);
text("% rF", 70, 130);
text(nfc(RH, 0), 20, 130);

textFont(font12);
String s = ("Thermometer GUI with the software processing for Fabacademy 2017");
text(s, 20, 170, 150, 140);
}

void serialEvent(Serial p) {
// get message till line break (ASCII > 13)
String message = p.readStringUntil(13);
if (message != null) {
// try catch function because of possible issues in received data
try {
String[] elements = splitTokens(message);
RH = float(elements[0]);
tempC = float(elements[1]);
tempF = (((tempC)*9)/5) + 32;

println("tempC: "+tempC);
println("tempF: "+ (int)tempF);
println("RH: "+RH);

}
catch (Exception e) {
}
}
}
- I tried using this code just to see how it worked with my input of data values but this did not work directly (I guess I have to arrange the code specifically which is what I will do now).
Make the interface with Processing
- I will first start by understanding the code this person did for the assignment, I get the code and start understanding what everything does in the code:
/**********************************************
Termometro ed Umidità su piattaforma Processing
Progetto di Giovanni Gentile
http://www.0lab.it
Ottobre 2013
Creative Common License

**********************************************/


import processing.serial.*; // this gets the data from the USB port directly where my gas sensor will be connected to

Serial commPort; // the serial library is first integrated (in menu, see step below), and a serial object is created.

float tempC = 0; // all program statements have to be ended with a semicolon ";"
float tempF = 0; // defining floating numbers (see below explanation)
float RH;
float y, h, msbyte, lsbyte; // Least significant bit = lsbyte; Most significant bit = msbyte:

int yDist, xx=-15;

PFont font12;
PFont font24;

void setup() // void setup is runned once and it sets the setup for the graphic you are going to do
{
font12 = createFont("Helvetica", 13); // What is inside (,) are called functions, they perform certain actions
font24 = createFont("Helvetica",20); // in this case they perform the font type and size of the fonts in the graphic

size(345, 330);
commPort = new Serial(this, Serial.list()[1], 9600); // serial port is opened for communication with board
// The command println (Serial.list ()); Lists all available serial devices.
// Here I have to choose the right port (1) and the same Baudrate as in the Arduino IDE
}

void draw() // void draw is executed continuously. Each run of draw () draws a frame into the application window.
{
background(800);
//Thermometer
//
fill(200, 0, 0);
smooth();
stroke(0, 46, 200);
strokeWeight(8);
ellipse(250, 250, 58, 50);

// Thermometer
noStroke();
fill(0, 46, 200);
arc(250, 30, 30, 20, PI, PI+PI);
rect(235.2,30,30,200);

// Ausführung
fill(250, 250, 250);
rect(245,30,10,200);

// Thermometer numerische Werte
stroke(245, 240, 220);
strokeWeight(1);
textAlign(RIGHT);
fill(0,46,250);

// Farenheit
stroke(0);
for (int i = 0; i < 5; i += 1) { // for loop you make a group of statements  (block) with a certain number of
//repetitions: in this case the loop should start at i = 0 and run until i <5. The whole increment by 1.
line(222, 190-40*i, 232, 190-40*i);
if(i < 4) line(225, 170-40*i, 230, 170-40*i);
textFont(font12);
text(str(40+20*i), 218, 195-40*i);
}

// Celsius
textAlign(LEFT);
for (int i = 0; i < 6; i += 1) {
line(268, 204-35*i, 278, 204-35*i);
if(i < 5) line(268, 187-35*i, 273, 187-35*i); //Convert 1 celsius= 268 Fahrenheit
textFont(font12);
text(str(0+10*i), 282, 210-35*i);
}

// Quecksilber
fill(200,0, 0);
smooth();
strokeWeight(0);
y = -2.0*tempF + 268;
h = 240-y;
rect(245.2, y, 10, h);

// Rechteck Umweltdaten
fill(120); // creates variables for colors that may be referred to in the program by a name, rather than a number.
stroke(0); // Sets the color used to draw lines and borders around shapes.
strokeWeight(1); // Sets the width of the stroke used for lines, points, and the border around shapes
rect(10,10,180,140,7); // Draws a rectangle to the screen
rect(10,160, 180, 150, 7);
fill(0,0,0); // Sets the color used to fill shapes
textFont(font24); // Sets the current font that will be drawn with the text() function
textAlign(LEFT); // Sets the current alignment for drawing text
text("Fabacademy 2017", 20,35); //  Draws text to the screen
text("°C", 70, 70);
text(nfc(tempC, 1), 20, 70);
text("°F", 70, 100);
text(nfc(tempF, 1), 20, 100);
text("% rF", 70, 130);
text(nfc(RH, 0), 20, 130);

textFont(font12);
String s = ("Thermometer GUI with the software processing for Fabacademy 2017");
text(s, 20, 170, 150, 140);
}

void serialEvent(Serial p) {
// get message till line break (ASCII > 13)
String message = p.readStringUntil(13);
if (message != null) {
// try catch function because of possible issues in received data
try {
String[] elements = splitTokens(message);
RH = float(elements[0]);
tempC = float(elements[1]);
tempF = (((tempC)*9)/5) + 32;

println("tempC: "+tempC);
println("tempF: "+ (int)tempF);
println("RH: "+RH);

}
catch (Exception e) {
}
}
}
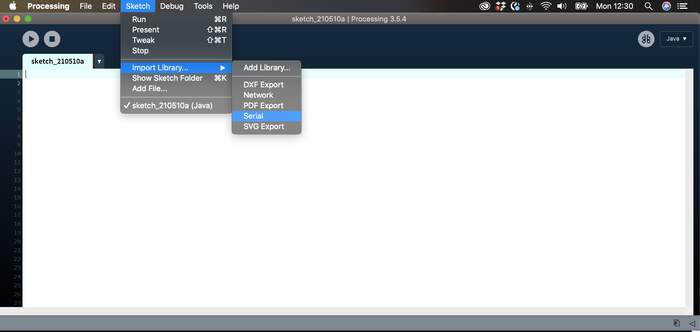
-
To read serial coming from an USB I have to add the serial library in the processing app like this:
-
This will automatically create a command in the code:
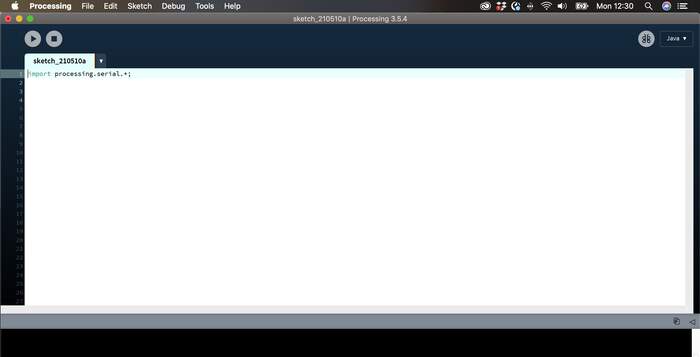
-
Programming in the context of visual arts if what processing is kind of done for. I started to look at these tutorials to understand how to make my code.
-
This tutorial starts from the basics (which is what I need as I have never done processing). In any code you write there has to be a CANVAS. The canvas is a coordinate system, you assign places in the canvas for text and shapes by the x and y coordinates. On a computer screen our units of measurement is in pixels.

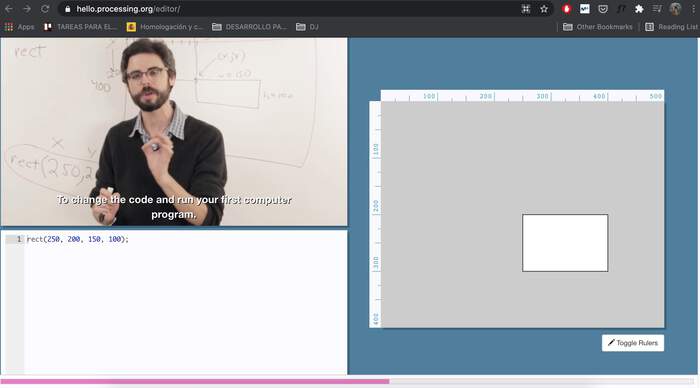
-
It first started saying how to draw a rectangle(which is once of the shapes I need in my design). The function of “rect” draws a rectangle in the window but you have to specify where x and y are(where it is located in the canvas) and the width and height of the rectangle in that canvas. The same goes for an ellipse but with the ellipse the x and point are the center point of the ellipse.
To draw a rectangle: rect(a,b,c,d);
To draw an ellipse: ellipse(a,b,c,d);

a — X (horizontal) location of the shape's upper-left corner
b — Y (vertical) location of the shape's uppper-left corner
c — width of the shape
d — height of the shape
-
Also it is important to node that how you choose to write the order of your drawing is the order it will appear on the screen.
-
To then add colour you have to set up two colours: you have the stroke(trace of the shape) and fill (interior colour of shape). These functions go before the rect function:
stroke(0);
fill(128);
rect(250,200,100,75);
Set the background color: background(r,g,b);
Set the outline color: stroke(r,g,b);
Set the interior color: fill(r,g,b);

Don't forget, you need to call stroke() and fill() before you draw the shape!

r — amount of red, from 0 (none) to 255 (maximum)
g — amount of green, from 0 (none) to 255 (maximum)
b — amount of blue, from 0 (none) to 255 (maximum)
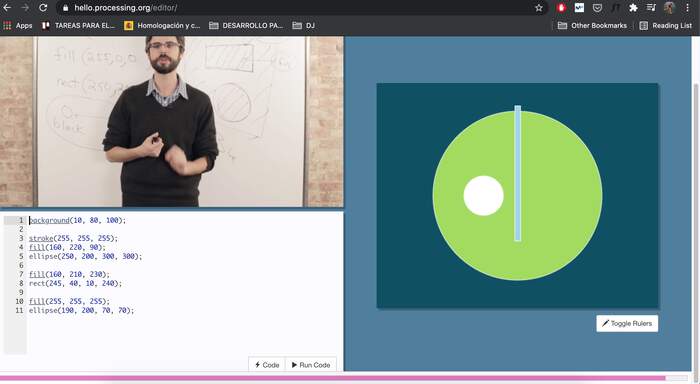
-
If we give this colour one digit like stroke(0) it is a greyscale colour so for example, stroke 0 is black and stroke 255 is white, so everything between this is a tone of grey. But if we give this 3 values (255, 0, 0) then it is a RGB colour, n the same order. It works with the principle of mixing colours between red, green and blue.
-
If you want to create a background color for the canvas you will have to add a background option:
background(216,225,149);

stroke(255,0,0);
fill(0,0,255);
rect(250,200,100,75);
- If we want a program to be animated then we have to create a loop which says something like “draw this rectangle”, “draw this rectangle”, “draw this rectangle” … For this we create two blocks which I explained before. The first block is setup (all the code that happens once at the start) then the other section of code is called draw (which loops continuously over and over). This is the structure we will use and for this we will write it as following. The curly brackets mark the beginning and end of each block. Void is part of the definition of setup and draw, we just have to memorise it.
void setup () {
  size (width, height) //Here you will define the size of the canvas in pixels
}
and
void draw () {
// Here you set all the shapes, stroke, fill, etc... Anything you want to draw
}
-
Also if you place background in the setup the trace of the loop in draw will not be deleted, you can also play with this.
-
If you want to set a location of a shape connected to the movement of your mouse cursor then you can also do the following code, this will make the ellipse move around the canvas following the movement of the mouse, so cool! Processing already understand mouseX as the X value of the mouse.
void setup() {
  size(500,400);
}

void draw() {
  background(0);

  stroke(255);
  fill(128);
  ellipse(mouseX, mouseY, 100, 100); // You can also play with these values such as "mouseX + 5O" or "mouseX/3".
}
- Computer programs can also take different paths so they do not do the same thing all the time in the loop(meaning it can draw a circle and then draw a rectangle), they work like this by answering questions. This is referred as true/false. Based on questions that have an answer of yes or no, the program can turn to one path or to the other. This is called a conditional statement. I need this in order to output certain values of my gas sensor(whether it is too high or too low). The syntax of this is as follows:
if (mousePressed) {
  insert here whatever you want the program to do if mouse pressed
}
- If the mouse is not pressed, everything else is stated as “else”
void setup() { // void setup is runned once and it sets the setup for the graphic you are going to do
  size(500,400);
}

void draw() {
  background(0);
  stroke(255);
  fill(128);

  if (mousePressed) {
    rect(250,200,100,100);
  } else { // meaning if you do not click with the mouse there will be an ellipse
    ellipse(250, 200, 100, 100);
  }
}
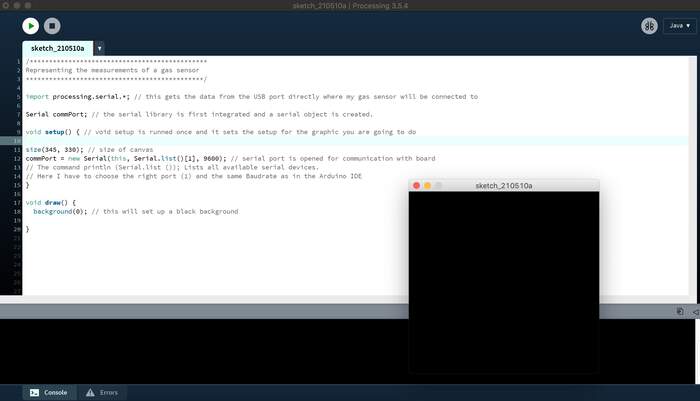
- So far, with what I have learned so far I start writing my code by creating a canvas size and by placing a black background to the graphics I will make:
/**********************************************
Representing the measurements of a gas sensor
**********************************************/

import processing.serial.*; // this gets the data from the USB port directly where my gas sensor will be connected to

Serial commPort; // the serial library is first integrated and a serial object is created.

void setup() { // void setup is runned once and it sets the setup for the graphic you are going to do

size(345, 330); // size of canvas
commPort = new Serial(this, Serial.list()[1], 9600); // serial port is opened for communication with board
// The command println (Serial.list ()); Lists all available serial devices.
// Here I have to choose the right port (1) and the same Baudrate as in the Arduino IDE
}

void draw() {
  background(0); // this will set up a black background

}
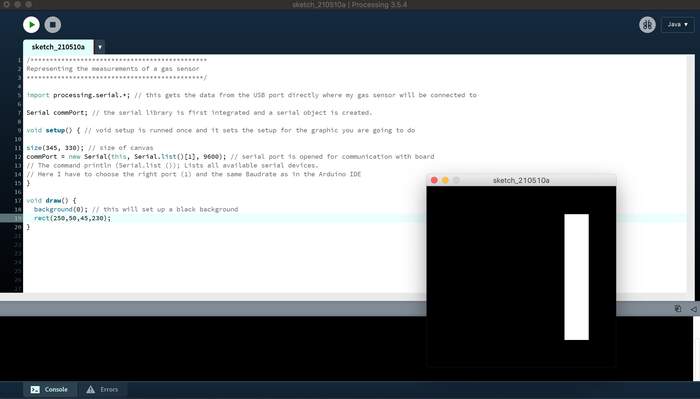
- I will now add a rectangle (which will measure the concentration in gas):
/**********************************************
Representing the measurements of a gas sensor
**********************************************/

import processing.serial.*; // this gets the data from the USB port directly where my gas sensor will be connected to

Serial commPort; // the serial library is first integrated and a serial object is created.

float x = 0

void setup() { // void setup is runned once and it sets the setup for the graphic you are going to do

size(345, 330); // size of canvas
commPort = new Serial(this, Serial.list()[1], 9600); // serial port is opened for communication with board
// The command println (Serial.list ()); Lists all available serial devices.
// Here I have to choose the right port (1) and the same Baudrate as in the Arduino IDE
}

void draw() {
  background(0); // this will set up a black background
  rect(250,50,45,230);
}
- Now my question is How do I actually connect it to the port and represent the data coming from the port? I found a blog which explains how to connect Arduino and Processig. We first import the serial library as I had already done before. This will upload a code line into the code:
import processing.serial.*;
- After this we have to define some global variables which can be used anywhere in the sketch, we do this by adding:
Serial myPort;  // Create object from Serial class which lets us listen for any incoming data from serial port
String val;     // Variable which receives the actual data coming in, the sequence of characters coming from Arduino
- For our setup() method in Processing, we’re going to find the serial port our Arduino is connected to and set up our Serial object to listen to that port.
void setup()
{
  // I know that the first port in the serial list on my mac
  // is Serial.list()[0].
  // On Windows machines, this generally opens COM1.
  // Open whatever port is the one you're using.
  String portName = Serial.list()[0]; //change the 0 to a 1 or 2 etc. to match your port
  myPort = new Serial(this, portName, 9600); // adding the same baud rate as in the Arduino IDE
}
- In our draw() loop, we’re going to listen in on our Serial port and we get something, stick that something in our val variable and print it to the console (that black area at the bottom of your Processing sketch).
void draw()
{
  if ( myPort.available() > 0)
  {  // If data is available,
  val = myPort.readStringUntil('\n');         // read it and store it in val
  }
println(val); //print it out in the console
}
- After this I add new things to the code:
/**********************************************
Representing the measurements of a gas sensor
**********************************************/

import processing.serial.*; // this gets the data from the USB port directly where my gas sensor will be connected to

Serial commPort; // the serial library is first integrated and a serial object is created.

void setup() { // void setup is runned once and it sets the setup for the graphic you are going to do

String portName = Serial.list()[0]; //change the 0 to a 1 or 2 etc. to match your port
myPort = new Serial(this, portName, 9600); // adding the same baud rate as in the Arduino IDE

size(345, 330); // size of canvas
smooth(); // makes everything moving go smoother and nicer
}

void draw() {
  background(0); // this will set up a black background
  rect(250,50,45,230);
}
- I start watching more tutorials on Processing. There are different types of variables which we have to decide on:
int x = 5 // whole
float y = 3.14 // decimal numbers
- I will be using decimal numbers so I add a float variable to my code but this does not work in the code ?
/**********************************************
Representing the measurements of a gas sensor
**********************************************/

import processing.serial.*; // this gets the data from the USB port directly where my gas sensor will be connected to

Serial commPort; // the serial library is first integrated and a serial object is created.
float x = 0 // this line of code does not work?

void setup() { // void setup is runned once and it sets the setup for the graphic you are going to do

String portName = Serial.list()[0]; //change the 0 to a 1 or 2 etc. to match your port
myPort = new Serial(this, portName, 9600); // adding the same baud rate as in the Arduino IDE

size(345, 330); // size of canvas
smooth(); // makes everything moving go smoother and nicer
}

void draw() {
  background(0); // this will set up a black background
  rect(250,50,45,230);
}
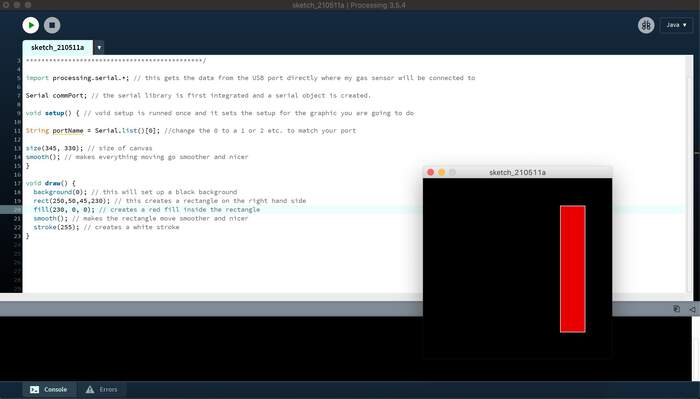
- I will give a fill and stroke to the rectangle:
**********************************************/

import processing.serial.*; // this gets the data from the USB port directly where my gas sensor will be connected to

Serial commPort; // the serial library is first integrated and a serial object is created.

void setup() { // void setup is runned once and it sets the setup for the graphic you are going to do

String portName = Serial.list()[0]; //change the 0 to a 1 or 2 etc. to match your port
//myPort = new Serial(this, portName, 9600); // adding the same baud rate as in the Arduino IDE (this line of code does not work???)

size(345, 330); // size of canvas
smooth(); // makes everything moving go smoother and nicer
}

void draw() {
  background(0); // this will set up a black background
  rect(250,50,45,230); // this creates a rectangle on the right hand side
  fill(230, 0, 0); // creates a red fill inside the rectangle
  smooth(); // makes the rectangle move smoother and nicer
  stroke(255); // creates a white stroke
}
-
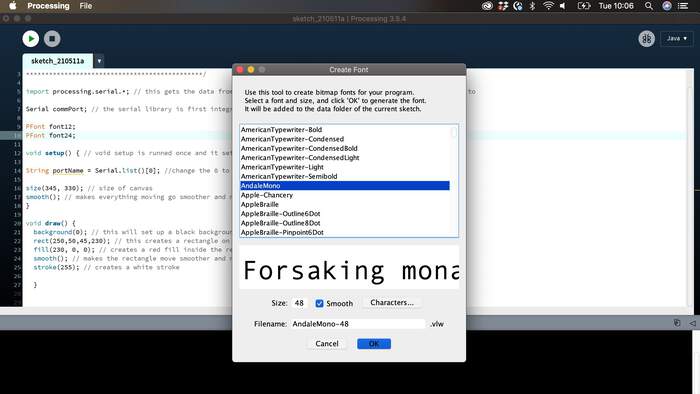
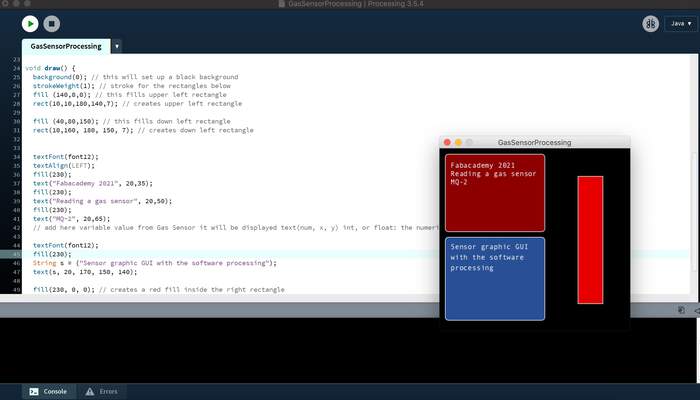
In order to add text I understood that PFont is used to incorporate the fonts library in the processing graphic. “PFont is the font class for Processing. To create a font to use with Processing, select “Create Font…” from the Tools menu. This will create a font in the format Processing requires and also adds it to the current sketch’s data directory. Processing displays fonts using the .vlw font format, which uses images for each letter, rather than defining them through vector data. The loadFont() function constructs a new font and textFont() makes a font active. The list() method creates a list of the fonts installed on the computer, which is useful information to use with the createFont() function for dynamically converting fonts into a format to use with Processing.” I added text as follows:
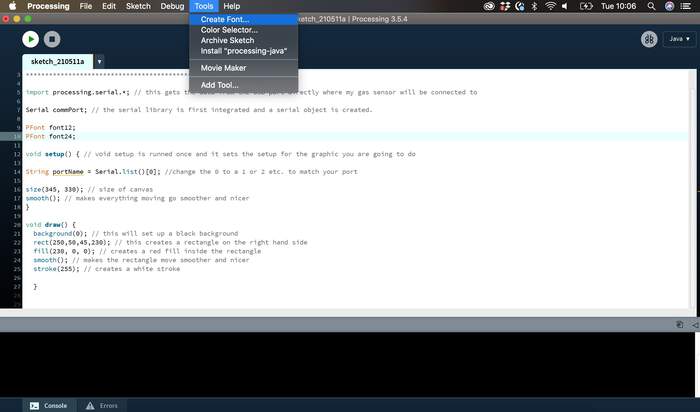
-
I started playing with text:
/**********************************************
Representing the measurements of a gas sensor
**********************************************/

import processing.serial.*; // this gets the data from the USB port directly where my gas sensor will be connected to

Serial commPort; // the serial library is first integrated and a serial object is created.

PFont font12;
PFont font24;

void setup() { // void setup is runned once and it sets the setup for the graphic you are going to do

font12 = createFont("AndaleMono", 13);
font24 = createFont("AndaleMono",20);

size(345, 330); // size of canvas
smooth(); // makes everything moving go smoother and nicer

commPort = new Serial(this, Serial.list()[1], 57600); // connects to serial port (USB)

}

void draw() {
  background(0); // this will set up a black background
  strokeWeight(1); // stroke for the rectangles below
  fill (140,0,0); // this fills upper left rectangle
  rect(10,10,180,140,7); // creates upper left rectangle

  fill (40,80,150); // this fills down left rectangle
  rect(10,160, 180, 150, 7); // creates down left rectangle, the 7 is to create fillets on the rectangle


  textFont(font12);
  textAlign(LEFT);
  fill(230);
  text("Fabacademy 2021", 20,35);
  fill(230);
  text("Reading a gas sensor", 20,50);
  fill(230);
  text("MQ-2", 20,65);
  // add here variable value from Gas Sensor it will be displayed text(num, x, y) int, or float: the numeric value to be displayed

  textFont(font12);
  fill(230);
  String s = ("Sensor graphic GUI with the software processing");
  text(s, 20, 170, 150, 140);

  fill(0, 80, 50); // creates a red fill inside the right rectangle
  smooth(); // makes the rectangle move smoother and nicer
  stroke(255); // creates a white stroke
  rect(220,10,100,299,7); // this creates a rectangle on the right hand side

  }
-
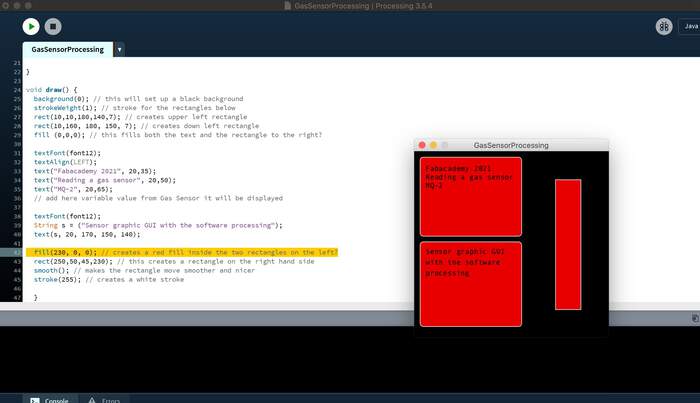
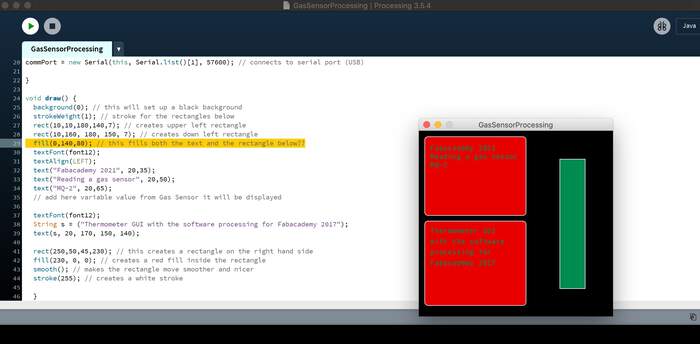
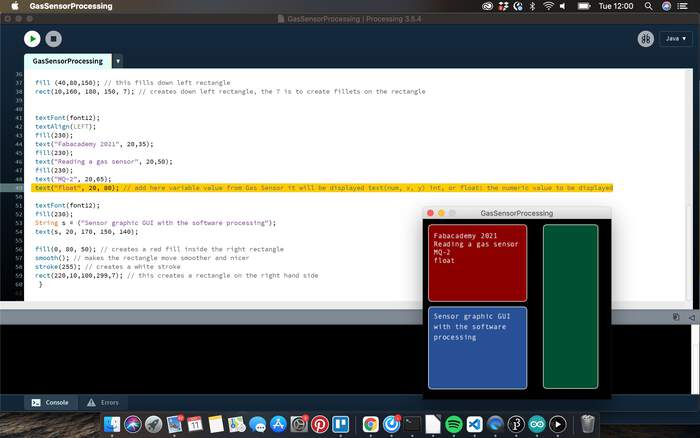
I understood much more about the order of elements, how to change colour, font, size, add fillets, these were some of the steps I tried till the final outcome of the look of the graphic interface (the last photo):
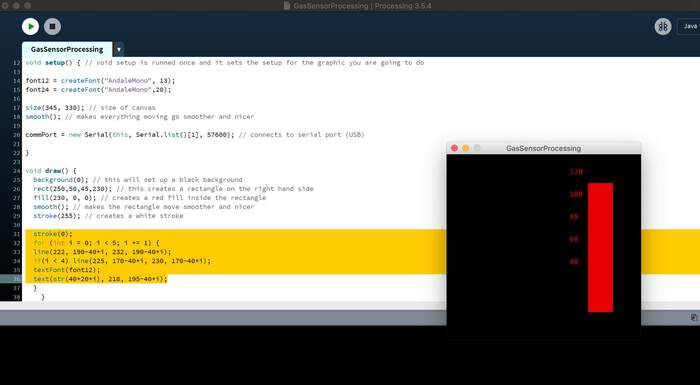
-
I still don’t understand the difference between text and string but I will try to understand better later.
-
Now I will try to understand how to display the number value in the upper red box coming from the serial port. From integers and float I understand that: “Integers and floats are two different kinds of numerical data. An integer (more commonly called an int) is a number without a decimal point. A float is a floating-point number, which means it is a number that has a decimal place. Floats are used when more precision is needed.” I alread understood this before and I decide to create a float for my value. How do I connect this value from the data coming from the sensor?. Then I found the [read function](https://www.processing.org/reference/libraries/serial/Serial_read_.html which looks something like this:
// Example by Tom Igoe

import processing.serial.*;

Serial myPort;  // The serial port

void setup() {
  // List all the available serial ports
  printArray(Serial.list());
  // Open the port you are using at the rate you want:
  myPort = new Serial(this, Serial.list()[0], 9600);
}

void draw() {
  while (myPort.available() > 0) {
    int inByte = myPort.read();
    println(inByte);
  }
}
- The example code I am using displays this as this:
void serialEvent(Serial p) {
// get message till line break (ASCII > 13)
String message = p.readStringUntil(13);
if (message != null) {
// try catch function because of possible issues in received data
try {
String[] elements = splitTokens(message);
RH = float(elements[0]);
tempC = float(elements[1]);
tempF = (((tempC)*9)/5) + 32;

println("tempC: "+tempC);
println("tempF: "+ (int)tempF);
println("RH: "+RH);
- From these two I try to see how to incorporate this to my code and it gives me no errors:
/**********************************************
Representing the measurements of a gas sensor
**********************************************/

import processing.serial.*; // this gets the data from the USB port directly where my gas sensor will be connected to

Serial commPort; // the serial library is first integrated and a serial object is created.

float gasvalue = 0; //creating a float variable for the input coming from gas sensor

PFont font12;
PFont font24;

void setup() { // void setup is runned once and it sets the setup for the graphic you are going to do

font12 = createFont("AndaleMono", 13);
font24 = createFont("AndaleMono",20);

size(345, 330); // size of canvas
smooth(); // makes everything moving go smoother and nicer

commPort = new Serial(this, Serial.list()[1], 57600); // connects to serial port (USB)

}

void draw() {

  while (commPort.available() > 0) { //get data from the serial port
    float gasvalue = commPort.read(); // connects float variable to serial port?
    println(gasvalue); // prints out serial port value?
  }

  background(0); // this will set up a black background
  strokeWeight(1); // stroke for the rectangles below
  fill (140,0,0); // this fills upper left rectangle
  rect(10,10,180,140,7); // creates upper left rectangle

  fill (40,80,150); // this fills down left rectangle
  rect(10,160, 180, 150, 7); // creates down left rectangle, the 7 is to create fillets on the rectangle


  textFont(font12);
  textAlign(LEFT);
  fill(230);
  text("Fabacademy 2021", 20,35);
  fill(230);
  text("Reading a gas sensor", 20,50);
  fill(230);
  text("MQ-2", 20,65);
  // add here variable value from Gas Sensor it will be displayed text(num, x, y) int, or float: the numeric value to be displayed

  textFont(font12);
  fill(230);
  String s = ("Sensor graphic GUI with the software processing");
  text(s, 20, 170, 150, 140);

  fill(0, 80, 50); // creates a red fill inside the right rectangle
  smooth(); // makes the rectangle move smoother and nicer
  stroke(255); // creates a white stroke
  rect(220,10,100,299,7); // this creates a rectangle on the right hand side

   }
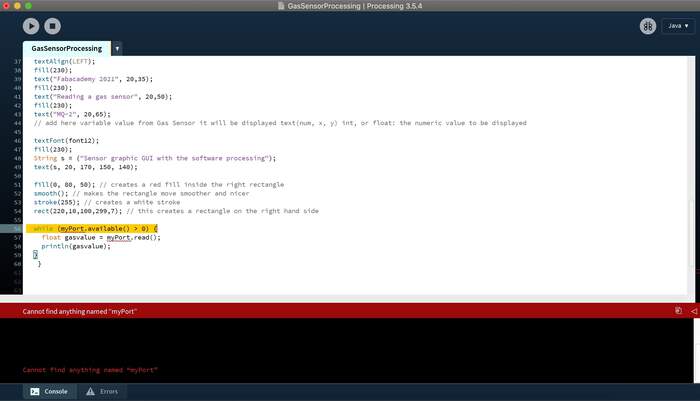
-
It is important to display the same port number or you will get this error:
-
But I still don’t understand how to connect the variable to the serial read. I found this example online. I started to try out different codes.
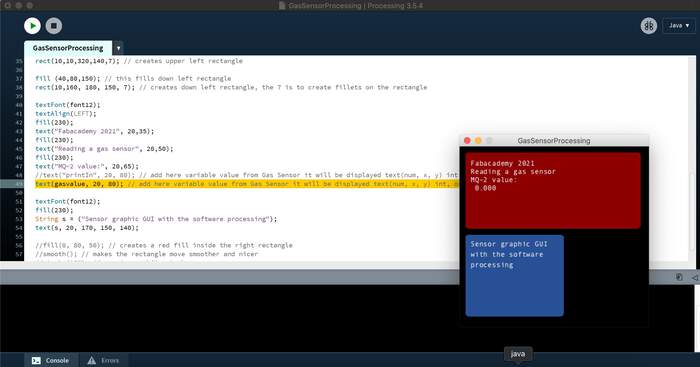
-
First, I was given a value of 0.000 which would not move, where were these 0s coming from?
-
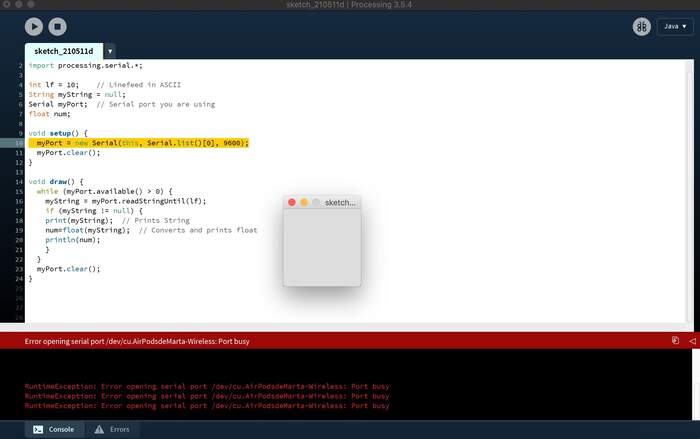
Then I tried this code to see which port was my serial connected to:
import processing.serial.*;

int lf = 10;    // Linefeed in ASCII
String myString = null;
Serial myPort;  // Serial port you are using
float num;

void setup() {
  myPort = new Serial(this, Serial.list()[0], 9600);
  myPort.clear();
}

void draw() {
  while (myPort.available() > 0) {
    myString = myPort.readStringUntil(lf);
    if (myString != null) {
    print(myString);  // Prints String
    num=float(myString);  // Converts and prints float
    println(num);
    }
  }
  myPort.clear();
}
-
And I discovered the serial was trying to connect to a port which was not the USB port I wanted it to connect to.
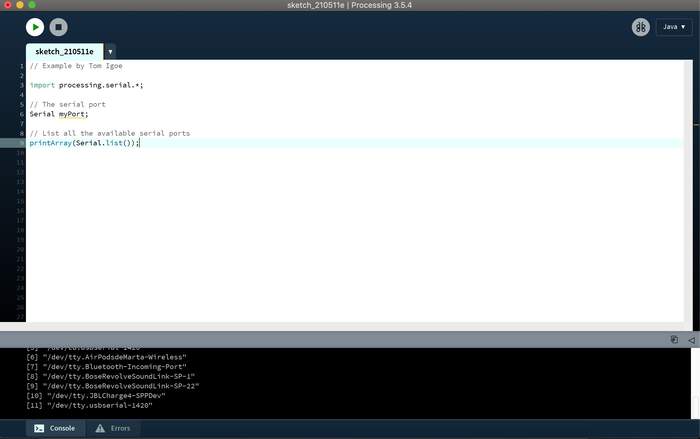
-
I had read something about serial list before so I went back to the processing web to understand this function. When I performed this code Processing would give me a list of all the serial devices my computer could connect to. The one that was connected to my gas sensor was serial port [11].
-
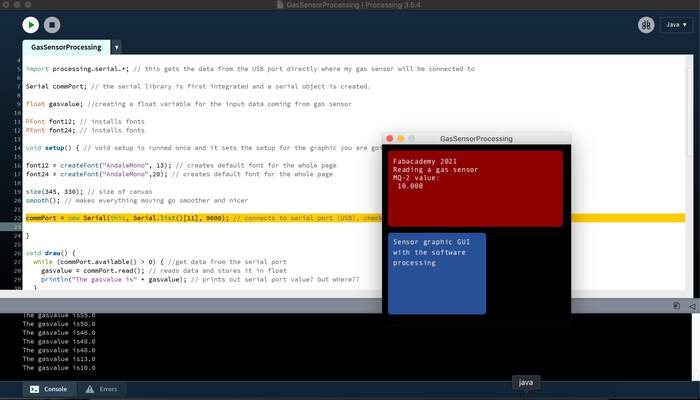
I changed the serial port from 0 to 11 and now I could see how processing would print (with the printIn function) the values underneath constantly just like in the arduino serial monitor (by the way you have to close arduino IDE to perform this on Processing) but the graphical interface would only display the last value shown:
-
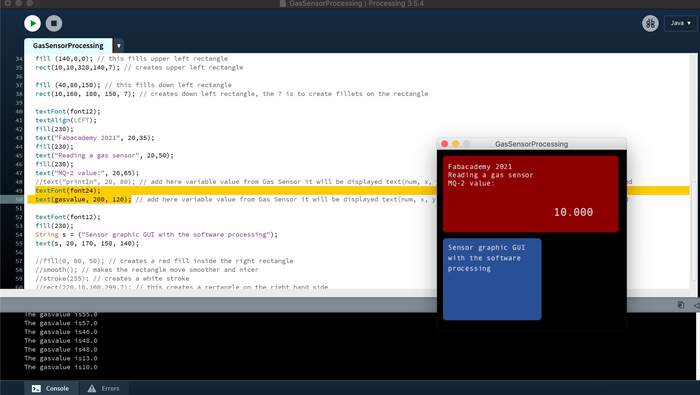
I also changed the way it would look:
-
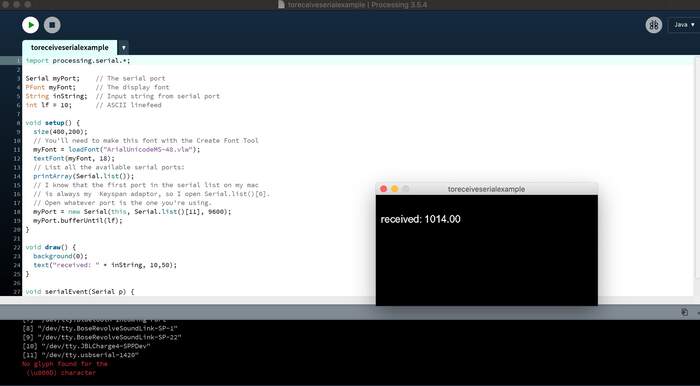
Then I looked for another code example which would display the printin values in the graphical interface:
import processing.serial.*;

Serial myPort;    // The serial port
PFont myFont;     // The display font
String inString;  // Input string from serial port
int lf = 10;      // ASCII linefeed

void setup() {
  size(400,200);
  // You'll need to make this font with the Create Font Tool
  myFont = loadFont("ArialUnicodeMS-48.vlw");
  textFont(myFont, 18);
  // List all the available serial ports:
  printArray(Serial.list());
  // I know that the first port in the serial list on my mac
  // is always my  Keyspan adaptor, so I open Serial.list()[0].
  // Open whatever port is the one you're using.
  myPort = new Serial(this, Serial.list()[11], 9600);
  myPort.bufferUntil(lf);
}

void draw() {
  background(0);
  text("received: " + inString, 10,50);
}

void serialEvent(Serial p) {
  inString = p.readString();
}
- This worked!
-
Now I had to incorporate this to my other code but when I did so it gave me a “void error”.
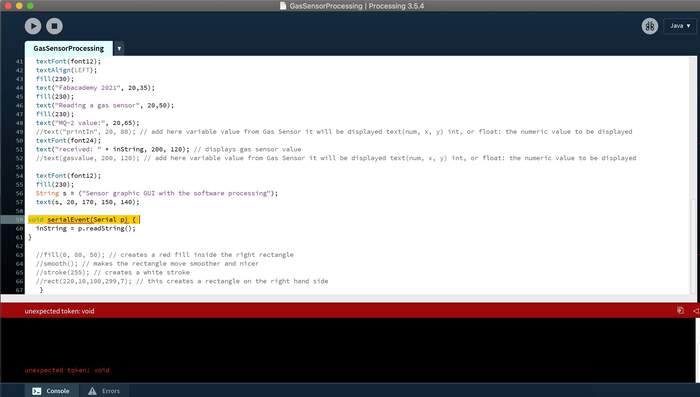
-
I then discovered this was just because I had a syntax error for not closing the void draw with an “}”. Now it works!
- This week was really nice because although I did not make a complex thing at all I learned how to do the code from scratch. Really understanding what everything did within the code and from the basics. This is the final code I used where I explain everything I did:
/**********************************************
Representing the measurements of a gas sensor
**********************************************/

import processing.serial.*; // this gets the data from the USB port directly where my gas sensor will be connected to

Serial commPort; // the serial library is first integrated and a serial object is created.
PFont font12; // installs font we will be using
PFont font24; // installs fonts we will be using
String inString; // Input string(characters) from serial port
int lf = 10;      // Converts any value of a primitive data type (boolean, byte, char, color, float, int, or long) or String to its integer representation.

void setup() { // void setup is runned once and it sets the setup for the graphic you are going to do

font12 = createFont("AndaleMono", 13); // creates default font for the whole page, I uploaded it from the Create Font Tool
font24 = createFont("AndaleMono",20); // creates default font for the whole page

size(345, 330); // size of canvas
smooth(); // makes everything moving go smoother and nicer
printArray(Serial.list()); // prints list of serial devices on black screen below
commPort = new Serial(this, Serial.list()[11], 9600); // connects to serial port (USB), check the baud rate
commPort.bufferUntil(lf); //
}

void draw() {

  background(0); // this will set up a black background
  strokeWeight(1); // stroke for the rectangles below
  fill (140,0,0); // this fills upper left rectangle
  rect(10,10,320,140,7); // creates upper left rectangle

  fill (40,80,150); // this fills down left rectangle
  rect(10,160, 180, 150, 7); // creates down left rectangle, the 7 is to create fillets on the rectangle

  textFont(font12);
  textAlign(LEFT);
  fill(230);
  text("Fabacademy 2021", 20,35);
  fill(230);
  text("Reading a gas sensor", 20,50);
  fill(230);
  text("MQ-2 value:", 20,65);
  textFont(font24);
  text(inString, 200, 120); // displays gas sensor value

  textFont(font12);
  fill(230);
  String s = ("Sensor graphic GUI with the software processing");
  text(s, 20, 170, 150, 140);

  //fill(0, 80, 50); // creates a red fill inside the right rectangle
  //smooth(); // makes the rectangle move smoother and nicer
  //stroke(255); // creates a white stroke
  //rect(220,10,100,299,7); // this creates a rectangle on the right hand side
}

void serialEvent(Serial p) {
  inString = p.readString();

   }
Tips and learning from processing to create code:
-
every line of code are instructions in the form of text to perfom a specific function
-
every line of command ends with a semicolon “;”
-
how you choose to write the order of your drawing is the order it will appear on the screen.
-
make sure your baud rates match
-
make sure you’re reading off the right port in Processing - there’s a Serial.list() command that will show you all the available ports you can connect to.
Files to this week’s assignments:
-
This is the Ki-CAD schematic file in PDF for the new gas sensor board| kicadschm
-
This is the holes PNG for the new gas sensor board | holes
-
This is the traces PNG for the new gas sensor board | traces
-
This is the interior PNG for new gas sensor board | interior