
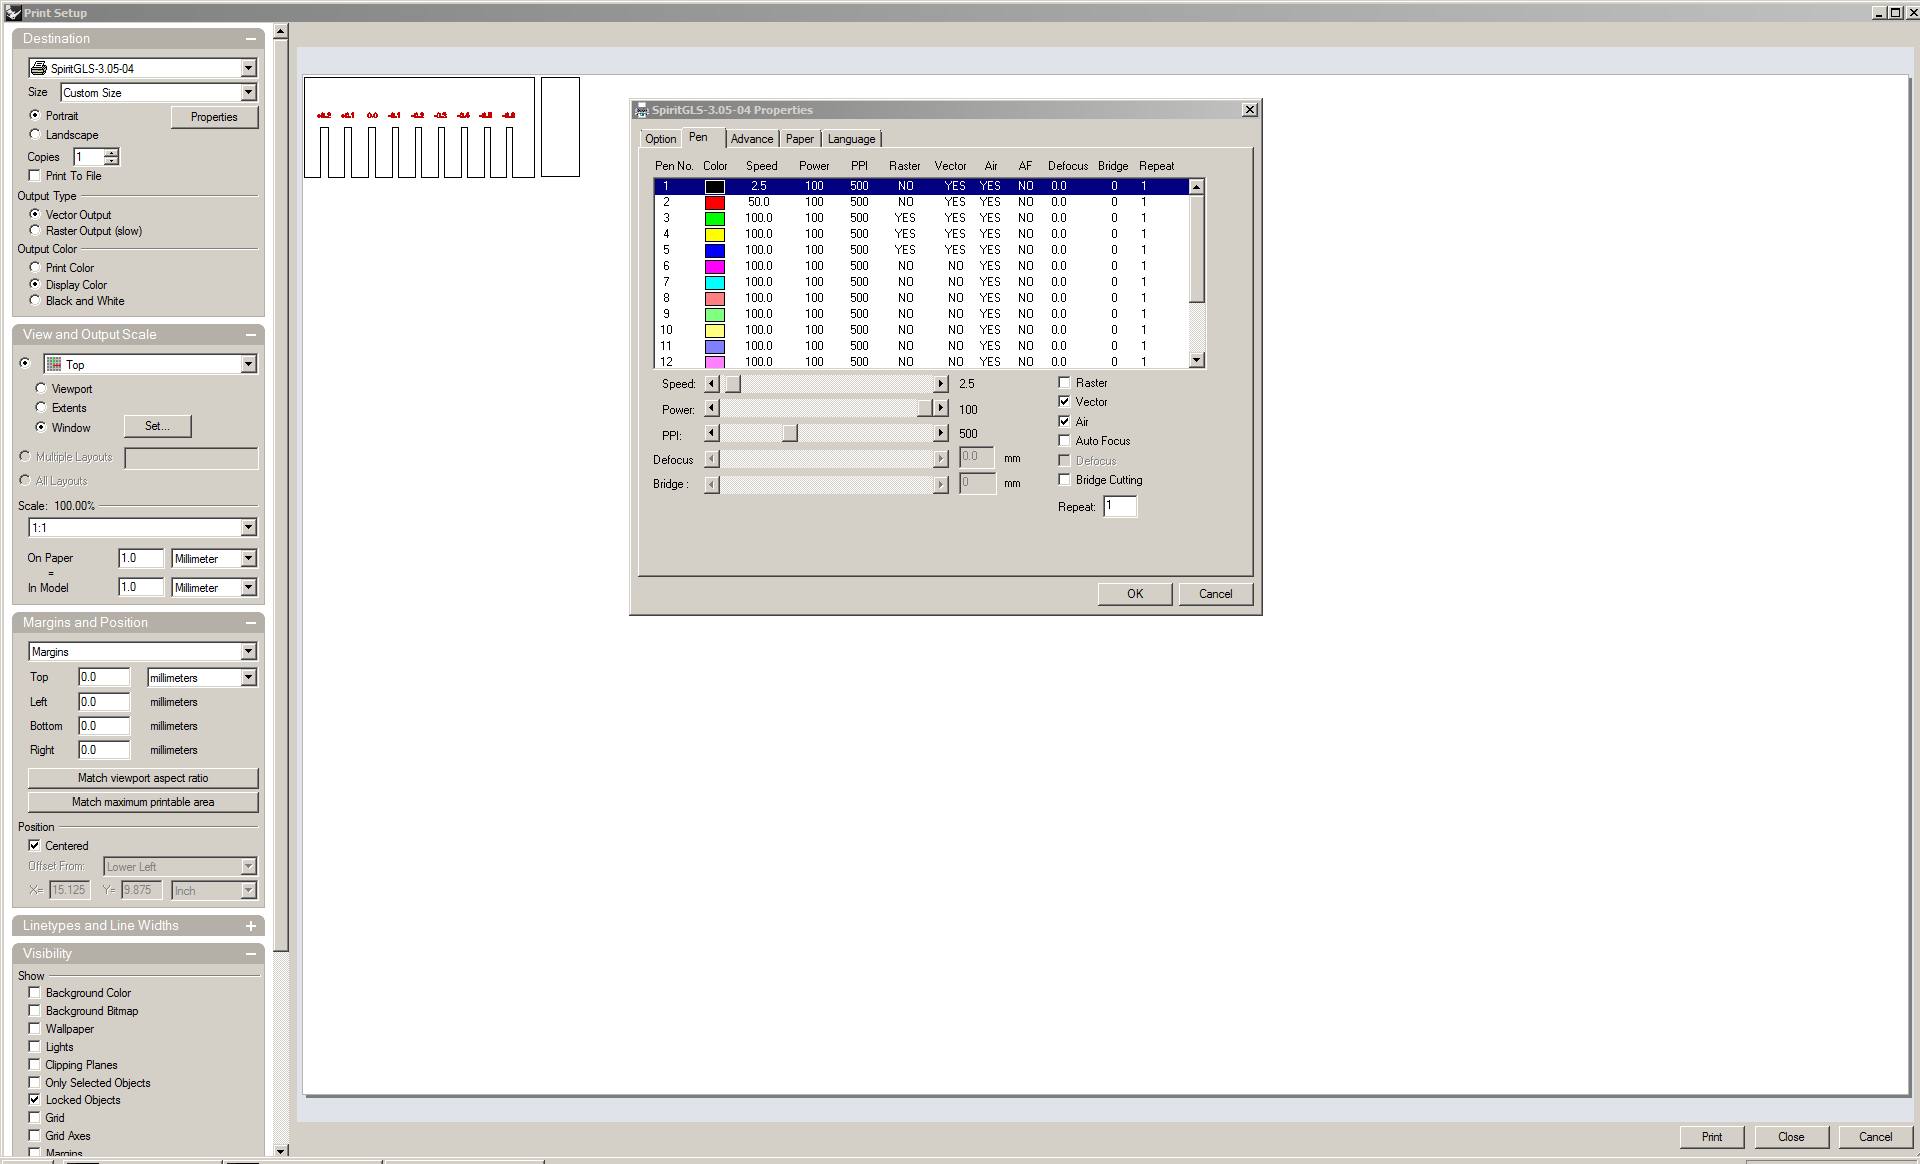
We cutted everything with a Spirit GLS machine and using the print driver from Rhinoceros.
We use this
setting for cutting and engraving: Material: Playwood 4mm Engraving settings: Speed 100%, Power 50%, PPI 500.
Cut Setting: Speed 2.5%, Power 100%, PPI 500.
We try with plexiglas 3mm.
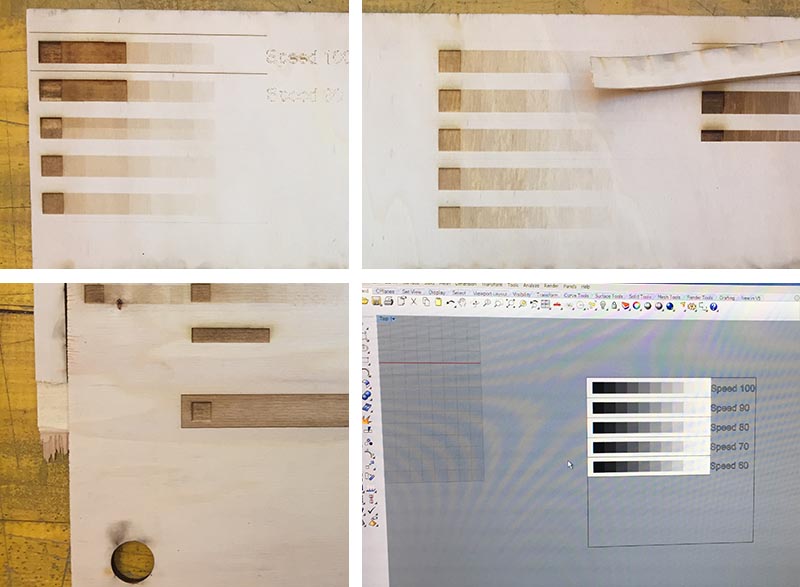
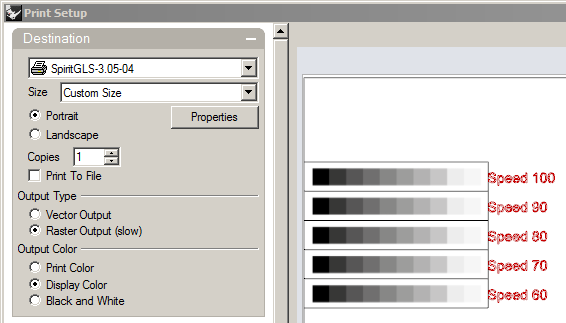
For the engraving test we created a vector file with Inkscape which contained a series of grayscale squares. The idea was to export in jpg format and import into Rhinoceros to understand how the machine behaved in the raster engraving of jpg images. This was meant to understand how much the raster engraving varied with speed. Always leaving the power unchanged. This experiment failed a lot because we could not figure out what was the right setting to let the laser image read the jpg in the best way..
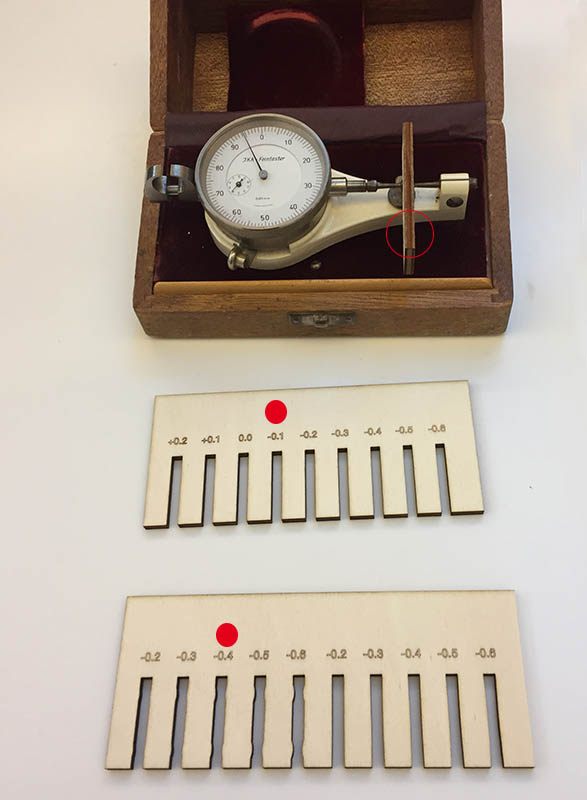
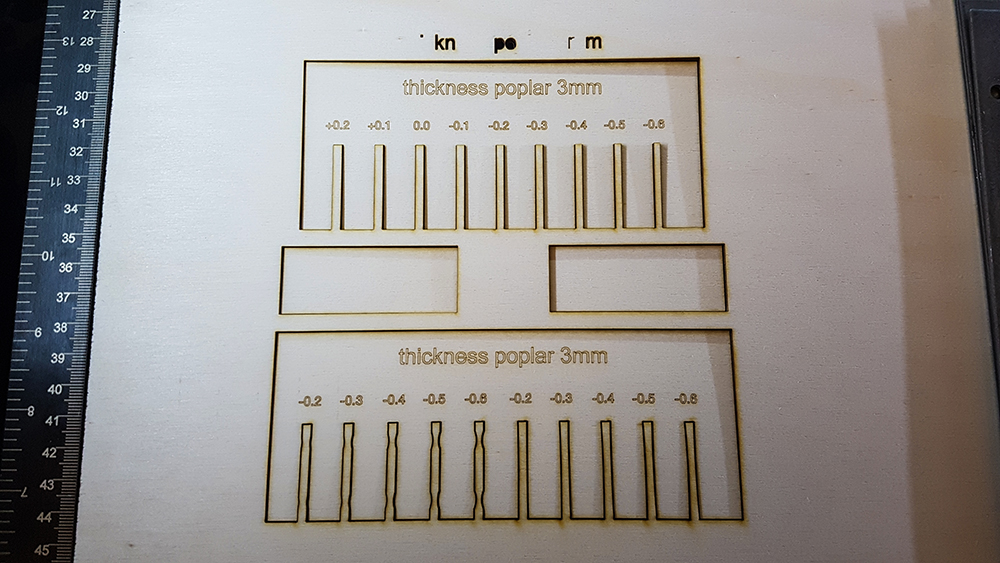
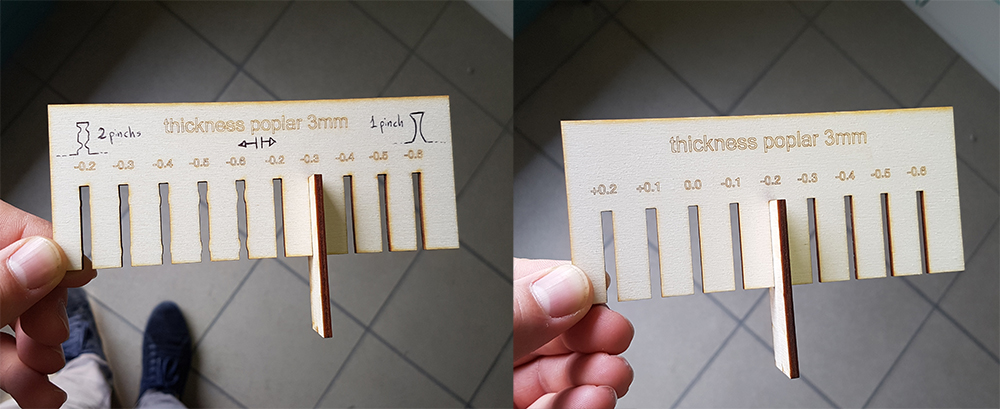
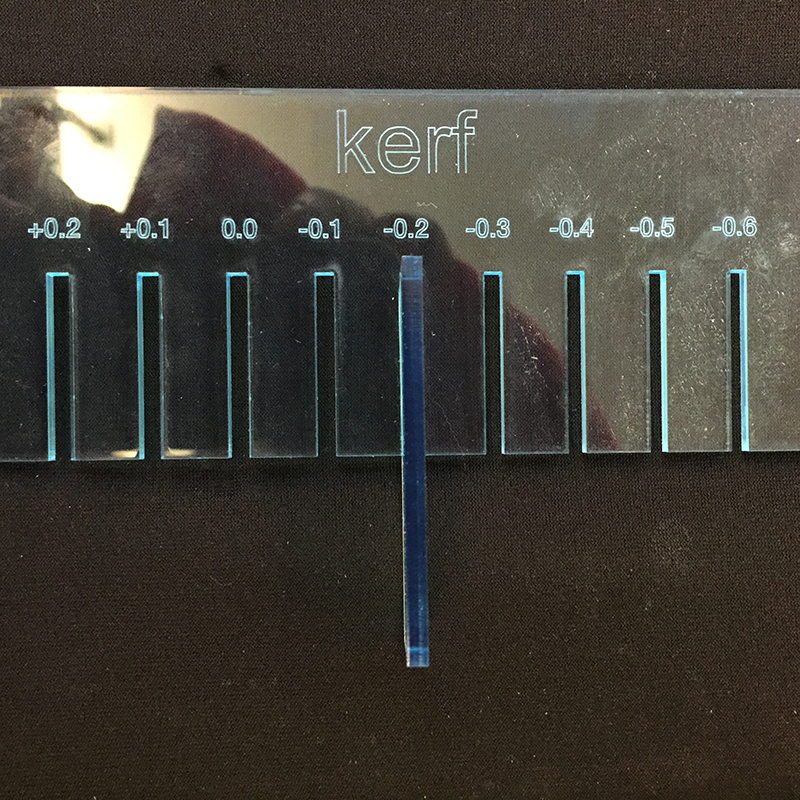
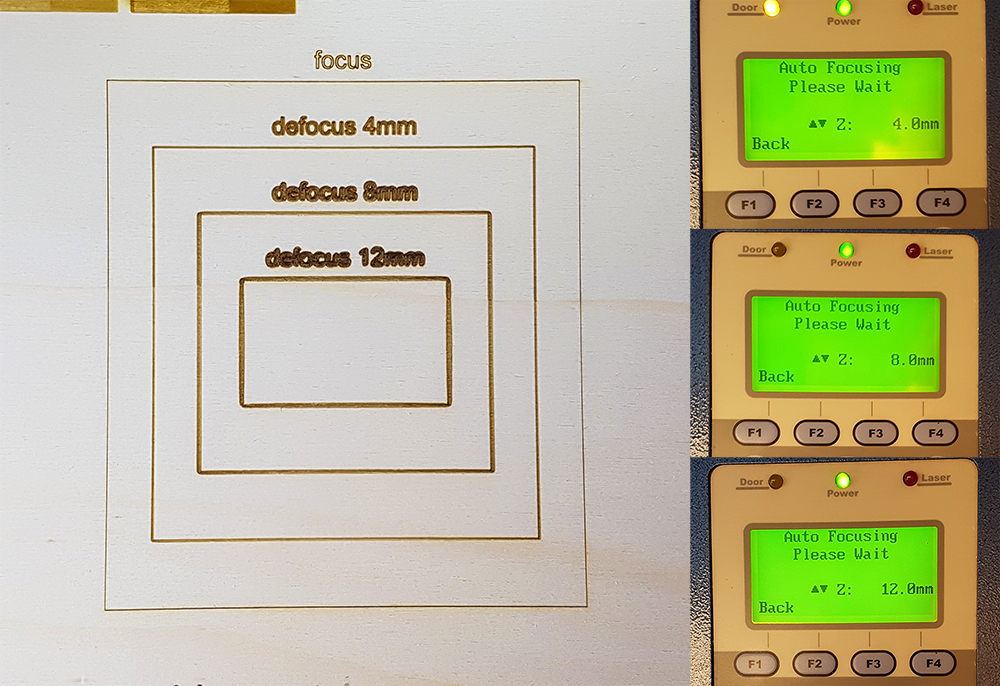
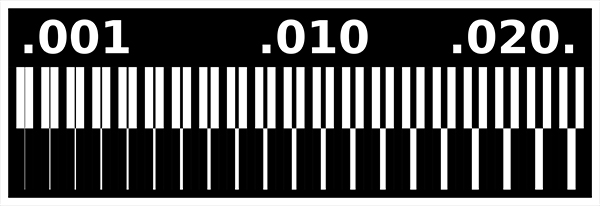
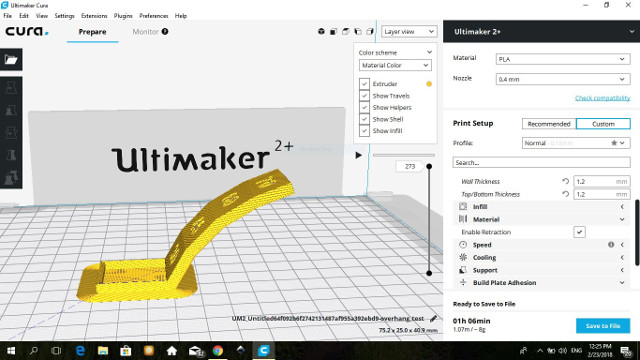
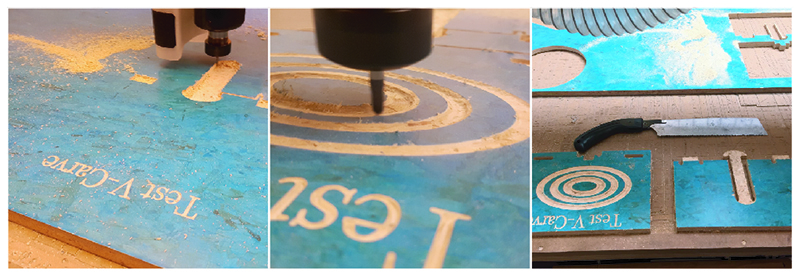
What happen if I defocused voluntarily? In this case the line is not more 0.2mm, but its width increases so as increases the defocus. So we prepared a test with 3 different steps of defocus, from one to other we move down the bed of lasercut for 4mm, to evaluate when the borders of lines became unacceptable. When the laser is perfectly focused (the machine have Autofocus), the width of line is 0.2mm. When we moved down the result was absolutely acceptable, the line's width is now 0.6mm. At 8mm was again perfectly acceptable, the lines have a good uniformity of width, that is now 1mm, just in corners there is a little smooth. At 12mm the line was again clean, the width is now 1,4mm but the smooth on corners was more evident, is perfect again for curvilinear drawing. This trick is very useful when we need to create solid texts or words and don't want spend so much time in engrave the solid hatch of letters o numbers (we have always remember that in this case we have use vector line and font in single stroke fonts and we have disable raster)

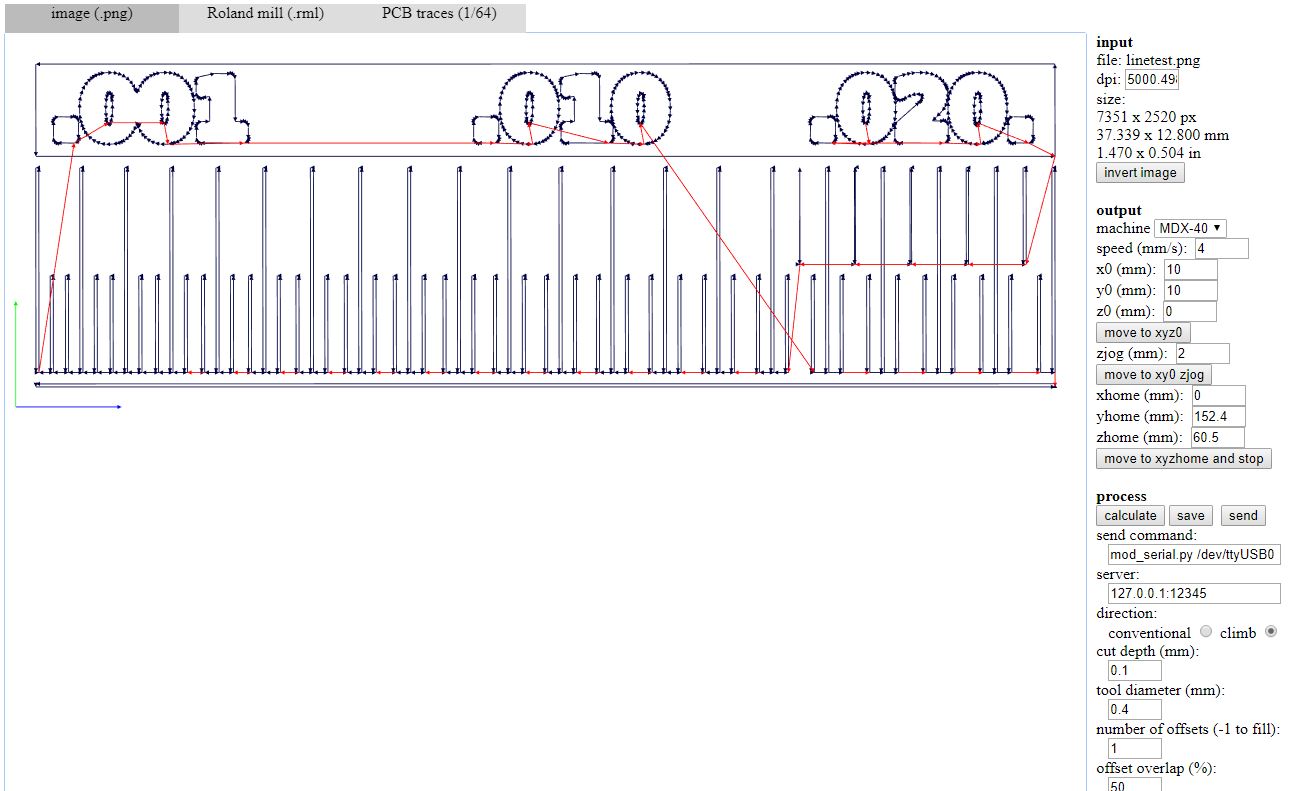
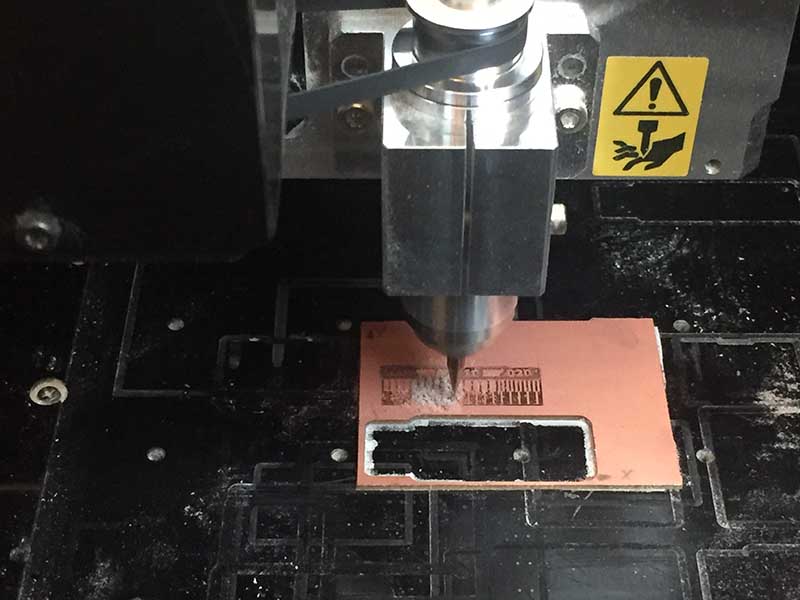
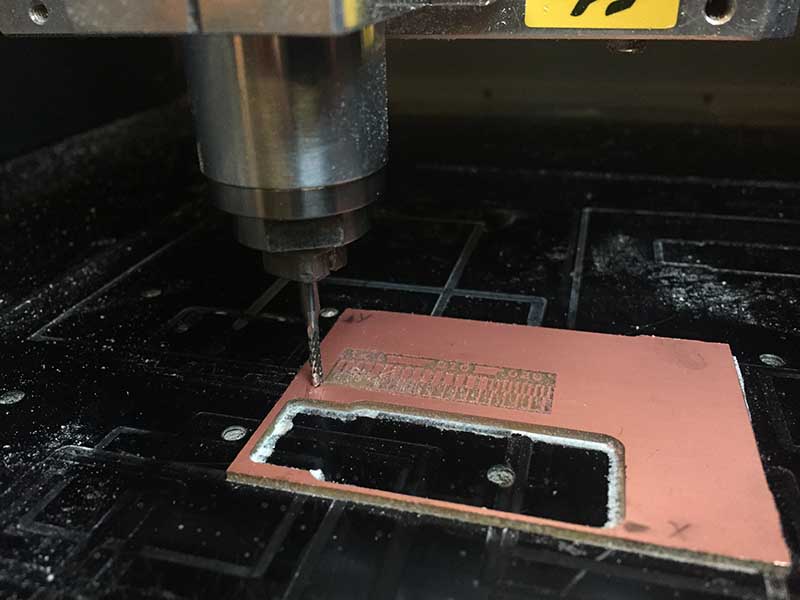
We uploaded two PNG file (traces and cut) on fabmodules (check the DPI of the images (1000) and verify that the images have the same size). TRACES: select "Roland Mill" as output format, and "PBC traces 1/64" as process. After we select MDX-40 Machine. We left the positions of the axis unchanged because we preferred to manage them directly in the cutter software. We select 4m/s as speed and 0,1 as cut depth, for the traces the diameter of the tool is 0,4 mm. Then "Calculate the path" and save to outcome (an .rml file).
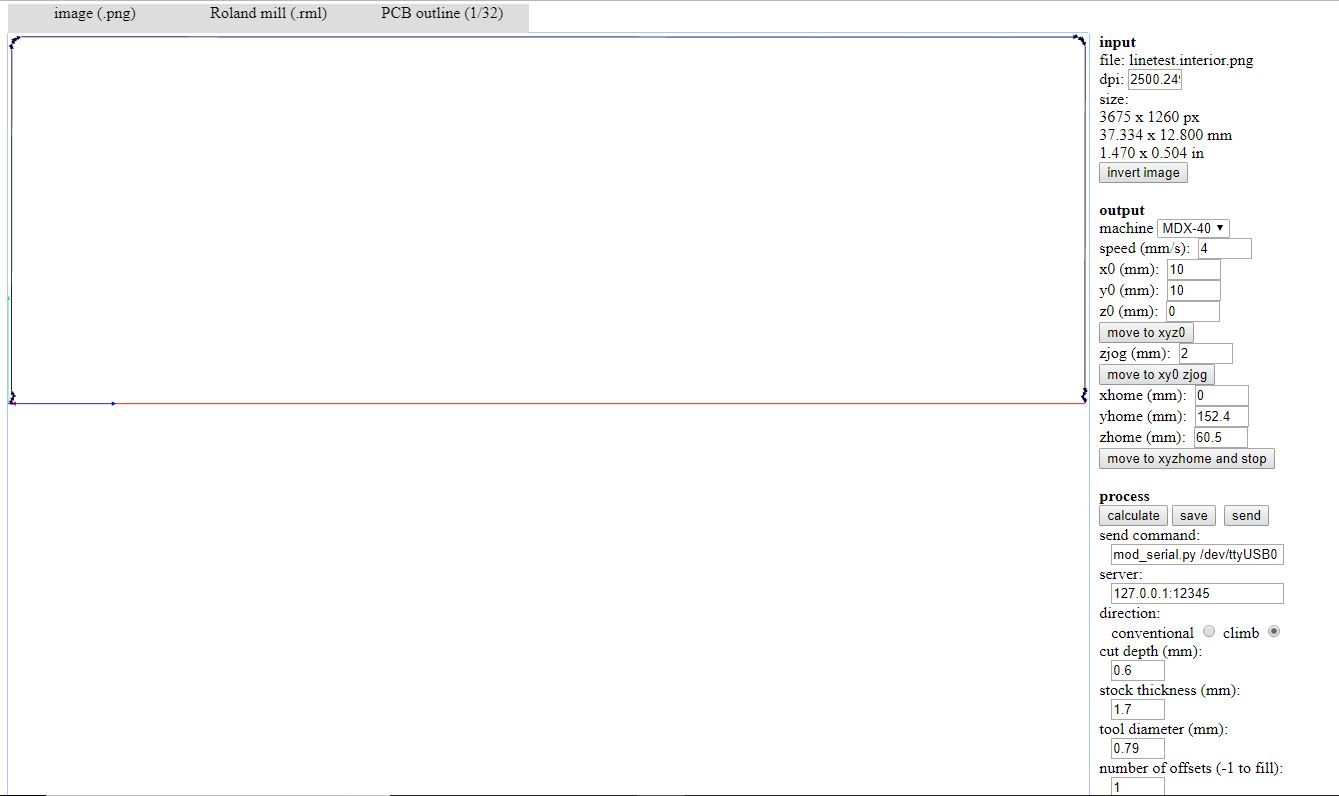
Use this settings for cut file.
Milling tools:
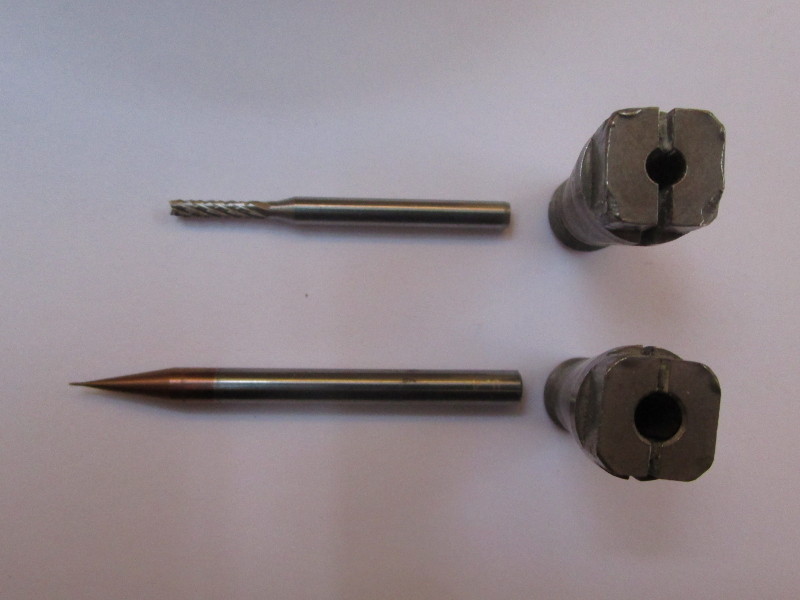
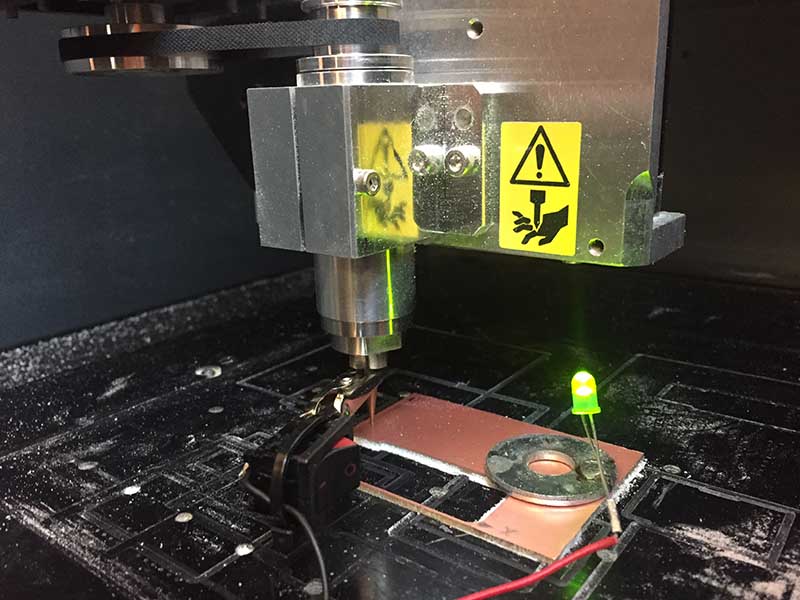
We start with traces file, mount milling tool and set the zero on the three axes on Roland V panel.
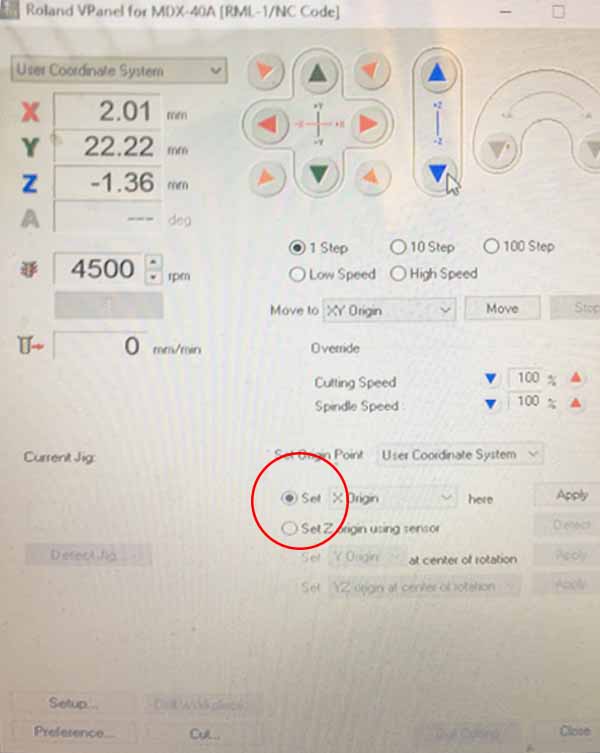
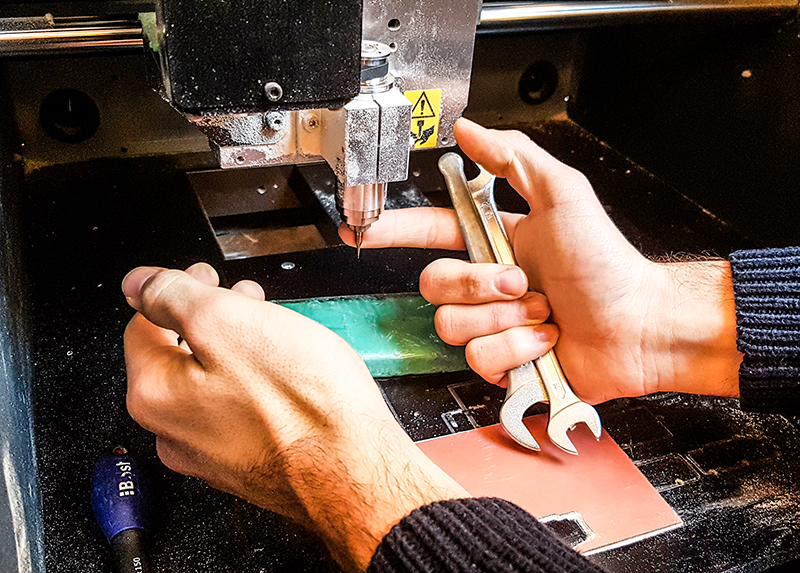
Change of Milling tool for cut file, on V panel make a new Z origin.
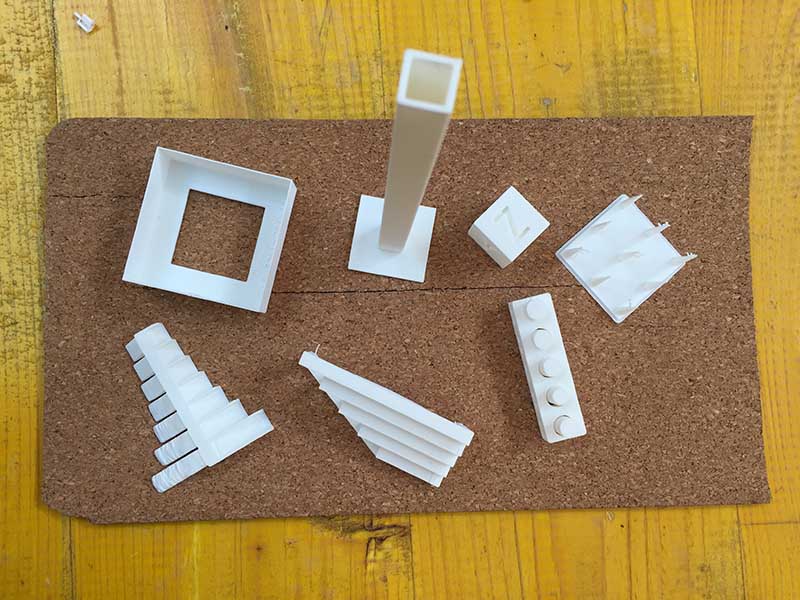
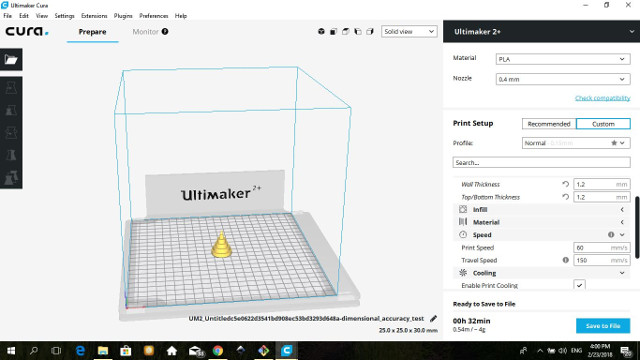
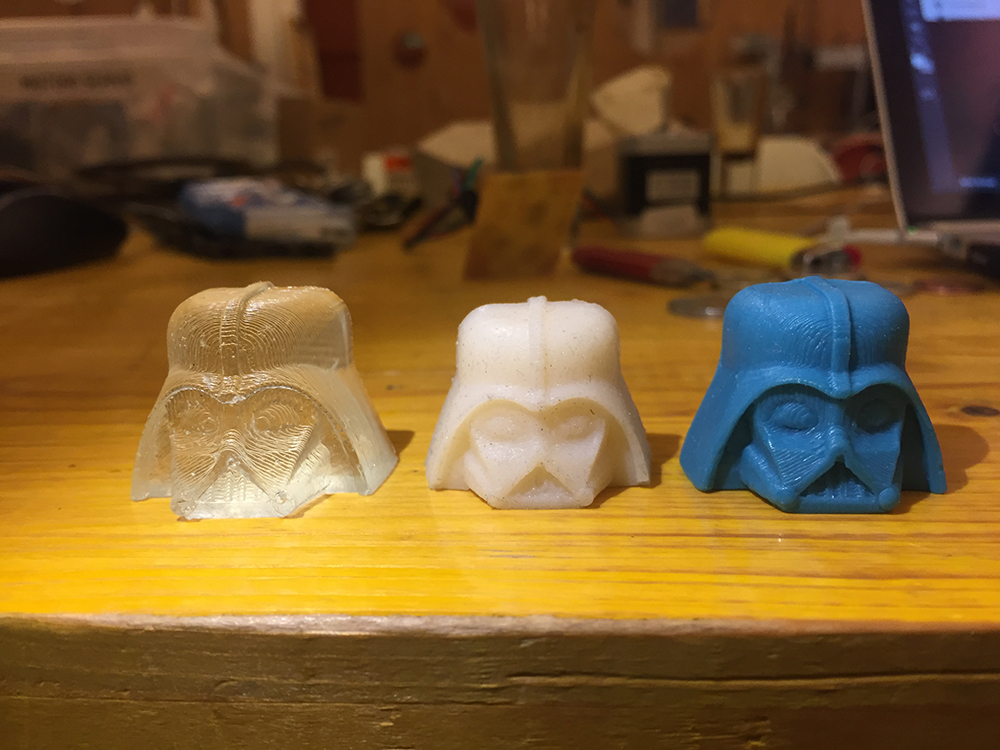
For the characterization of the 3d printer we choose and download .STL files of this test collection and of another test on Thingiverse because on the gallery there are more test images and it's funny to see different result with different printers.
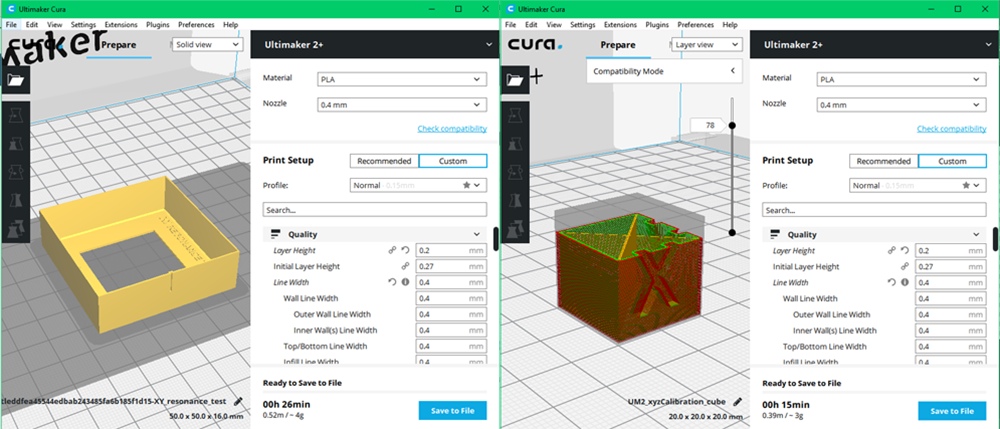
We create the gcode from CURA software and print all the test with Ultimaker 2+ printer. In Opendot there are other printer, you can see it on this page.
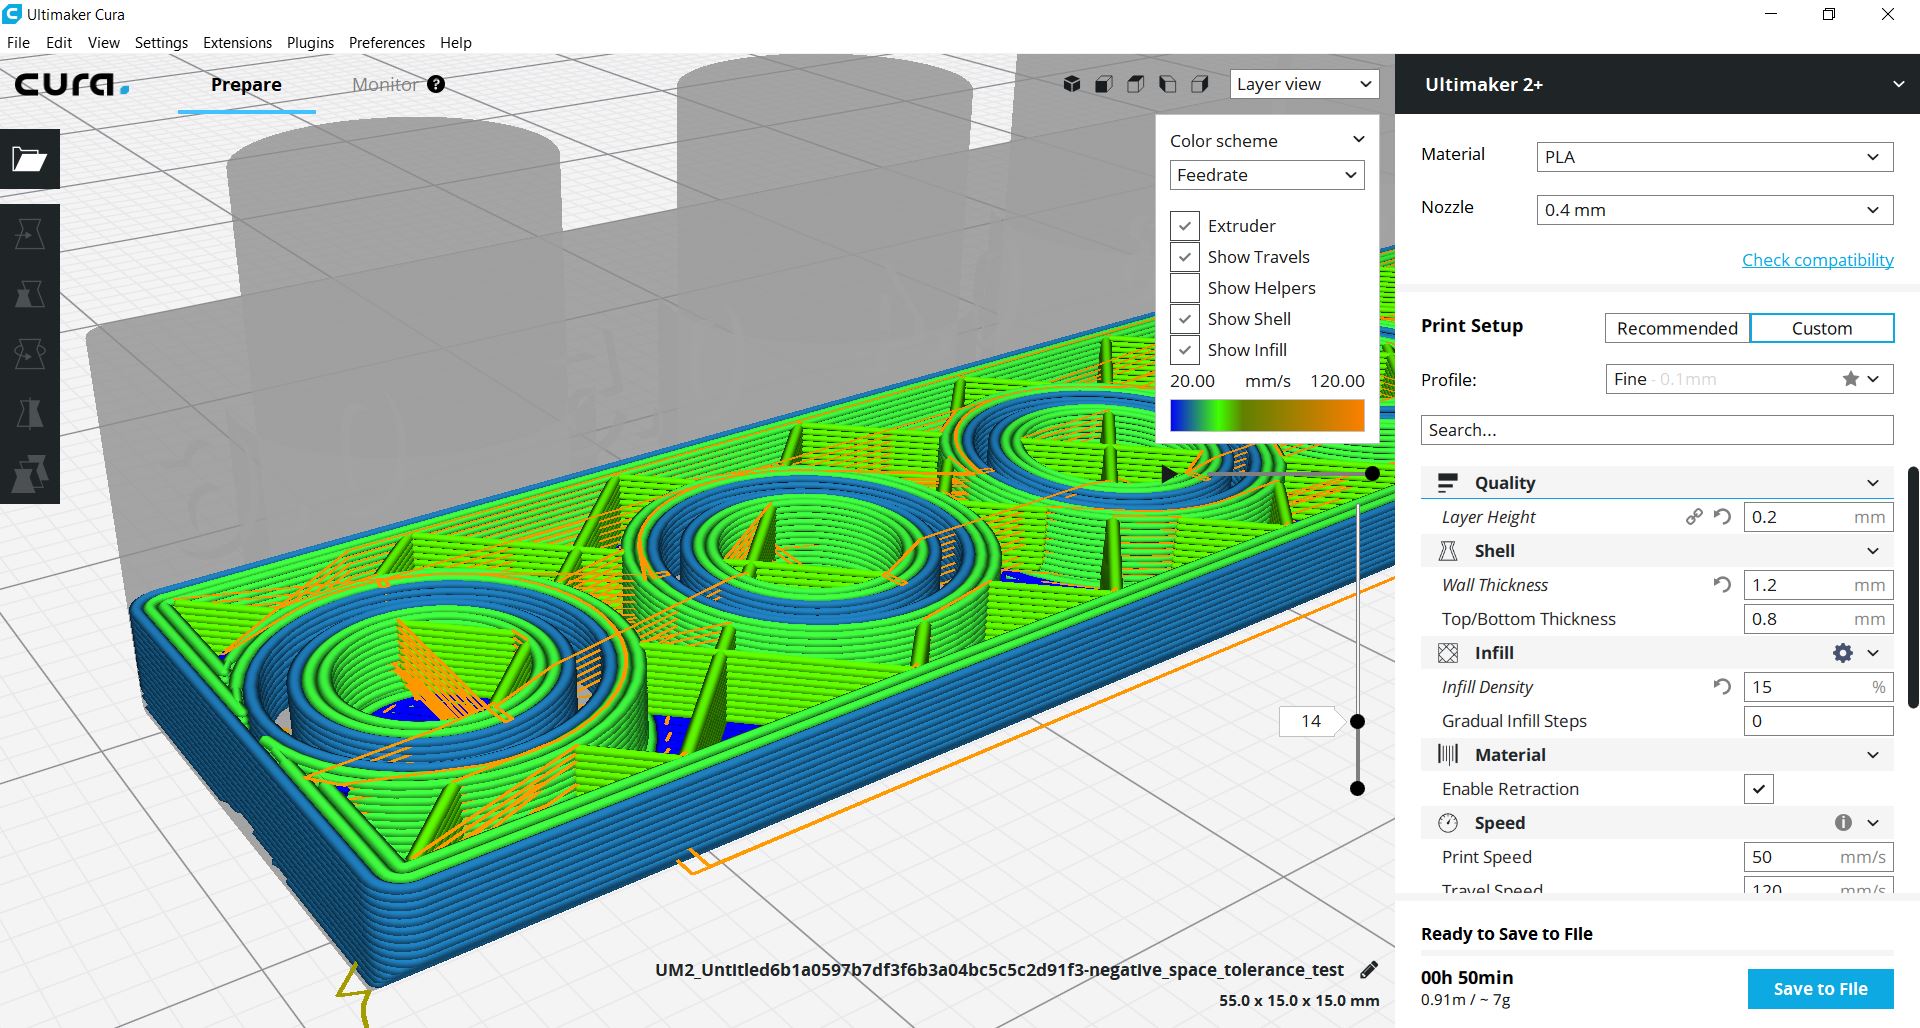
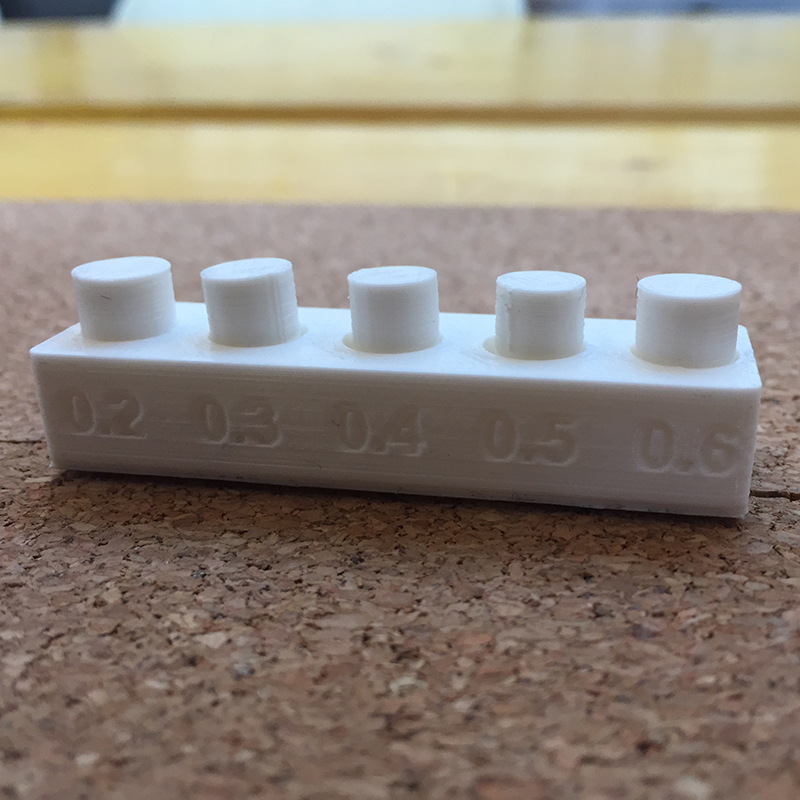
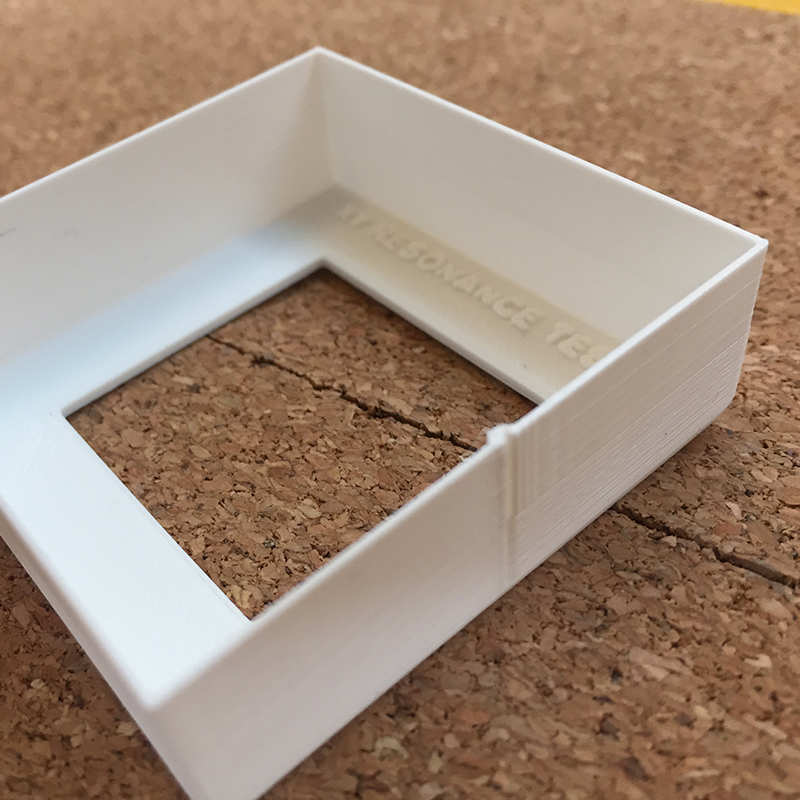
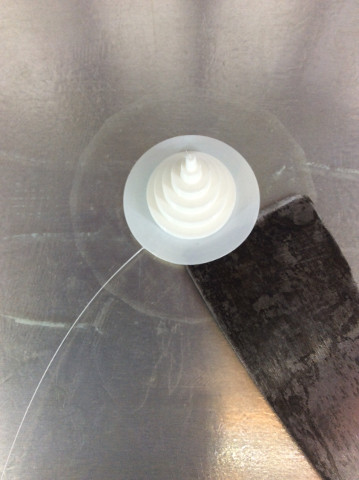
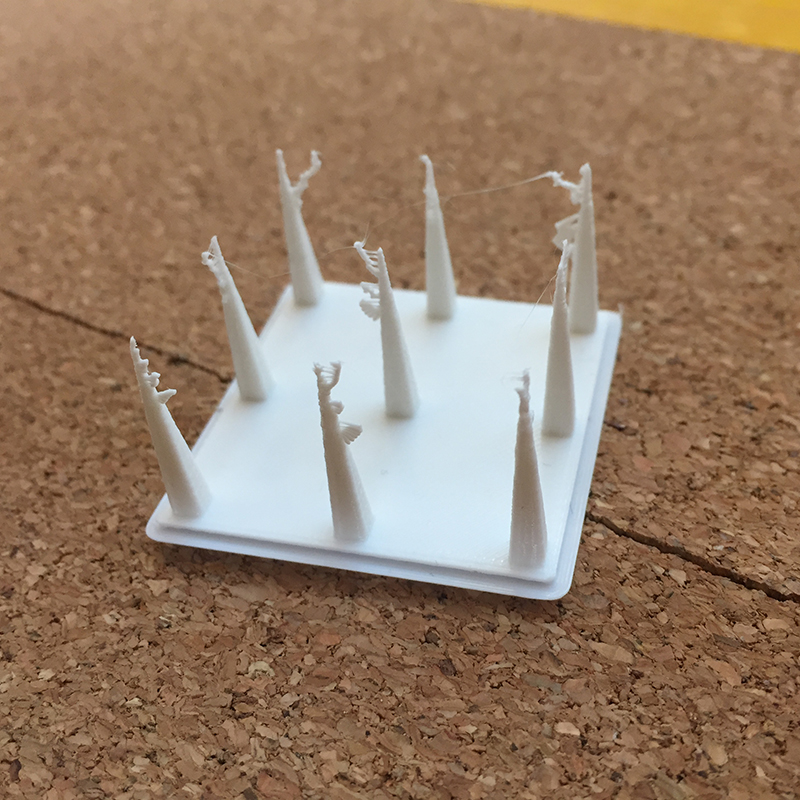
This block which is used to quantify the interference between two printed pieces. The piece with 0.2 mm offset was melted to the base. So with this test the limit for offset beetween 2 pieces is 0.3 mm, ore more!
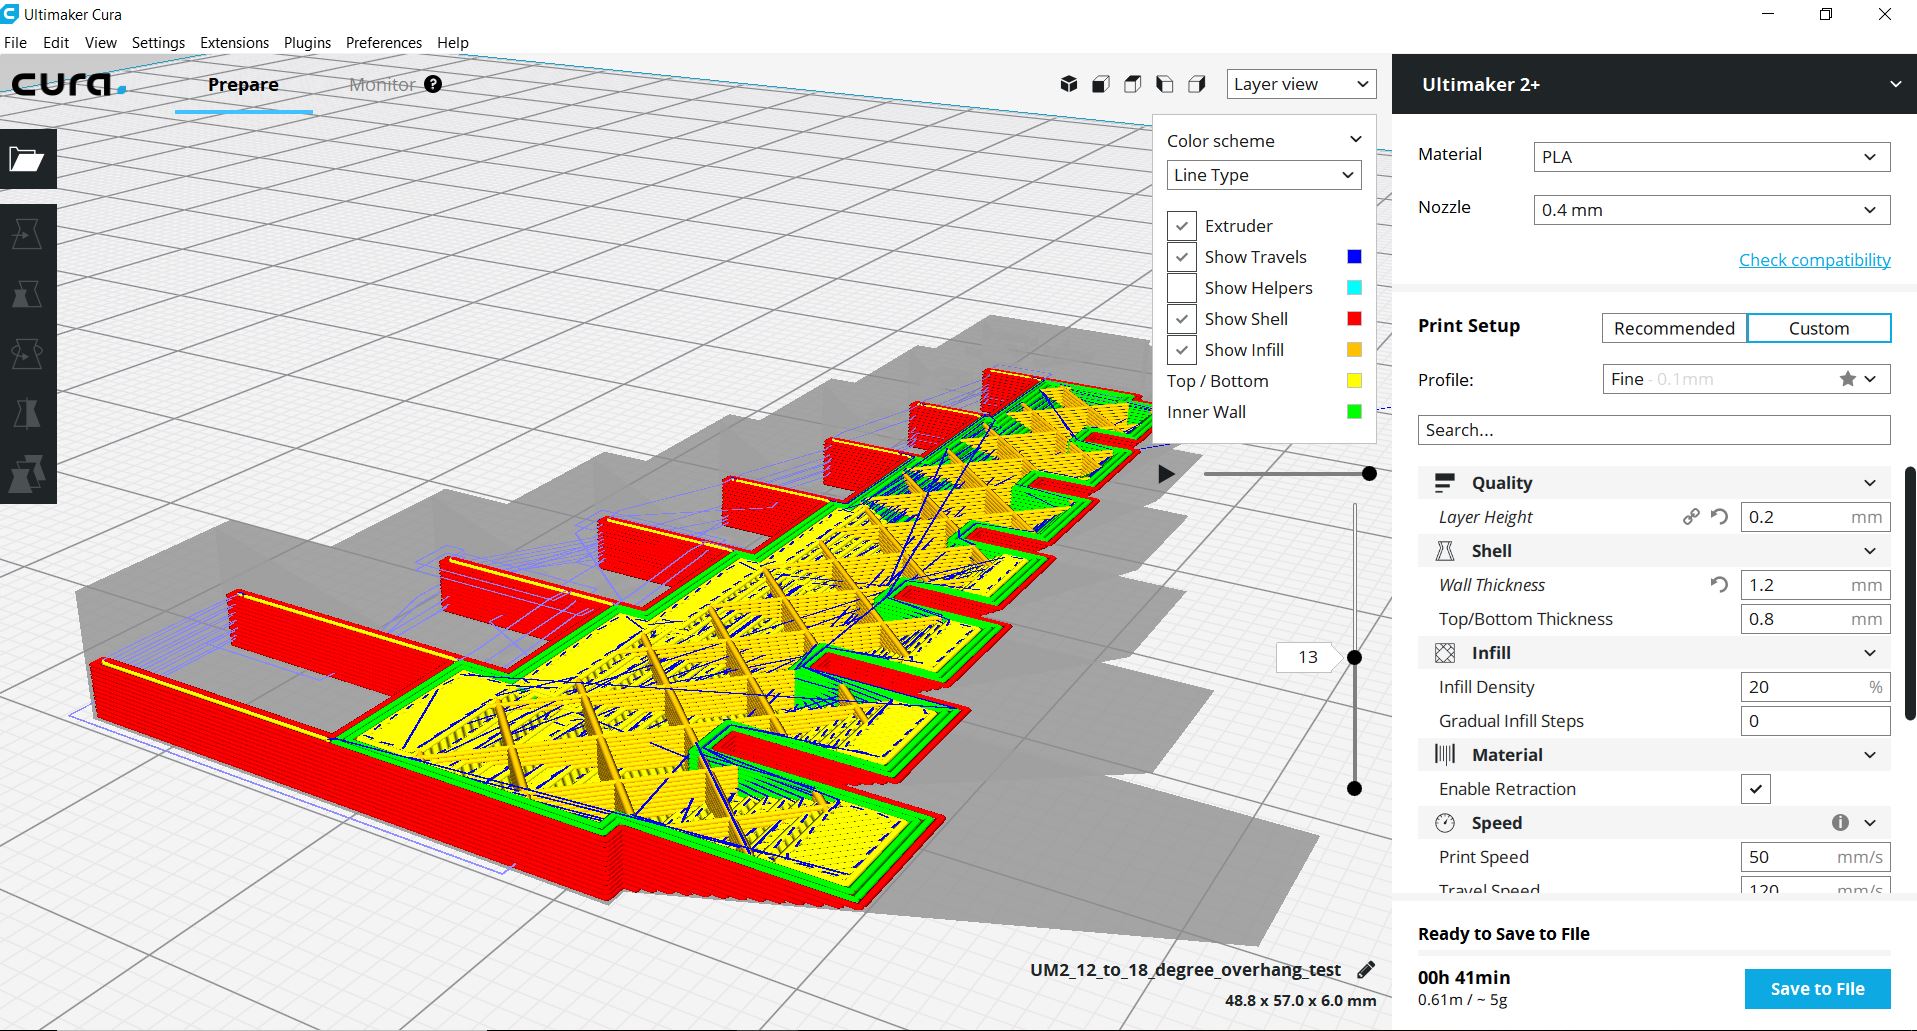
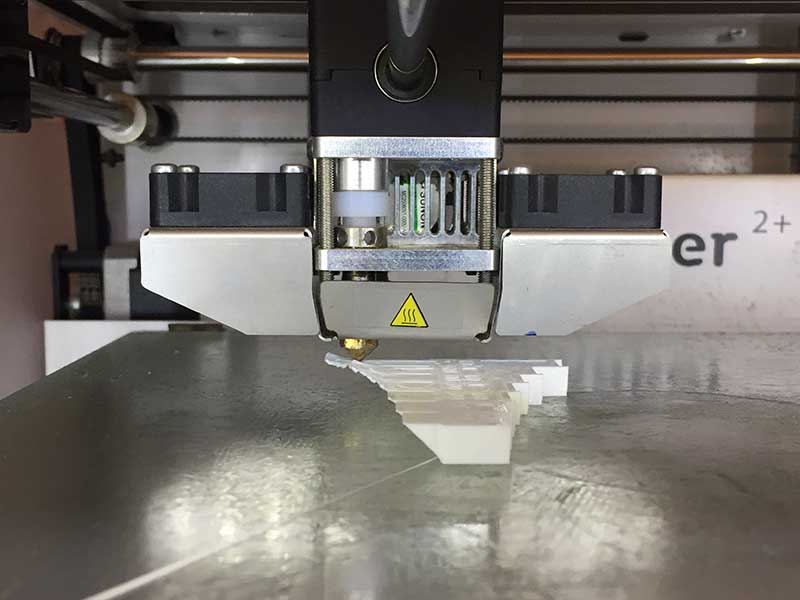
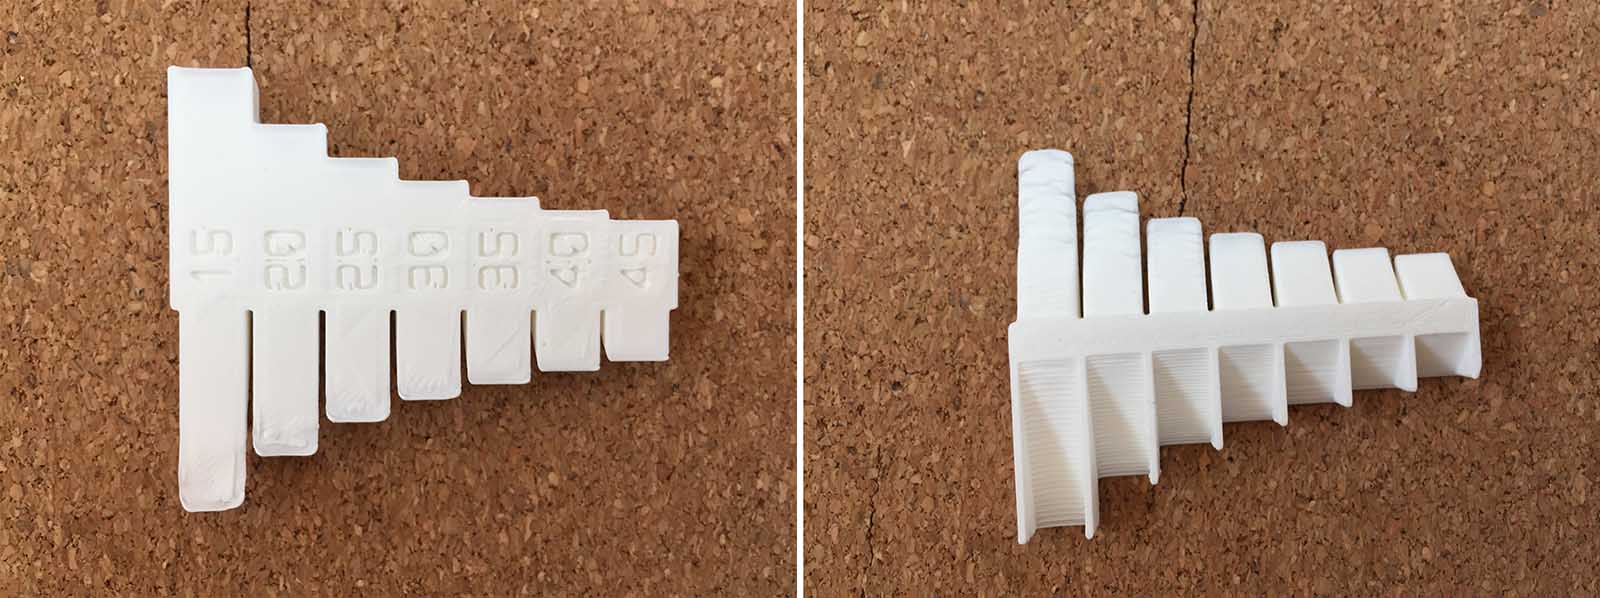
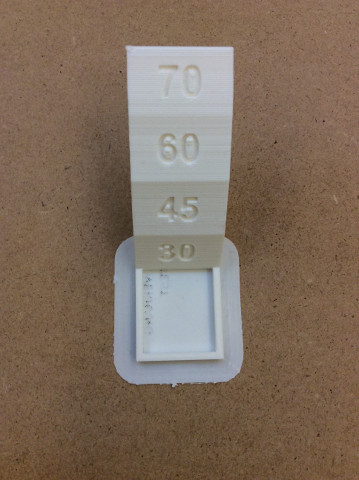
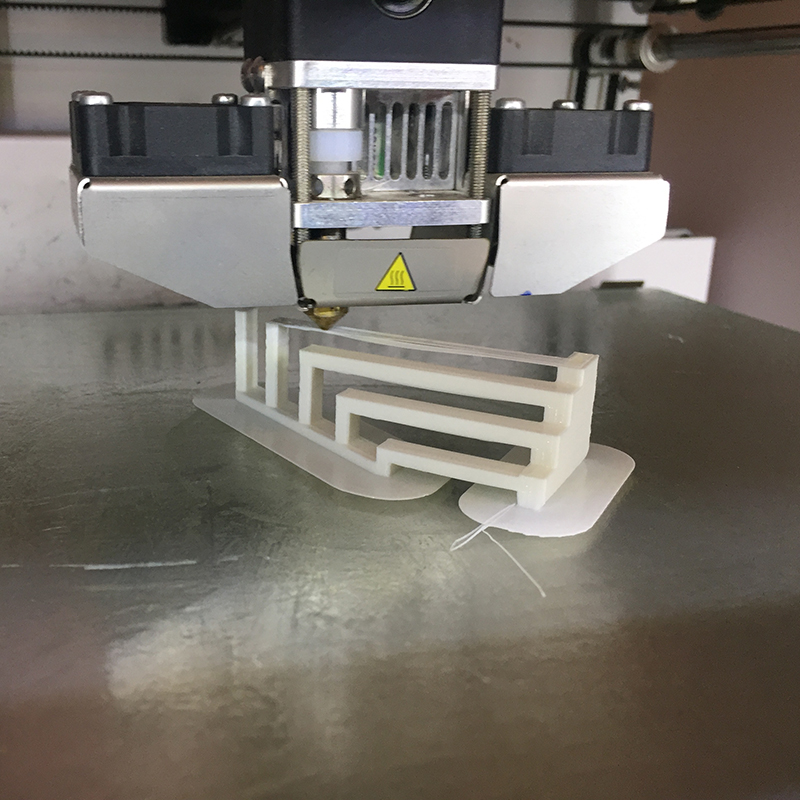
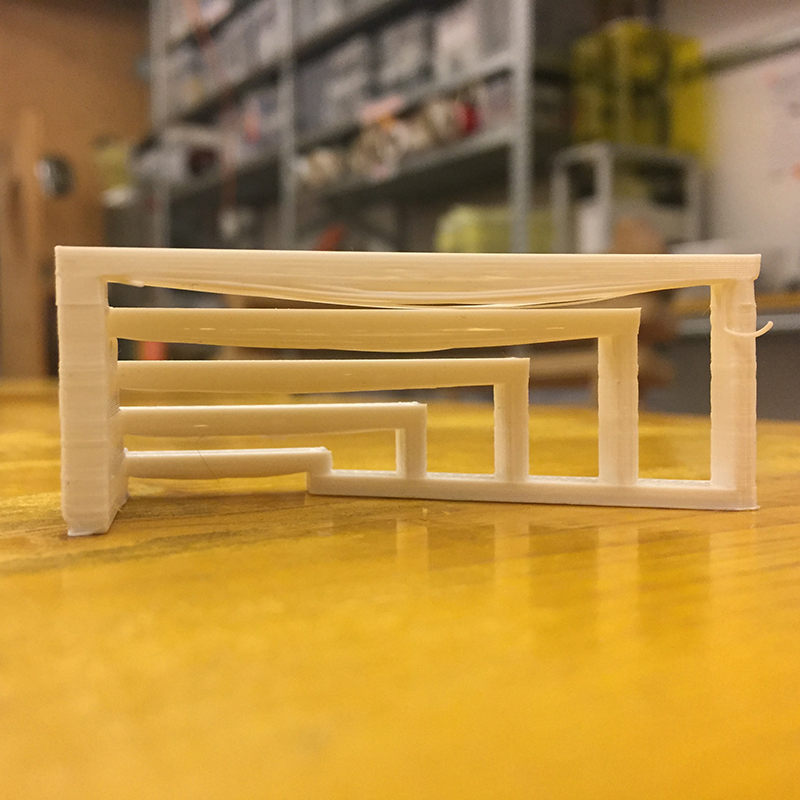
The second piece we printed was used instead to understand the limit of the undercuts that the printer could make. The cantilever part worked well up to 30 degrees, then started to warp. In this case I think that the dimensions of the piece influence a lot. On the side where there are bridges it worked well up to 15 degrees!!
We notice that the printing of the 30° angle is perfect; over 30°, the back is getting worse and worse.
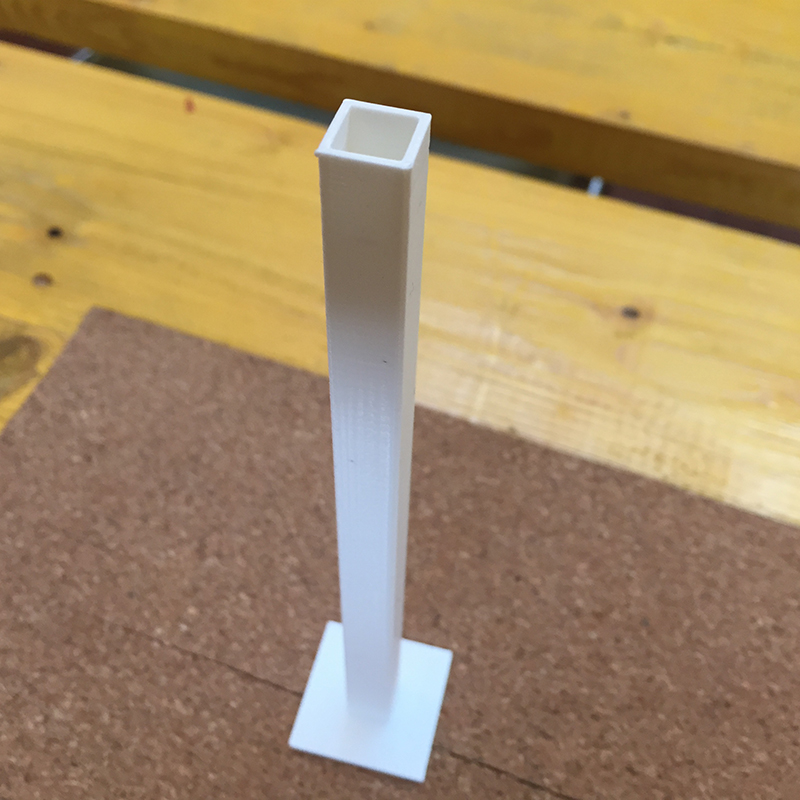
The first for test the dimensions of the printed object are the same that I've setted in the 3d model, the second is for test the resonance of machine when prints corners. The results looked really amazing. The dimensions were perfectly equal to the 3D model's and the resonance are almost imperceptible, just a minimum wobble that you can just see a little bit, but you can't feel under your fingers.
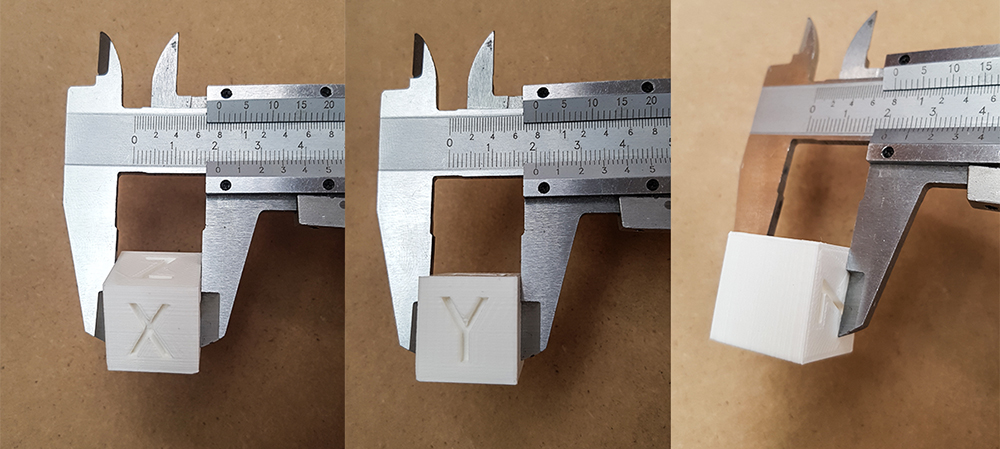
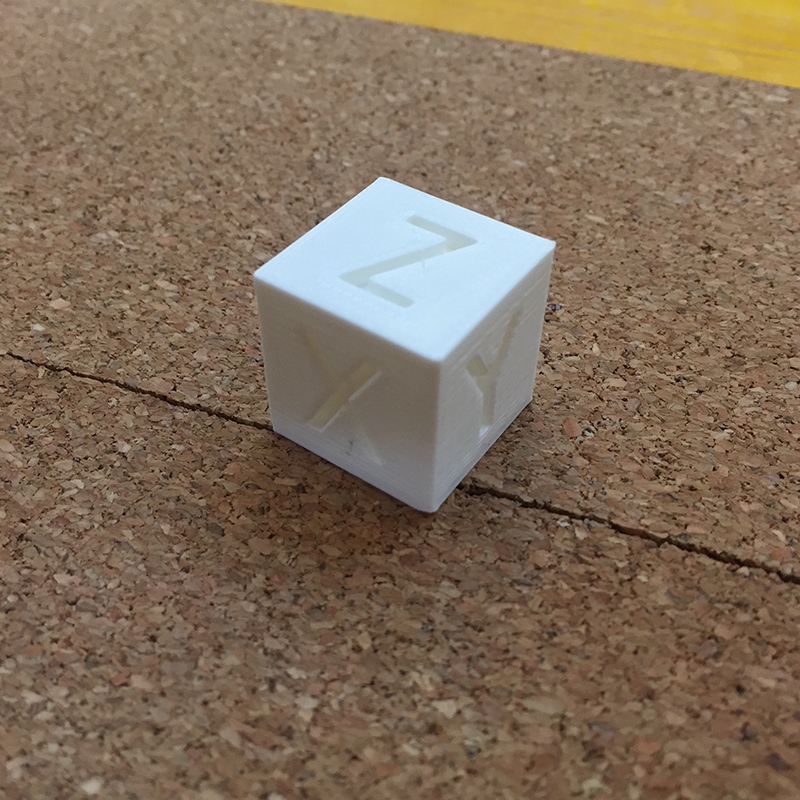
We didn't notice any significant differences in accuracy.
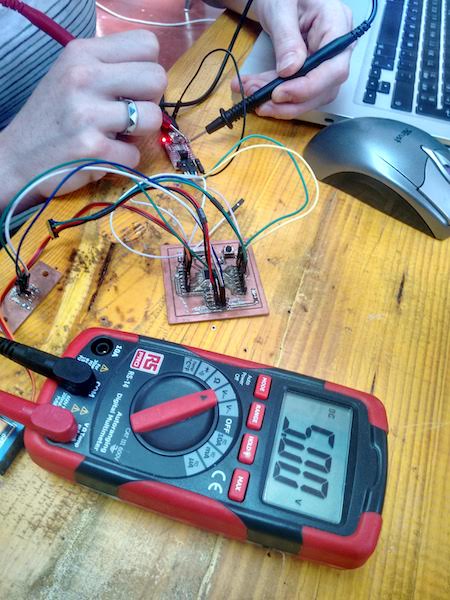
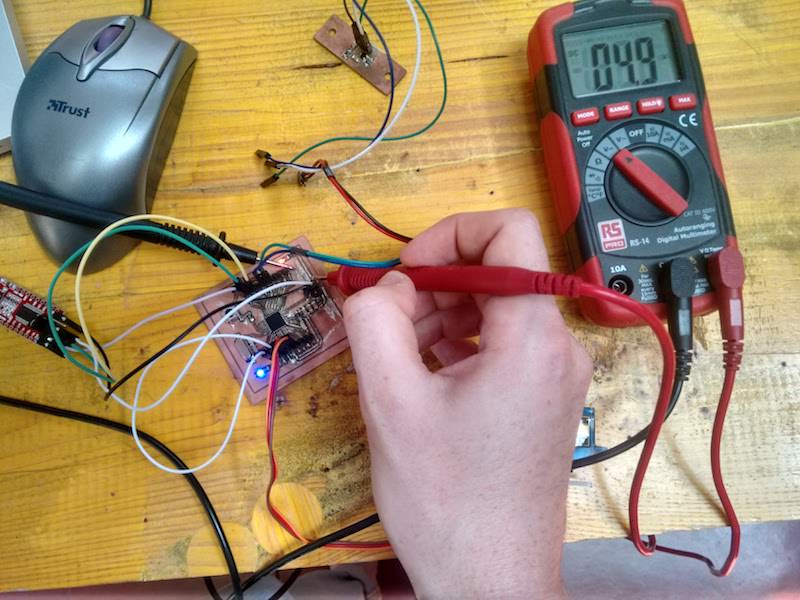
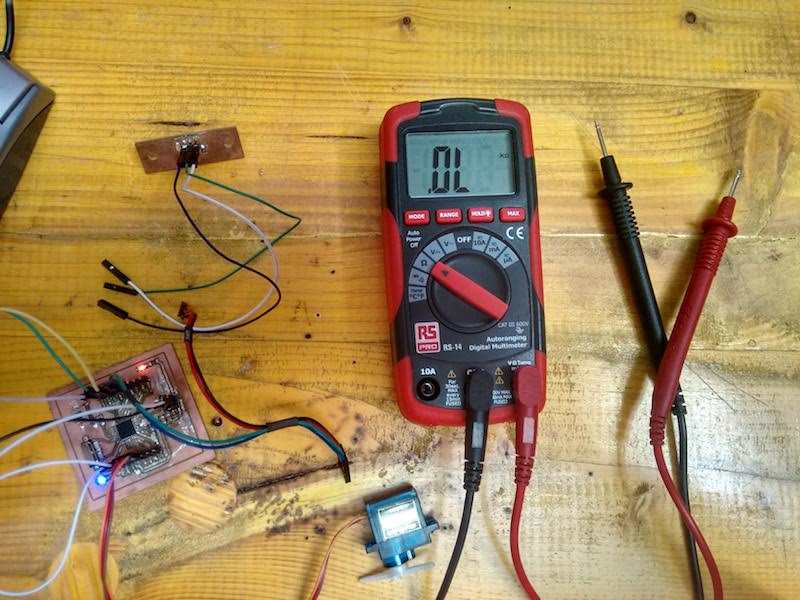
We’d to use tools from the laboratory to measure the operation of a micro controller board. We started with a Digital Multimeter, which is a tool used to measure voltage, current and resistance.
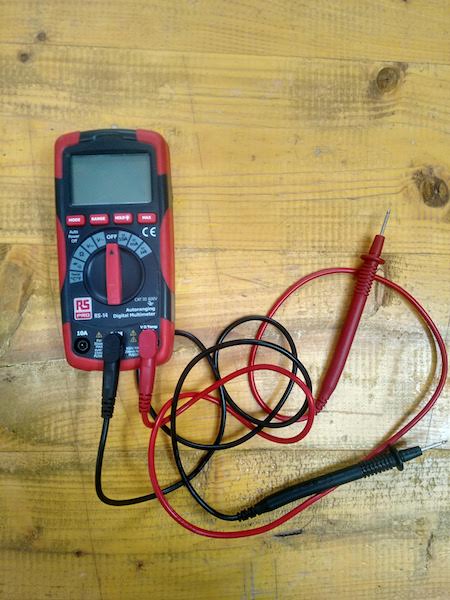
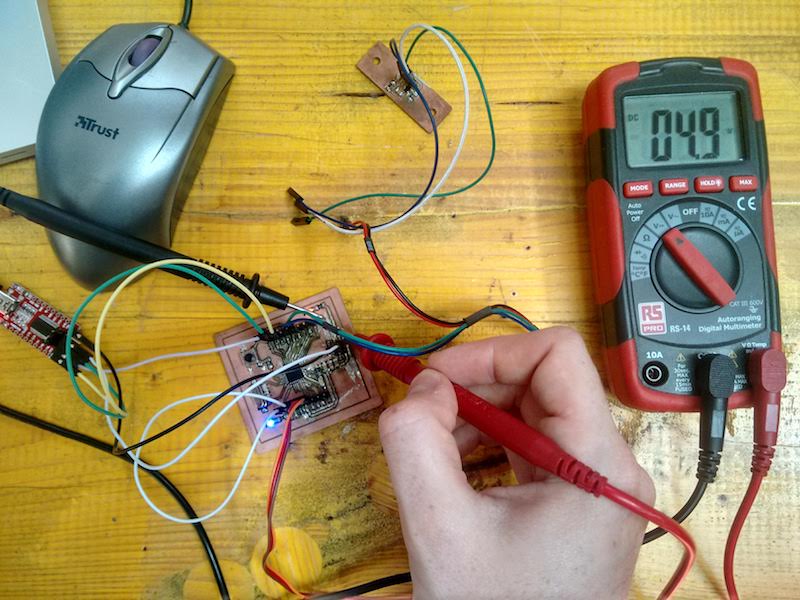
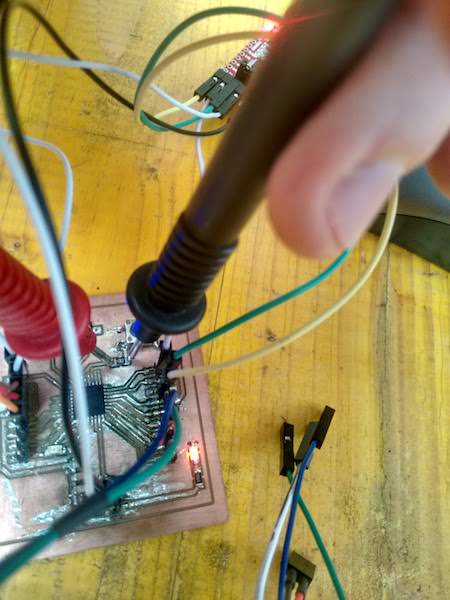
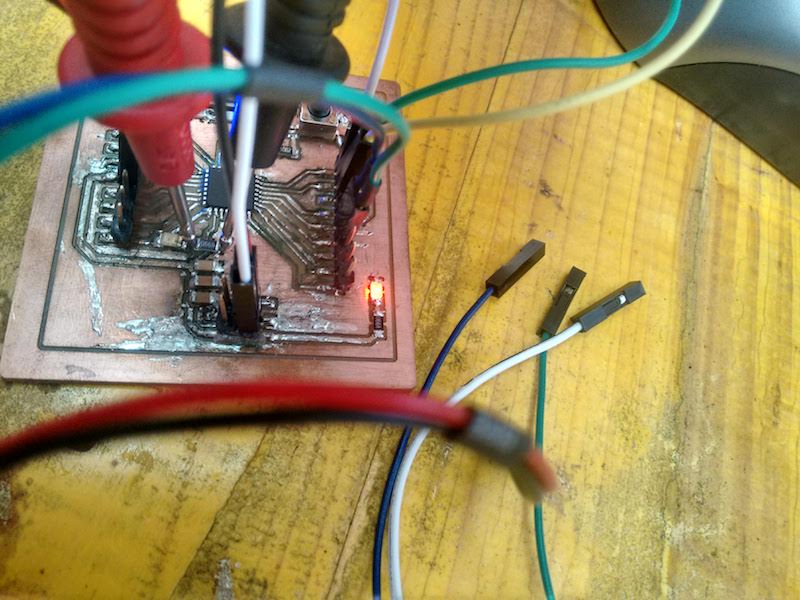
It’s a really useful tool whenever we need to know if our circuits are working or not, and to make some other diagnosis.The first measurement we’ve done is the VOLTAGE: you have to set the knob under the symbol of the DC Volt (because Direct Current is easier to measure and less "dangerous" than Alternate Current, AC). Then we've taken the black probe and put it on the left of a capacitor on the programming board. The red probe goes on the other side: the result is that 5V are active on this component. We've repeated this operation on the handmade board made by Laura Cipriani and Francesco Pasino: we started by measuring the voltage on the board, to verify if everything was working correctly. So we put the black probe on the GND of the board, and the red one on the VCC tracks.
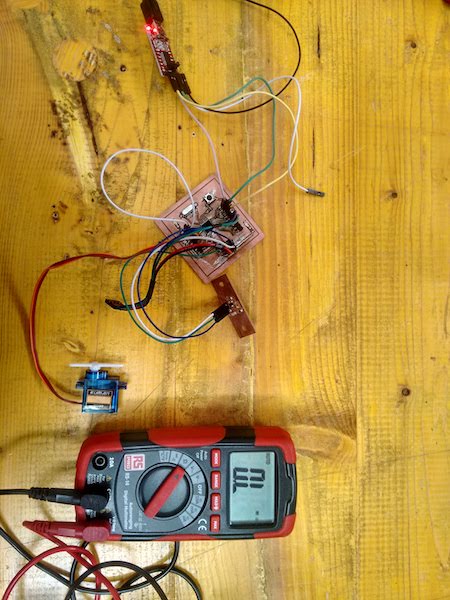
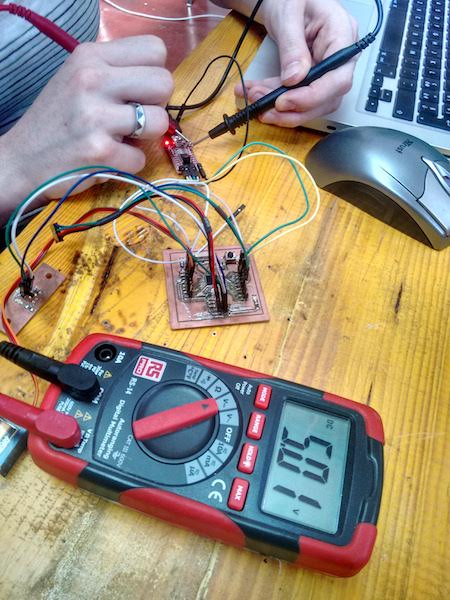
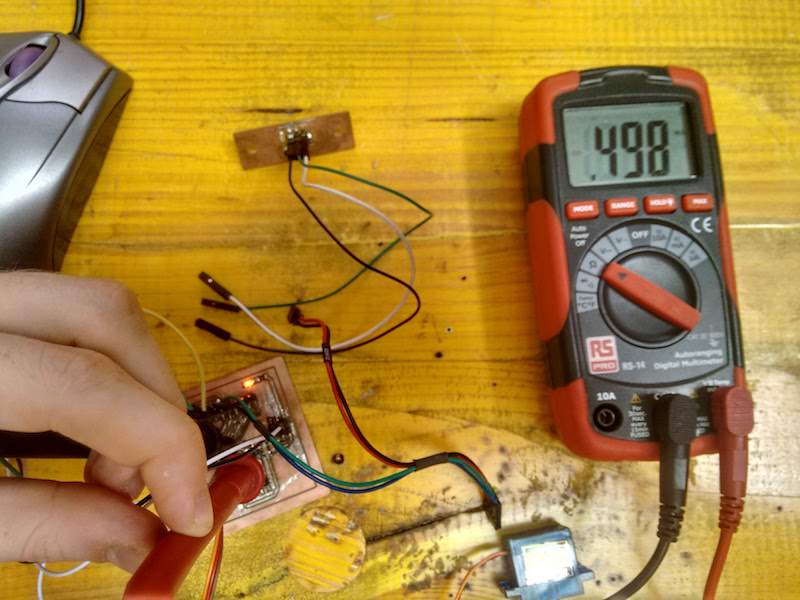
It's appeared that on the board there's a medium voltage of 4.9V, maybe due to solderings. Then we've decided to measure the RESISTANCE, so we put the knob under the symbol of Ohm, and set the range. When you use the Digital Multimeter it's important to define the range of the measurement, because if the multimeter doesnìt recognize the value, it returns a "null". By pressing the "range" button, you should decide how large is the range: we started to measure a 1kΩ resistance, so we set the range at 000. Then we put the black probe on the GND track, and the red one on the VCC.
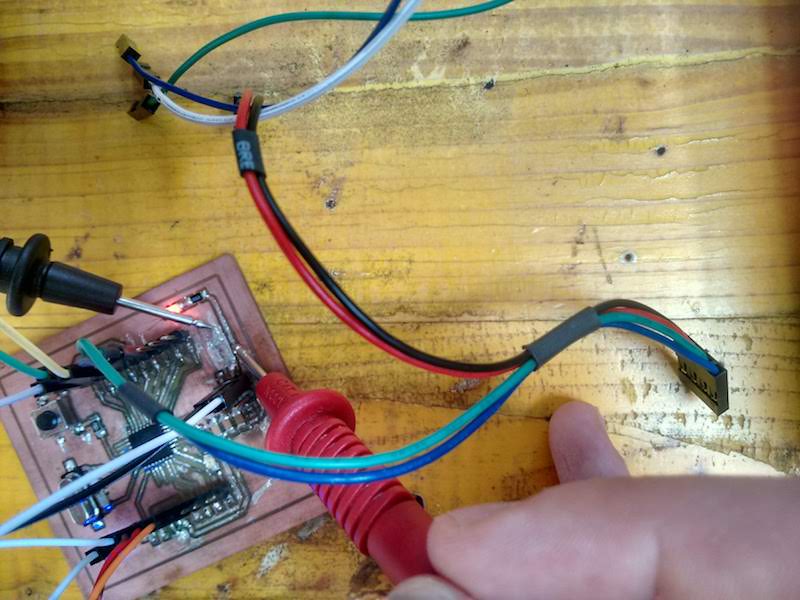
On the screen appeared the value 10, which corresponds to 1k according to the range we set. We decided to measure other two resistances of 499Ω. We did the same process as for the 1k resistance.
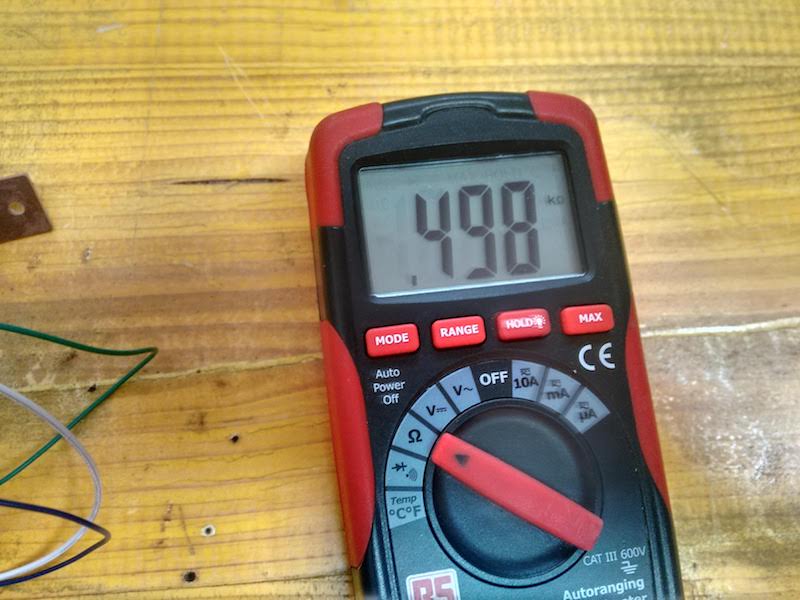
But in this case we've discovered that one of these two resistences wasn't connected perfectly: the reuslt wasn't 499, but a bit less. So out idea is that the soldering is not good enoutgh to have a continuous contact with the tracks.
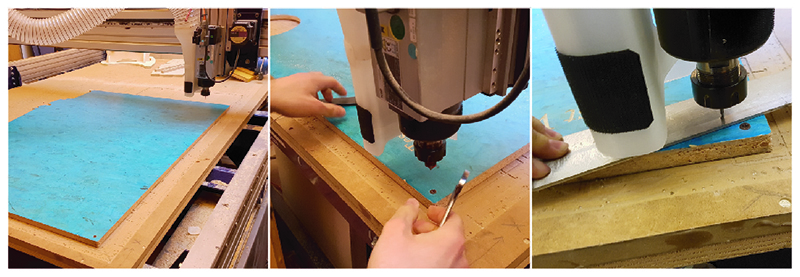
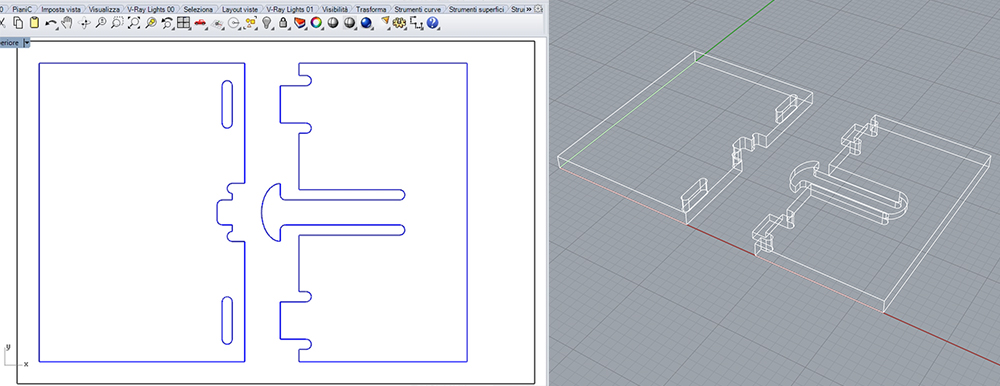
For the group assignment of this week we download a joint from Jochen Gros Library. We choose this for try the tolerances, interferences, speeds, tools etc. For this test we used used a piece of OSB wood 17mm thick, we cut the piece with Shopbot of Opendot.
Part features:
-2D and 2.5D milling fabrication,
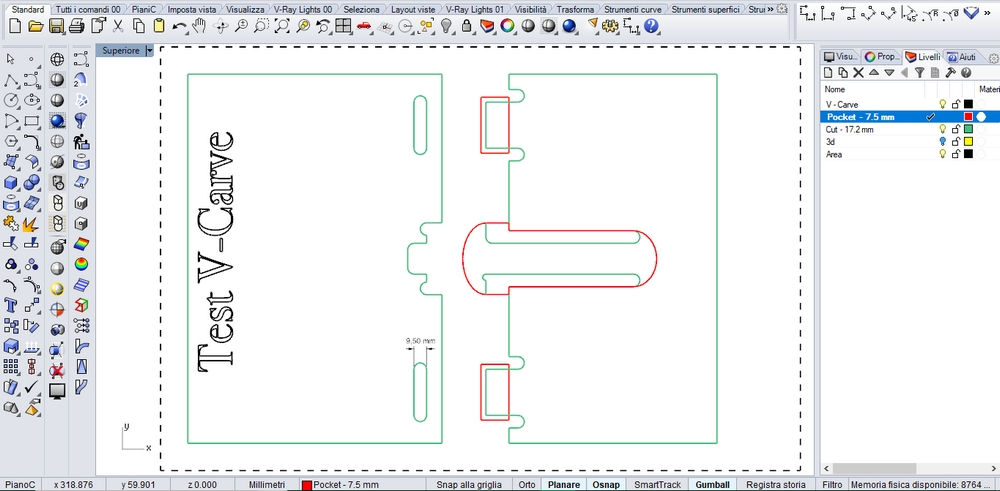
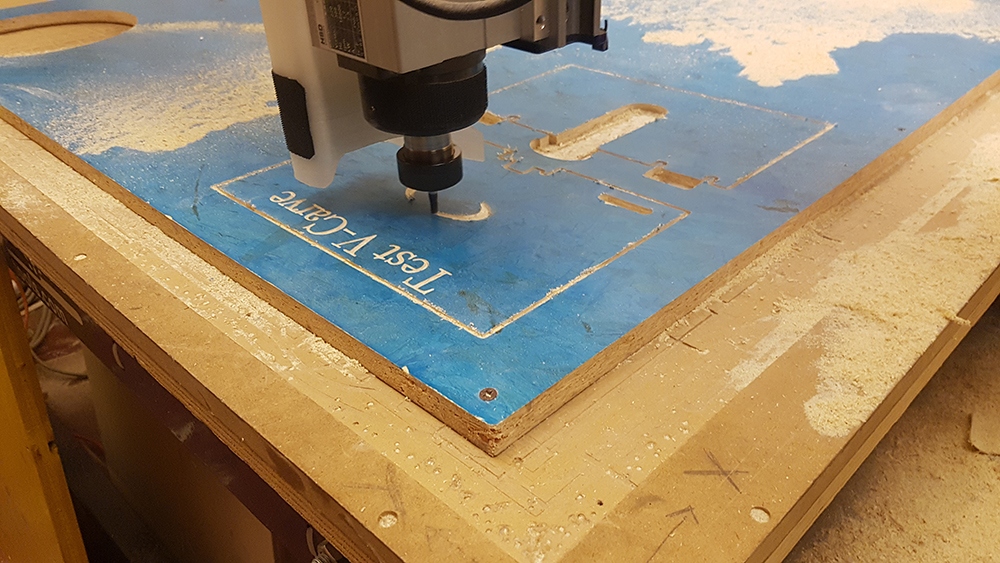
-V-Carve
-3D milling fabrication.
Layer:
>We saved the the drawings in dxf files for edit it in V-Carve, to obtained the ShopBot toolPath (.SBP files).
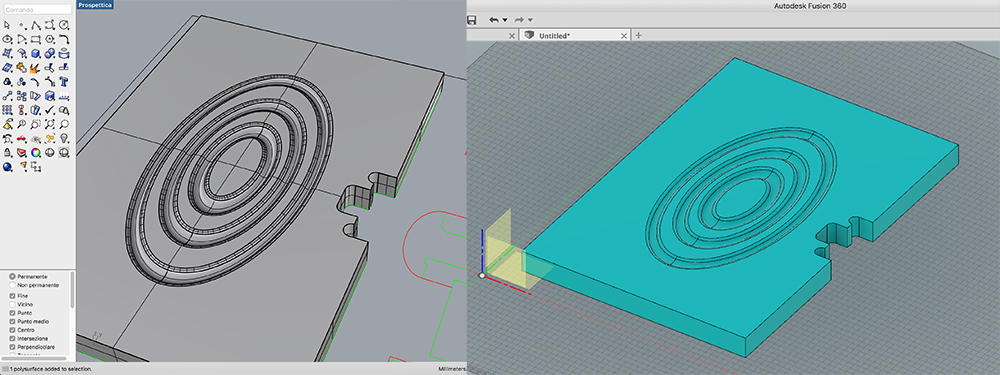
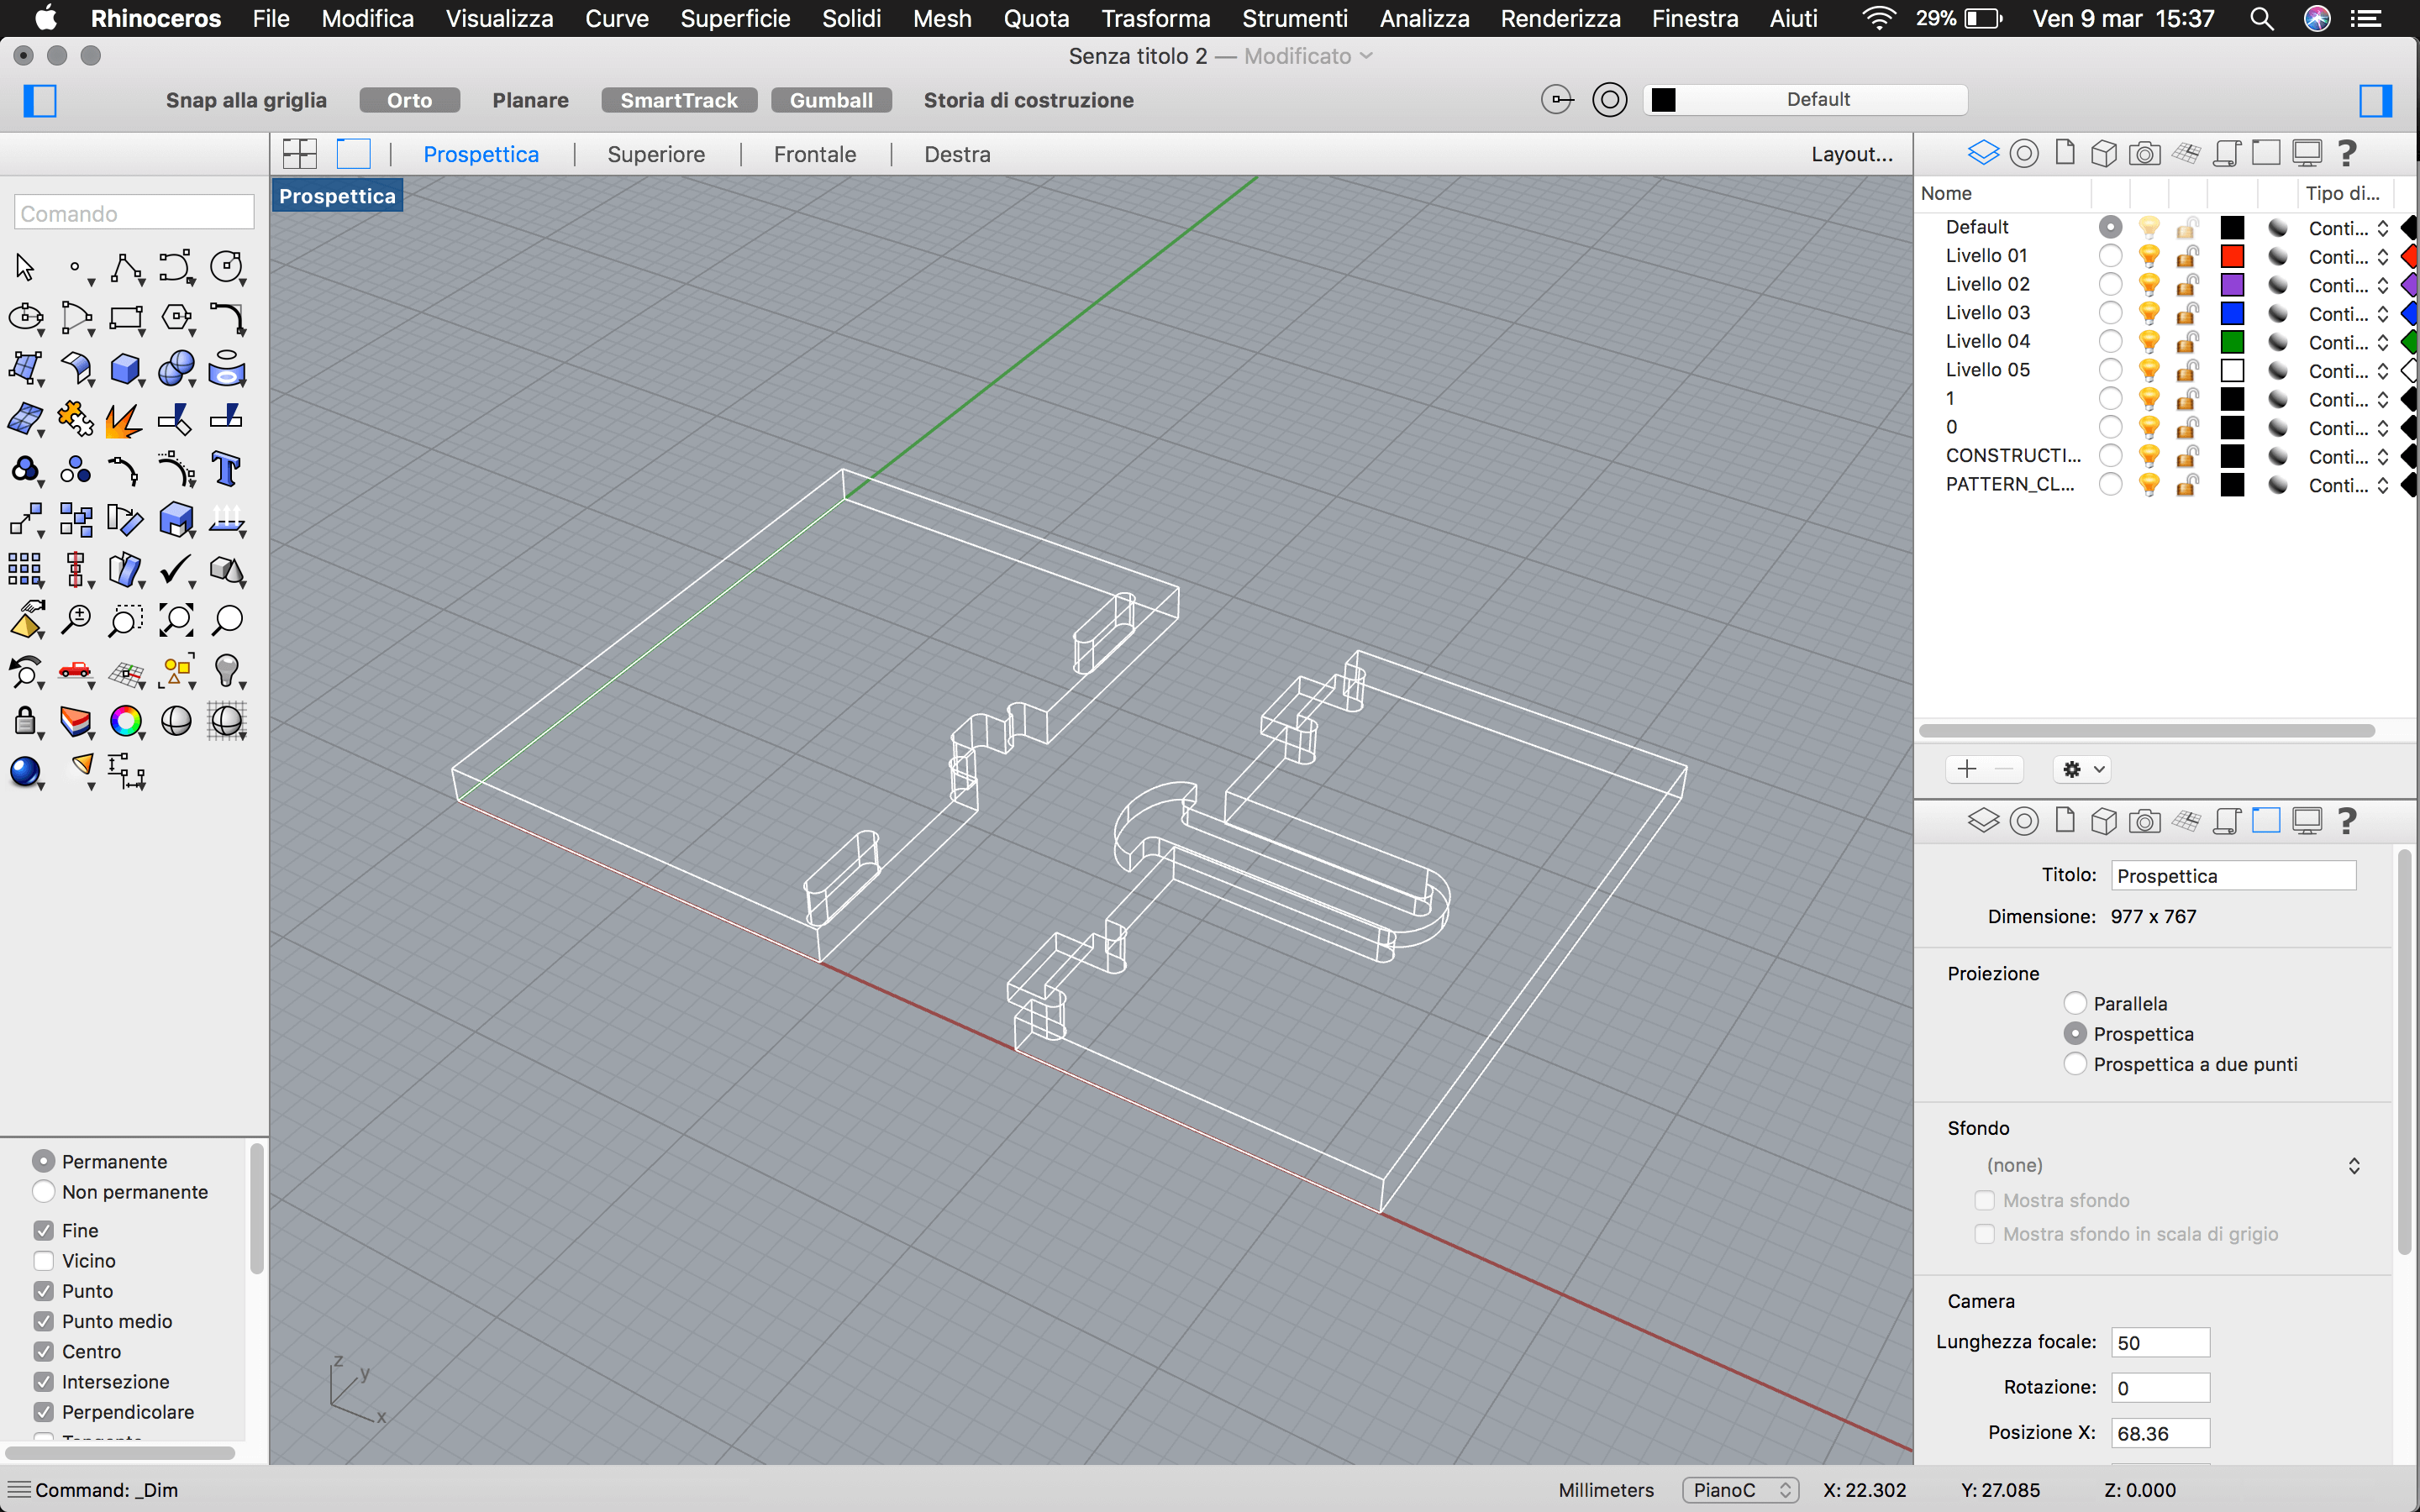
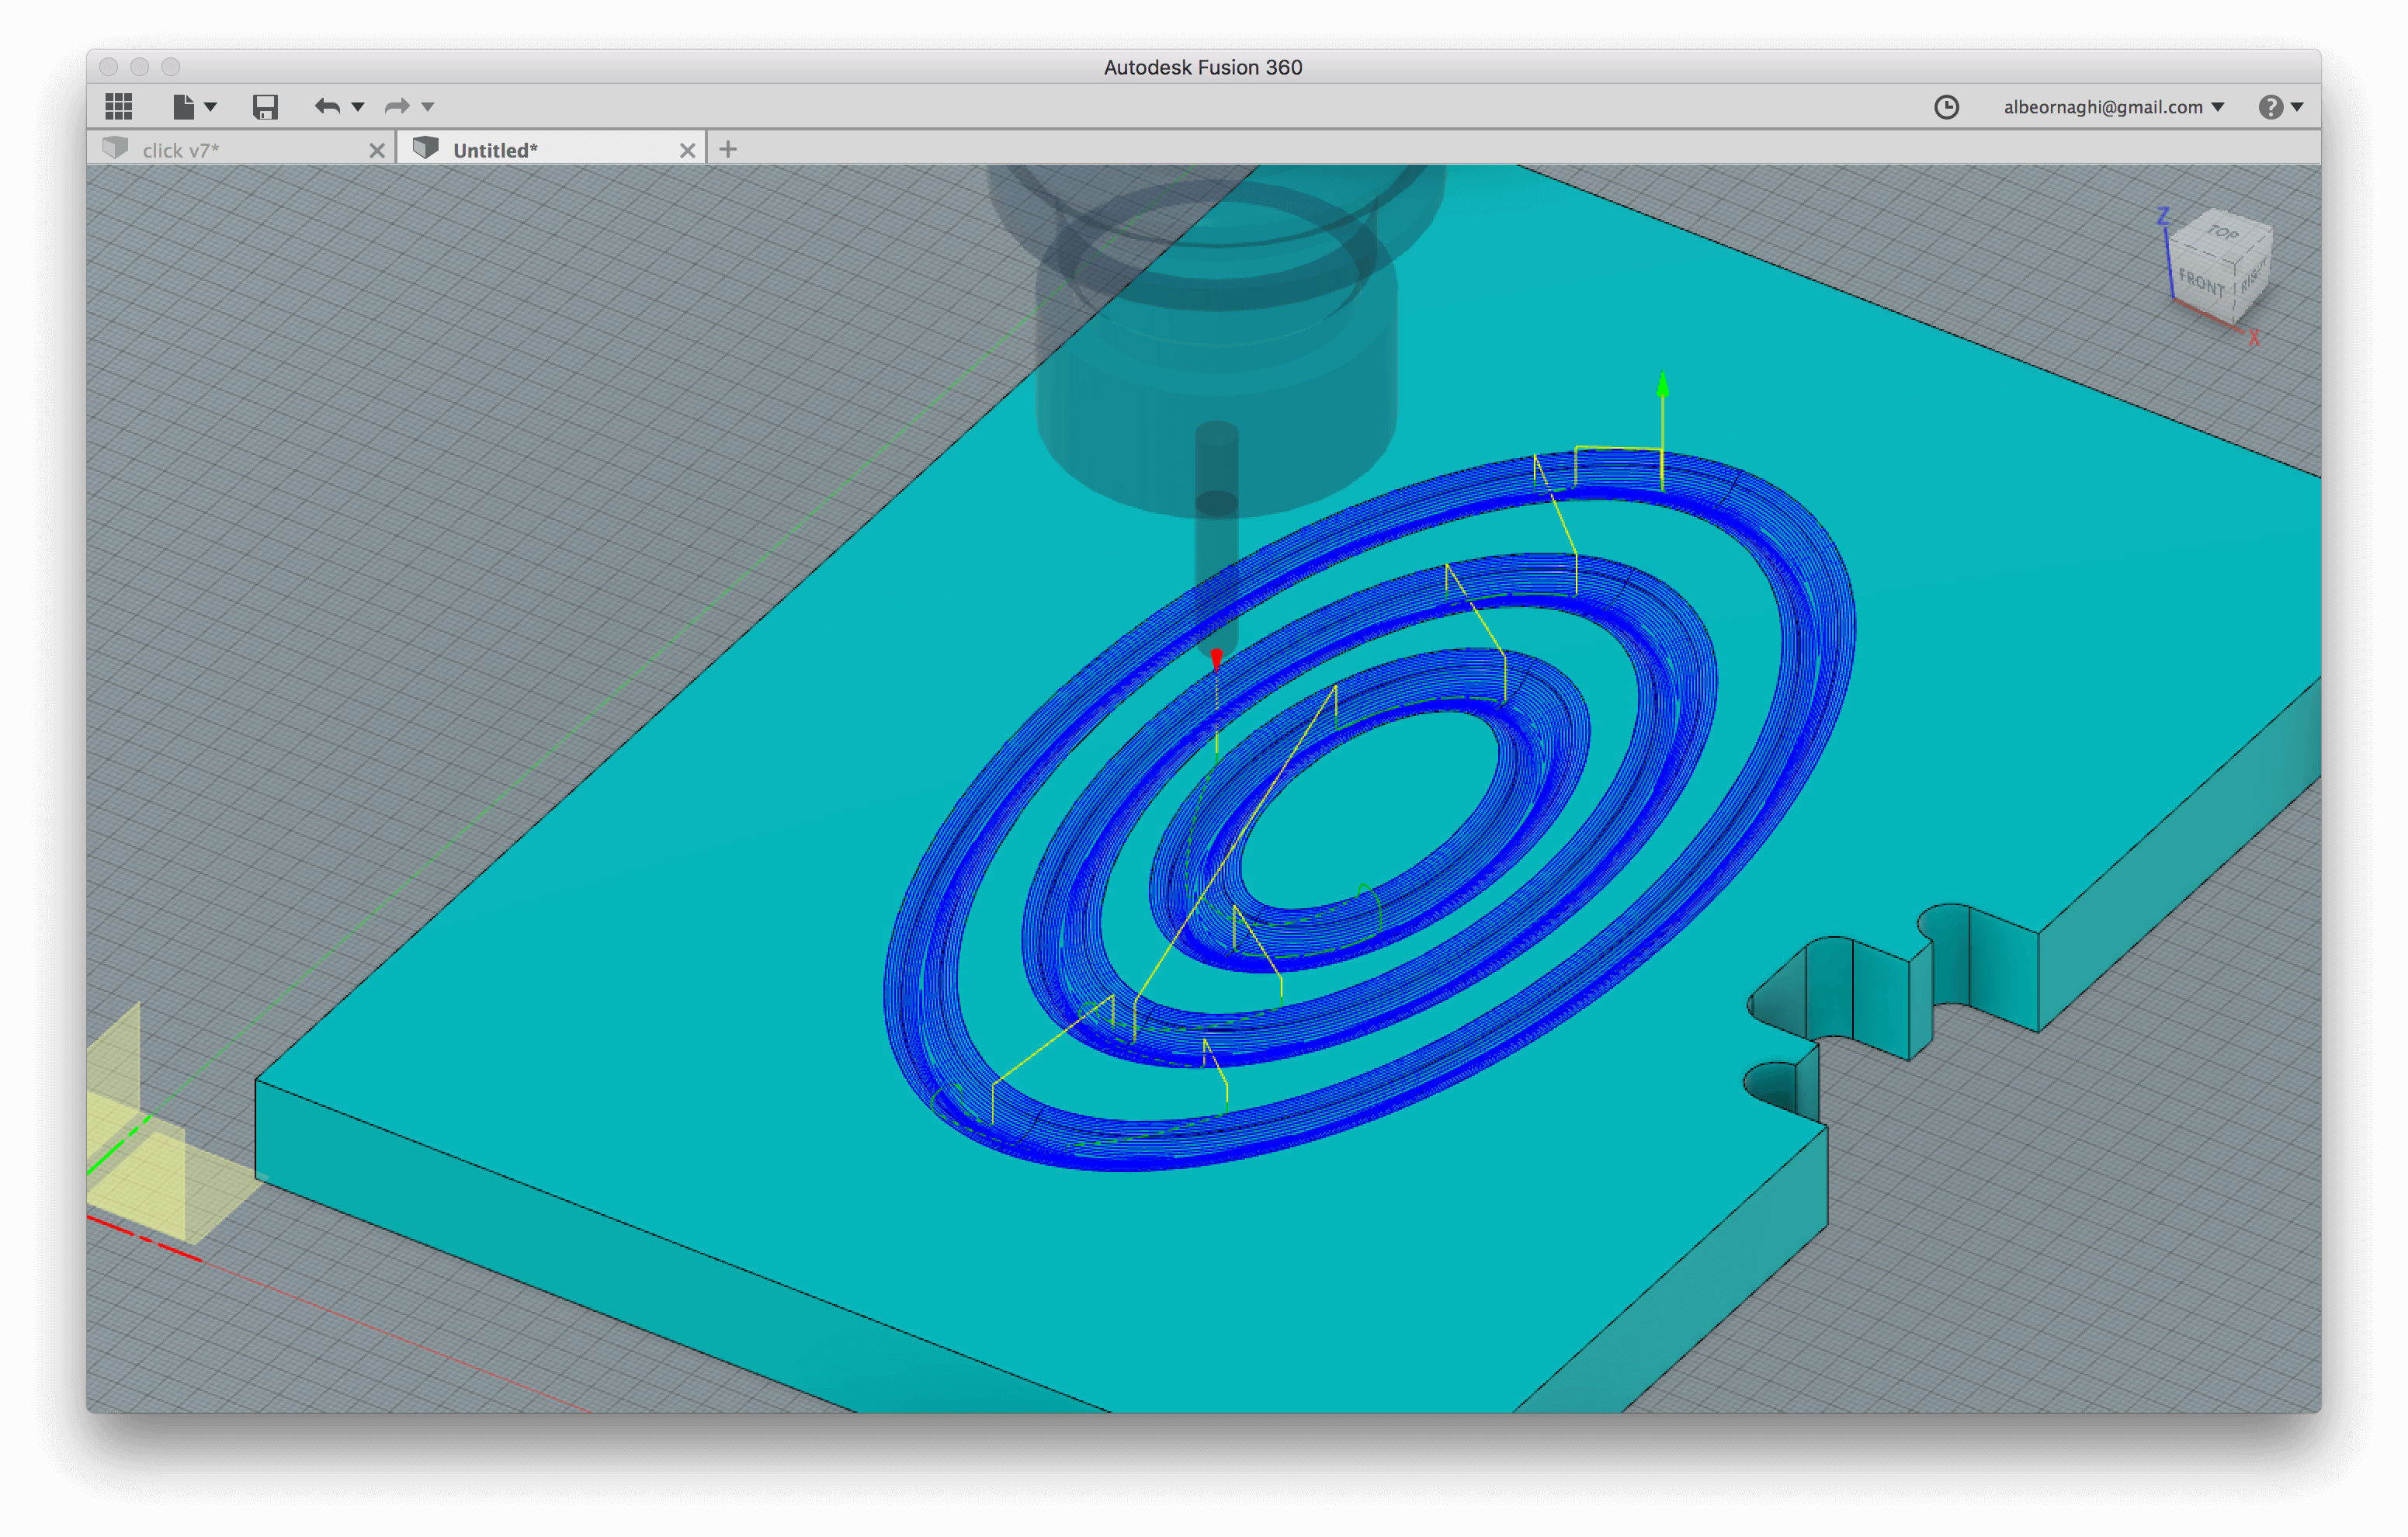
For testing the 3D milling we drawing in Rhinoceros three ellipsoidal "waves" on one of the two part of the joint. For 3D processing we imported the model in Fusion for try the CAM part of this software.
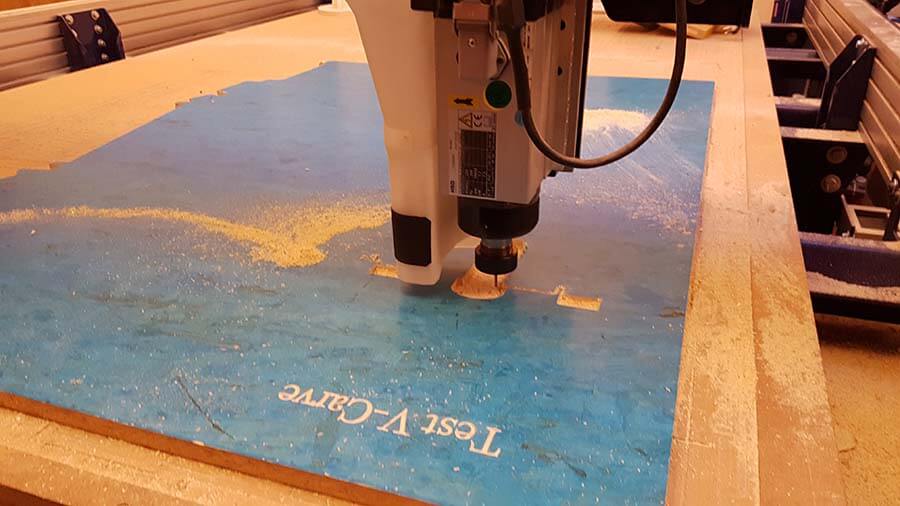
We selected a spherical tool 6mm diameter with 2 flutes, 12.000 rpm Spindle Speed, and 0,5mm Stepover.
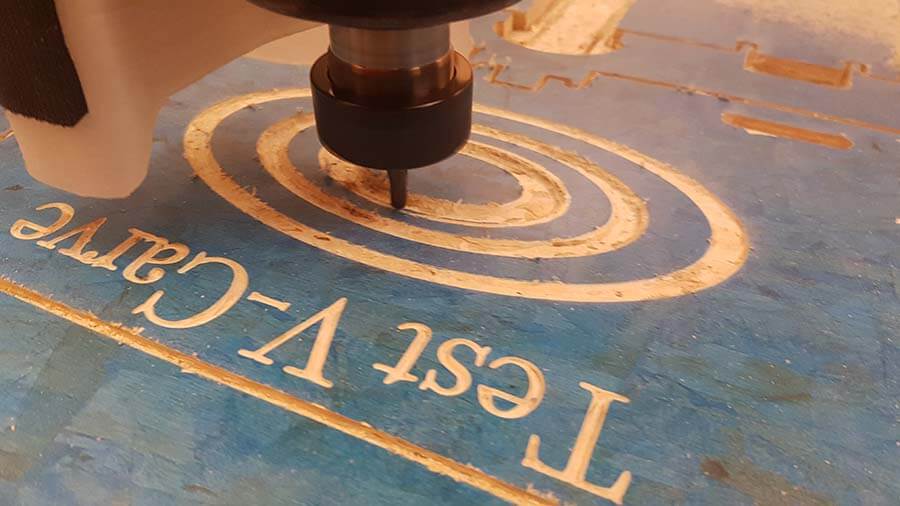
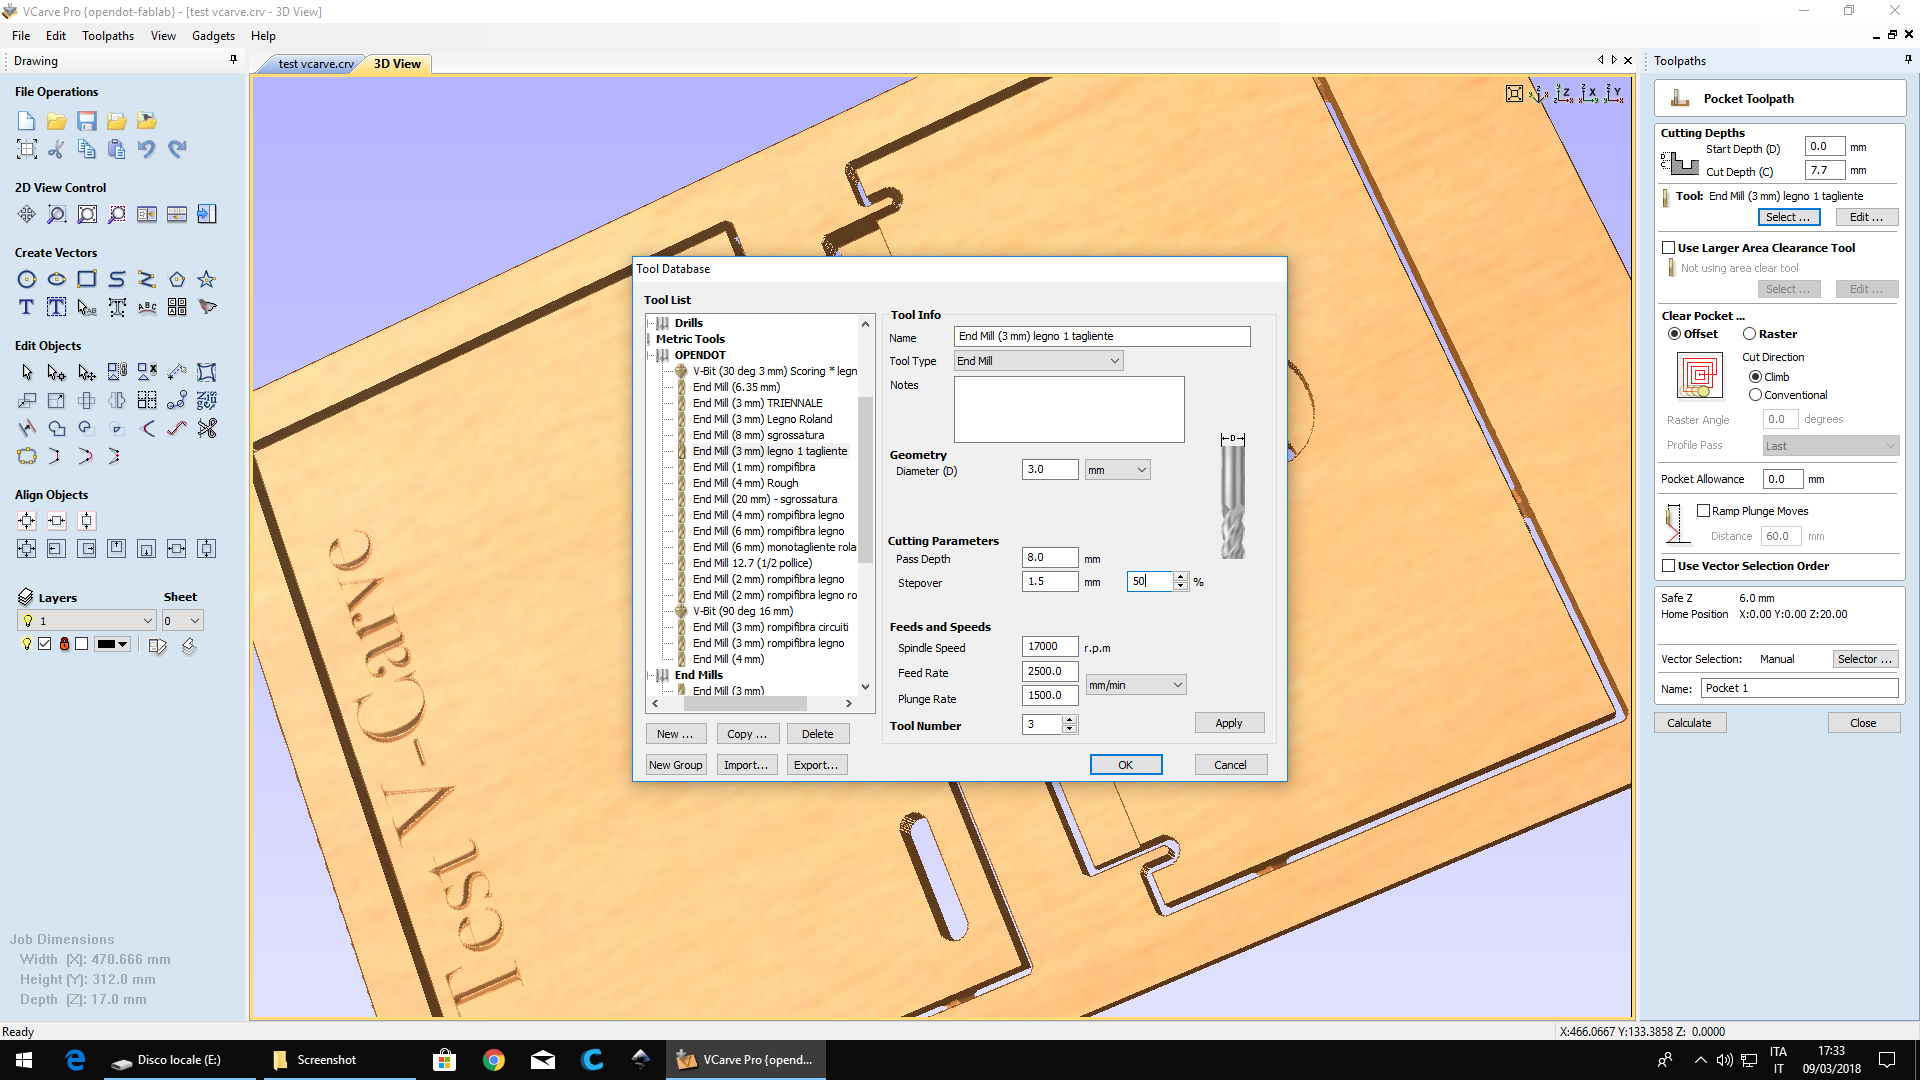
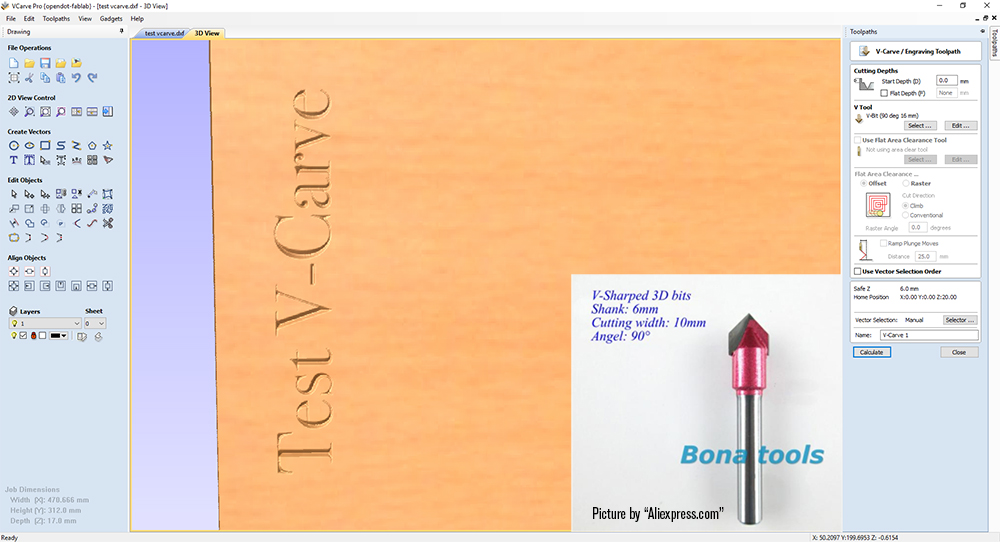
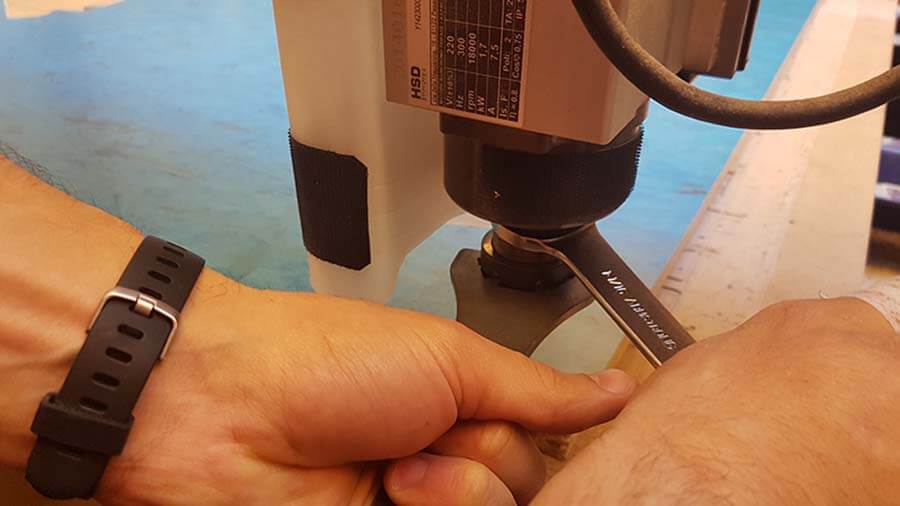
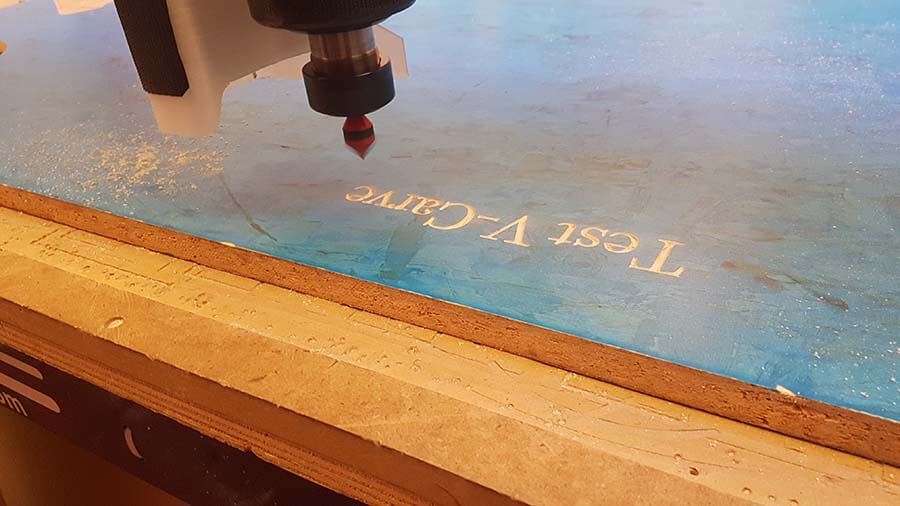
Simulation: Then we opened the dxf files on V-Carve and setting origin and the dimension and thickness of selected board of OSB wood. For v carving text, we setted a V-shaped 90° tool with 10 mm cutting width and 6 mm shank and 2 flutes.
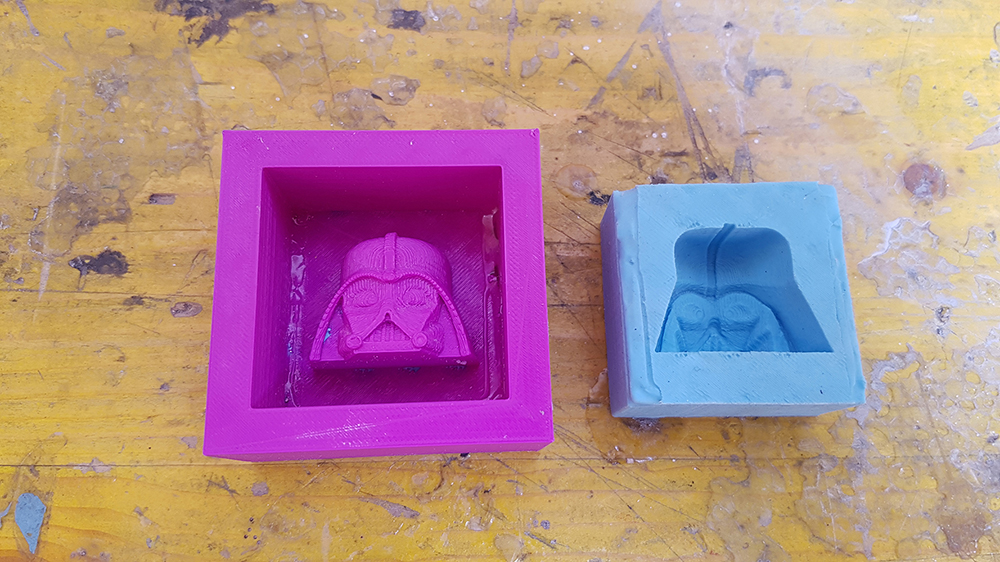
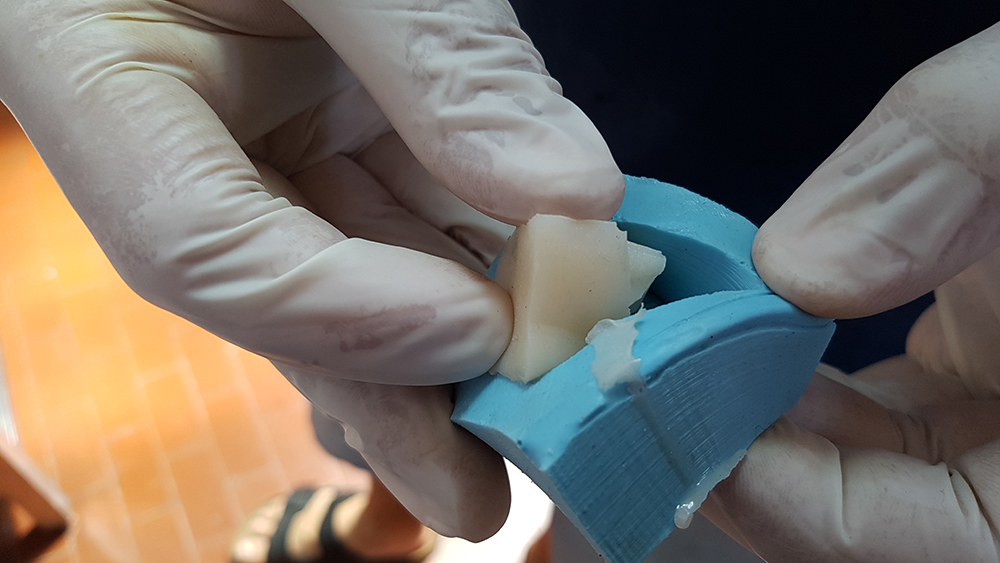
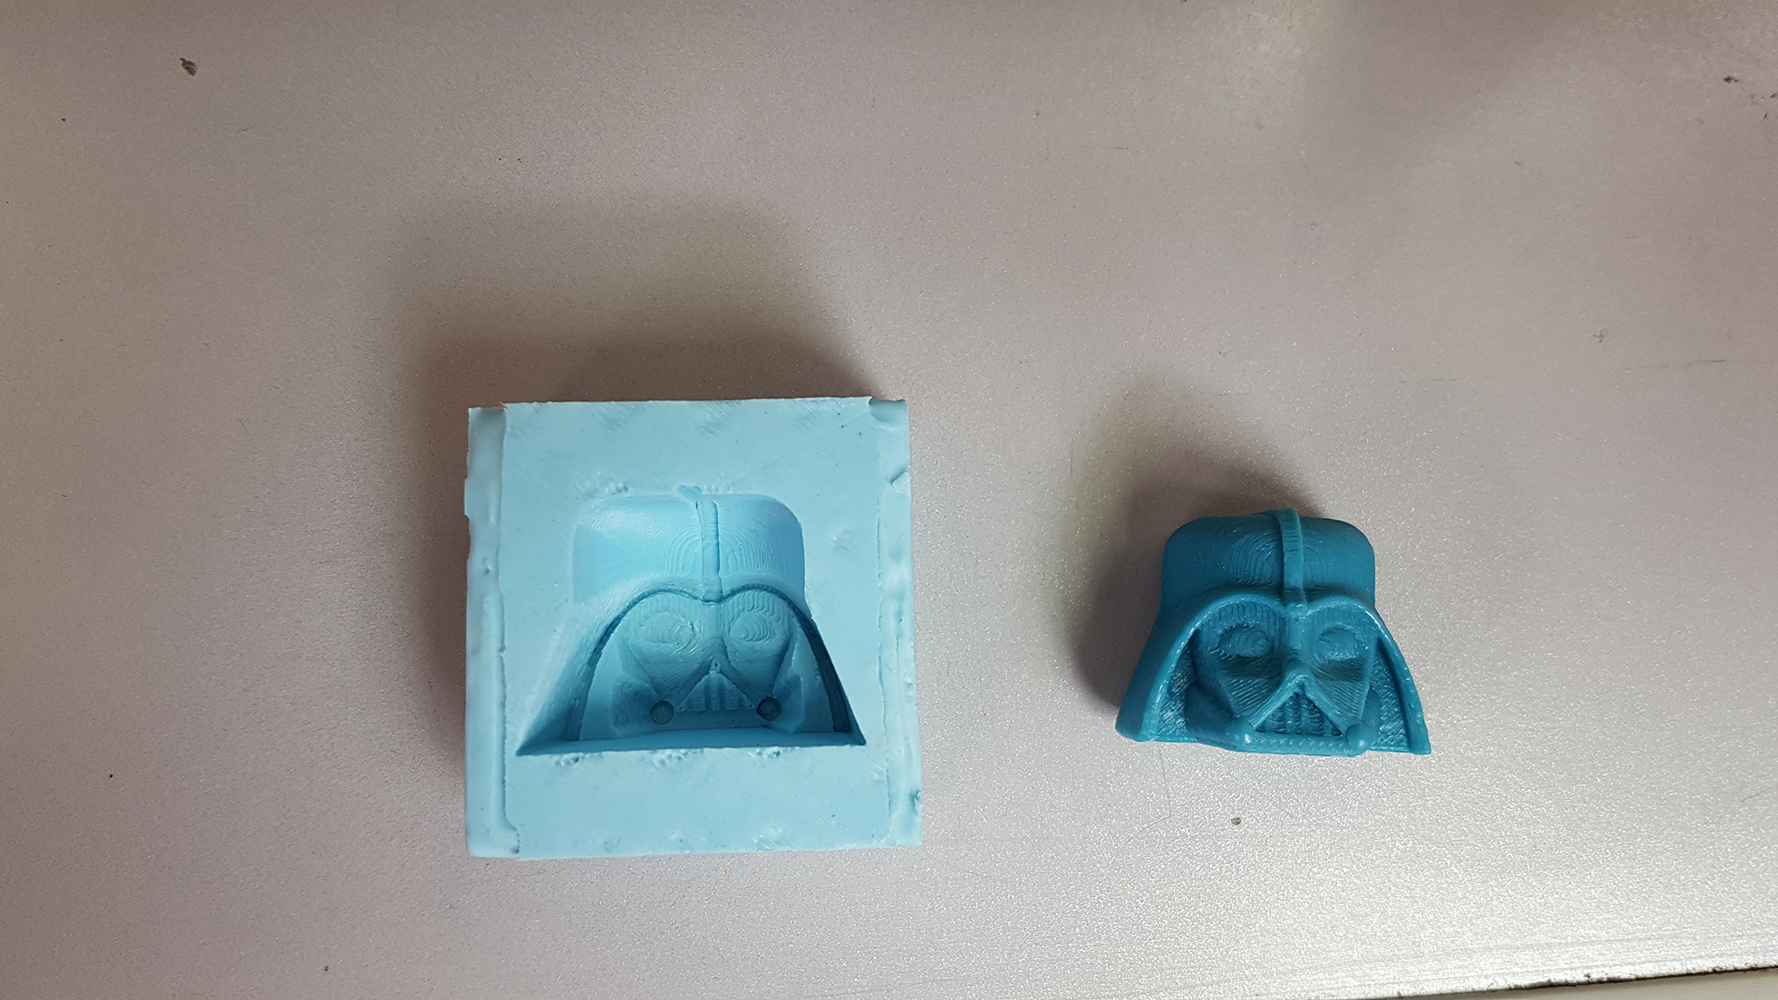
● POLYURETHANE FOAM: The material we used to make the mold is expanded polyurethane. It comes in the form of panels of 100x70cm with a thickness of 8cm. It is a material that can be cut with a cutter or with an iron saw. When the polyurethane is cut, it is necessary to wear protective glasses and a mask because the dust that is produced could cause irritation to the eyes and respiratory system.
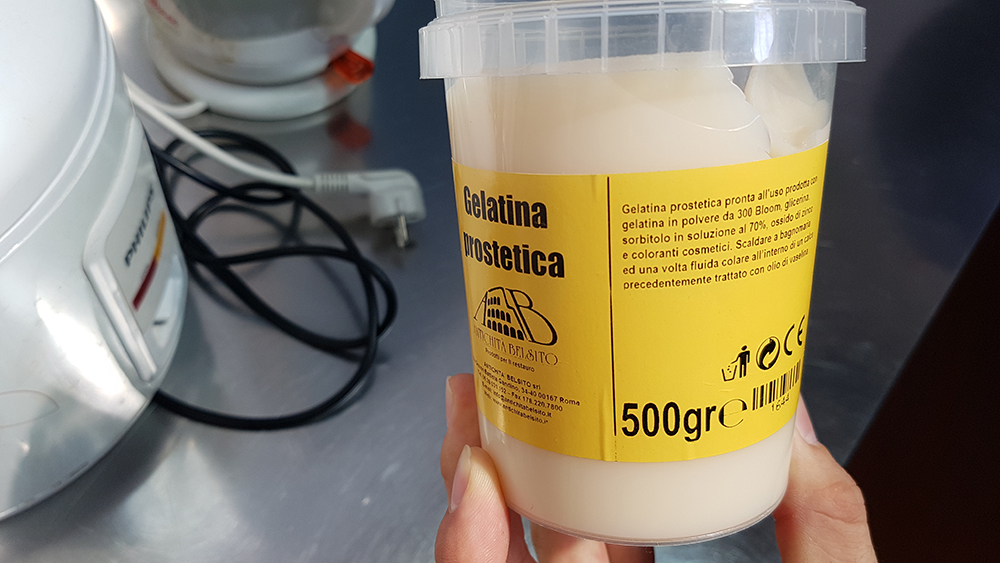
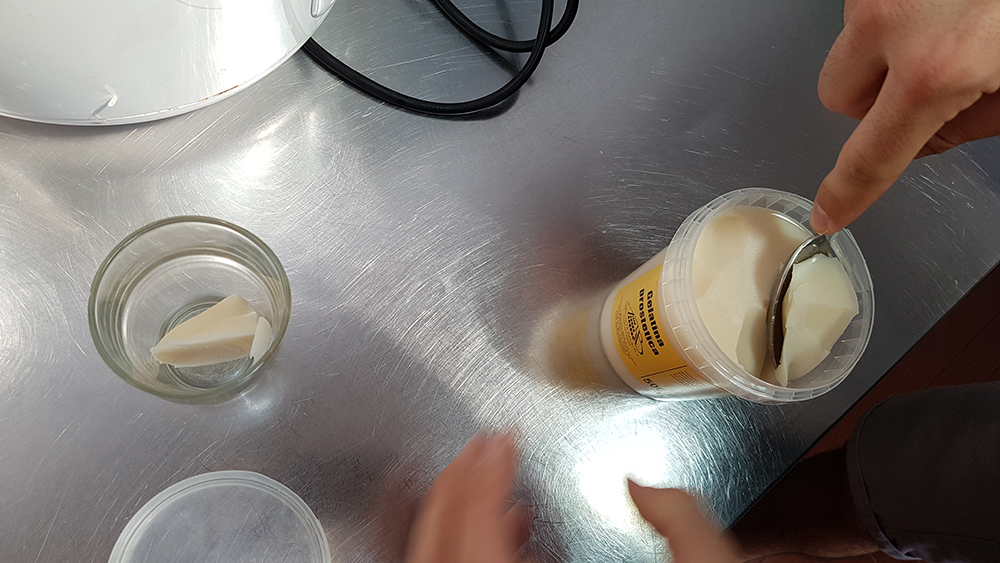
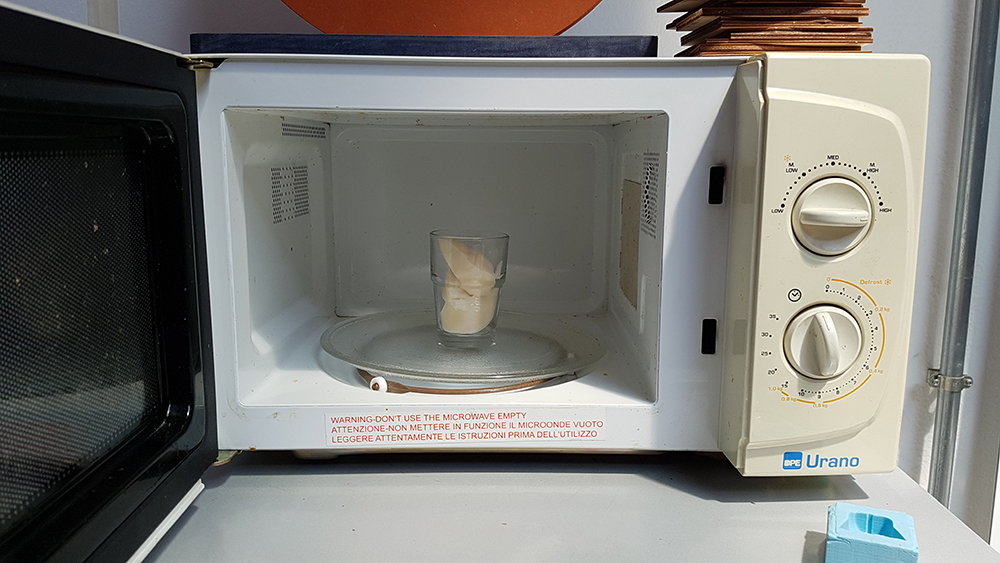
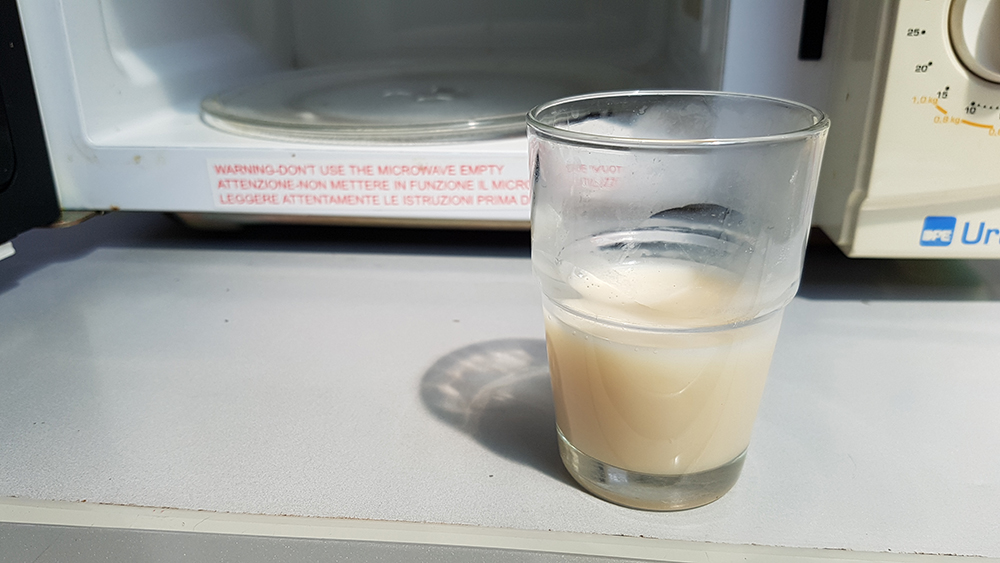
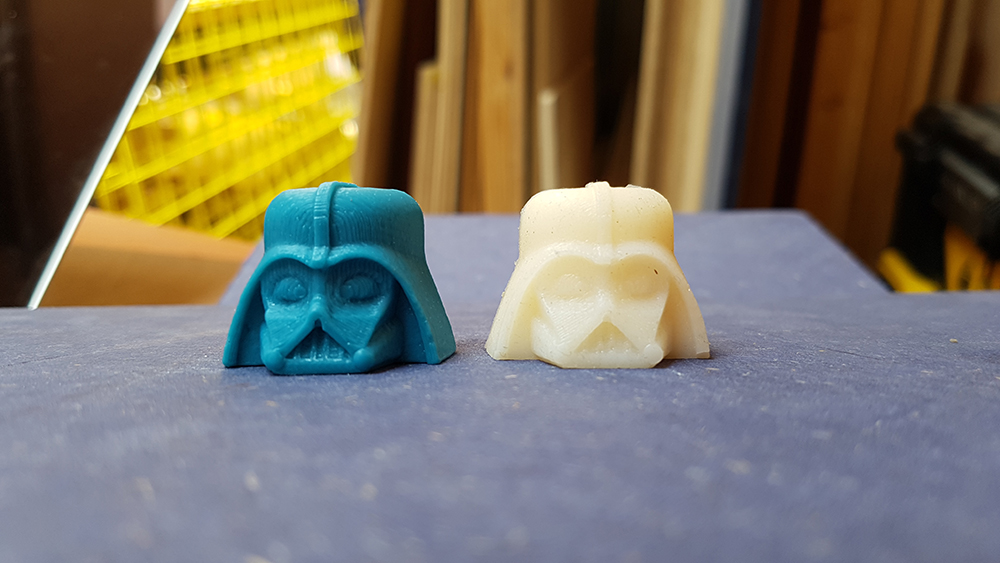
● PROSTHETIC JELLY: It is a gelatin powder, glycerin and sorbitol in 70% solution. It is sold in 500gr jars in which the gelatine is in a solid state. It is recommended to keep it in the fridge. To work it, just heat it up quickly in a saucepan in a bain-marie or for 5-10 seconds in the microwave. After having poured it in the liquid state, it is possible to proceed with the casting in the mold and within 30 minutes it is ready.
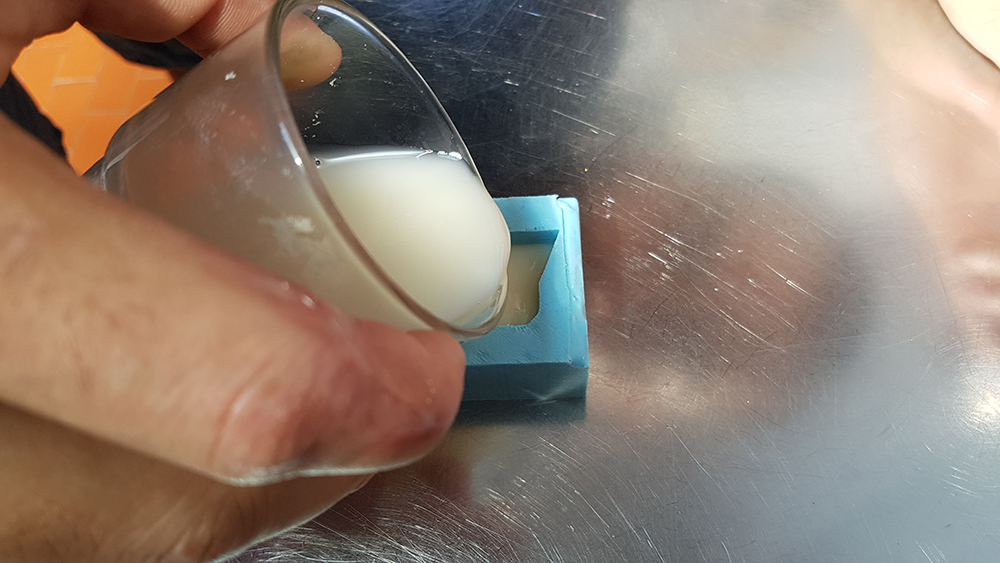
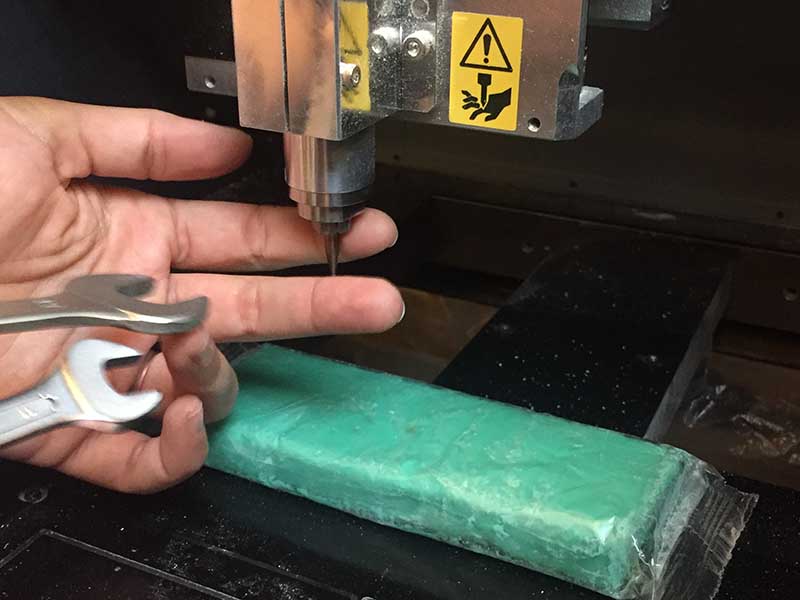
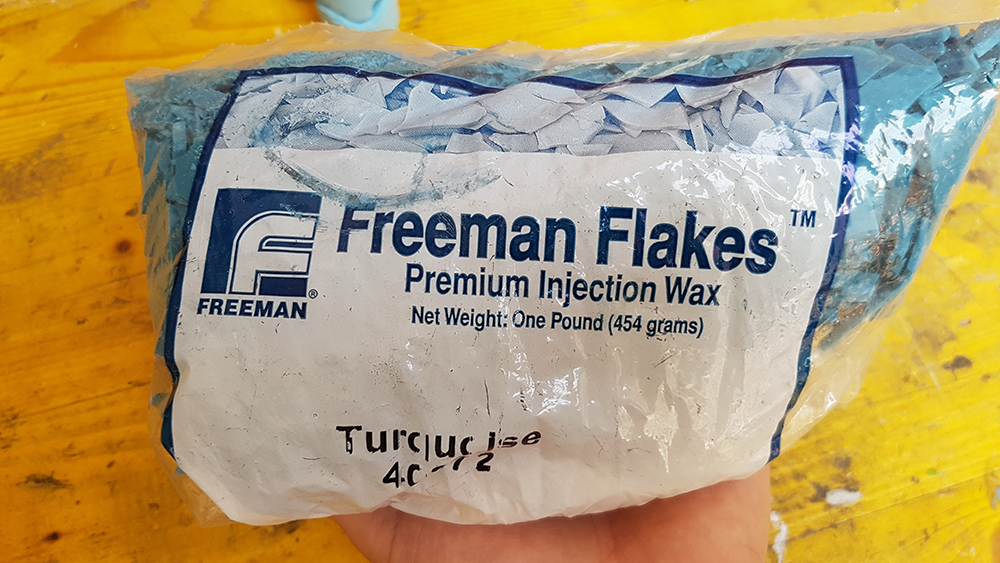
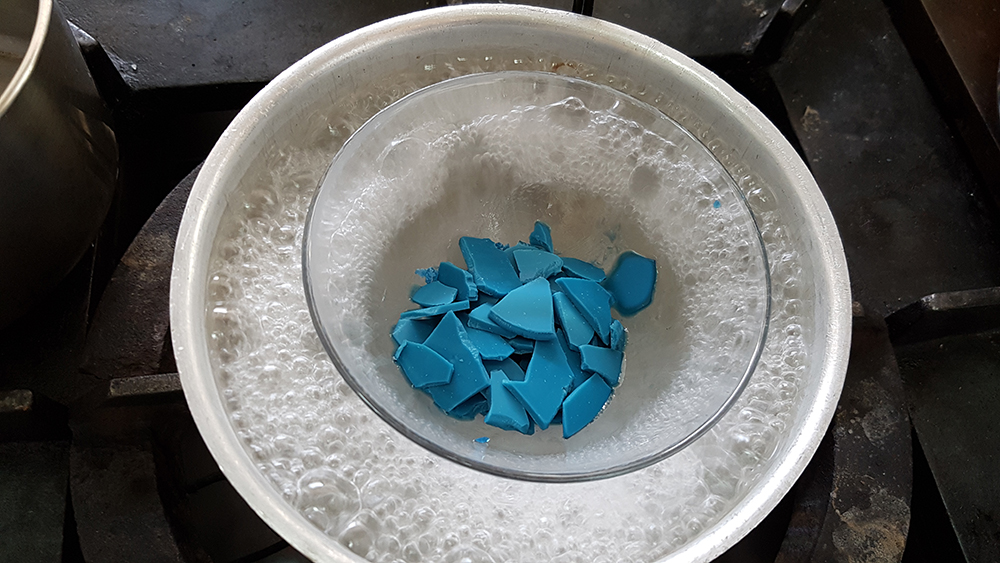
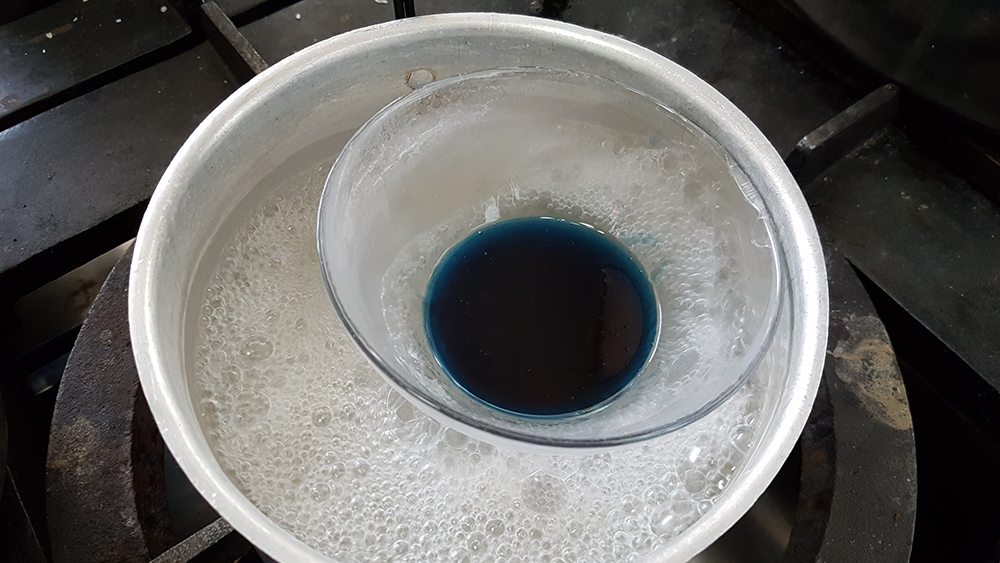
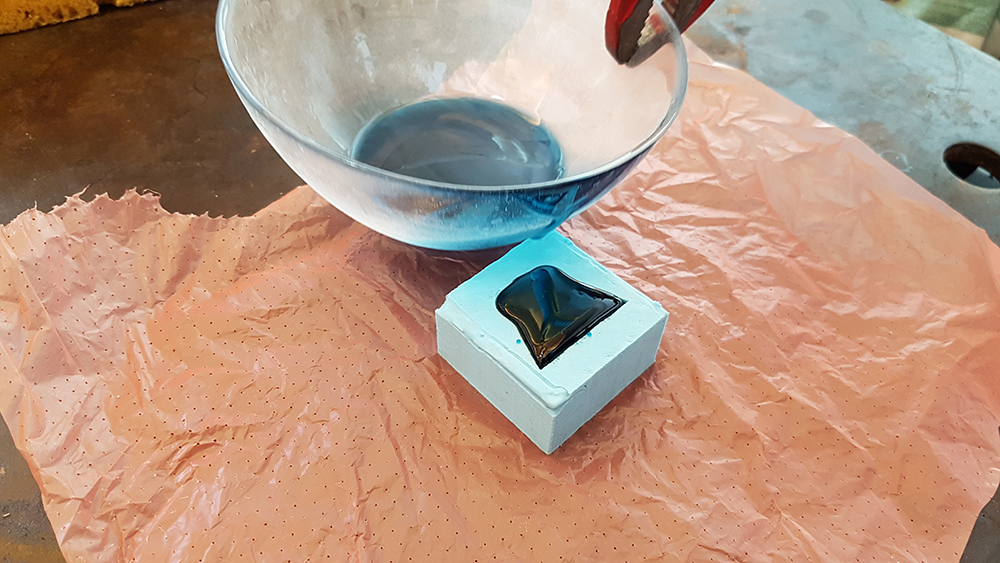
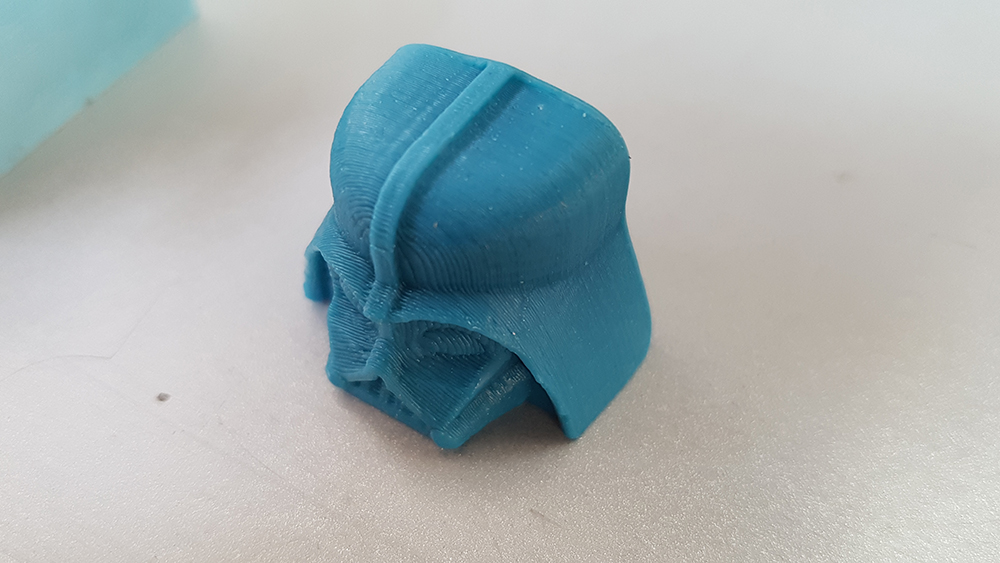
● INJECTION WAX: It is indeed a wax that is used in injection molds, which is then kept hot at a constant temperature of 71 ° C until the time of injection. It is sold in bags of 454gr in the form of small pieces of different sizes. The risks that are encountered when used are mainly the breathing of fumes and the contact burn when working the material at high temperatures. In our test it was sufficient to heat it in a small pot in a bain-marie for about 10 minutes to bring it from the solid state to a liquid state. Then we made the casting being careful not to burn with the bowl and with the wax. The wax returned to the liquid state after about 30 minutes.
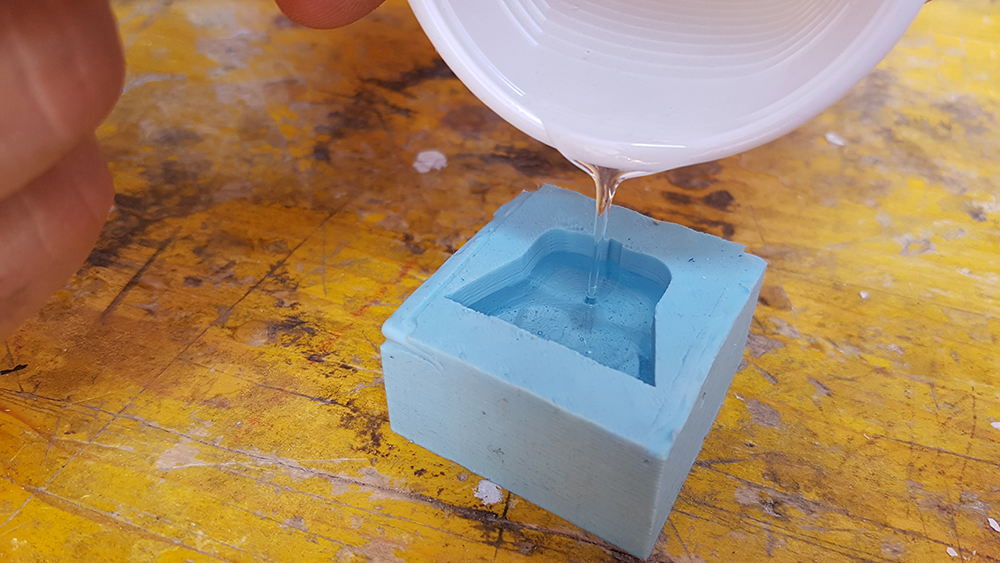
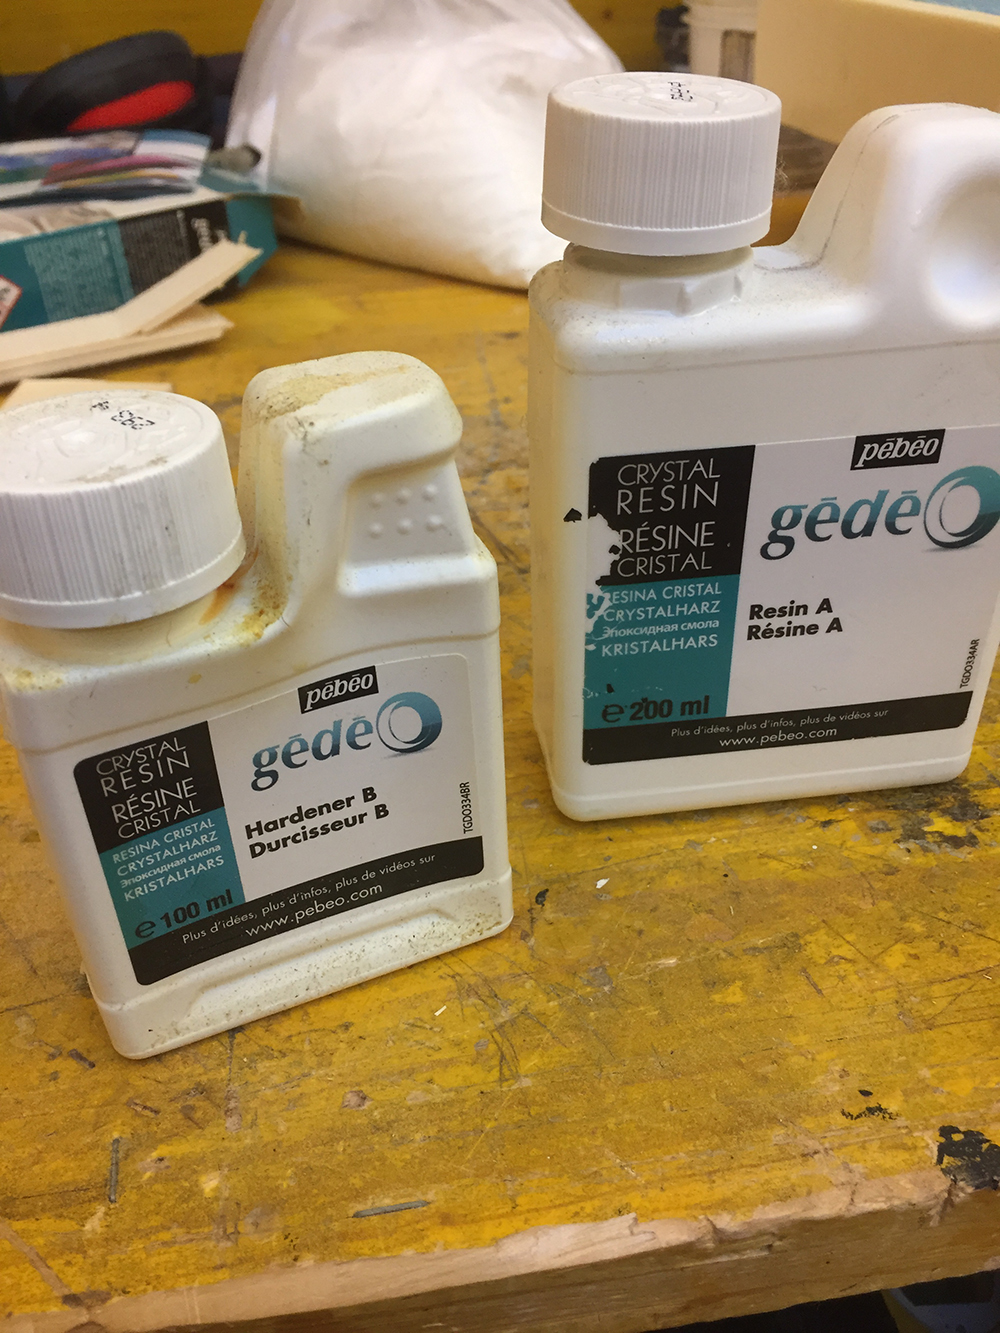
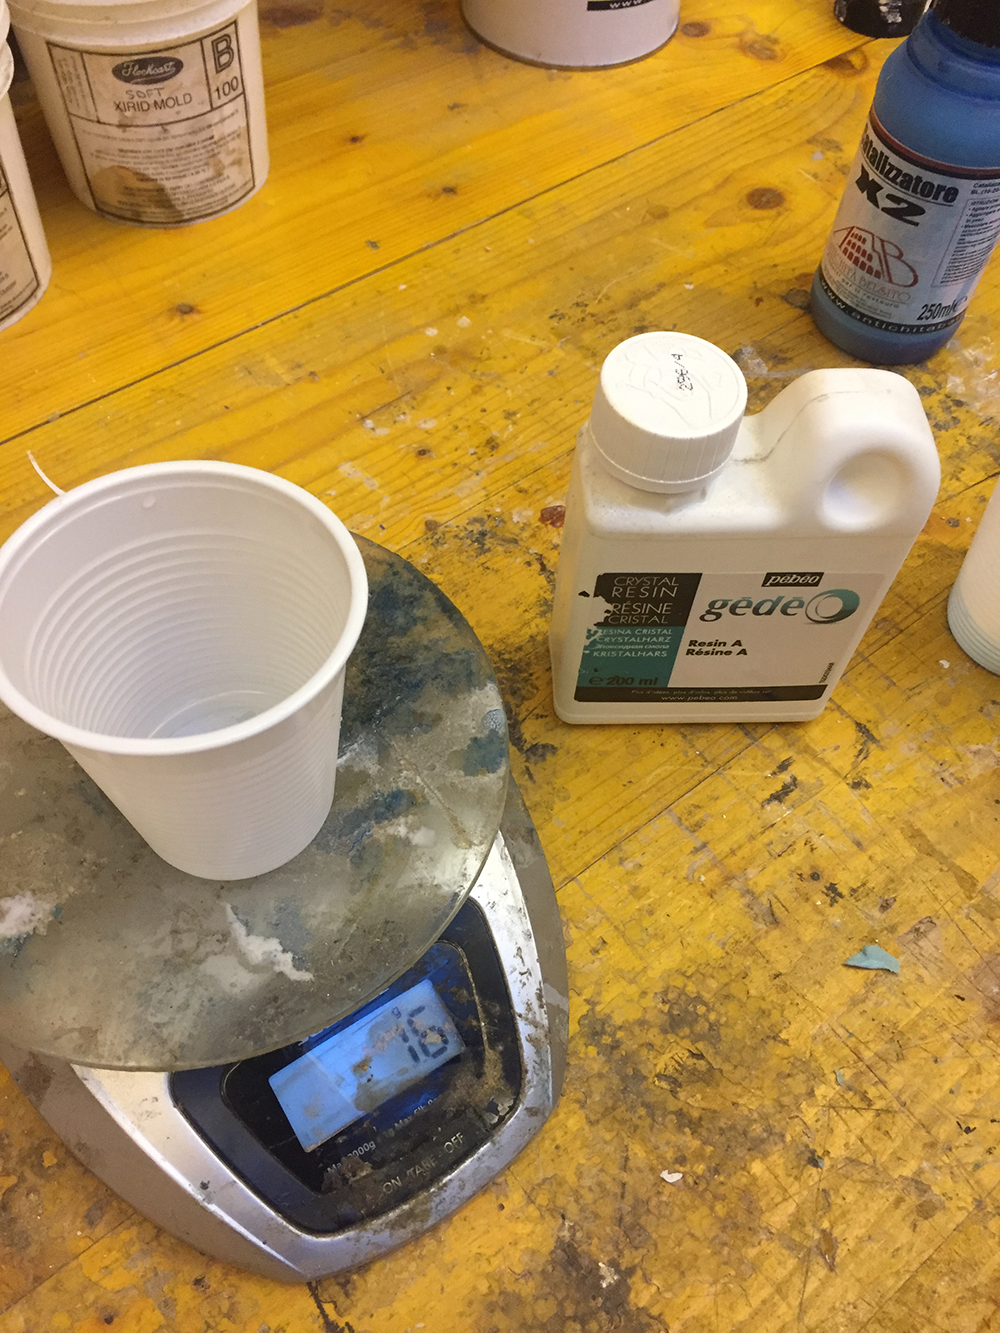
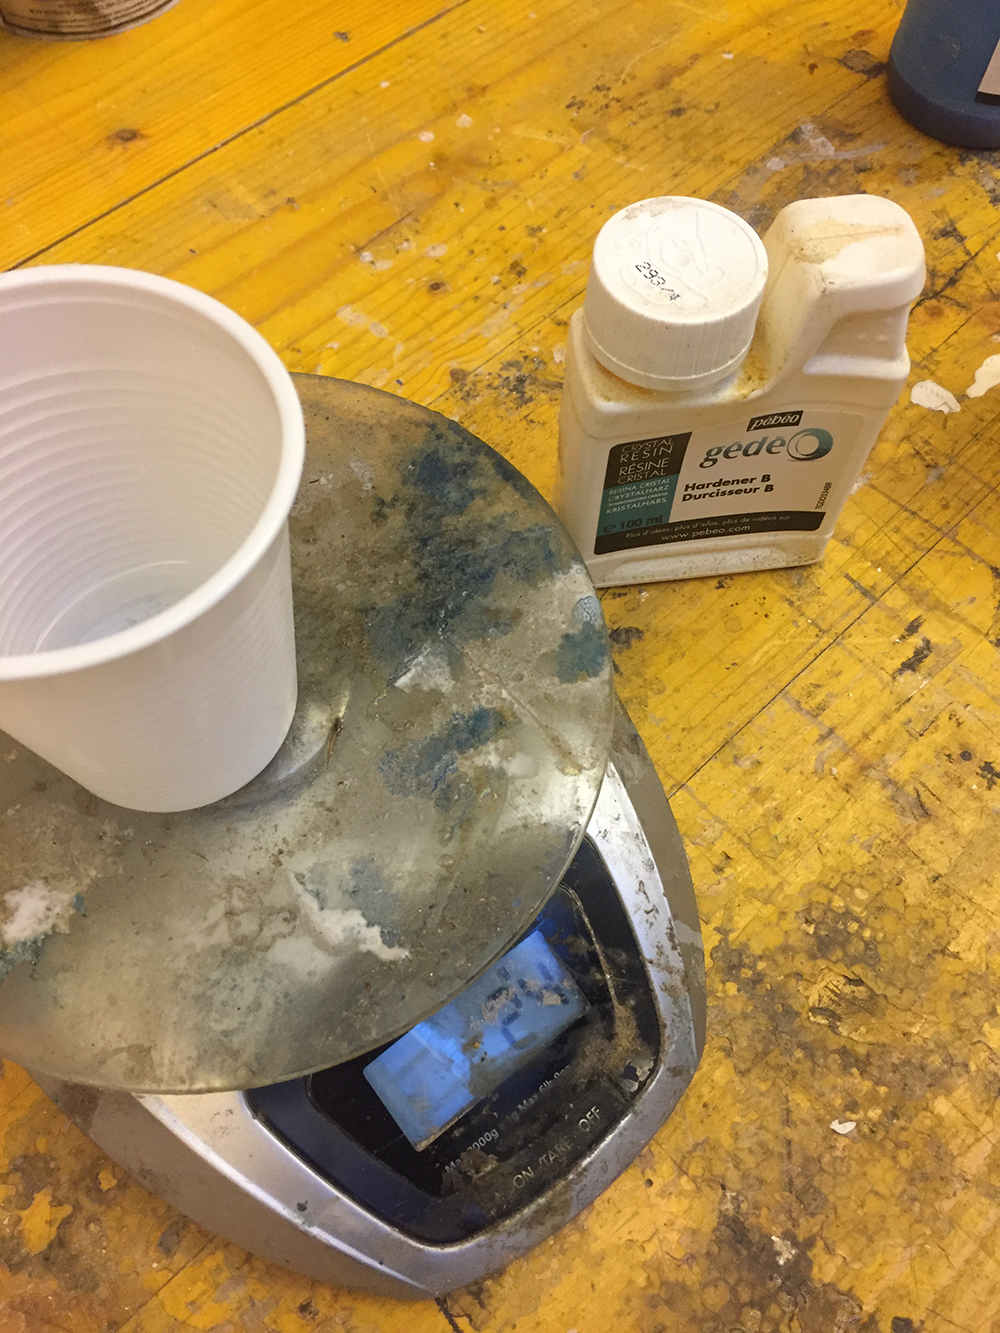
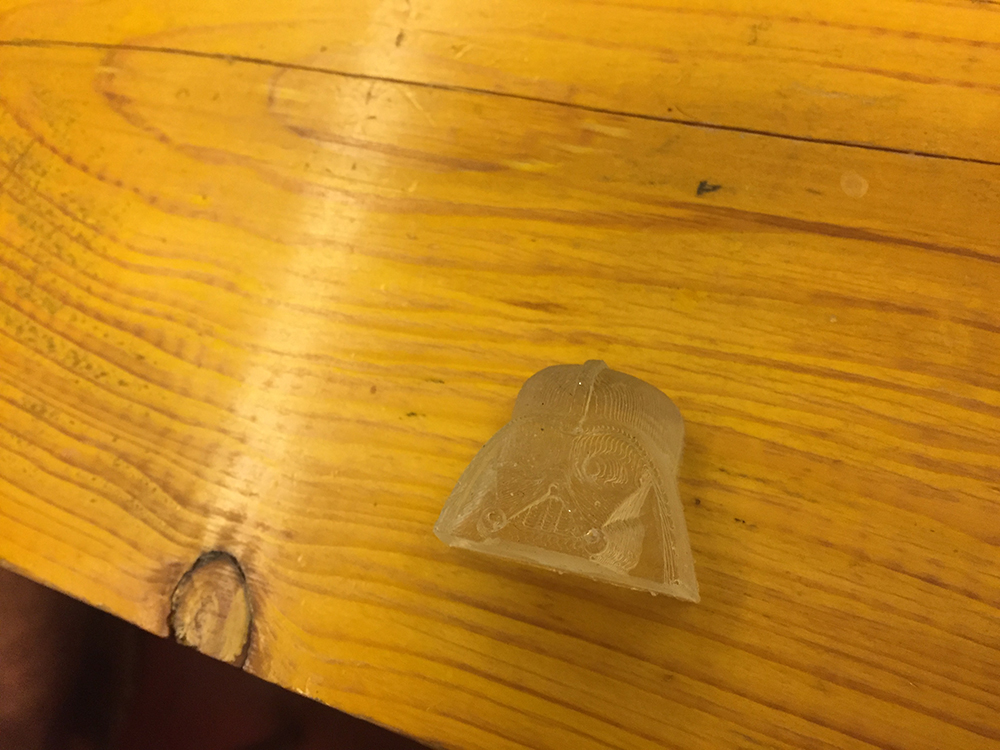
● CRYSTAL RESIN: Like many resins, the one we tested is a two-component epoxy resin in a 2:1 ratio. The dosage is very simple and is done through the use of a scale. It is recommended to use many precautions for personal safety as gloves because you can be corrosive, glasses and mask to not breathe fumes. After joining the two parts of resin with a part of the catalyst it is necessary to emulsify the mixture very well before pouring it. After casting, 12 hours must elapse to harden the surface, and 24 hours for complete resin hardening.
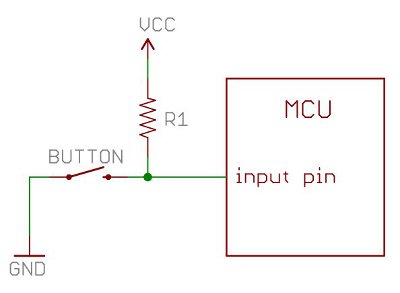
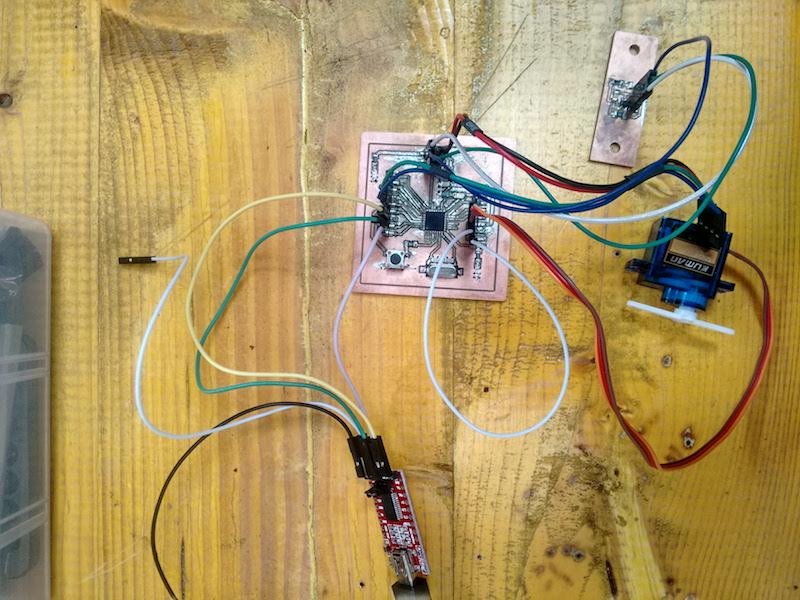
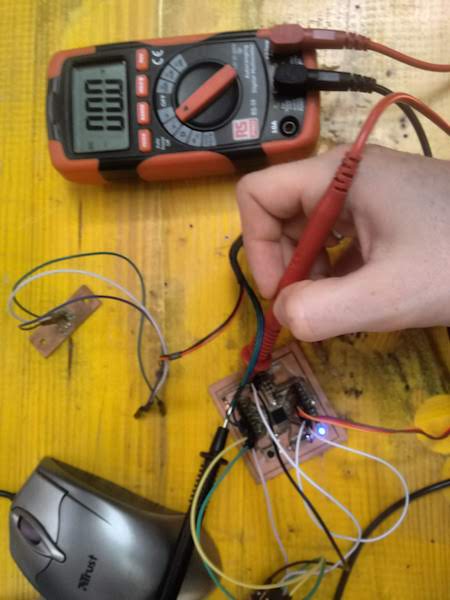
To measure the input signals we used a digital multimeter on the DC Voltage mode. The black test lead is inserted into the COM terminal (center), and the red test lead into the V terminal (right). The first measurement was a digital signal, in this case from a pushbutton and a pullup resistor connected according to the following schematic: For the measurement we put the black test lead at GND and the red test lead on the microcontroller pin. In the video we can see that the signal is normally at 5v, while when we press the button this becomes about 0v.
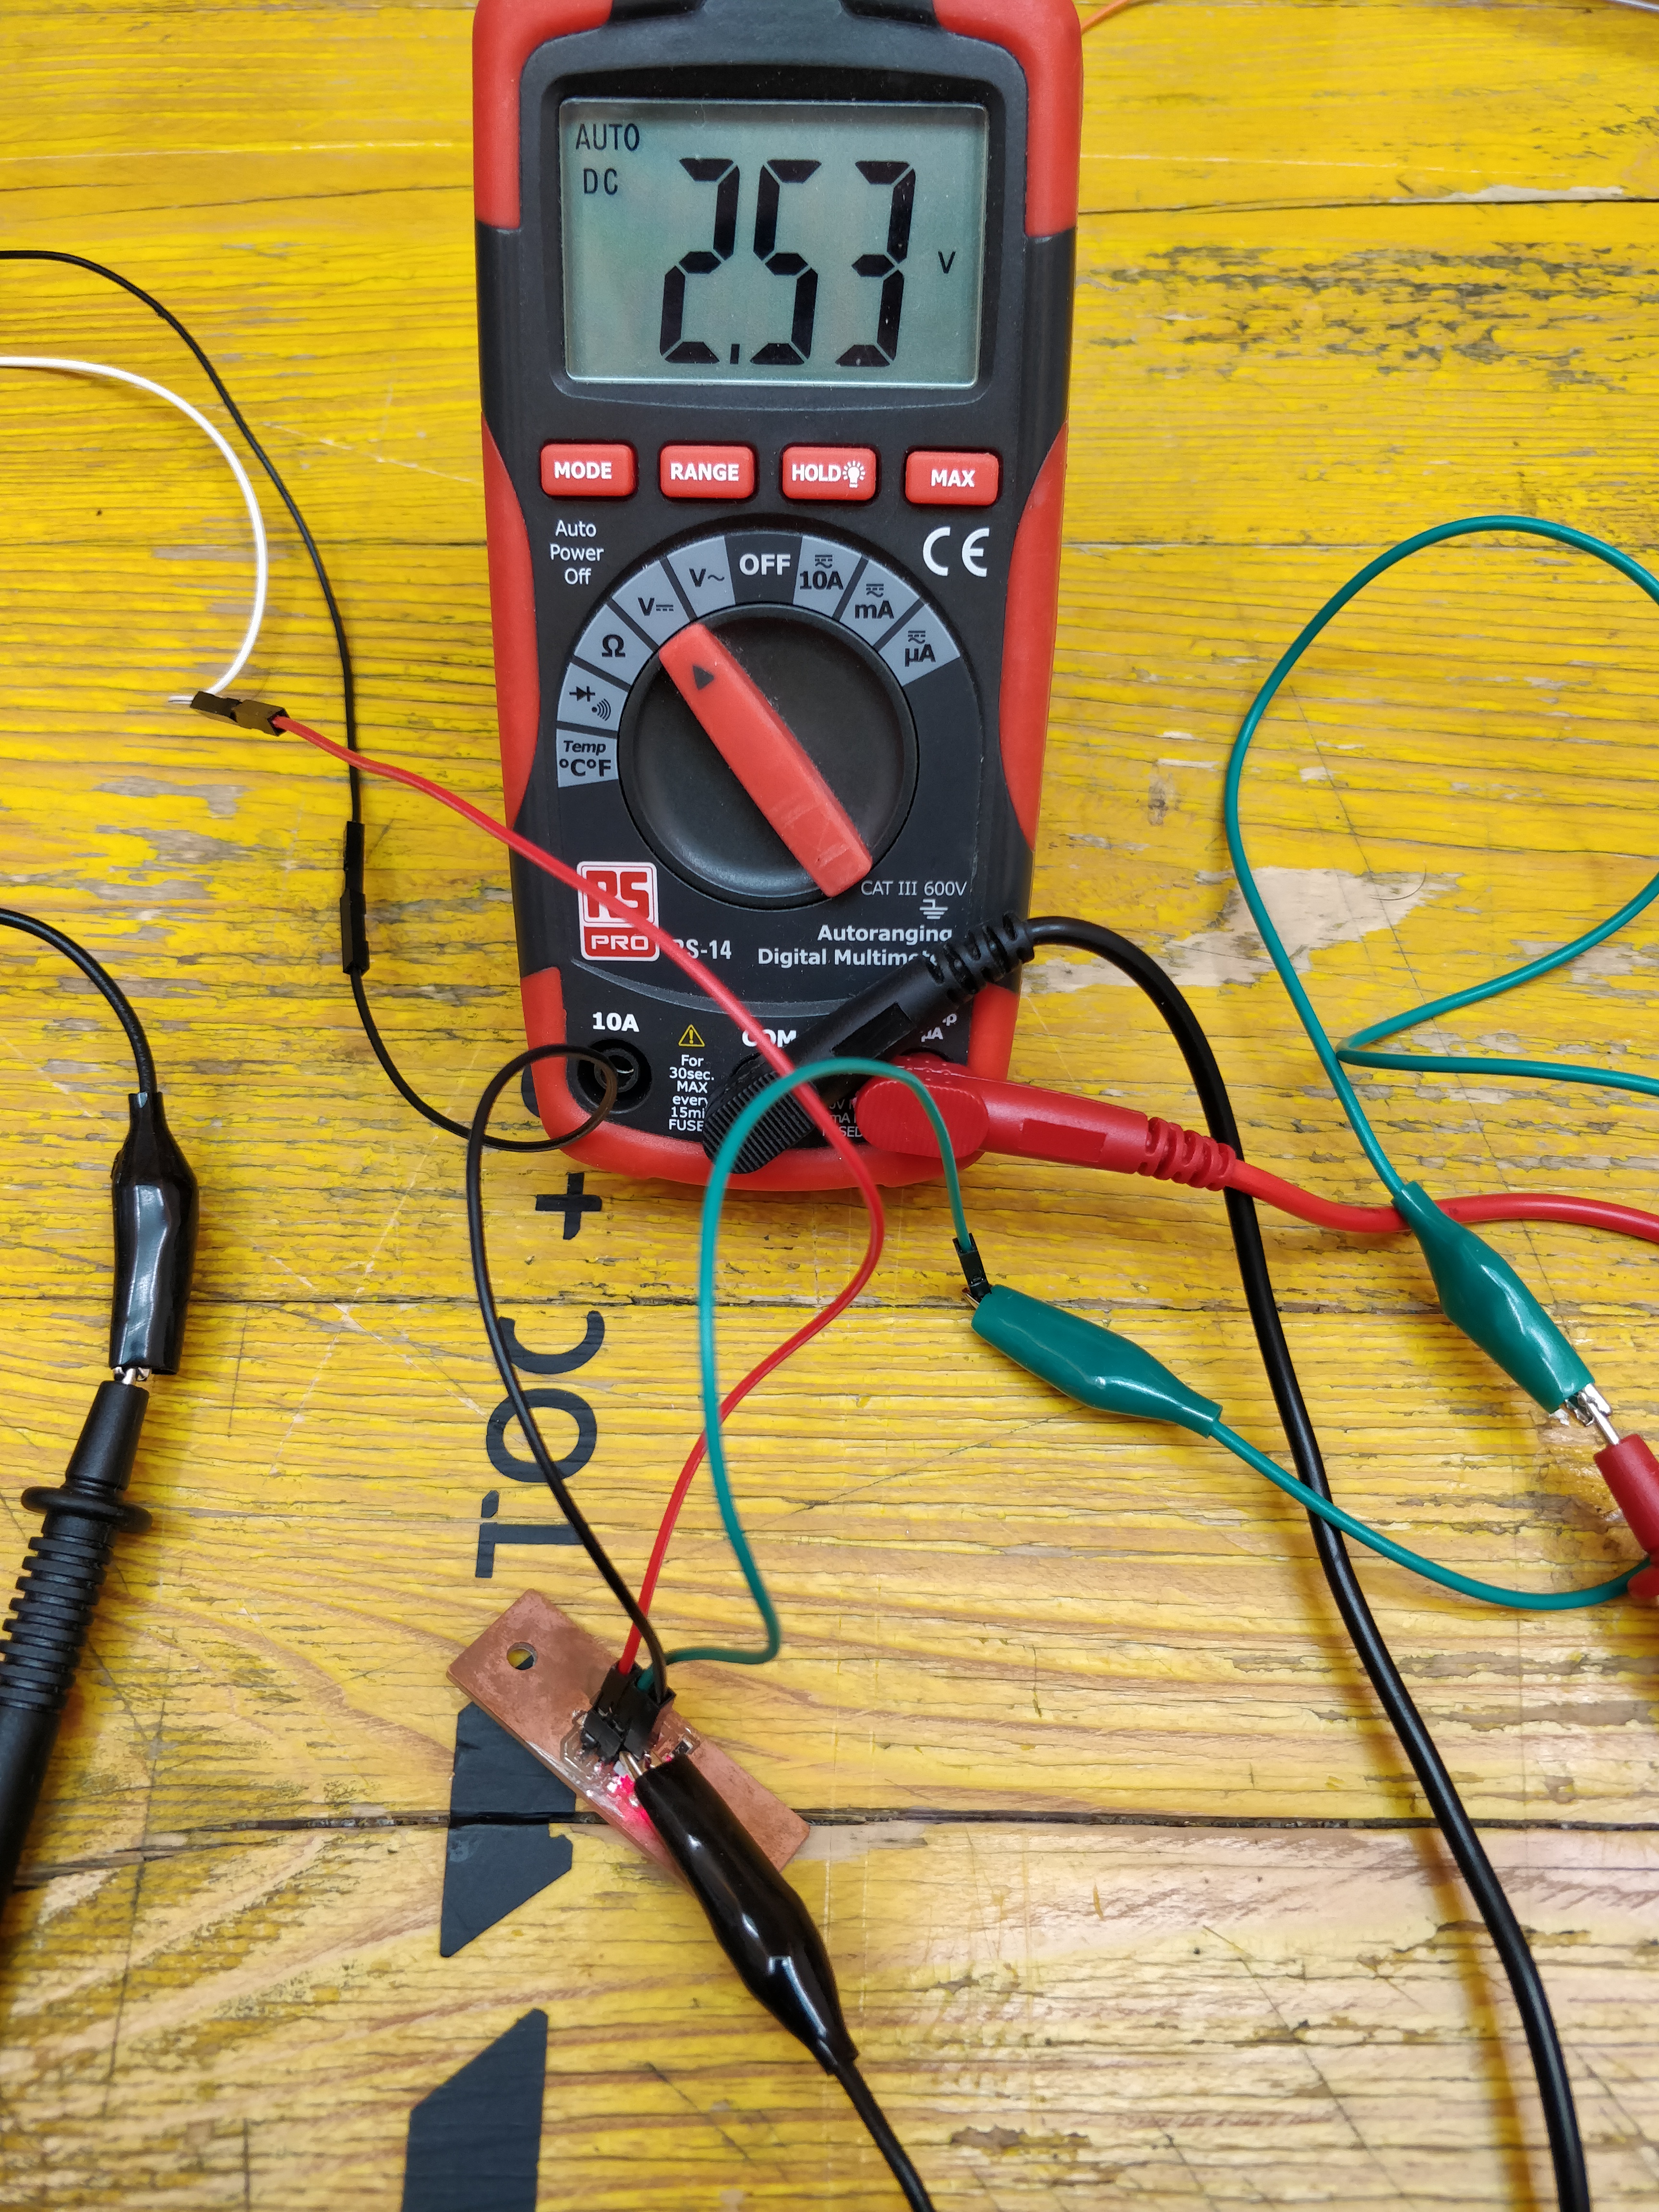
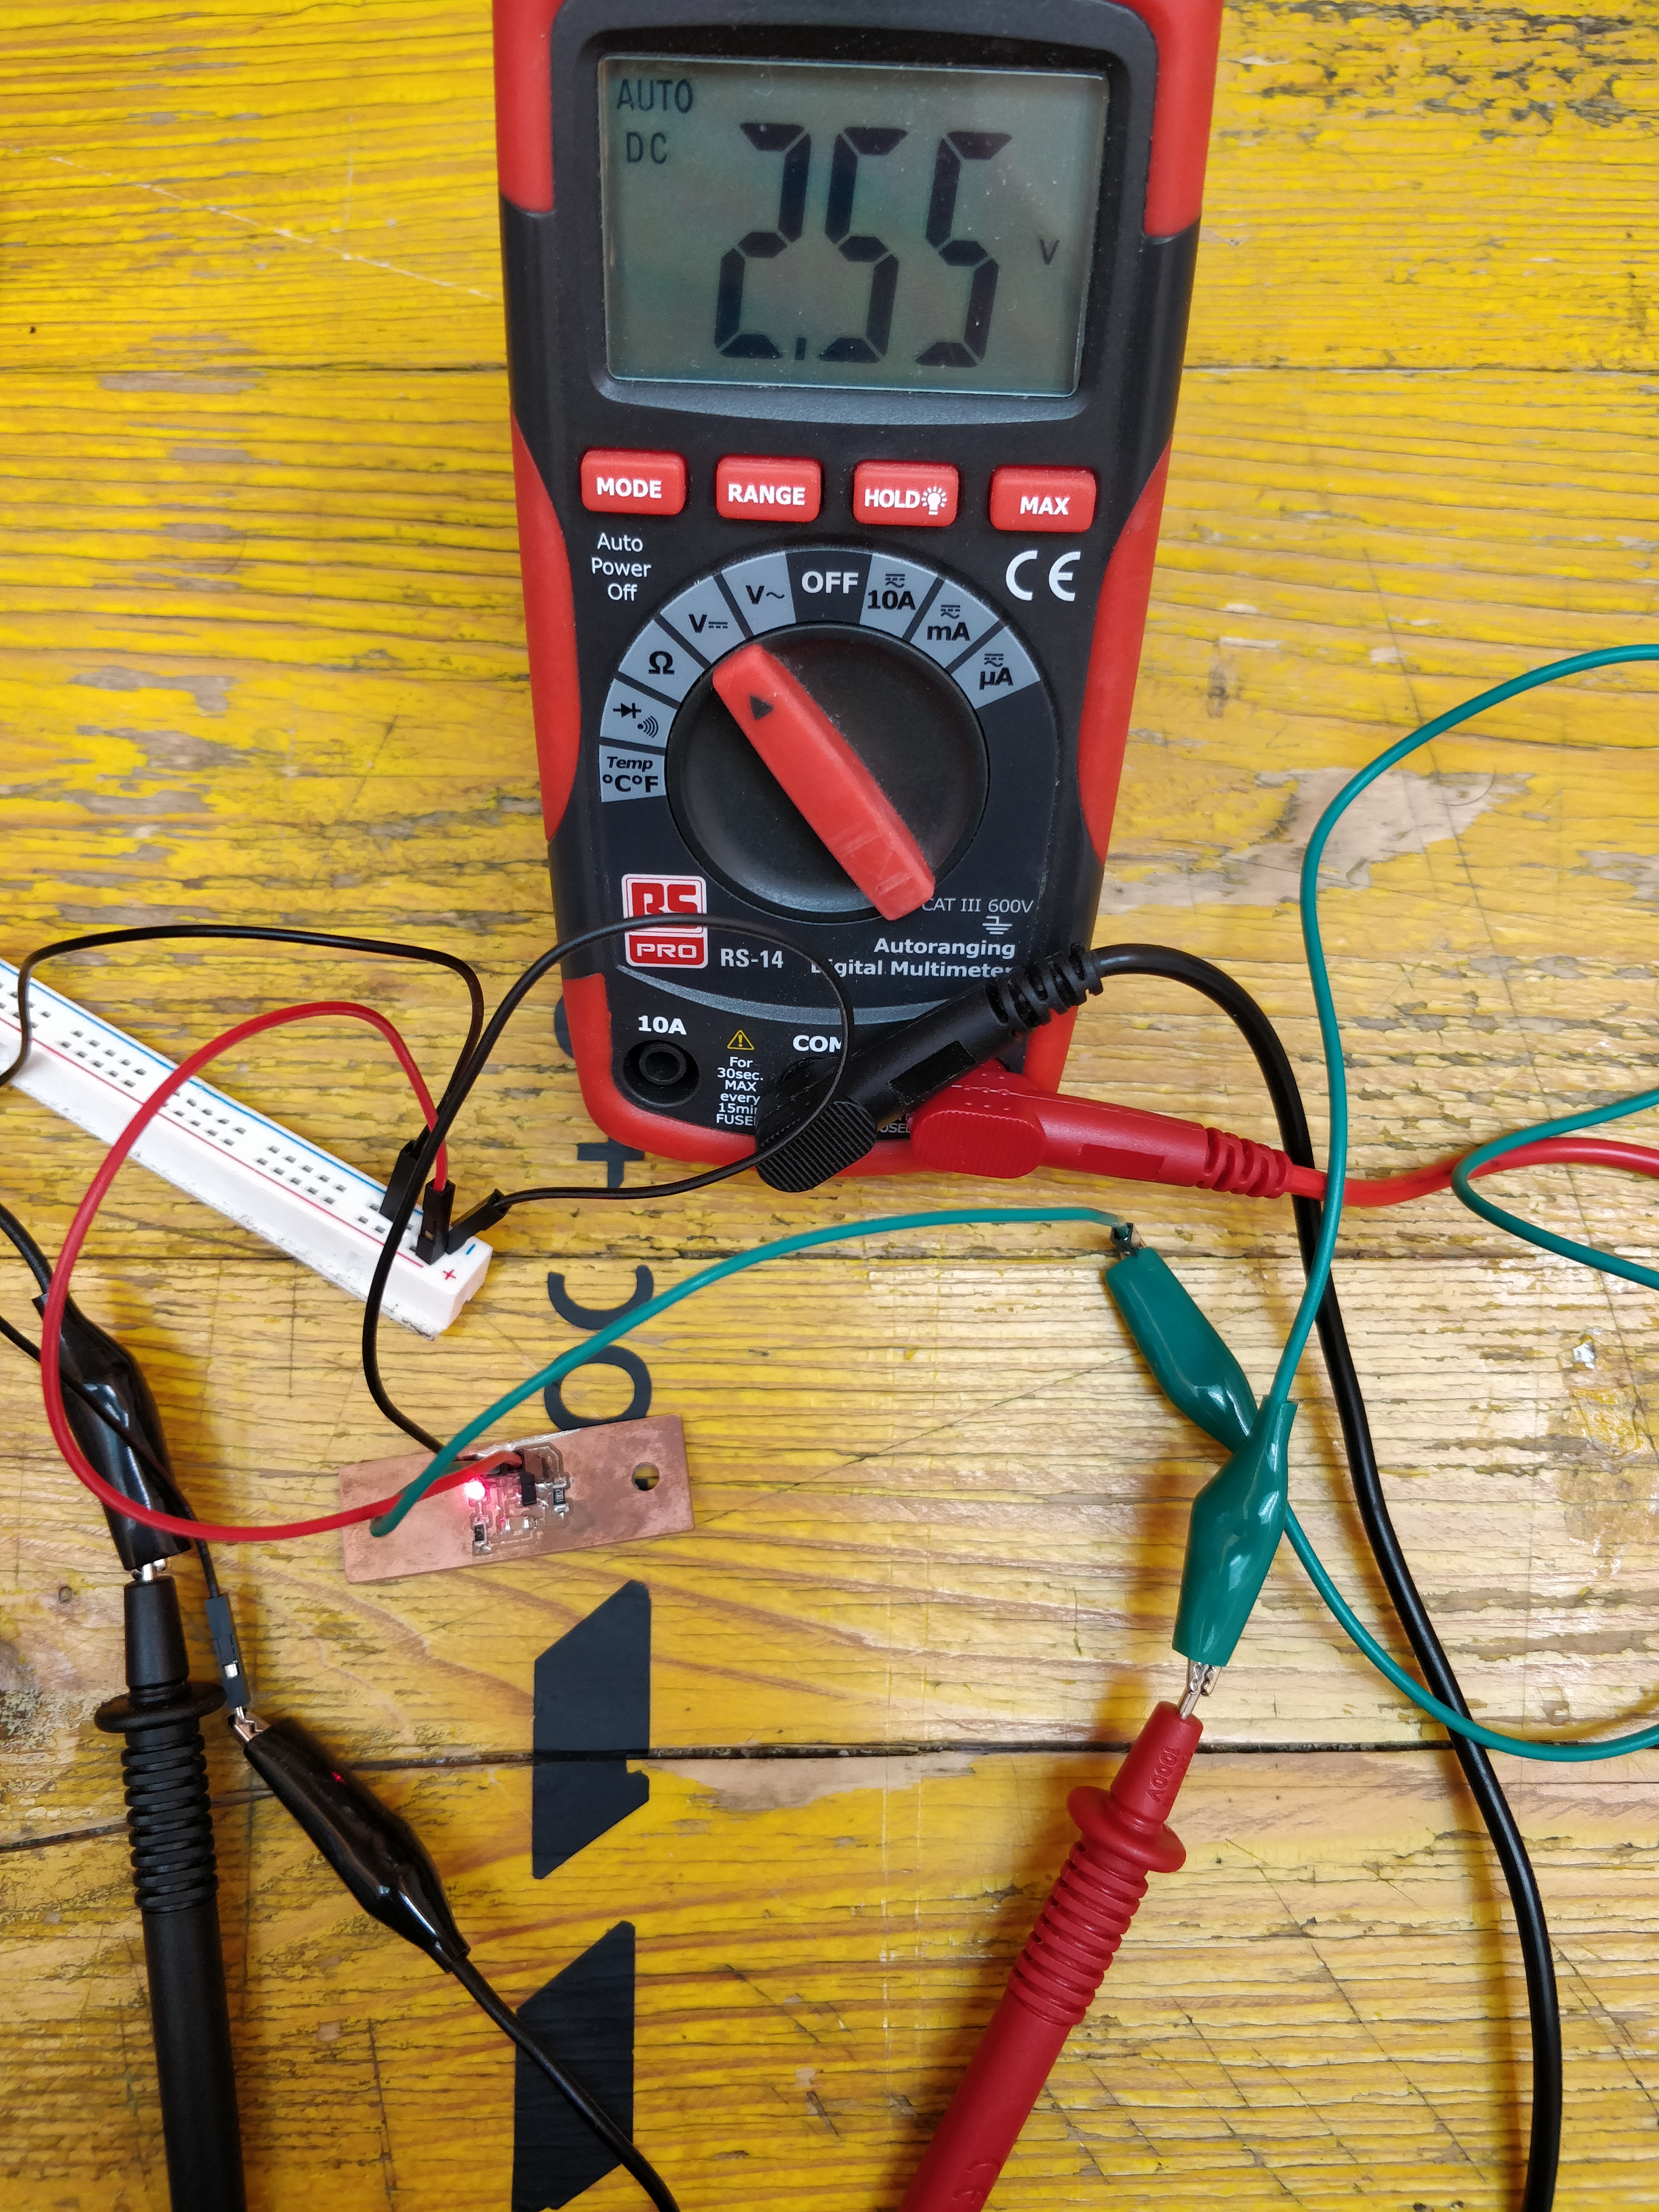
For the analog signal measurement we used the Laura’s breakout board made for the Hall sensor. With the board powered on we made the measurements by placing the black test lead on the GND and the red st lead on the signal pin. Without any magnet near the measured voltage is about 2.5v, this increases approaching a magnet from the side of the north pole while decreases when approaching the south pole.
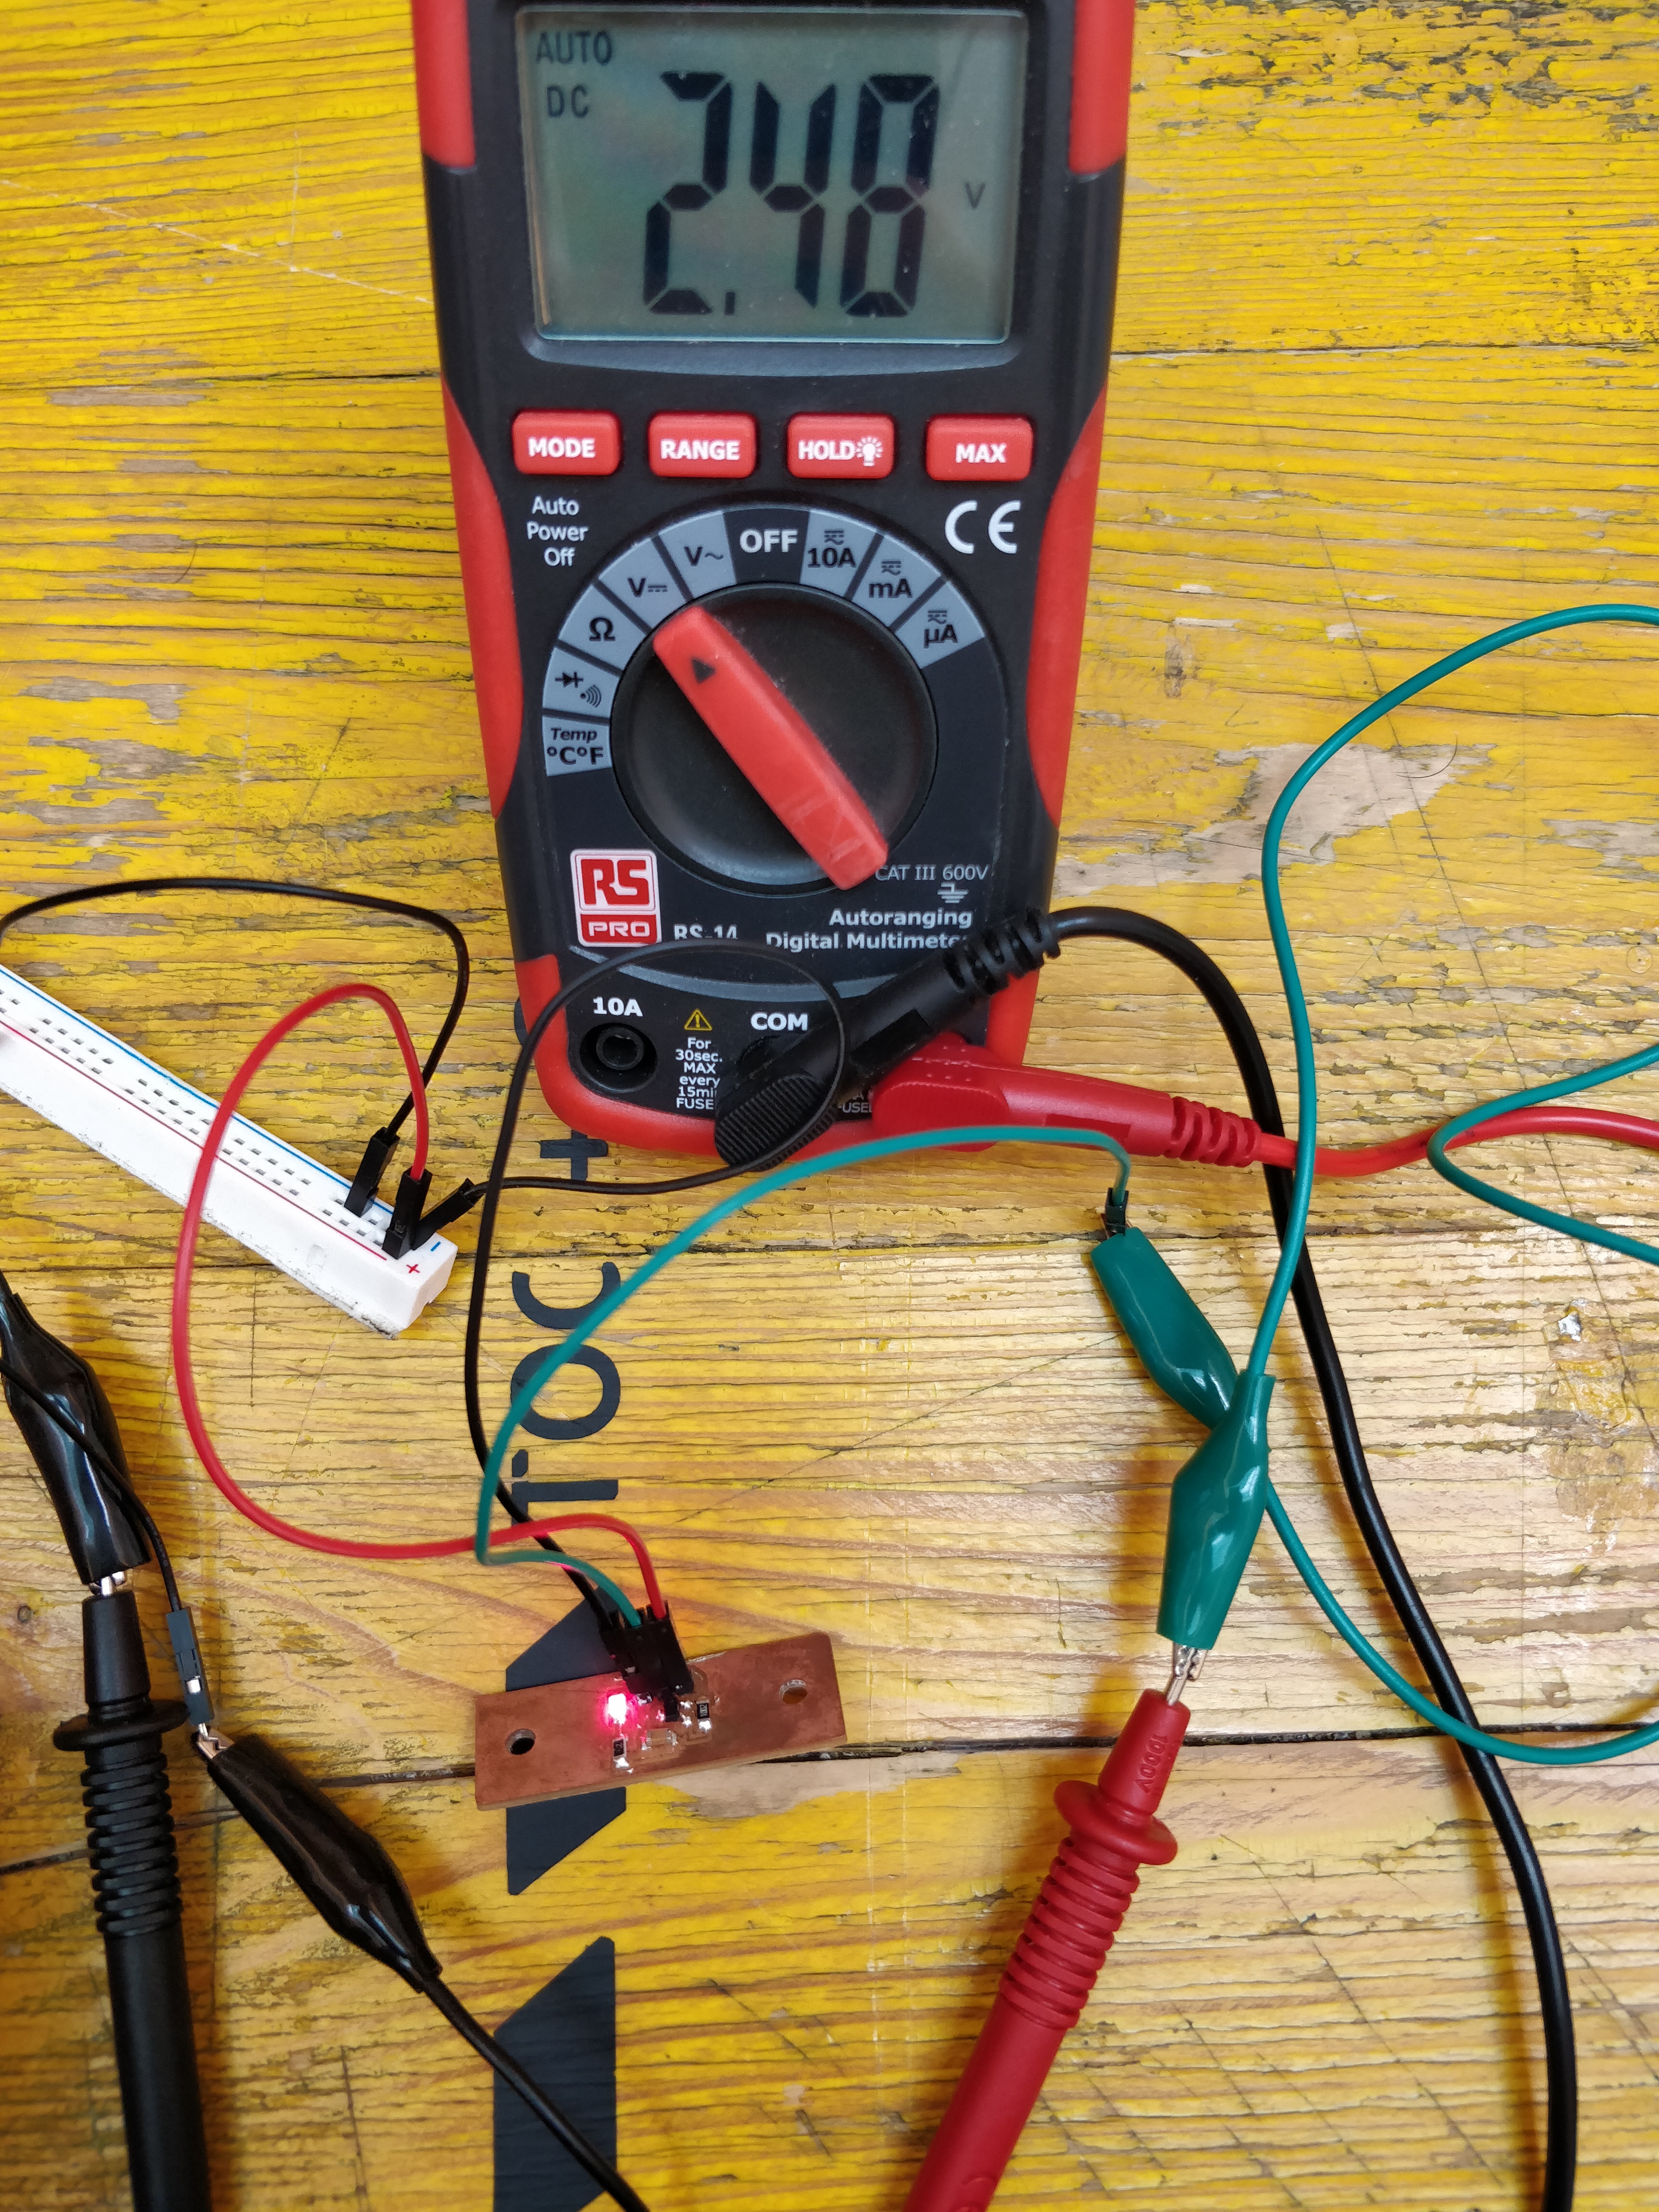
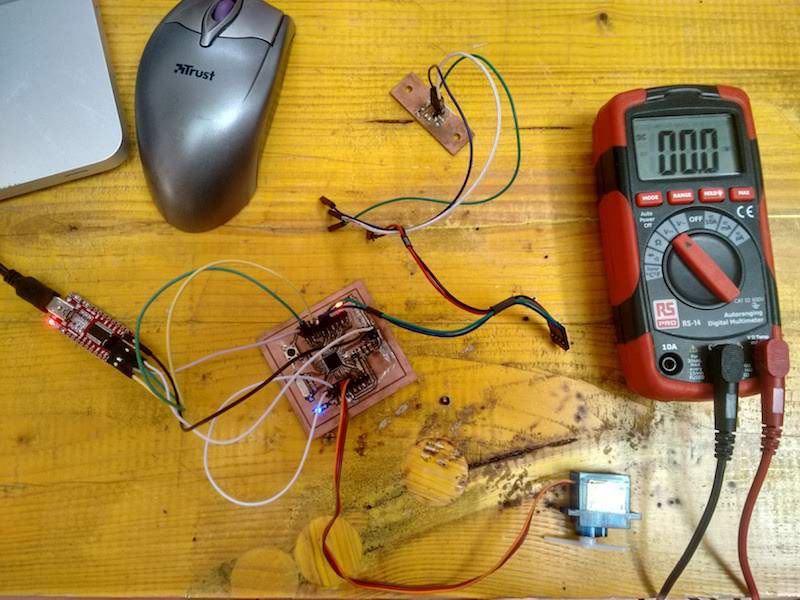
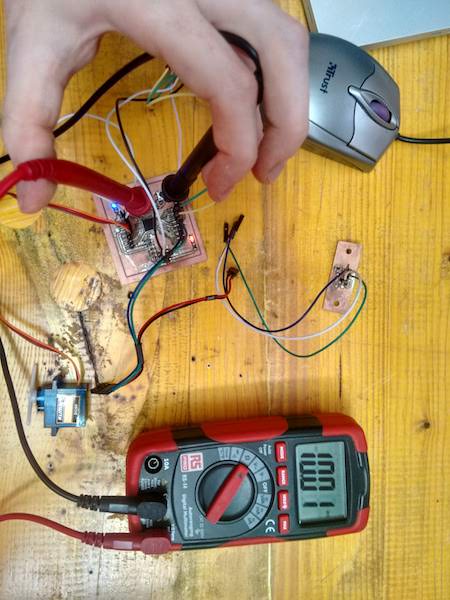
To measure the the power consumption we used a digital multimeter on the 10A mode. The black test lead is inserted into the COM terminal (center), and the red test lead into the A terminal (left). The output device we chose is a DC motor, so we mounted the control circuit on the breadboard: # IMAGE To take the measurement we have disconnected the positive cable of the power supply and in its place put the test leads of the tester, the black test lead to the power supply and the red test lead to the motor. the circuit was closed we measured an absorption of about 0.39A, while reaching the maximum rotation speed the absorption drops to about 0.11A. Knowing that the power supply voltage is 5v, we can calculate the consumption in watts: P = V * I = 5 V * 0.39 A = 1.95 W at starting point P = V * I = 5 V * 0.11 A = 0.55 W at full speed
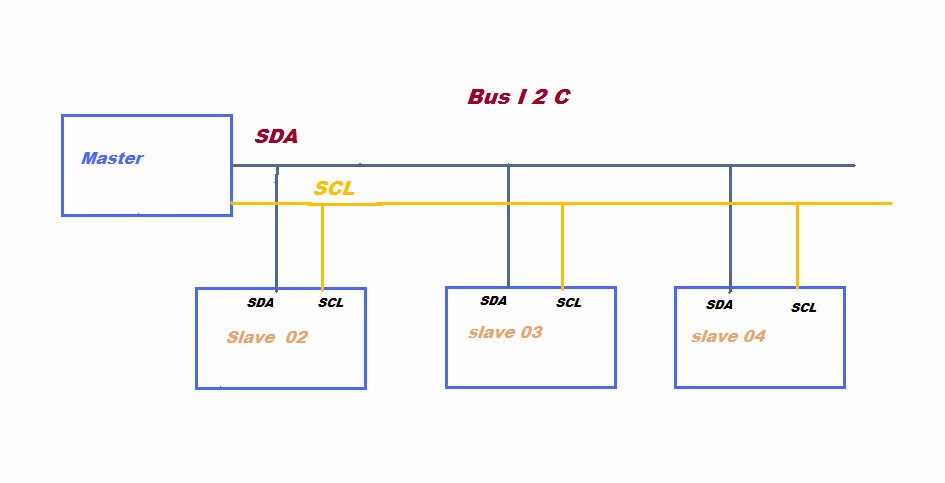
In this Group assignment we had to send a message by two of our project. We chose Massimiliano d'Angelo's board and Laura Cipriani's board. We used i2c protocol to connect via cable the two boards so that pressing a button on Laura's board, setted as "Master", we can power on a LED mounted on Massimiliano's one, setted as "Slave". I²C means Inter Integrated Circuit, is a serial communication system (us) between a "Master" and one or more "Slave". The protocol requires two lines: SDA for data, and SCL for the clock. Then you eed to connect also GND and VDD (+5V or +3,3V). i2C uses 7 bit, so you could to connect 128 devices on the bus.
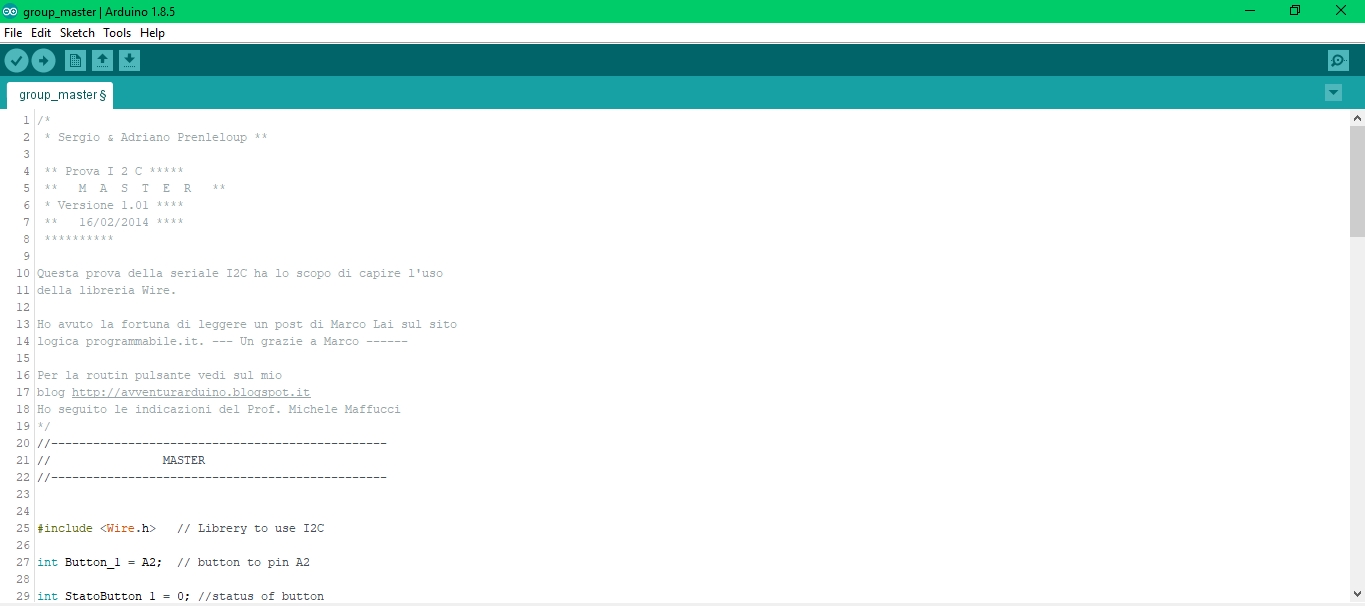
First step was to program the two boards: In Master board we included the library "Wire" and setted to pin A2 the button.
Here the sketch for MASTER:
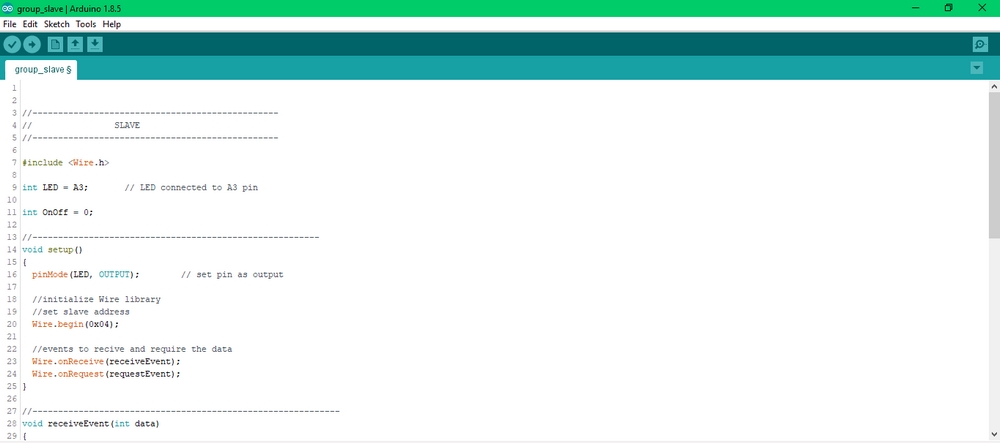
After that, we proceed to write the sketch for the Slave board. On Slave board we put the pin A3 to the LED and included the library Wire.h. Here the sketch:
SKETCH FOR SLAVE:
Finally we provided to connect all the cables, SDA, SLC, VCC and GND between the boards. And powered on the two boards.
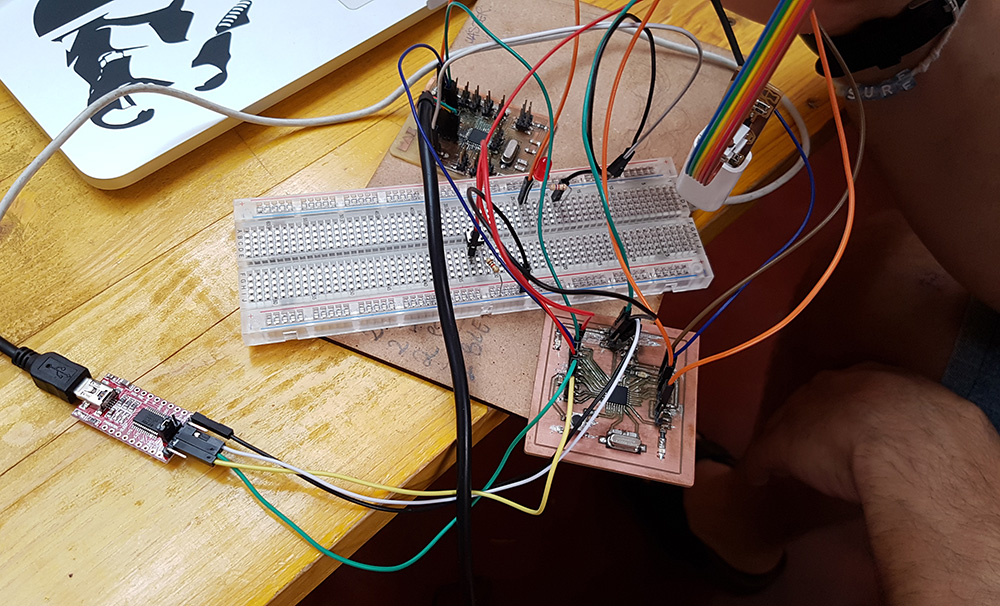
They worked perfectly.