
Probing Analog & Digital Signals
For the group assignment, my role was to help prepare the test setup and document the measurements using the oscilloscope and multimeter. I worked alongside my classmates to measure and compare how different sensors behave electrically — specifically looking at the difference between a digital signal (PIR sensor) and an analog signal (LDR sensor). I was responsible for recording the oscilloscope screenshots and multimeter readings, as well as explaining the theoretical difference between analog and digital signals in our documentation.
Working on this assignment with the group was valuable for understanding sensor behavior at a deeper level. Before testing, I had theoretical knowledge about digital vs analog signals, but seeing them live on the oscilloscope made the concept real. The PIR sensor's abrupt switching between HIGH and LOW states contrasted clearly with the LDR's continuous analog output — this visual comparison solidified my understanding in a way that pure theory couldn't. Additionally, learning to use the oscilloscope and multimeter properly was a hands-on skill I hadn't practiced before, and working with classmates helped me understand how different sensors suit different applications. This knowledge directly influenced my individual assignment decisions for choosing sensors for my final project.
⚡ Digital Signal — PIR Sensor
A PIR (Passive Infrared) sensor detects motion by measuring changes in infrared radiation from objects such as the human body. Unlike an LDR, a PIR sensor provides a digital output:
Output goes HIGH (1) — a clear 3.3V or 5V signal.
Output stays LOW (0) — a constant 0V signal.
This means the signal is not continuous — it switches abruptly between two states.
Explanation
A PIR sensor detects sudden changes in infrared radiation in its environment. When movement occurs, the sensor output changes abruptly from LOW to HIGH. Because of this behavior, the output signal is digital, meaning it only has two possible values (0 or 1), rather than a continuous range.
Oscilloscope Observations
When no motion is detected, the oscilloscope shows a constant low signal. When motion is detected, the signal suddenly changes to a high value, creating a sharp transition. These abrupt changes appear as sudden jumps in the signal rather than smooth variations — resulting in noticeable pulses as the signal switches quickly between LOW and HIGH states.
📊 Analog Signal — LDR Sensor
An LDR changes its resistance continuously depending on the amount of light it receives:
Lower resistance → higher voltage in the circuit.
Higher resistance → lower voltage in the circuit.
Because of this, when used in a voltage divider circuit, the output signal is analog — a variable value, not just 0 or 1.
Explanation
An LDR changes its resistance continuously depending on the amount of light. When used in a circuit such as a voltage divider, the output signal is analog — a variable value rather than a binary one. This allows us to detect not just presence/absence of light, but precise intensity levels.
Oscilloscope Observations
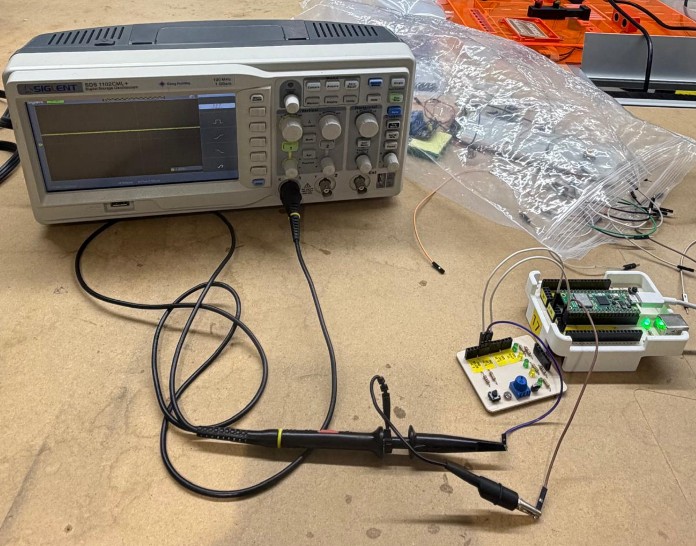
In the first observation, the LDR is connected in the circuit. The oscilloscope shows a signal with approximately one division of voltage — a constant line indicating stable ambient light conditions. The sensor is receiving room light and producing a steady output signal.
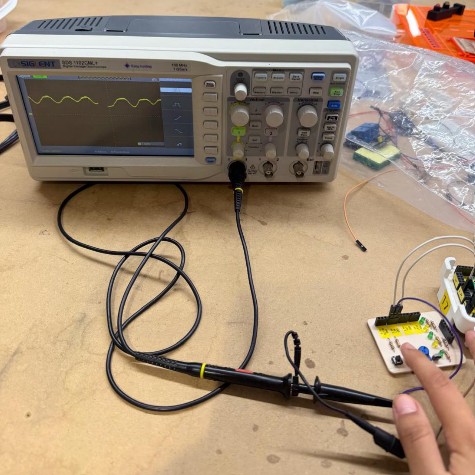
When the sensor is covered, the signal changes. The frequency (Hz) decreases, and if partially covered with a finger, fluctuating waves become visible on the oscilloscope. These waves vary within a certain range depending on how much light is blocked.
Testing Sensors on My Custom PCB
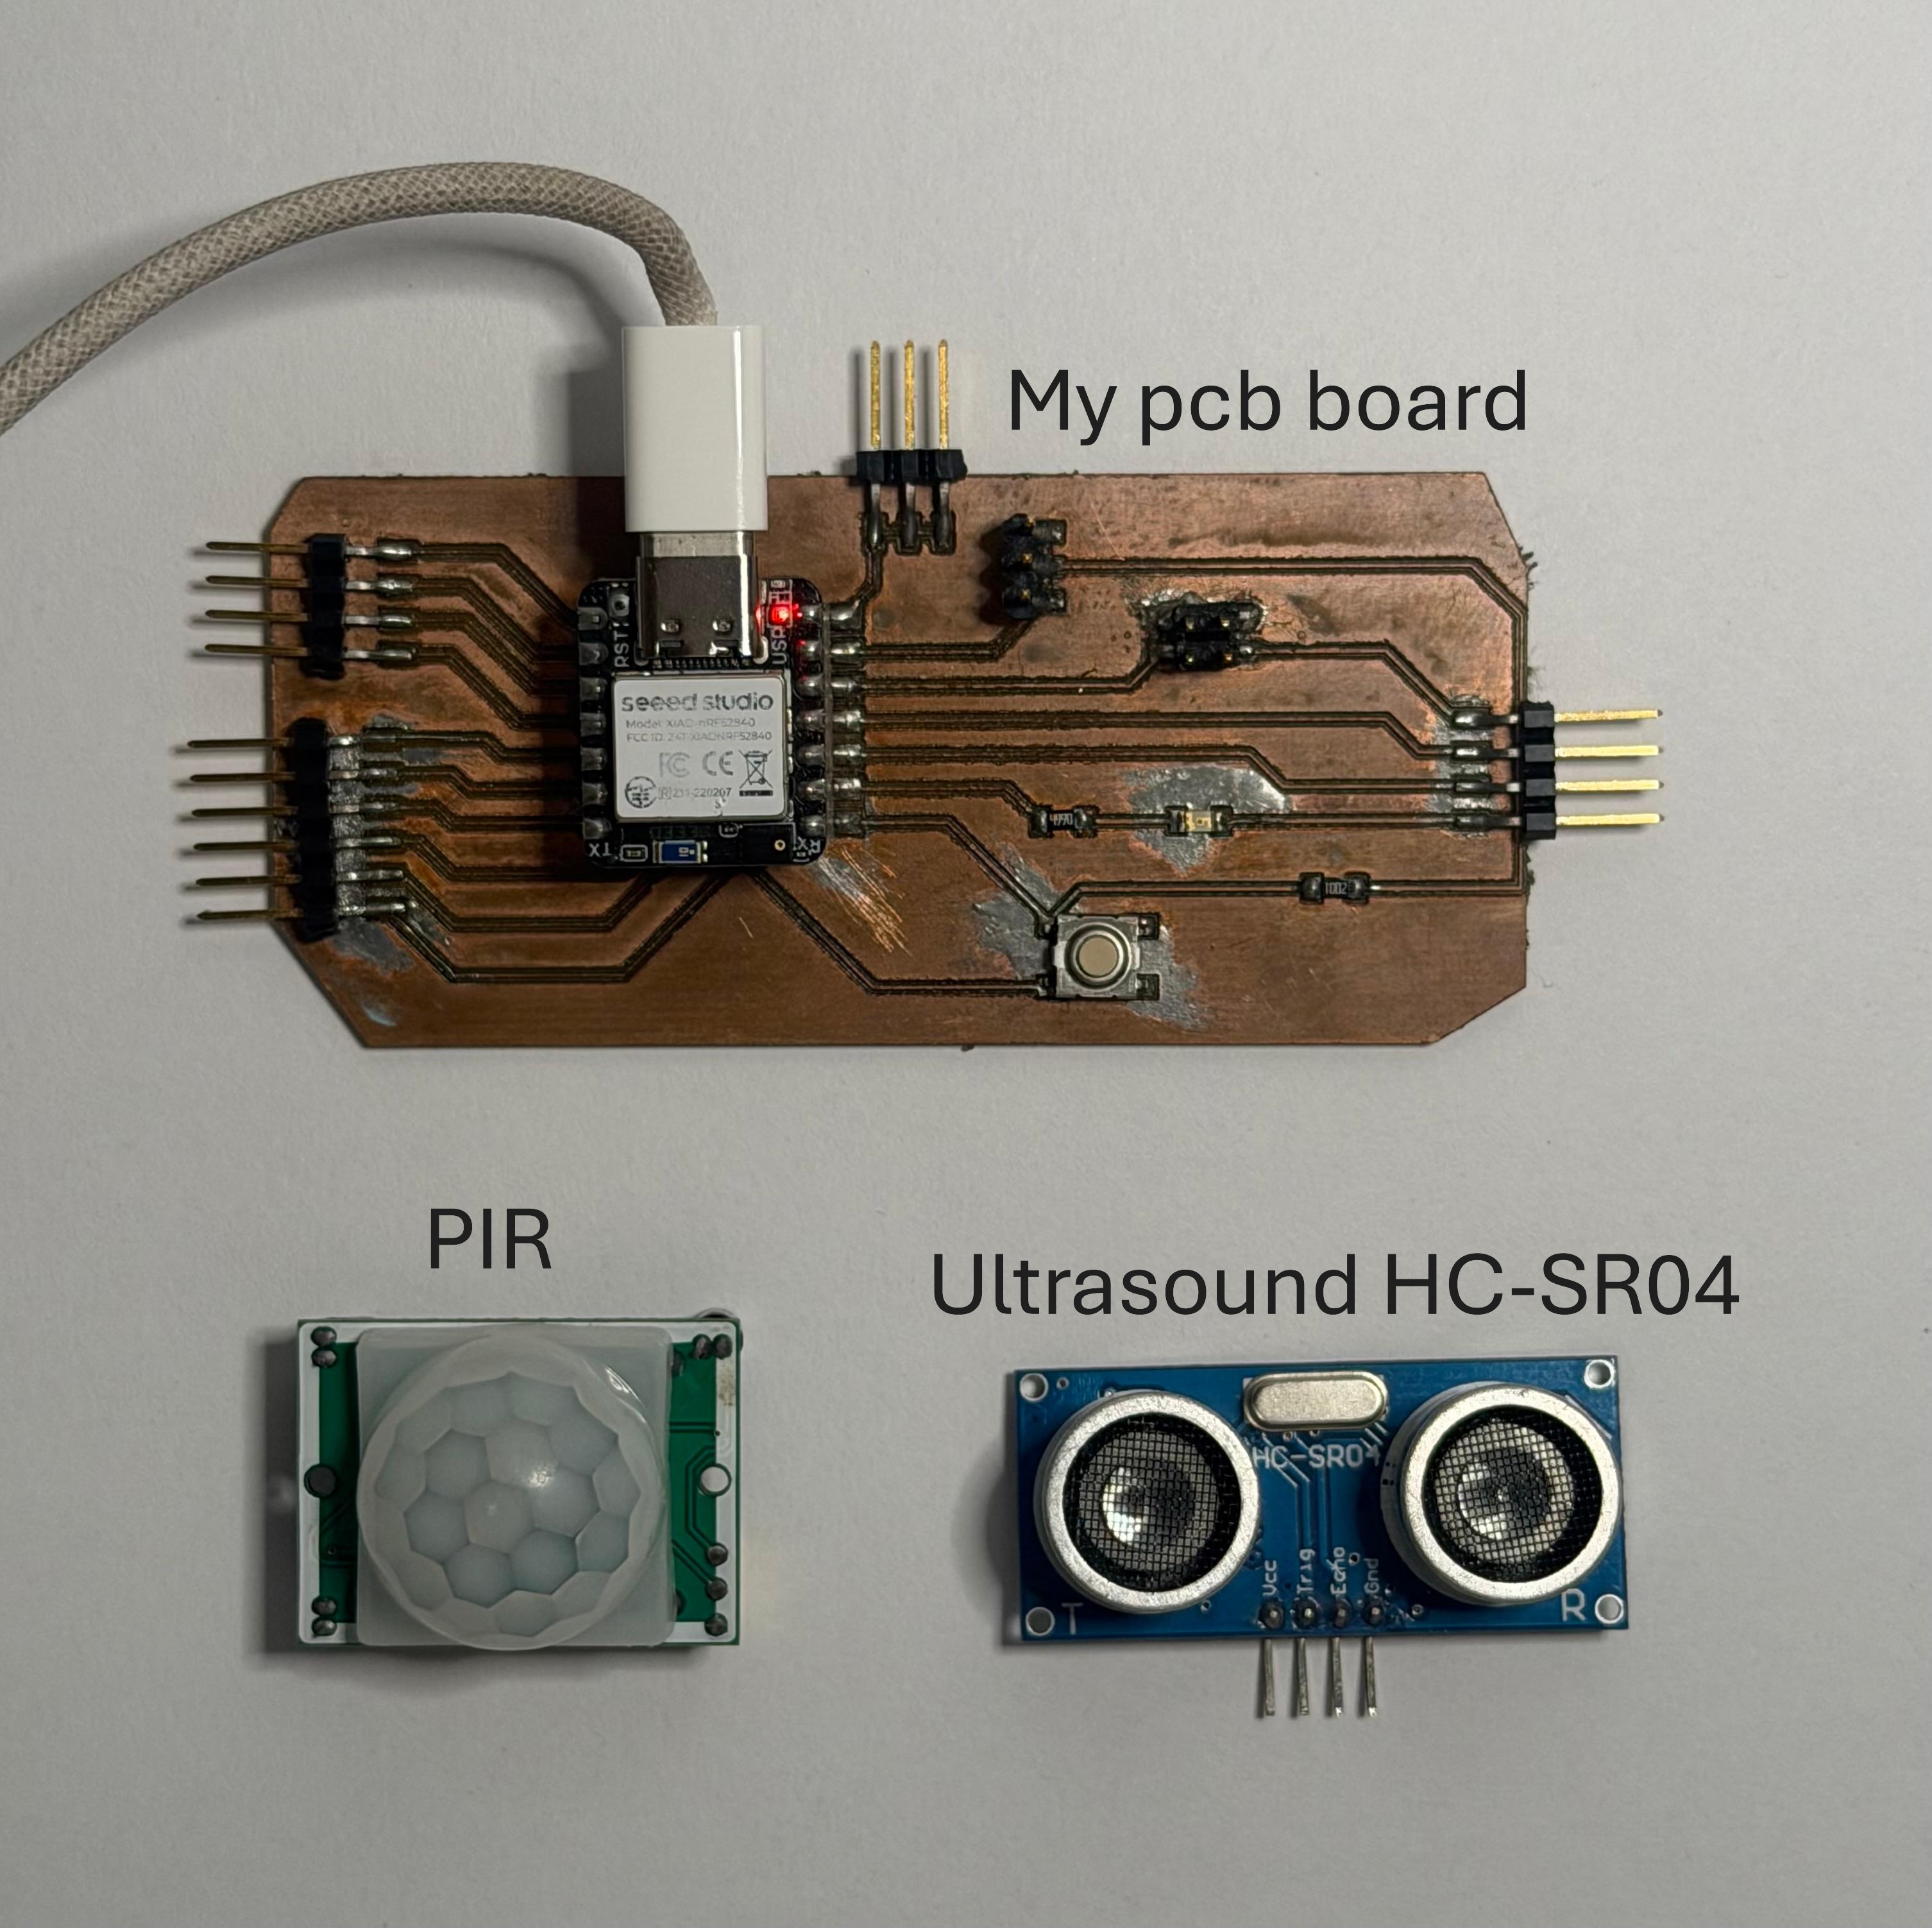
For this week I wanted to put my custom PCB — designed in Week 8: Electronics Production — to the test. I intentionally designed my board with male header extensions for 5V, 3.3V, digital pins, and analog pins so that external sensors could be connected easily.
My plan was to test two sensors that will help with my final project: the HC-SR04 ultrasonic sensor and the PIR sensor. Both will be used to manage the part of my dispenser that detects hand motion to trigger the dispensing mechanism.
At university we had used these sensors with an Arduino Uno and a breadboard — but this time it would be different. Everything would run exclusively through my custom PCB.
Ultrasonic HC-SR04
📡 Sensor Overview
The HC-SR04 detects objects and measures their distance using ultrasound — essentially a sound too high-pitched for humans to hear.
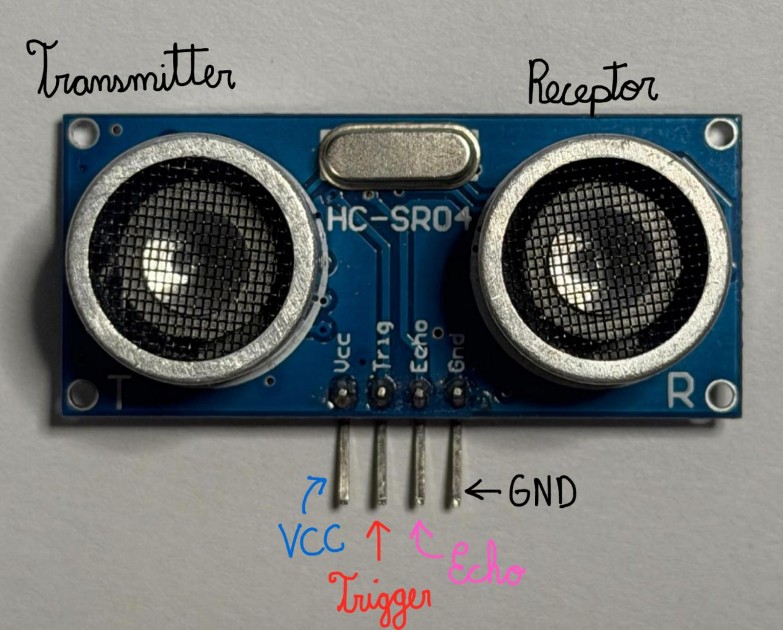
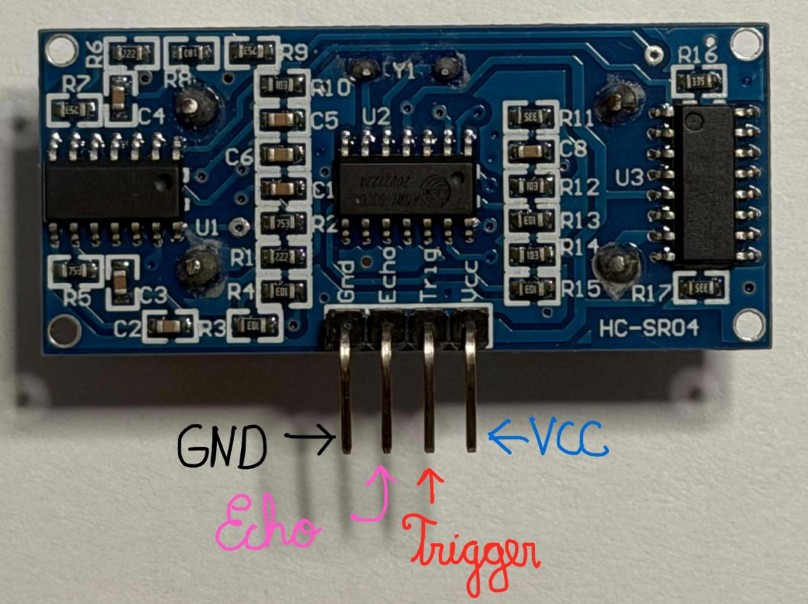
🔌 TRIG vs ECHO — What Each Pin Does
Pull it HIGH for 10 µs and the sensor fires 8 ultrasonic pulses at 40 kHz. That specific 8-pulse pattern lets the receiver distinguish its own signal from random background noise.
Goes HIGH the moment those pulses are fired and drops LOW the instant the reflection returns. The time it stays HIGH is exactly how long the sound took to make the round trip. No reflection? Times out after 38 ms and resets.
📐 How It Works
Everything comes down to one simple idea: sound travels at a known speed, so measuring time gives you distance.
Since the pulse travels to the object and back, divide by 2:
Operation Sequence
- Send a 10 µs HIGH pulse to TRIG.
- Sensor fires 8 ultrasonic bursts at 40 kHz.
- ECHO goes HIGH — the clock starts.
- Reflection arrives → ECHO goes LOW — the clock stops.
- Apply: Distance (cm) = Time (µs) / 58.
📋 Technical Specifications
| Parameter | Value |
|---|---|
| Operating Voltage | 5V DC |
| Standby Current | < 2 mA |
| Working Current | 15 mA |
| Ultrasonic Frequency | 40 kHz |
| Measurement Range | 2 cm — 400 cm |
| Resolution | 0.3 cm (~3 mm) |
| Effective Angle | < 15° |
| Recommended Cycle Period | ≥ 50 ms |
Pinout
| Pin | Name | Function |
|---|---|---|
| 1 | VCC | Power supply — 5V |
| 2 | TRIG | Trigger input — 10 µs pulse |
| 3 | ECHO | Echo output — HIGH duration proportional to distance |
| 4 | GND | Ground |
💻 Program 1: Basic — LED Reacts to Distance
The code defines three pins: TRIG (D9), ECHO (D10), and an LED (D8). In setup, all pins are configured and the LED starts off. In the loop, the TRIG pin sends a 10µs ultrasonic pulse, and the ECHO pin measures how long it takes to bounce back. That time is converted to centimeters using the formula (duration × 0.034) / 2. If the distance is under 10 cm, the LED turns on — otherwise it stays off.
const int TRIG = D9;
const int ECHO = D10;
const int MY_LED = 8;

void setup() {
  pinMode(TRIG, OUTPUT);
  pinMode(ECHO, INPUT);
  pinMode(MY_LED, OUTPUT);
  digitalWrite(MY_LED, LOW); // LED off at start
}

void loop() {
  digitalWrite(TRIG, LOW);
  delayMicroseconds(2);
  digitalWrite(TRIG, HIGH);
  delayMicroseconds(10);
  digitalWrite(TRIG, LOW);

  long duration = pulseIn(ECHO, HIGH);
  float distanceCM = (duration * 0.034) / 2;

  if (distanceCM < 10) {
    digitalWrite(MY_LED, HIGH); // Hand close — LED ON
  } else {
    digitalWrite(MY_LED, LOW);  // No hand — LED OFF
  }
  delay(100);
}
💻 Program 2: Advanced — Serial Monitor with Validation
This version adds Serial communication for real-time distance monitoring on your computer. It includes a separate medirDistancia() function and range validation to filter out invalid readings. The output displays distance with emoji indicators showing whether an object is very close, detected at normal range, or out of range.
PIR Motion Sensor
👁️ Sensor Overview
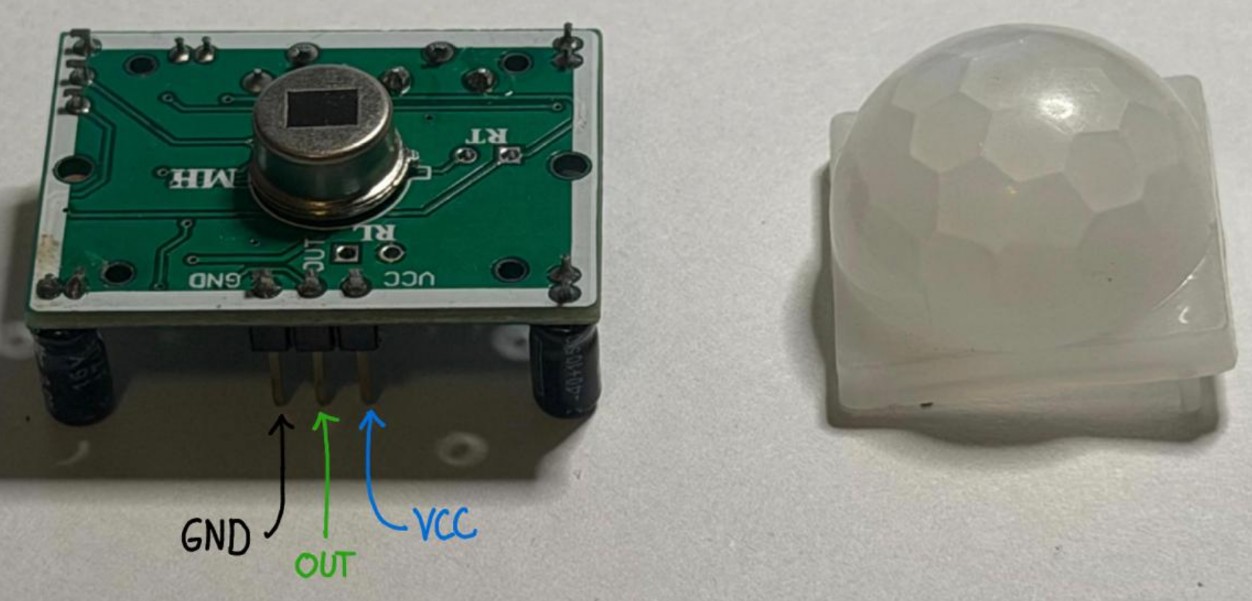
The PIR sensor detects motion by reading the infrared radiation naturally emitted by living beings. When a person enters its field of view, their body heat causes a change in the detected radiation — and that's what triggers the sensor. Field of view: 100°. It only needs 1 digital pin.
🔧 The Two Potentiometers
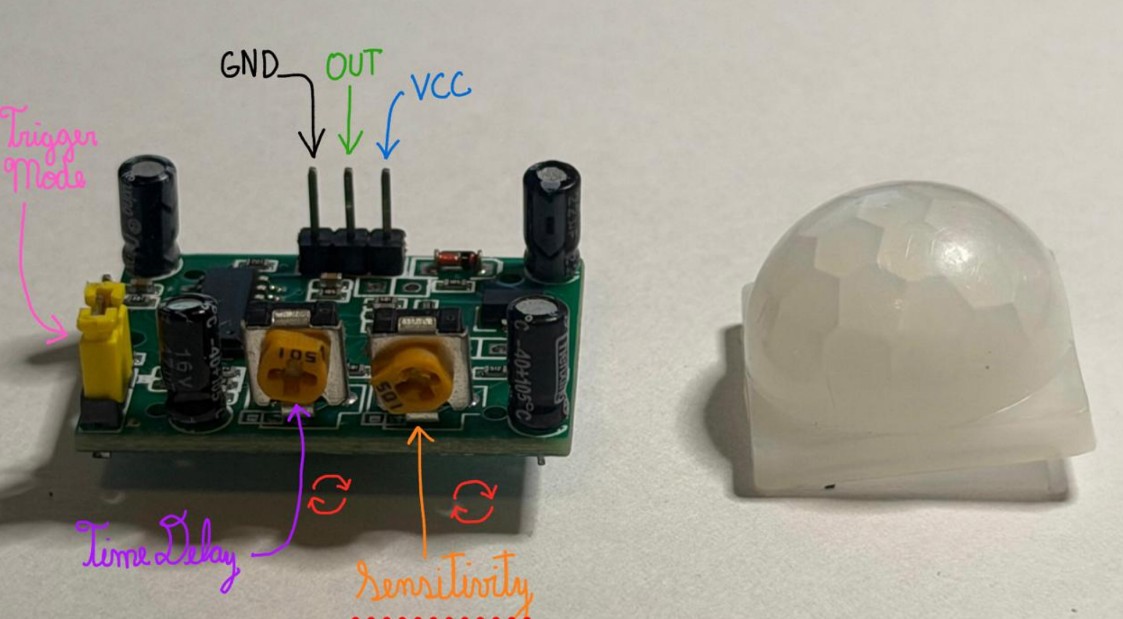
The sensor has two small knobs that let you tune its behavior without touching a single line of code.
Controls how far the sensor can detect motion — from ~3 m (fully counter-clockwise) up to 7 m (fully clockwise). Too much sensitivity causes false triggers from heat vents, pets, or sunlight. Set it to the lowest range that reliably covers your target area.
Controls how long the OUT pin stays HIGH after motion is detected — from ~3–5 seconds up to 5 minutes. For microcontroller projects, turn this fully counter-clockwise and handle all timing in code — it gives much more precise control.
| Potentiometer | Counter-clockwise | Clockwise |
|---|---|---|
| Sensitivity | ~3 m range | ~7 m range |
| Time Delay | ~3–5 seconds | ~5 minutes |
📋 Pinout
| Pin | Name | Function |
|---|---|---|
| 1 | VCC | Power supply — 5V |
| 2 | OUT | Digital output — HIGH when motion detected |
| 3 | GND | Ground |
⚠️ Why the PIR Sensor Didn't Work — Troubleshooting
After investigation, I identified two key issues with help from Gemini, which provided systematic debugging strategies:
PIR sensors have a warm-up period of 30–60 seconds after power-on. During this time, the sensor is calibrating itself to the ambient temperature. Testing immediately after power-on will always fail. After letting the sensor sit powered for a full minute before testing, it worked correctly.
PIR sensors detect changes in heat, not motion itself. If you move your hand very quickly across the sensor in a single sweep, the sensor may not have time to register the temperature change gradient. Slow, deliberate movements work better than quick gestures for reliable detection.
In the code, I added a 2-second delay at startup to ensure the sensor is ready before readings begin. For production code, increase this to 60 seconds for reliable calibration.
The sensitivity knob was set too low. Turning it clockwise to increase sensitivity (3–5 on the dial instead of 1) made the sensor much more responsive to motion within a normal range.
Adding Serial.println() statements in the code lets you see in real-time whether the sensor is detecting motion. This helped confirm that slow, deliberate hand movements trigger the sensor consistently.
💻 Working Program: PIR + Serial Monitor
This program successfully reads the PIR sensor and outputs motion detection events to the Serial Monitor. The LED turns on when motion is detected and off when the room is calm.
#include <Adafruit_TinyUSB.h>

// Pin del sensor PIR
const int PIR = D9;
const int MY_LED = D10;

void setup() {
  pinMode(PIR, INPUT);
  pinMode(MY_LED, OUTPUT);
  digitalWrite(MY_LED, LOW);

  Serial.begin(9600);
  delay(2000); // Wait for sensor warm-up
}

void loop() {
  int motion = digitalRead(PIR);

  if (motion == HIGH) {
    Serial.println("🔴 ¡Movimiento detectado!");
    digitalWrite(MY_LED, HIGH);
  } else {
    Serial.println("🟢 Sin movimiento.");
    digitalWrite(MY_LED, LOW);
  }

  delay(1500);
}
Arduino Code & Documentation
🔊 Ultrasonic HC-SR04 Programs
- HC-SR04 + LED — Simple version (INDIVIDUAL)
- HC-SR04 + Serial Monitor — Advanced with range validation (INDIVIDUAL)