Assignments
Week 9 – Input Devices
Assignment
Group Assignment
- Test an input device's analog levels and digital signals.
Individual Assignment
- Measure something: add a sensor to a microcontroller board that you have designed and read it.
Group Assignment – Signal Analysis
During the group assignment, we analyzed the behavior of an LDR (Light Dependent Resistor) sensor using an oscilloscope. The LDR was connected in a voltage divider configuration with a fixed resistor to GND, so that changes in light intensity would produce a measurable variation in voltage at the midpoint of the divider.
I observed that the analog signal varies continuously depending on light intensity, which helped me clearly differentiate it from digital signals that only switch between discrete values. This experience also showed me that real signals are not perfectly stable, since small fluctuations and noise can affect the waveform.
Overall, this assignment helped me better understand how sensors translate real-world conditions into electrical signals and how this information can be interpreted in embedded systems.
🔗 For more detail on the Group Assignment, visit the official Fab Academy page:
Visit Fab Academy ULima →Analog Signal – LDR Sensor
The LDR was wired in a voltage divider: the sensor connects between VCC and the signal pin, and a fixed resistor connects from the signal pin to GND. As light changes, the LDR resistance changes, shifting the midpoint voltage that the microcontroller reads through the ADC.
As shown in the oscilloscope display, the signal does not remain constant — it presents a continuous waveform confirming that the LDR produces an analog signal.
Experimental setup used to probe the LDR sensor and analyze its signal.
Oscilloscope display showing the analog waveform generated by the LDR sensor.
Voltage Behavior
The oscilloscope allowed us to observe real-time voltage variations from the LDR sensor. Since this is an analog device, the output signal changes continuously instead of switching only between two fixed states.
These variations occur because the resistance of the LDR changes depending on the light intensity. When the sensor is covered or in low light, its resistance increases, producing a higher voltage at the divider midpoint. When exposed to high light or strong brightness, its resistance decreases, causing the voltage to drop.
- Maximum voltage when the sensor is exposed to high light
- Minimum voltage when the sensor is covered or in low light
This behavior demonstrates how the LDR converts changes in light intensity into electrical signals, allowing the microcontroller to interpret variations from the environment.
Individual Assignment
Sensor Selection – Flex Sensor
For this assignment, I used a flex sensor, which is a resistive sensor that changes its resistance value depending on how much it is bent. The more the sensor is flexed, the higher its resistance becomes.
To better understand its behavior, I first measured its resistance directly using a multimeter:
- Straight sensor: 8.99 kΩ
- Bent sensor: 9.71 kΩ
These measurements show that the flex sensor responds to physical deformation by producing a variation in resistance. Although the change is not extremely large, it is enough to be detected through an analog system and later converted into a variable voltage using a voltage divider.
Resistance measurement of the flex sensor in its straight position.
Resistance measurement of the flex sensor while bent.
Circuit Design and Fabrication
Initial Circuit Sketch
Before designing the PCB, I created a simple sketch of the circuit to clearly understand the connections and avoid mistakes. This helped me visualize how the flex sensor would be integrated with a fixed resistor to form a voltage divider.
In this configuration, the flex sensor acts as a variable resistor, while a 10 kΩ resistor is used as a reference connected to ground. The midpoint between both components is connected to the analog input pin, allowing the microcontroller to read a variable voltage.
Hand-drawn sketch of the voltage divider circuit using a flex sensor and a 10 kΩ resistor.
PCB Design in Fusion 360
After validating the circuit concept, I designed the PCB using Autodesk Fusion Electronics. In this stage, I translated the electronic schematic into a physical PCB layout, defining the traces for power (VCC), ground (GND), and the signal line connected to the analog input.
The schematic includes two external headers: one for the flex sensor connection and another for the LED indicator module. A 10 kΩ resistor was added as part of the voltage divider configuration to stabilize the analog signal read by the microcontroller.
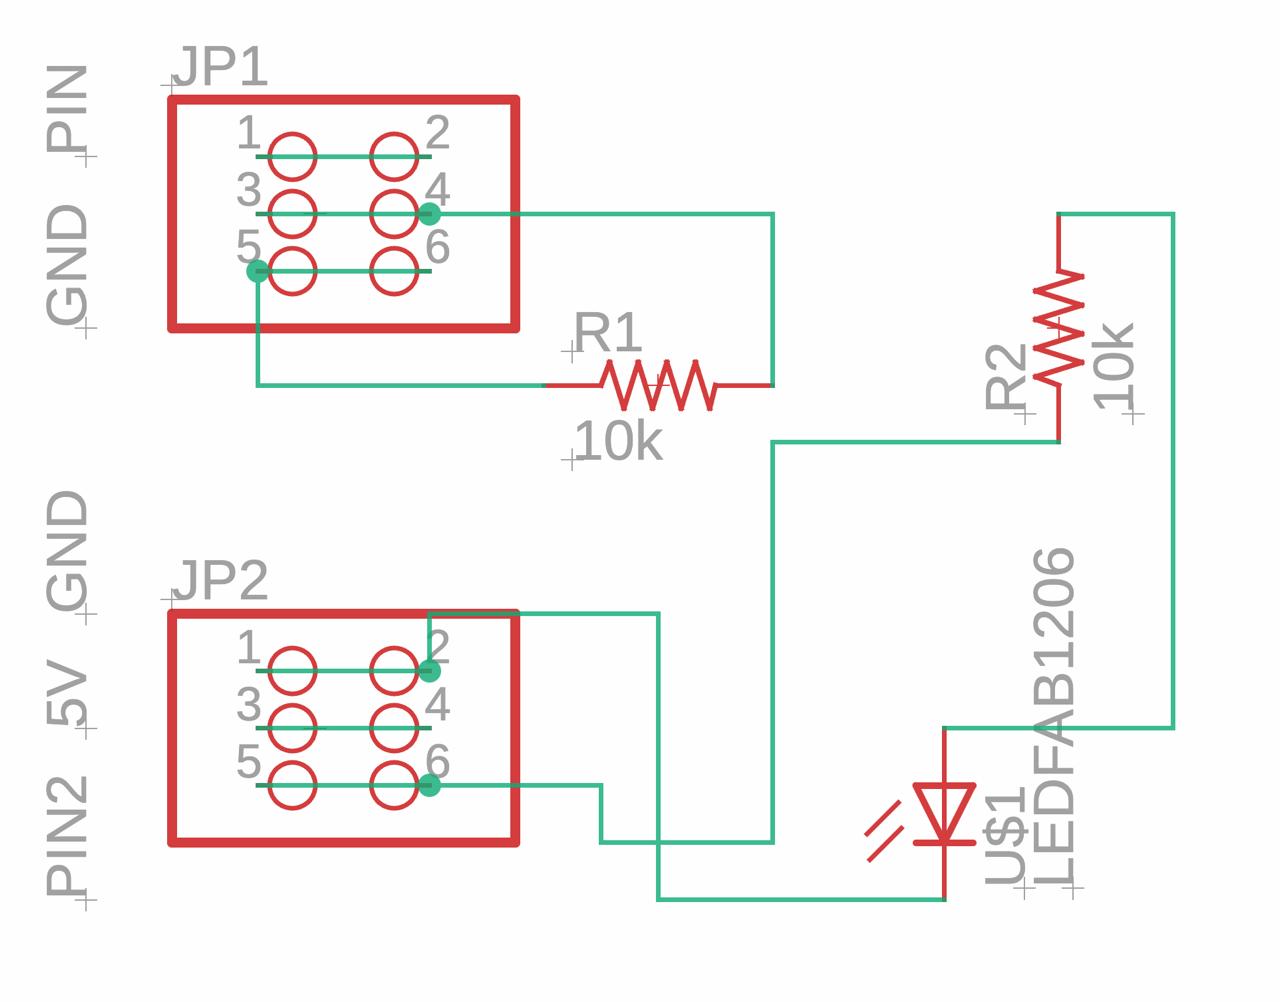
Schematic design showing the flex sensor connector, LED indicator, and voltage divider configuration.
Pull-Down Resistor and Voltage Divider Configuration
The 10 kΩ resistor acts as a pull-down resistor connected to GND. When the button is not pressed, the input pin reads LOW (0V). When the button is pressed, 5V is applied to the signal line, causing the microcontroller to detect a HIGH signal. This configuration helps stabilize the digital input signal and prevents floating voltage values caused by electrical noise.
PCB layout designed in Fusion 360, showing the voltage divider configuration and connections.
Fabrication and Assembly
Once the design was completed, the PCB was manufactured using the Roland milling machine. After milling, the components were soldered onto the board, including the 10 kΩ resistor and the connectors required for the flex sensor and microcontroller.
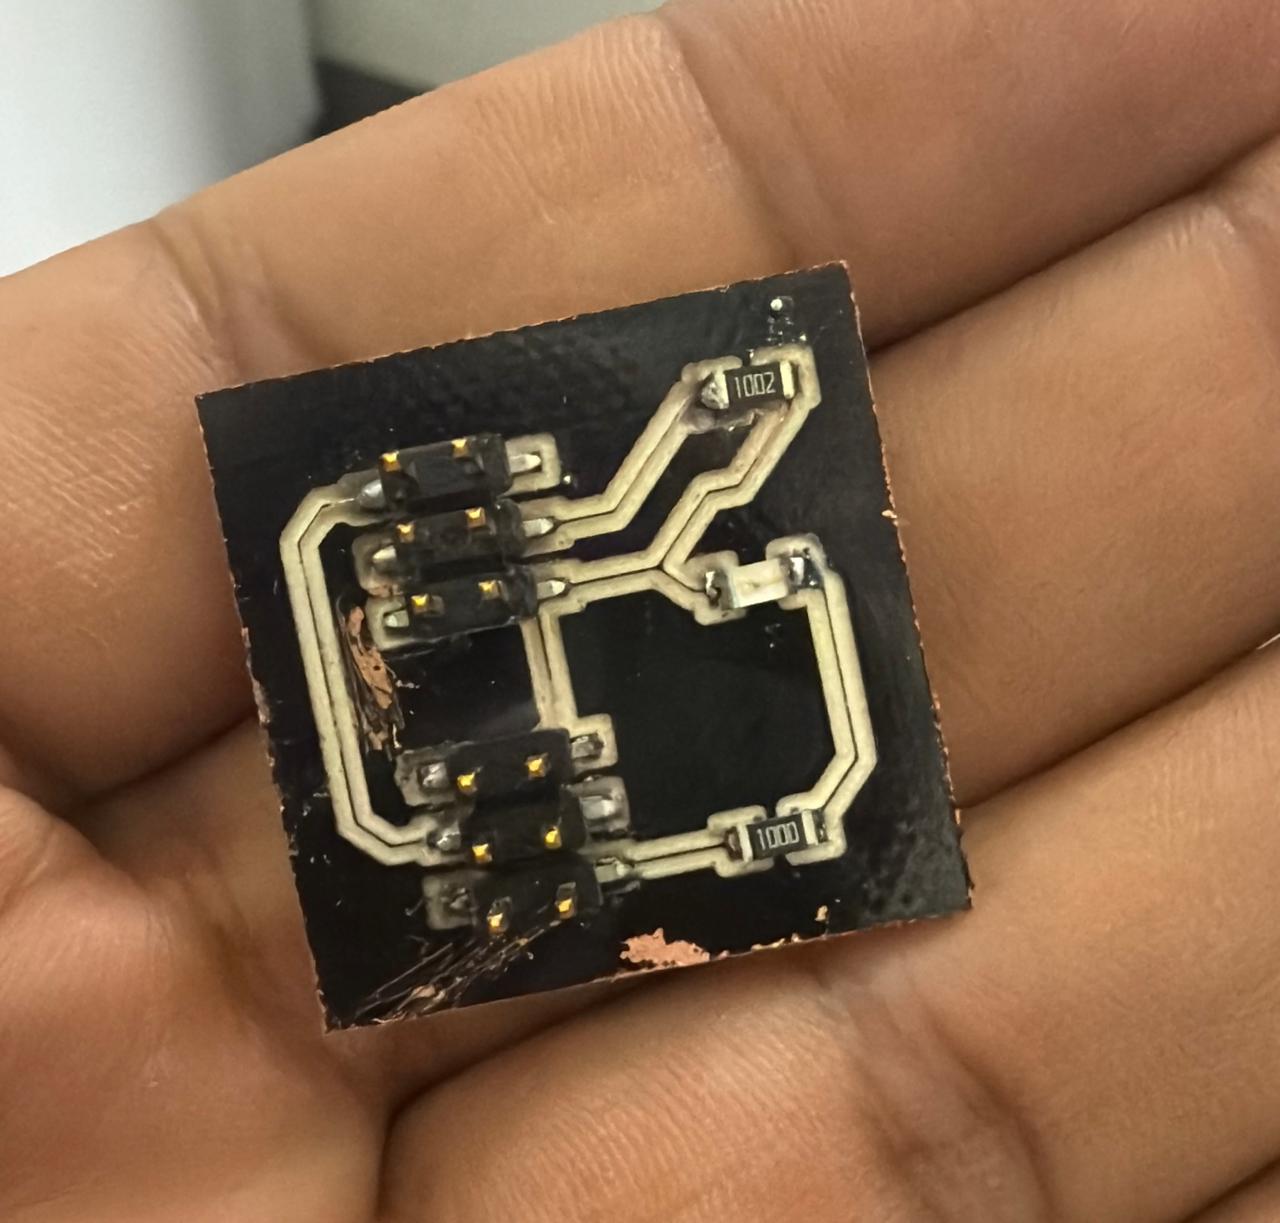
Milled and assembled PCB with components soldered.
Finally, I decided to give the board a more aesthetic finish by painting it black, improving its overall appearance and giving it a more professional look.
Testing and Results
For these tests, I used a XIAO nRF52840 board connected to a voltage divider circuit with a flex sensor. The setup includes an additional test board with an LED indicator to confirm proper operation, as well as extra pins for future applications such as connecting a servomotor.
The flex sensor was connected as an analog input using a voltage divider configuration. As the sensor bends, its resistance changes, producing different voltage levels that can be read by the microcontroller through the ADC.
Flex Sensor Test Code
const int flexPin = A0;

float vref  = 3.3;
int   adcMax = 4095;

void setup() {
  Serial.begin(115200);
  Serial.println("Flex Sensor Reading");
}

void loop() {
  // Read sensor value
  int rawValue = analogRead(flexPin);

  // Convert ADC value to voltage
  float voltage = (rawValue * vref) / adcMax;

  // Display data
  Serial.print("Raw: ");
  Serial.print(rawValue);
  Serial.print(" | Voltage: ");
  Serial.print(voltage, 5);
  Serial.println(" V");

  delay(200);
}
During testing, the Serial Monitor displayed different voltage values depending on the flex sensor deformation. When the sensor was bent, the resistance increased, generating a higher analog reading.
Physical connection of the XIAO nRF52840 and the test board used for the voltage divider setup.
Additional view of the test setup, including the indicator LED and extra pins for future use.
When the flex sensor is bent, its resistance increases, causing a change in the output voltage observable in the Serial Monitor. When straight, the values remain more stable.
Sensor readings in the Serial Monitor while the flex sensor is bent.
Sensor readings in the Serial Monitor while the flex sensor remains straight.
The variation was also observed in the Serial Plotter, where the analog signal changes in real time. The graph shows more variation when the sensor is bent and remains more stable when it is straight, confirming that the system correctly converts changes in resistance into a readable voltage for the microcontroller.
Serial Plotter showing signal variation when the flex sensor is bent.
Serial Plotter showing a more stable signal when the flex sensor is straight.
Final Project Idea
My final project is based on a wearable glove with flex sensors, where each finger acts as an input. When a finger bends, the sensor changes its resistance, which is converted into a voltage and read by the microcontroller.
Concept of the final project: each finger movement controls a tentacle based on flex sensor readings.
Each finger will control a tentacle of a soft robotic structure, meaning that the movement of the hand will be directly translated into mechanical motion. By mapping the sensor values into ranges, the system will allow smooth and responsive control instead of simple on/off behavior.
Project Downloads
Download all files related to this week's work: