Assignments
Assignment
Group assignment
- Compare as many tool options as possible.
Individual assignment
- Write an application that interfaces a user with an input &/or output device that you made.
Summary - Group Assignment
In the group assignment, we explored different communication technologies using the Seeeduino ESP32-C3 platform. The objective was to understand how wireless communication protocols can be implemented for real-time data transmission and visualization.
We worked with WebSocket communication, Wi-Fi connectivity, and browser-based interfaces to transmit sensor information between the ESP32-C3 and a web application. During the process, we tested real-time communication, serial monitoring, and wireless data visualization.
Through these experiments, we were able to analyze communication stability, response speed, debugging methods, and the integration between hardware and modern web technologies such as JavaScript and Shadcn UI.
🔗 For more detail on the Group Assignment, visit the official Fab Academy page:
Visit Fab Academy ULima →| Feature | MIT App Inventor | Python + Tkinter | Python Serial Monitoring | WebSocket + JavaScript |
|---|---|---|---|---|
| Interface Type | Mobile application | Desktop graphical interface | Terminal / serial interface | Browser-based web interface |
| Communication | Bluetooth / Wi-Fi | USB Serial | USB Serial | WebSocket over Wi-Fi |
| Visualization | Mobile UI components | Desktop widgets and windows | Text-based monitoring | Animated real-time radar |
| Real-Time Performance | Moderate | Fast local communication | Fast debugging response | High-speed bidirectional |
| Ease of Development | Beginner-friendly | Intermediate | Easy | Medium / High complexity |
| Wireless Capability | Yes | No | No | Yes |
MIT App Inventor
01 Design a mobile interface using drag-and-drop components and visual blocks.
02 Configure Bluetooth or Wi-Fi communication to receive sensor values.
03 Display radar information dynamically on the smartphone interface.
04 Test the application directly on the mobile device in real time.
Python + Tkinter
01 Create graphical windows and interface widgets using Tkinter.
02 Establish serial communication between the ESP32-C3 and Python.
03 Process sensor values dynamically and update the desktop interface.
04 Visualize the radar information in real time on the computer.
Python Serial Monitoring
01 Open the COM serial port and establish communication with the ESP32-C3.
02 Read ultrasonic sensor values continuously through the serial monitor.
03 Analyze hardware behavior and communication stability during testing.
04 Debug sensor transmission, calibration, and data consistency.
WebSocket + JavaScript
01 ESP32-C3 transmits sensor values wirelessly using Wi-Fi communication.
02 WebSocket updates radar information continuously in real time.
03 JavaScript processes the incoming data and generates animations.
04 The browser updates the radar visualization dynamically and interactively.
Technology Evaluation
During the development of the ESP32-C3 radar system, different communication and visualization technologies were explored in order to achieve real-time monitoring and interactive visualization. The project mainly used WebSocket communication with a JavaScript interface, while Python serial monitoring was used during debugging and testing stages.
WebSocket Communication and JavaScript Interface
WebSocket communication was implemented to establish a real-time connection between the Seeeduino ESP32-C3 and the browser-based radar interface. This technology enabled continuous transmission of ultrasonic sensor values while updating the radar visualization dynamically through JavaScript and Shadcn UI components.
Advantages:
- Real-time communication: WebSocket allows bidirectional communication between the ESP32-C3 and the web application. Sensor values are transmitted instantly without requiring constant page refreshes.
- Wireless monitoring: Since the ESP32-C3 contains integrated Wi-Fi, the radar system can be monitored wirelessly from any device on the same network.
- Dynamic visualization: JavaScript made it possible to create animated radar graphics capable of displaying angle movement and distance detection in real time.
- Modern user interface: Shadcn UI components improved the organization and visual appearance of the project interface.
- Scalability: WebSocket communication can support multiple connected clients simultaneously.
Disadvantages:
- Wi-Fi dependency: The radar system depends on a stable 2.4 GHz Wi-Fi connection. Communication interruptions may occur if the network signal becomes unstable.
- Complex debugging process: Troubleshooting WebSocket required verifying IP addresses, ports, Wi-Fi credentials, and browser connections simultaneously.
- Library compatibility issues: Some ESP32 libraries generated compatibility conflicts, especially when combining WebSocket with servo control libraries.
- Higher implementation complexity: Combining ESP32 programming, WebSocket servers, JavaScript visualization, and UI frameworks introduced additional configuration layers.
- Browser dependency: The radar visualization requires a compatible browser environment to properly display animations.
Python Serial Monitoring
Python was explored as an alternative method for serial communication and debugging during the development process. It allowed direct reading of sensor values from the ESP32-C3 through the serial port and simplified initial testing before implementing the WebSocket interface.
Advantages:
- Simple implementation: Python serial communication requires fewer configuration steps compared to WebSocket systems.
- Efficient debugging: Using Python and the serial monitor helped identify hardware and communication problems quickly during testing.
- Fast data monitoring: Sensor values can be visualized directly in real time through the serial port without requiring web servers.
- Extensive documentation: Python provides large amounts of tutorials, libraries, and online resources.
- Flexible data processing: Python enables additional possibilities for future data analysis and storage.
Disadvantages:
- Wired communication: Python serial monitoring depends on a physical USB connection, limiting portability and wireless operation.
- Limited graphical visualization: Compared to JavaScript web interfaces, serial monitoring provides less interactive visualization methods.
- Lower scalability: Serial communication is generally limited to one direct device connection.
- Reduced accessibility: Monitoring through Python usually requires the development environment to remain open.
- Additional software installation: Python environments and libraries must be installed and configured before communication can be established.
In conclusion, both technologies provided important contributions. Python serial communication simplified early debugging, while WebSocket combined with JavaScript enabled a more advanced and interactive real-time radar visualization platform.
Individual Assignment
For Week 14, I developed a complete real-time wireless radar system. It has two parts that work together: an ESP32-C3 microcontroller with an ultrasonic sensor and servo motor that scans the physical space, and a web application built in React that receives the data via WebSocket and renders it as a live radar display. Both sides were built and documented from scratch.
Interactive demo, move the cursor inside the radar to simulate a detection ping.
How the System Works
The system is split into two independent parts that communicate wirelessly. The ESP32-C3 is the hardware side: it rotates a servo motor, reads distances with the HC-SR04 sensor at each angle, and broadcasts that data over WebSocket. The React web app is the software side: it connects to the ESP32 over Wi-Fi, receives the JSON packets, and draws them on a canvas radar in real time.
SYSTEM FLOW
HC-SR04 sensor
    reads distance
         |
    ESP32-C3
    rotates servo 0°→180°→0°
    sends JSON over WebSocket port 81
         |
    Wi-Fi network
         |
    React web app (browser)
    WebSocketRadarAdapter receives JSON
    useRadar hook stores points by angle
    RadarDisplay canvas draws sweep + blips
Hardware, ESP32-C3 Firmware
The ESP32-C3 connects to Wi-Fi, starts a WebSocket server on port 81, and then runs a loop that sweeps the servo from 0 to 180 degrees and back. At every degree, it fires the ultrasonic sensor and broadcasts the result as a JSON packet.
Pin configuration
#define PIN_TRIG  7    // HC-SR04 trigger
#define PIN_ECHO  8    // HC-SR04 echo
#define PIN_SERVO 10   // Servo signal
JSON packet sent by the ESP32
Every WebSocket message has this exact format. The web app expects both fields to be numbers or it ignores the packet.
{
  "angle": 92,
  "distance": 143.7
}
Distance reading function
The HC-SR04 sends a 10 microsecond pulse and measures how long the echo takes to return. Dividing by 2 and multiplying by 0.034 gives centimeters. If no echo returns within 30 ms, the sensor returns 400 cm (out of range).
long readDistance() {
  digitalWrite(PIN_TRIG, LOW);
  delayMicroseconds(2);
  digitalWrite(PIN_TRIG, HIGH);
  delayMicroseconds(10);
  digitalWrite(PIN_TRIG, LOW);
  long duration = pulseIn(PIN_ECHO, HIGH, 30000);
  long distance = duration * 0.034 / 2;
  return (distance == 0) ? 400 : distance;
}
Broadcast function
ArduinoJson serializes the angle and distance into a JSON string and WebSocketsServer broadcasts it to all connected clients.
void broadcastRadarData(int angle, long distance) {
  StaticJsonDocument<128> doc;
  doc["angle"]    = angle;
  doc["distance"] = distance;
  String json;
  serializeJson(doc, json);
  webSocket.broadcastTXT(json);
}
Main loop
The loop keeps WebSocket alive, writes the current angle to the servo, waits 30 ms for it to settle, reads the distance, broadcasts it, then moves to the next angle. When it reaches 180 or 0 it reverses direction, creating a continuous back-and-forth sweep.
void loop() {
  webSocket.loop();           // keep WS server alive
  radarServo.write(currentAngle);
  delay(30);                  // wait for servo to settle

  long distance = readDistance();
  broadcastRadarData(currentAngle, distance);

  currentAngle += stepDirection;
  if (currentAngle >= 180 || currentAngle <= 0) {
    stepDirection = -stepDirection;  // reverse sweep
  }
}
Libraries required
#include <WiFi.h>
#include <WebSocketsServer.h>
#include <ArduinoJson.h>
#include <ESP32Servo.h>
Complete firmware
#include <WiFi.h>
#include <WebSocketsServer.h>
#include <ArduinoJson.h>
#include <ESP32Servo.h>

const char* WIFI_SSID = "YOUR_SSID";
const char* WIFI_PASS = "YOUR_PASSWORD";

#define PIN_TRIG  7
#define PIN_ECHO  8
#define PIN_SERVO 10

WebSocketsServer webSocket = WebSocketsServer(81);
Servo radarServo;
int currentAngle  = 0;
int stepDirection = 1;

long readDistance() {
  digitalWrite(PIN_TRIG, LOW);  delayMicroseconds(2);
  digitalWrite(PIN_TRIG, HIGH); delayMicroseconds(10);
  digitalWrite(PIN_TRIG, LOW);
  long duration = pulseIn(PIN_ECHO, HIGH, 30000);
  long distance  = duration * 0.034 / 2;
  return (distance == 0) ? 400 : distance;
}

void broadcastRadarData(int angle, long distance) {
  StaticJsonDocument<128> doc;
  doc["angle"]    = angle;
  doc["distance"] = distance;
  String json;
  serializeJson(doc, json);
  webSocket.broadcastTXT(json);
}

void setup() {
  Serial.begin(115200);
  pinMode(PIN_TRIG, OUTPUT);
  pinMode(PIN_ECHO, INPUT);
  radarServo.attach(PIN_SERVO);
  WiFi.begin(WIFI_SSID, WIFI_PASS);
  while (WiFi.status() != WL_CONNECTED) { delay(500); Serial.print("."); }
  Serial.println("\nConnected: " + WiFi.localIP().toString());
  webSocket.begin();
}

void loop() {
  webSocket.loop();
  radarServo.write(currentAngle);
  delay(30);
  broadcastRadarData(currentAngle, readDistance());
  currentAngle += stepDirection;
  if (currentAngle >= 180 || currentAngle <= 0) stepDirection = -stepDirection;
}
Hardware Setup
src="assets/Week14/radar_hardware.jpg"
Software, React Web Application
The web app is built with TanStack Start (React + Vite), TypeScript, and Tailwind CSS. It lives at github.com/fabzio/radar-esp. The architecture uses the Adapter pattern to separate the data source from the visualization, which means you can run it in mock mode without any hardware connected.
How to run it
# Install dependencies
bun install

# Start development server
bun run dev

# Open in browser
http://localhost:3000
Connecting to the ESP32
Once the app is running, go to the Settings tab, enter the WebSocket URL of the ESP32 (the IP address printed in the Serial Monitor after connecting to Wi-Fi), and click Save. The app connects immediately and starts drawing.
// Enter this in the Settings tab:
ws://192.168.x.x:81

// The ESP32 prints its IP to Serial Monitor:
// Connected: 192.168.1.105  <-- use this
Mock mode
If you don't have the hardware ready, enable Mock data mode in Settings. The MockRadarAdapter generates simulated distance points using a sine wave so you can test the visualization without the ESP32.
// MockRadarAdapter — generates fake data every 50ms
connect(_url, onData) {
  this.interval = setInterval(() => {
    this.currentAngle = (this.currentAngle + 2) % 360;
    const baseDistance = 150;
    const noise = Math.sin(this.currentAngle * (Math.PI/180) * 5) * 50;
    onData({
      angle: this.currentAngle,
      distance: baseDistance + noise + Math.random() * 10,
      timestamp: Date.now()
    });
  }, 50);
}
Code Architecture
The project is organized around three main files that separate responsibilities clearly.
types.ts, data contract
Defines the shape of every radar point and the interface that all adapters must implement. Any data source, real or simulated, must produce RadarPoint objects.
// Every reading from the sensor becomes a RadarPoint
export interface RadarPoint {
  angle: number;     // 0–359 degrees
  distance: number;  // distance in cm
  timestamp: number;
}

// Any adapter (WebSocket or Mock) must implement this
export interface RadarAdapter {
  connect(url: string, onData: (point: RadarPoint) => void): void;
  disconnect(): void;
}
adapters.ts, two data sources
WebSocketRadarAdapter connects to the real ESP32. It opens a WebSocket connection, validates that each incoming message has numeric angle and distance fields, and calls onData with the parsed point. MockRadarAdapter uses setInterval to generate fake points at 50ms intervals without any network connection.
// Real hardware: connects to ESP32 WebSocket server
export class WebSocketRadarAdapter implements RadarAdapter {
  private socket: WebSocket | null = null;

  connect(url: string, onData: (point: RadarPoint) => void) {
    this.socket = new WebSocket(url);
    this.socket.onmessage = (event) => {
      const data = JSON.parse(event.data);
      // Validates both fields are numbers before accepting
      if (typeof data.angle === "number" && typeof data.distance === "number") {
        onData({ angle: data.angle, distance: data.distance, timestamp: Date.now() });
      }
    };
  }

  disconnect() {
    this.socket?.close();
    this.socket = null;
  }
}
useRadar.ts, state management hook
This React hook manages the radar state. It stores one point per angle degree (0–359) using a ref object as a map. When a new point arrives at angle 92, it replaces the previous reading at that angle. This means the radar always shows the most recent scan of the full 360 degrees rather than accumulating duplicate readings.
export function useRadar(adapter: RadarAdapter, url: string) {
  const [points, setPoints] = useState<RadarPoint[]>([]);
  const [currentPoint, setCurrentPoint] = useState<RadarPoint | null>(null);
  const pointsRef = useRef<Record<number, RadarPoint>>({});

  const handleData = useCallback((point: RadarPoint) => {
    const angle = Math.round(point.angle) % 360;
    pointsRef.current[angle] = point;  // one reading per degree
    setCurrentPoint(point);            // drives the sweep line
    setPoints(Object.values(pointsRef.current));
  }, []);

  useEffect(() => {
    if (!url) return;
    adapter.connect(url, handleData);
    return () => adapter.disconnect();  // cleanup on unmount
  }, [adapter, url, handleData]);

  const clear = useCallback(() => {
    pointsRef.current = {};
    setPoints([]);
  }, []);

  return { points, currentPoint, clear };
}
RadarDisplay.tsx, canvas renderer
The RadarDisplay component draws everything on an HTML5 canvas. It renders the dark background, concentric grid rings every quarter of the max distance, radial lines every 30 degrees, a green dot at the position of each stored point, and a rotating sweep line pointing at the current angle with a conic gradient trail behind it.
// Points are drawn as small green dots at their polar coordinates
for (const p of points) {
  const rad    = ((p.angle - 90) * Math.PI) / 180;  // 0° = top
  const d      = Math.min(p.distance, maxDistance);
  const distPx = (d / maxDistance) * radius;         // scale to canvas
  const x = centerX + Math.cos(rad) * distPx;
  const y = centerY + Math.sin(rad) * distPx;
  ctx.fillStyle = "#00ff00";
  ctx.beginPath();
  ctx.arc(x, y, 2, 0, Math.PI * 2);
  ctx.fill();
}

// Sweep line follows the most recent angle
const rad = ((currentPoint.angle - 90) * Math.PI) / 180;
ctx.strokeStyle = "rgba(0,255,0,0.5)";
ctx.beginPath();
ctx.moveTo(centerX, centerY);
ctx.lineTo(centerX + Math.cos(rad) * radius, centerY + Math.sin(rad) * radius);
ctx.stroke();
Project structure
radar-esp/
├── src/
│   ├── components/
│   │   └── radar/
│   │       └── RadarDisplay.tsx   canvas renderer
│   ├── hooks/
│   │   └── useRadar.ts            state management
│   └── lib/
│       └── radar/
│           ├── adapters.ts        WebSocket + Mock adapters
│           └── types.ts           RadarPoint + RadarAdapter interfaces
├── public/
├── package.json                   bun + TanStack Start
└── README.md
Web Interface Screenshots
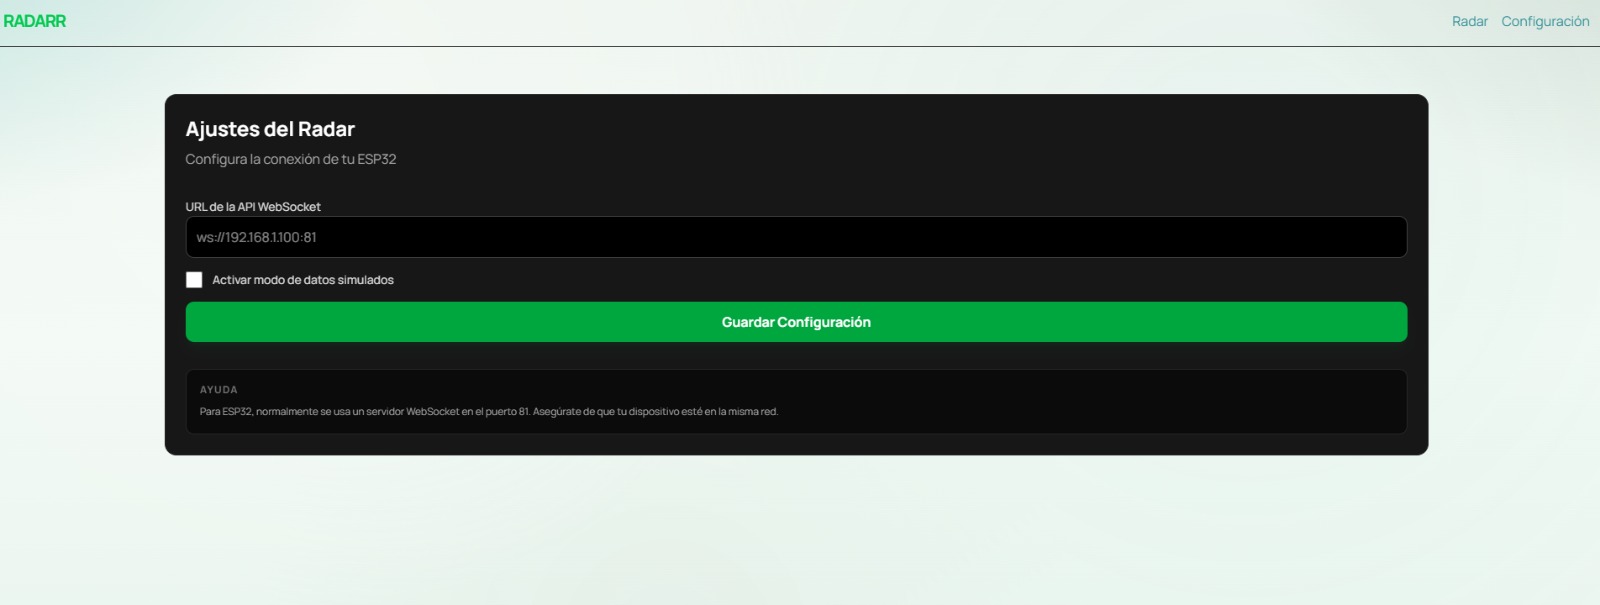
The first screenshot shows the Settings tab of the RADARR application.
Here the WebSocket URL of the ESP32-C3 is configured (ws://192.168.1.100:81),
where the IP address corresponds to the one printed by the ESP32 in the Serial Monitor
after connecting to Wi-Fi. The Mock data mode checkbox allows testing the radar
visualization without any hardware connected.
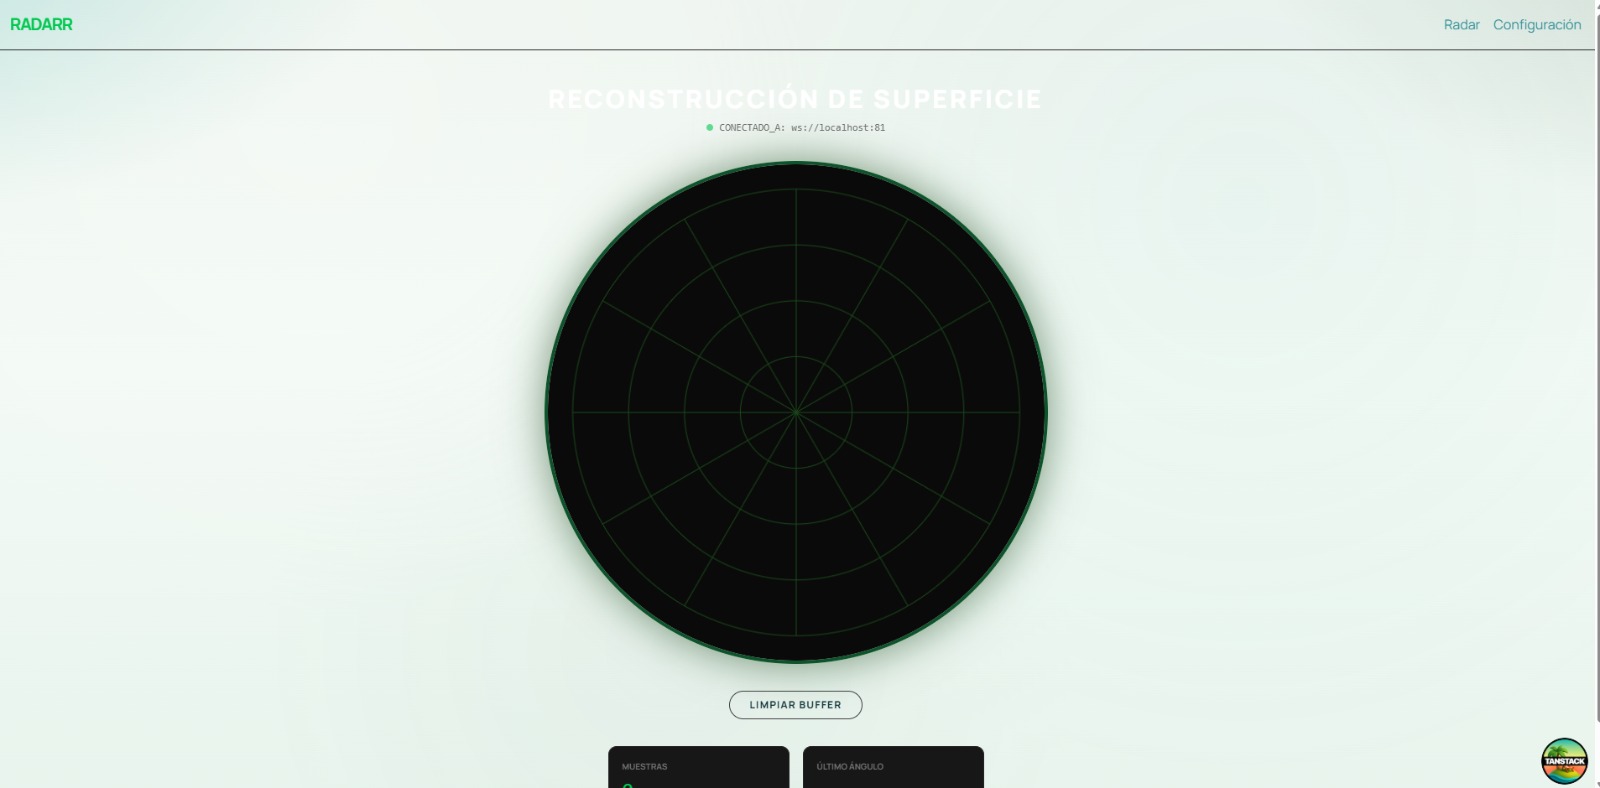
The second screenshot shows the Radar tab after saving the configuration.
The application displays the status CONNECTED TO: ws://localhost:81 at the top,
confirming that the WebSocket connection was established successfully. The green polar grid
is rendered on the canvas and the system is waiting to receive the first distance
readings from the ESP32-C3.
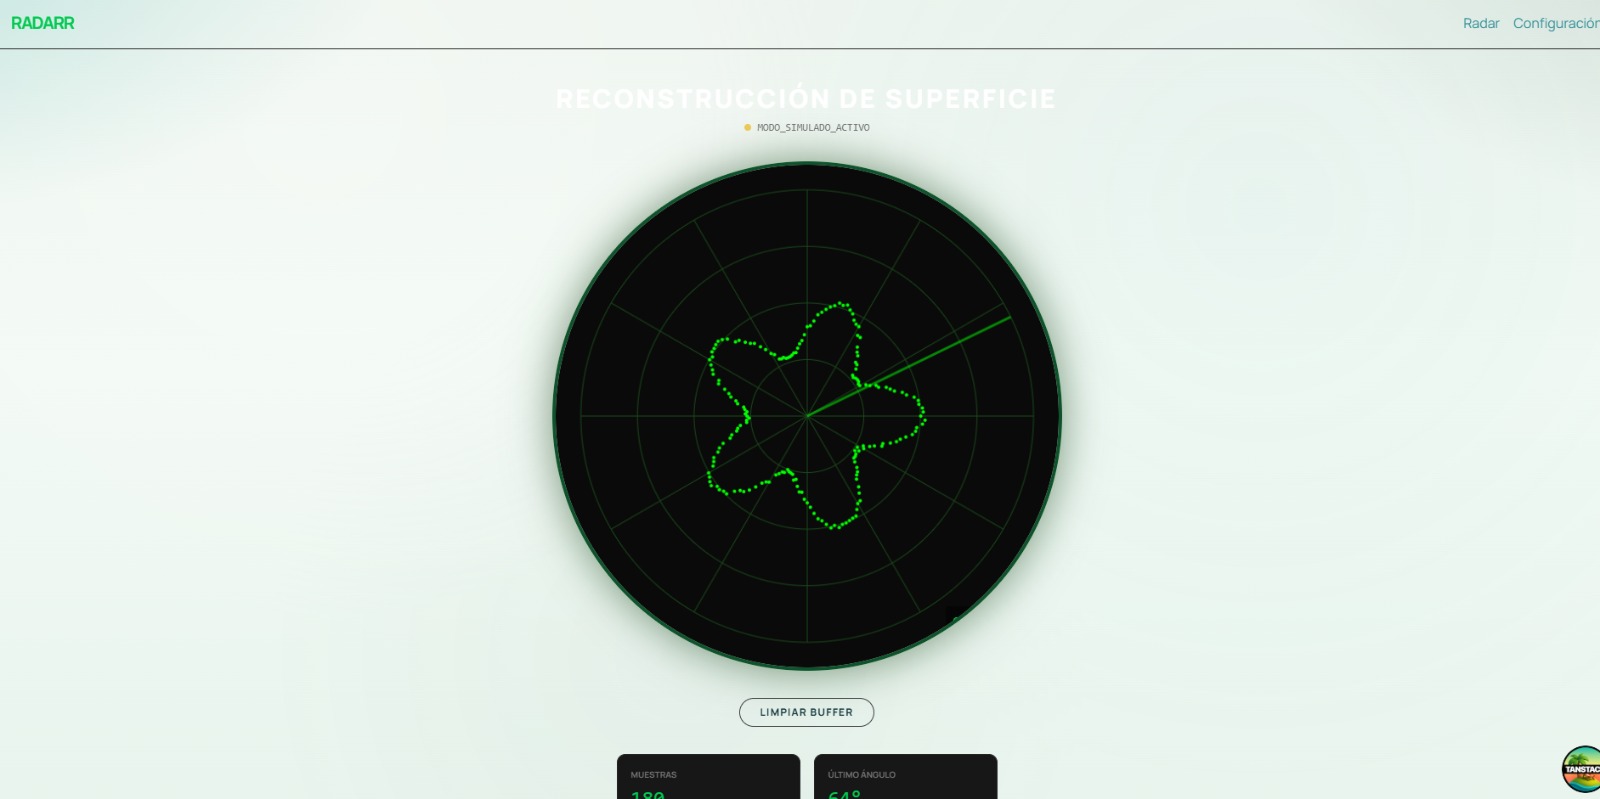
The third screenshot shows the radar display during active operation. The concentric rings represent distance ranges from the center outward, while the radial lines divide the scan area every 30 degrees. The Clear Buffer button at the bottom resets all stored readings, and the stats cards below show the total number of samples received and the last angle reported by the servo motor.
Demo Video
The following video demonstrates the complete radar system working end-to-end. The ESP32-C3 sweeps the servo motor from 0 to 180 degrees, reads distances with the HC-SR04 ultrasonic sensor at each angle, and transmits the data wirelessly via WebSocket. The RADARR web application receives each JSON packet in real time and renders the detections as green dots on the canvas radar display.
Downloads
Project Files