## Project Roadmap Integration of weekly assignments into the final prototype development.
Week 01

Principles and Practices

Initial project proposal can be found here. Where I was thinking to create an auto feeder system for the lab
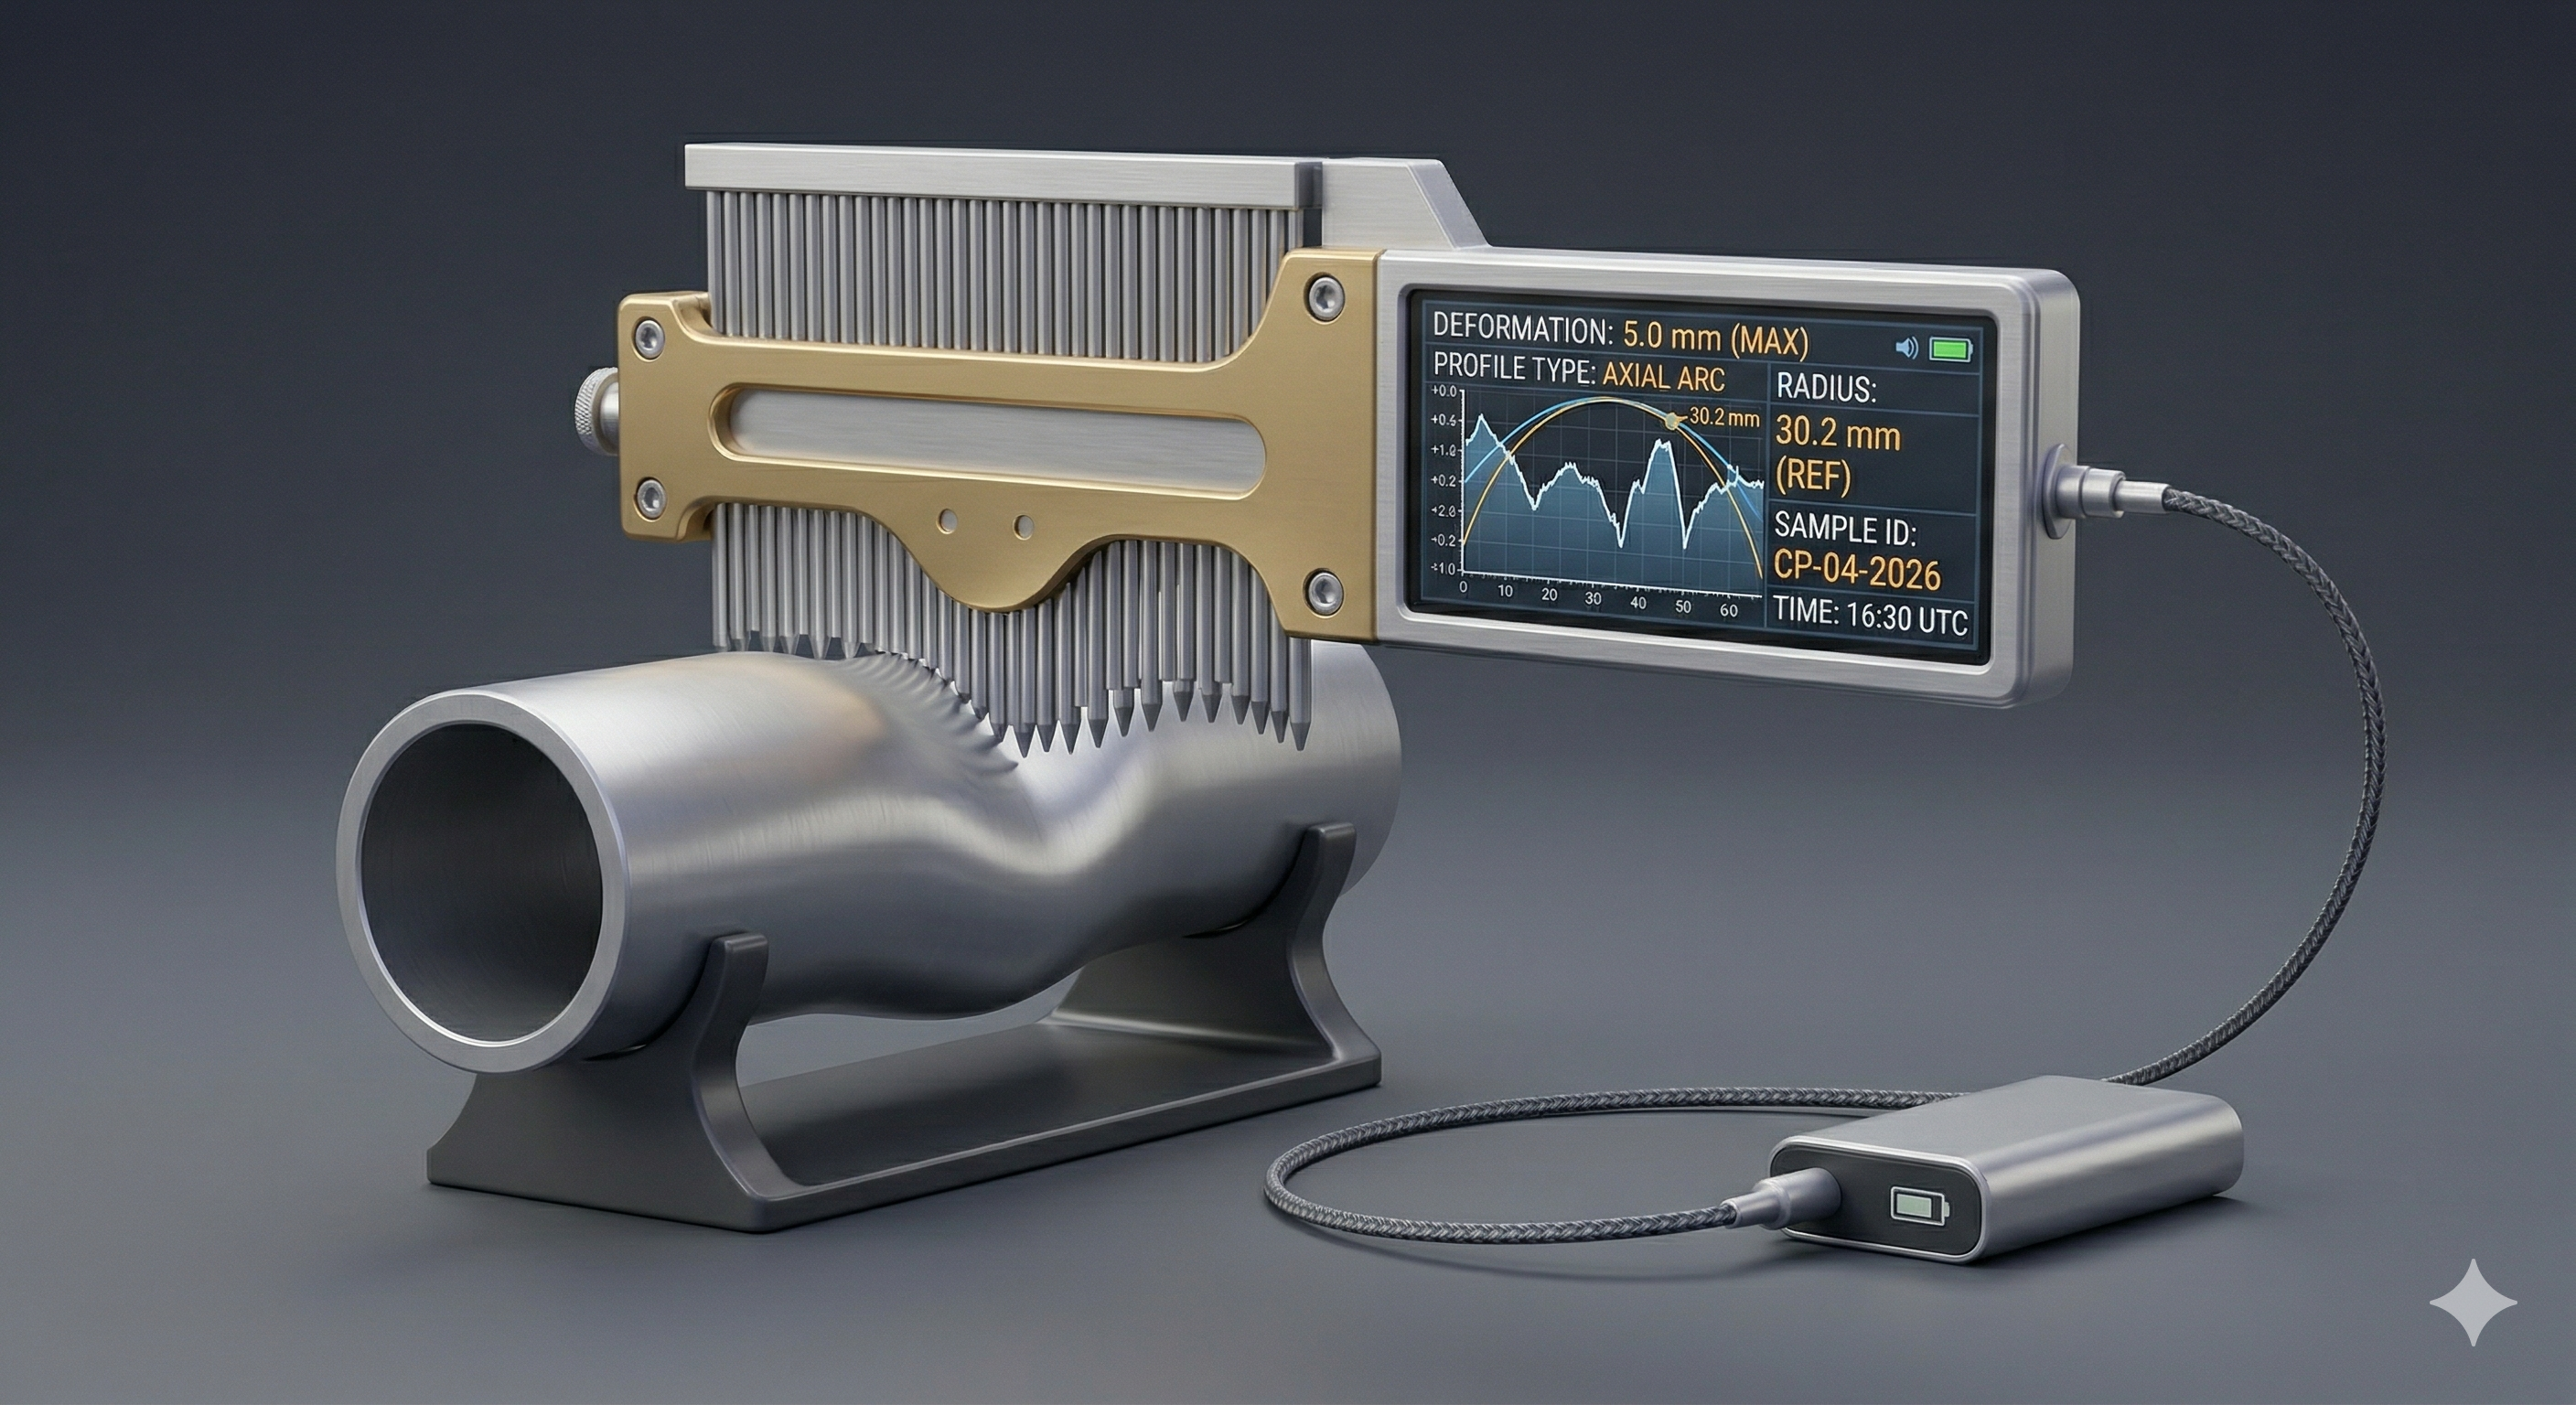
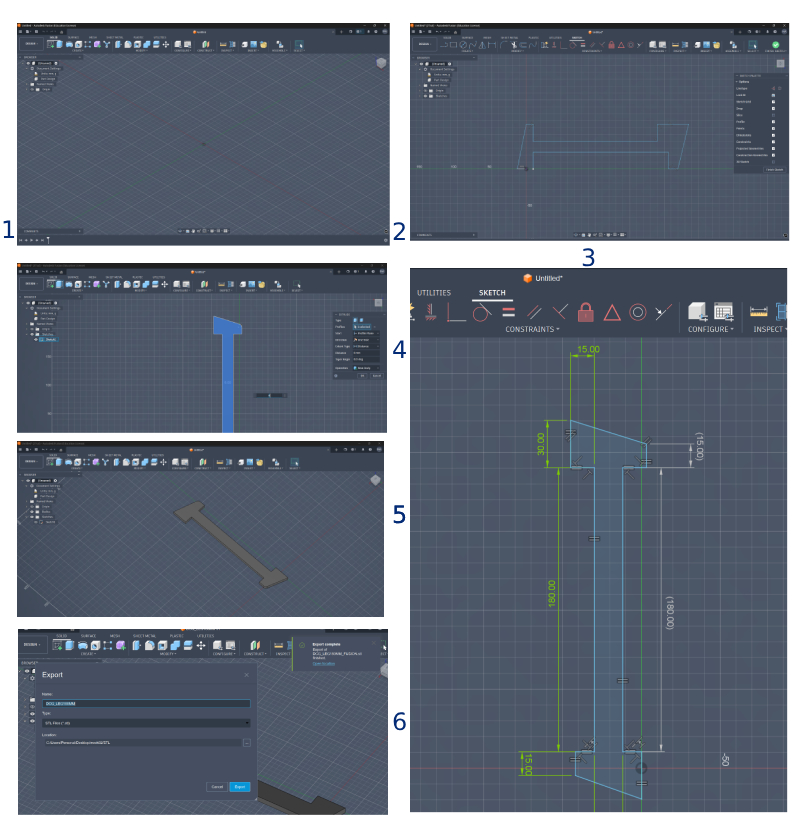
Week 02

CAD Modeling

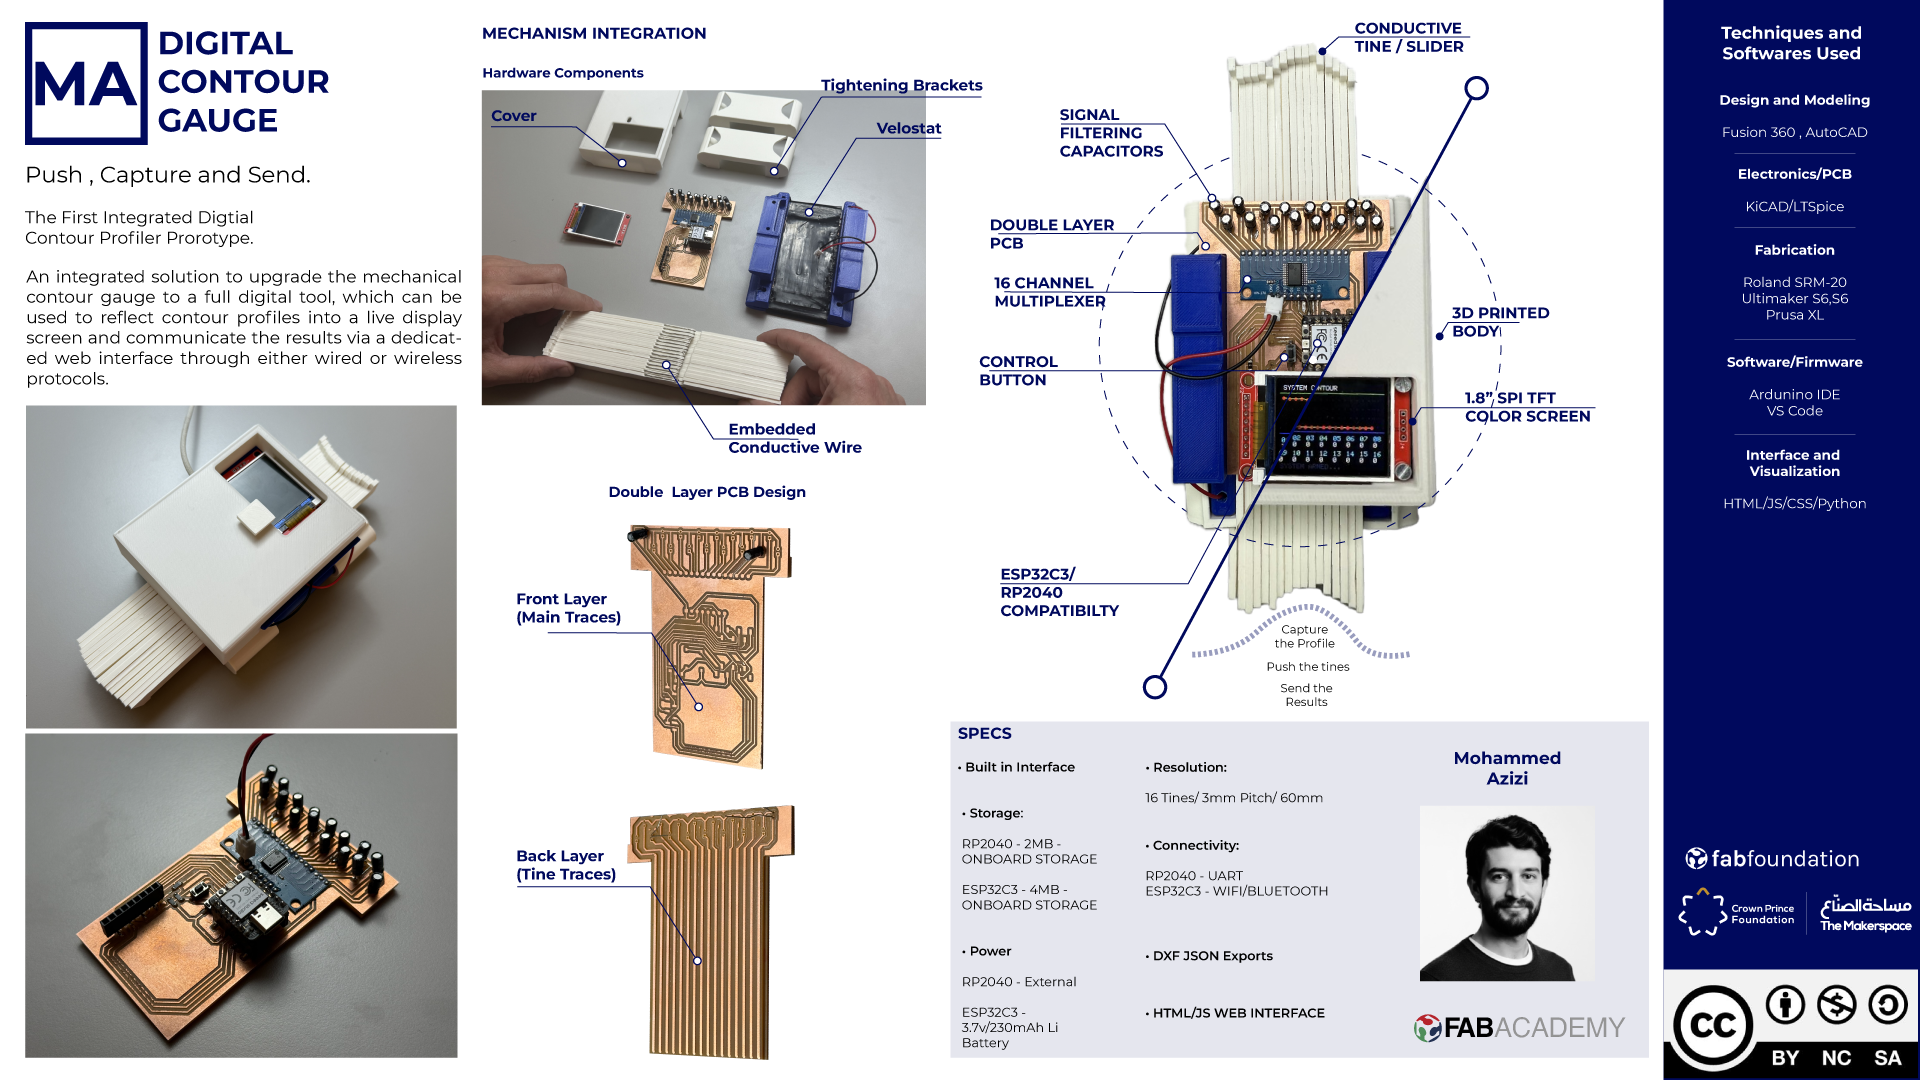
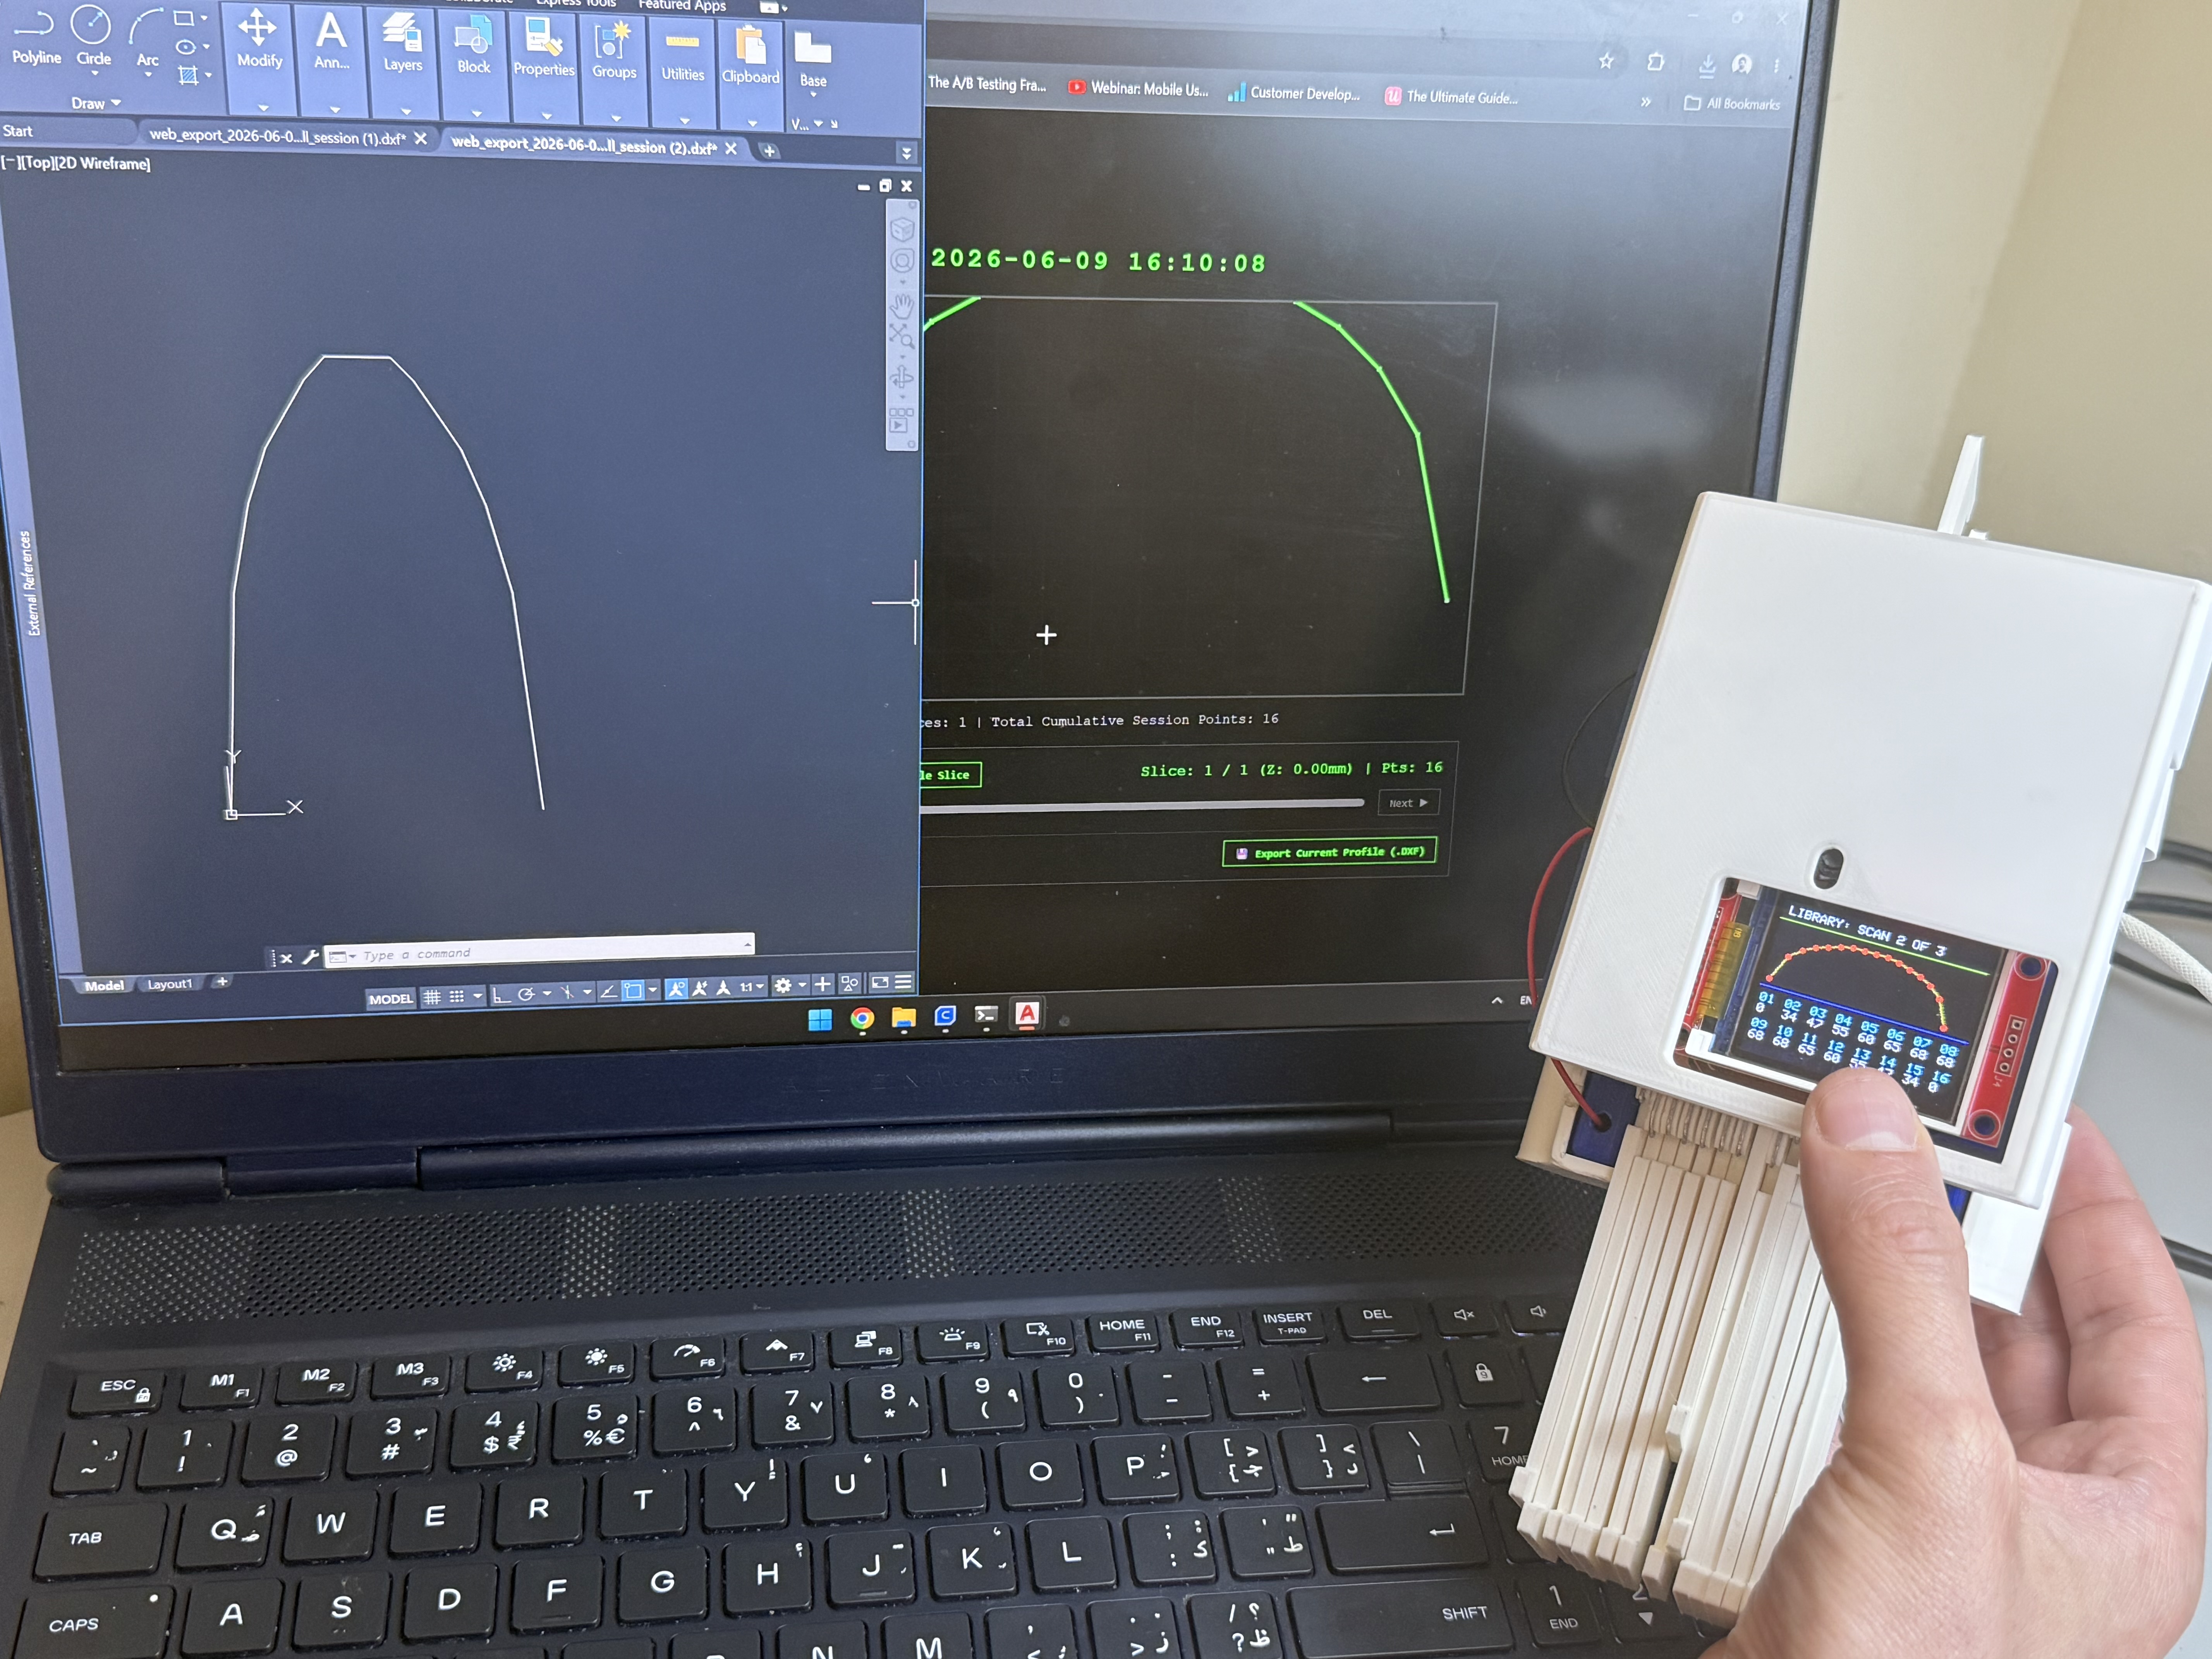
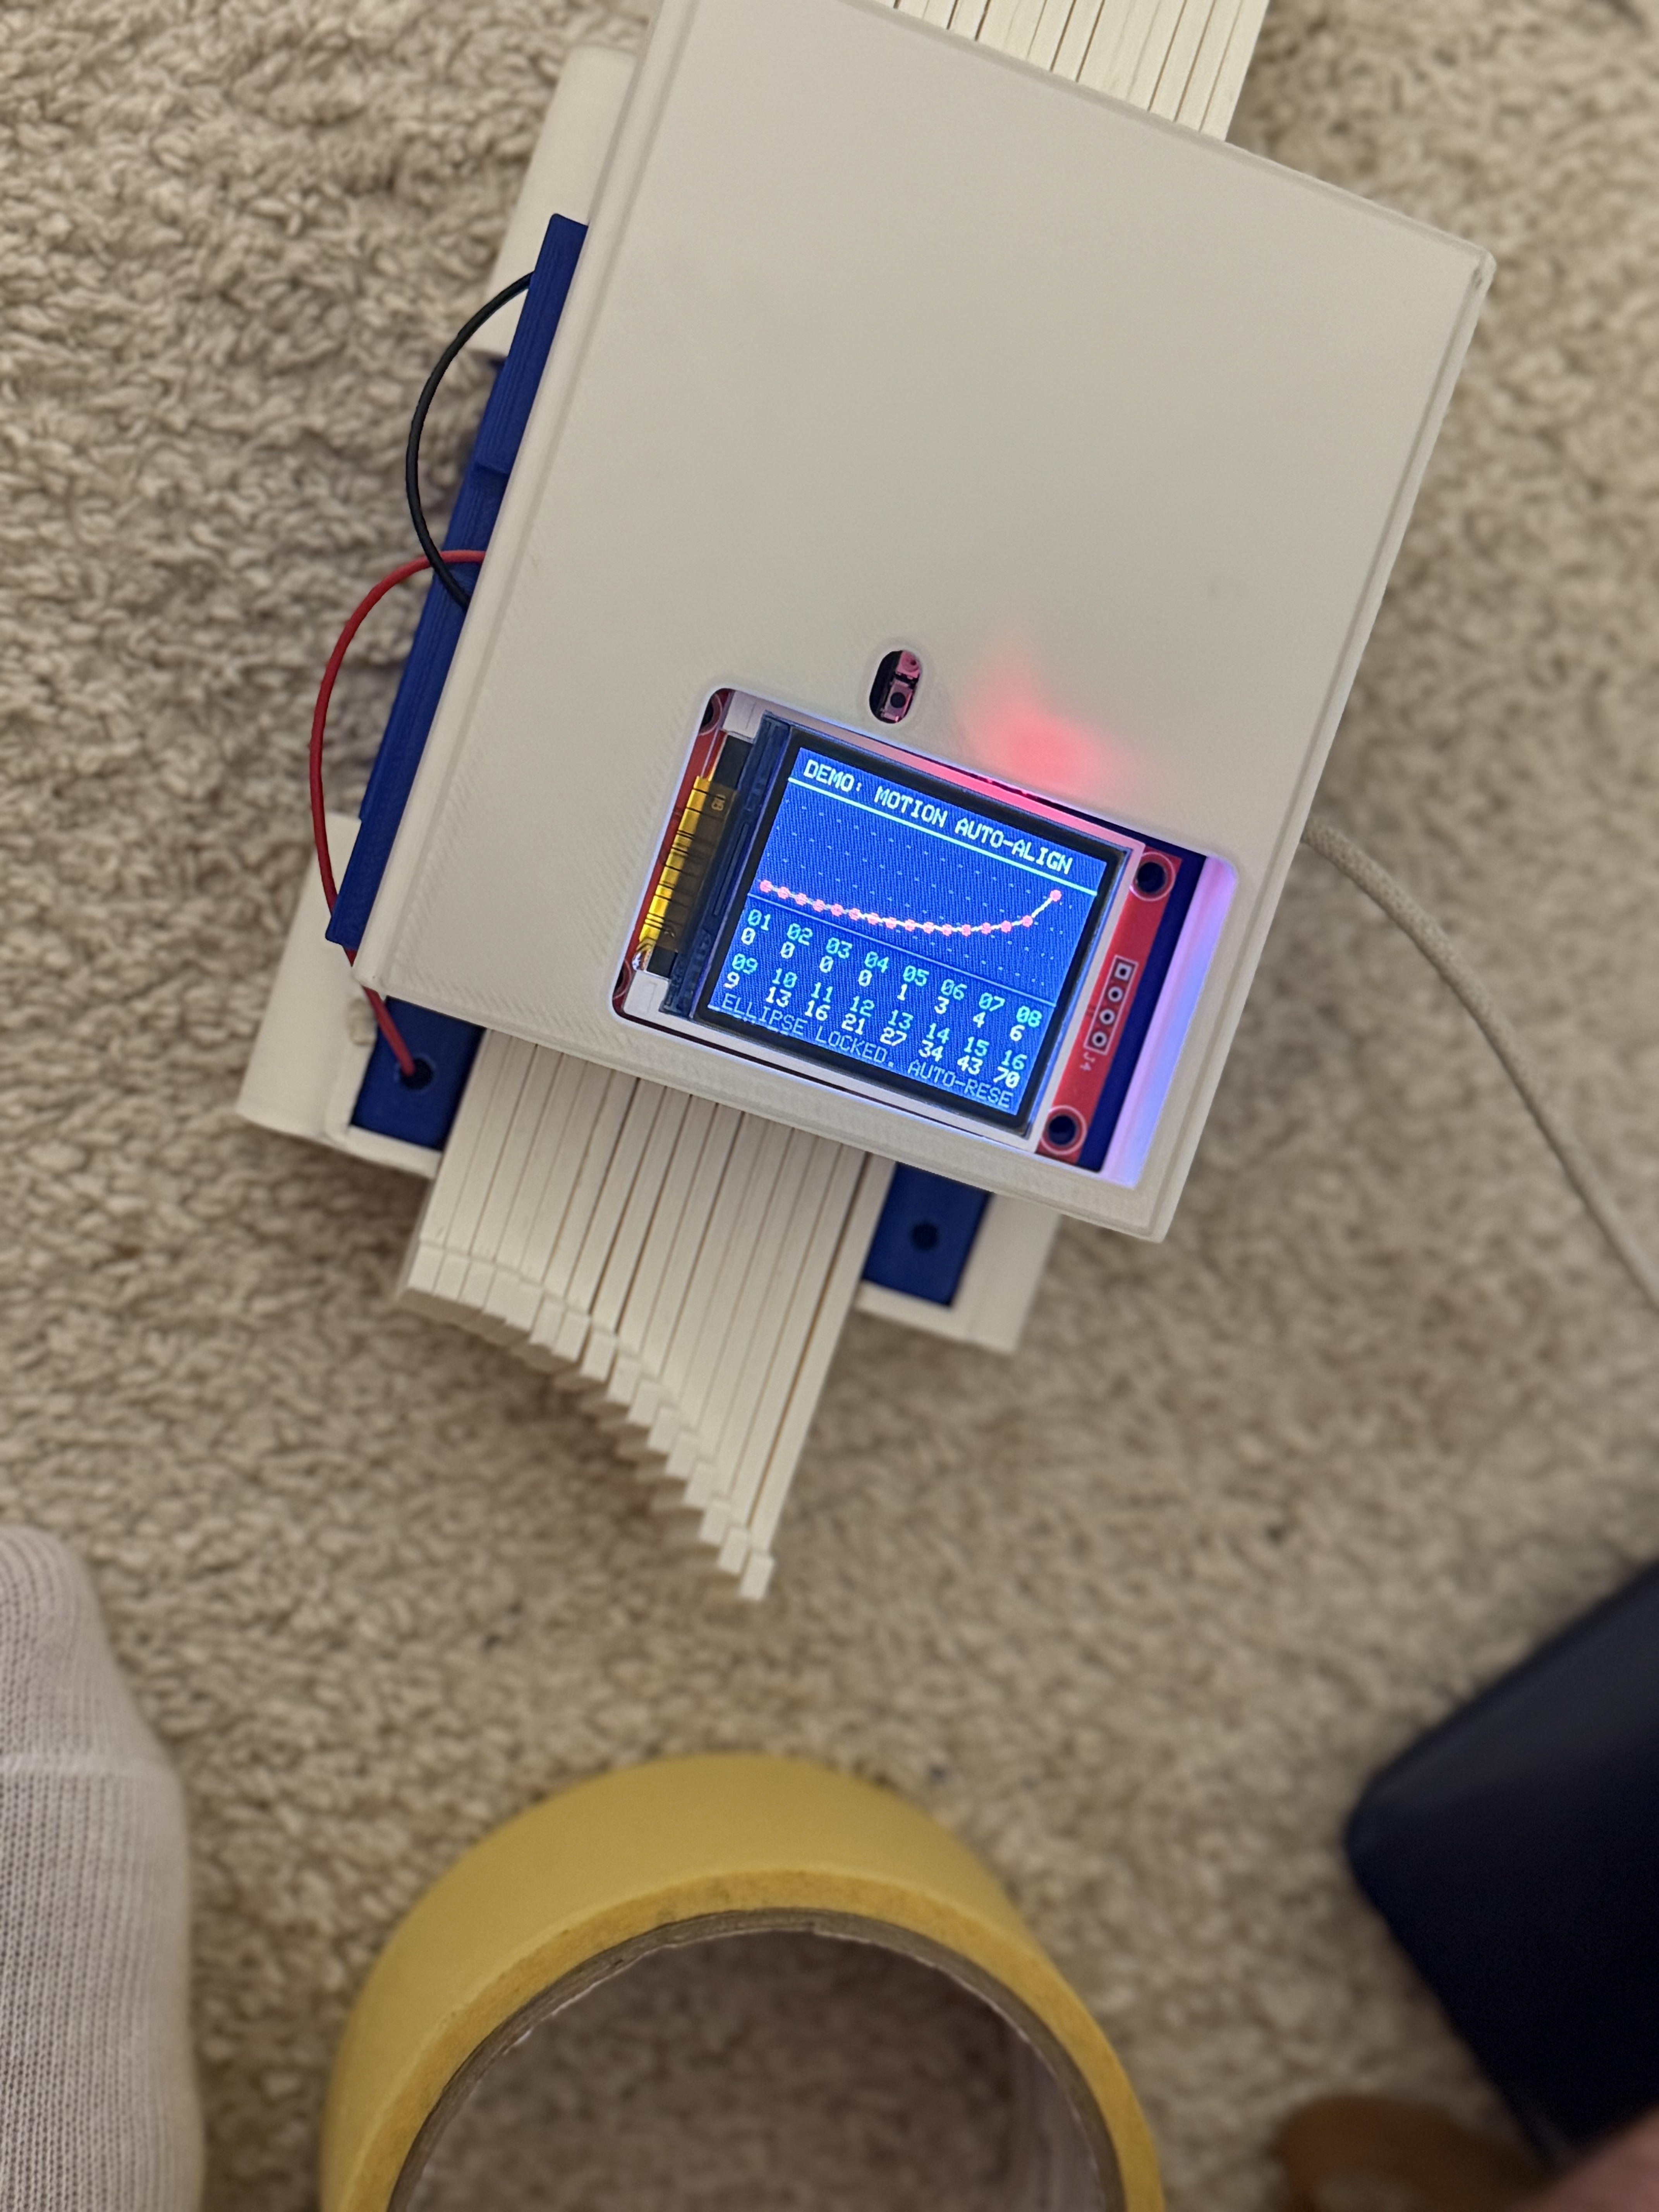
We had a discussion, where I proposed my final project along with two ideas I had in mind, where I decided to go through with a digital contour profiler, I tried to model the profiler leg using Fusion and FreeCAD during this week.

Week 03

Computer Controlled Cutting

With my rising interest in contours and irregular shapes, I decided to experiment with living hinges.

Week 04

Embedded Programming

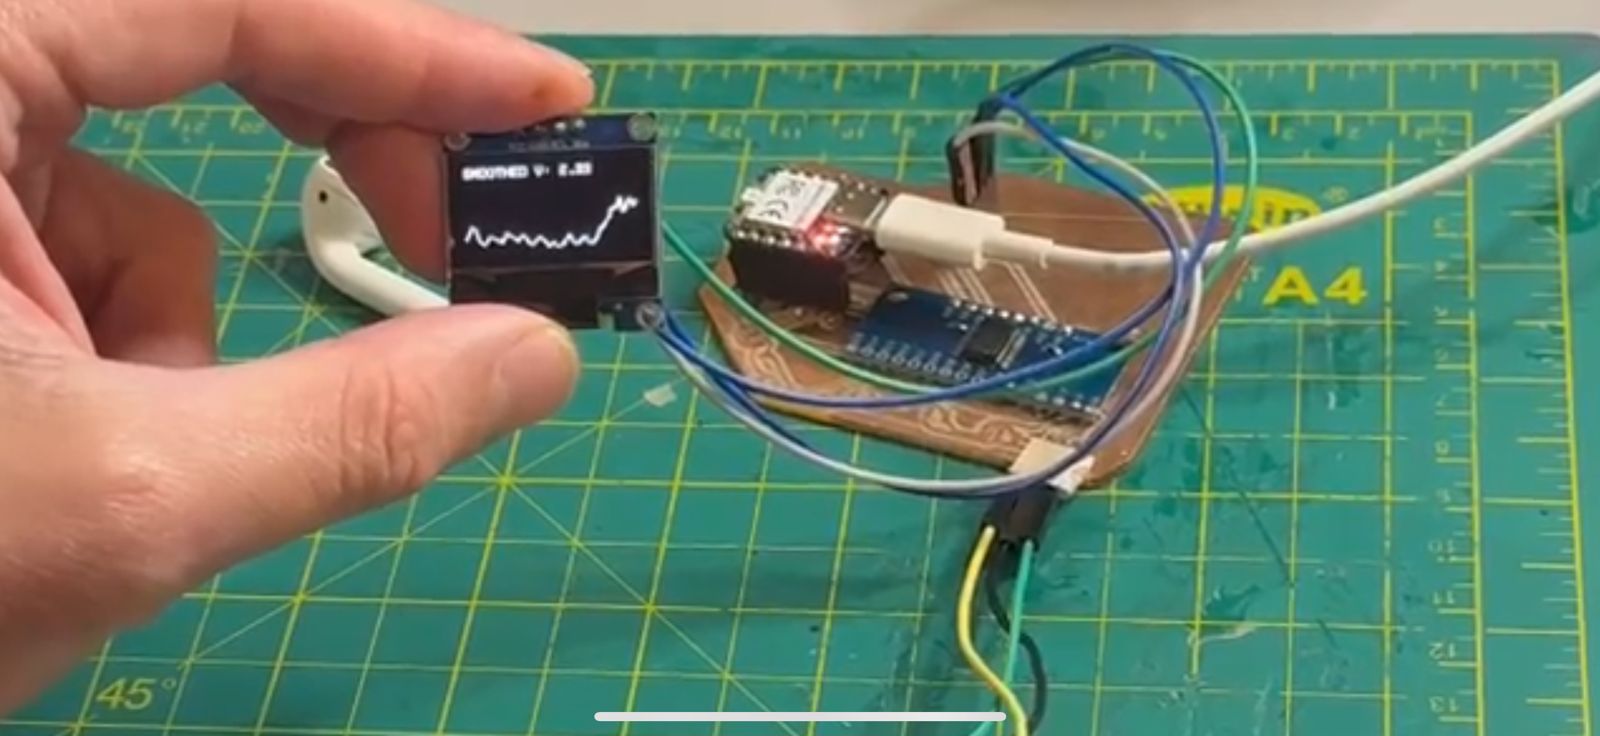
In this week I thought of which microcontroller I'm gonna use down the road to my final project, I concluded ESP32C is more promising, although I wanted to work with RP2040.

The main reason was I could simulate ESP32C more easily on Wokwi, and I found its wifi features a bit more open sourced in terms of tutorials (to date).

Week 05

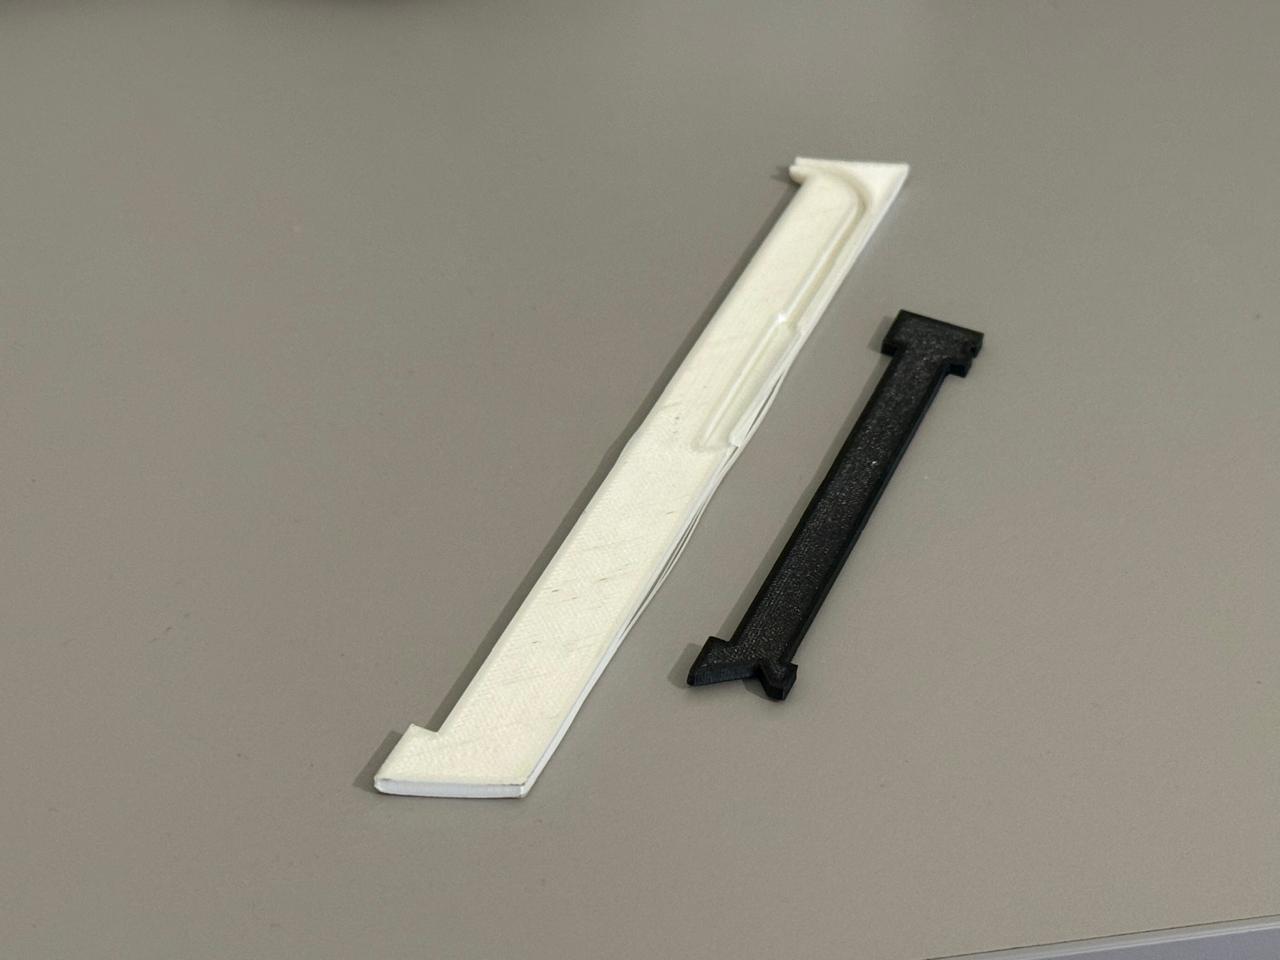
3D Modelling and Scanning

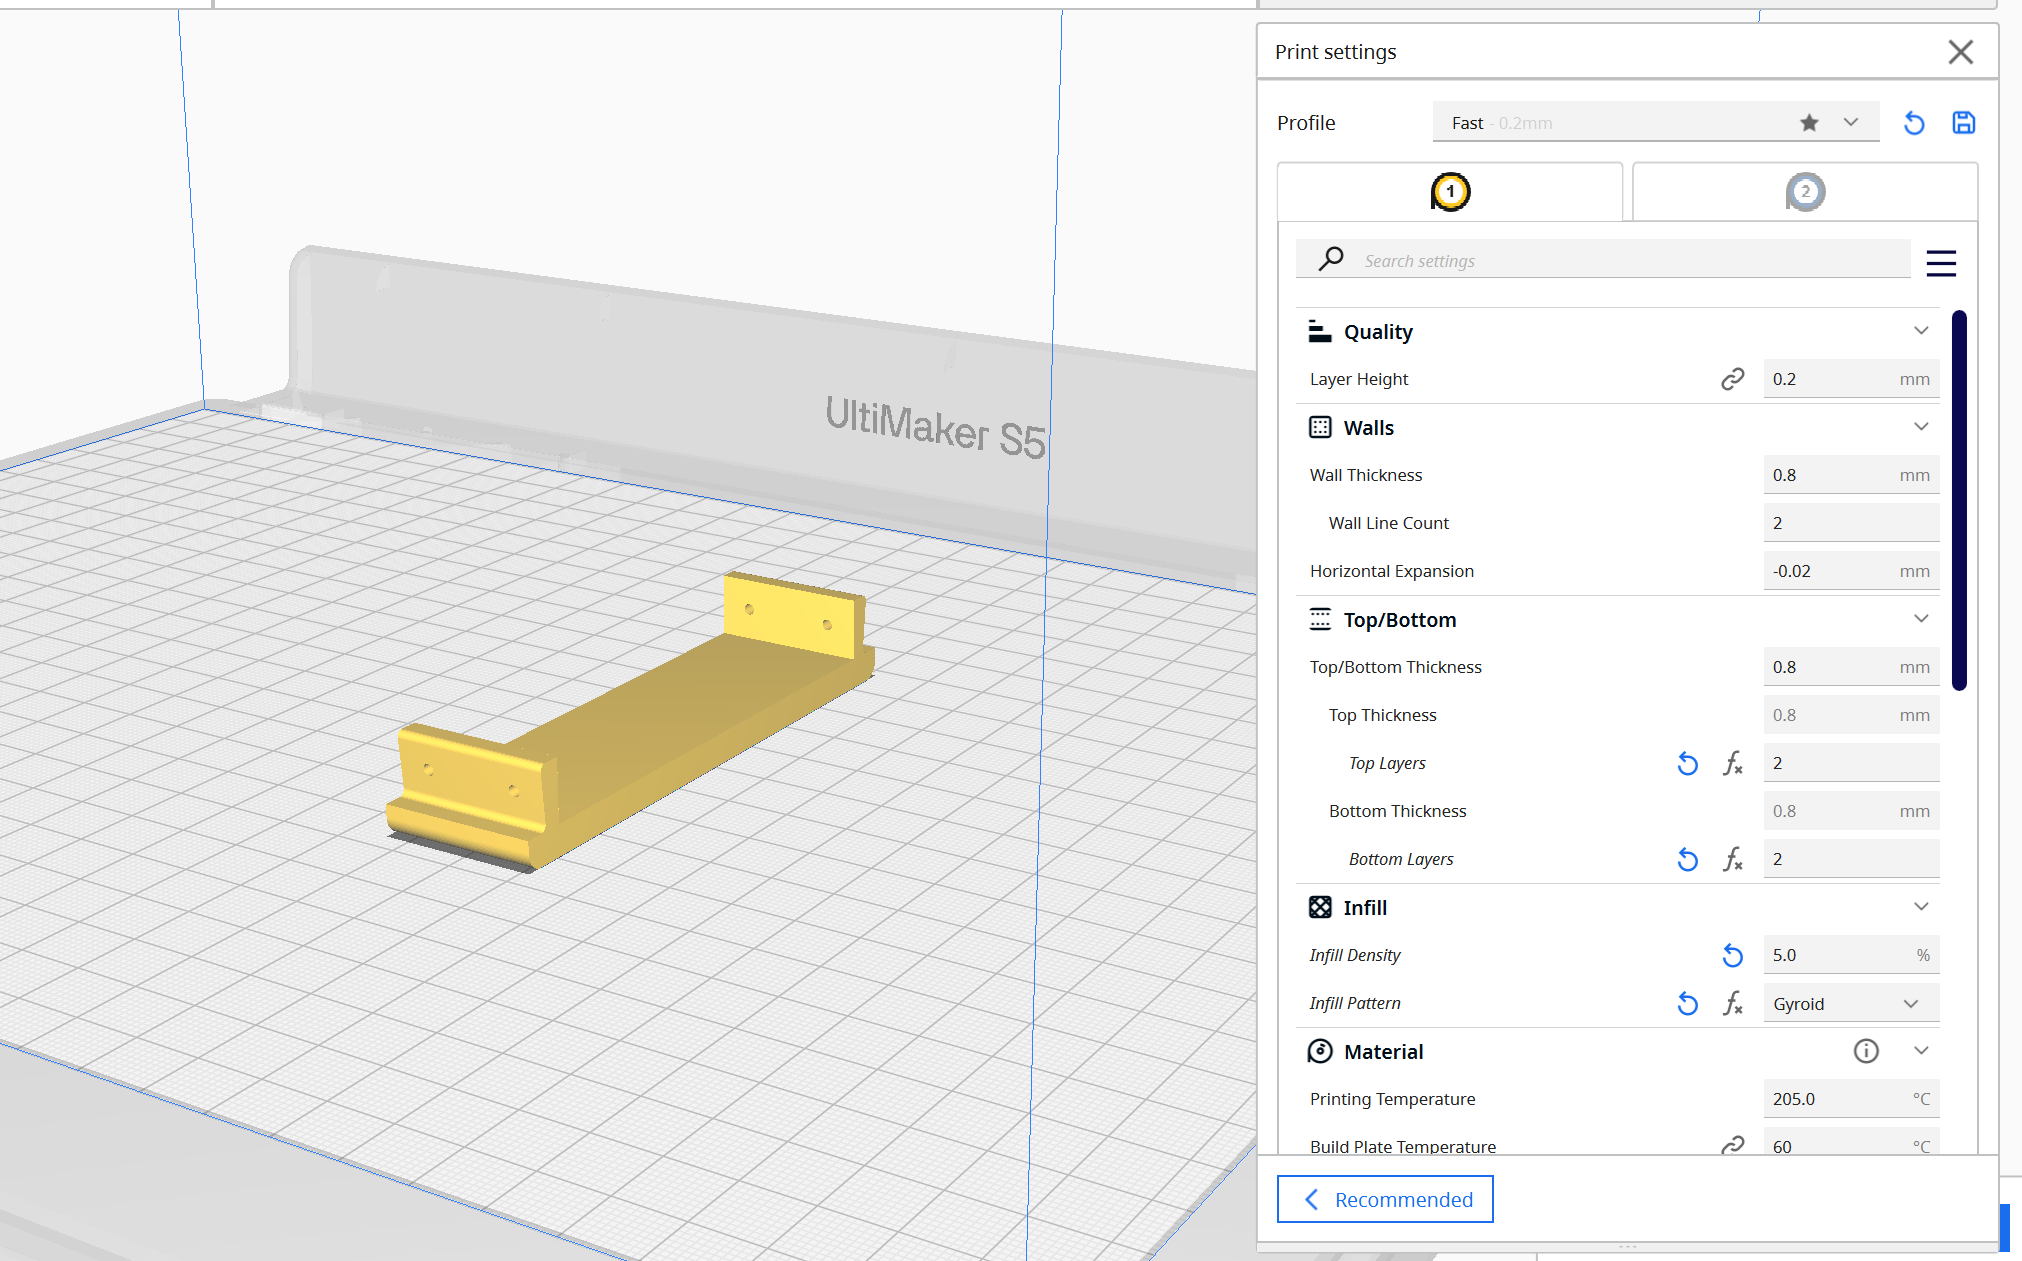
I experimented to print out different components of the contour guage profiler, from sources such as thingyverse, my goal was to test different PLA materials to decide how to manufacture the legs eventually.
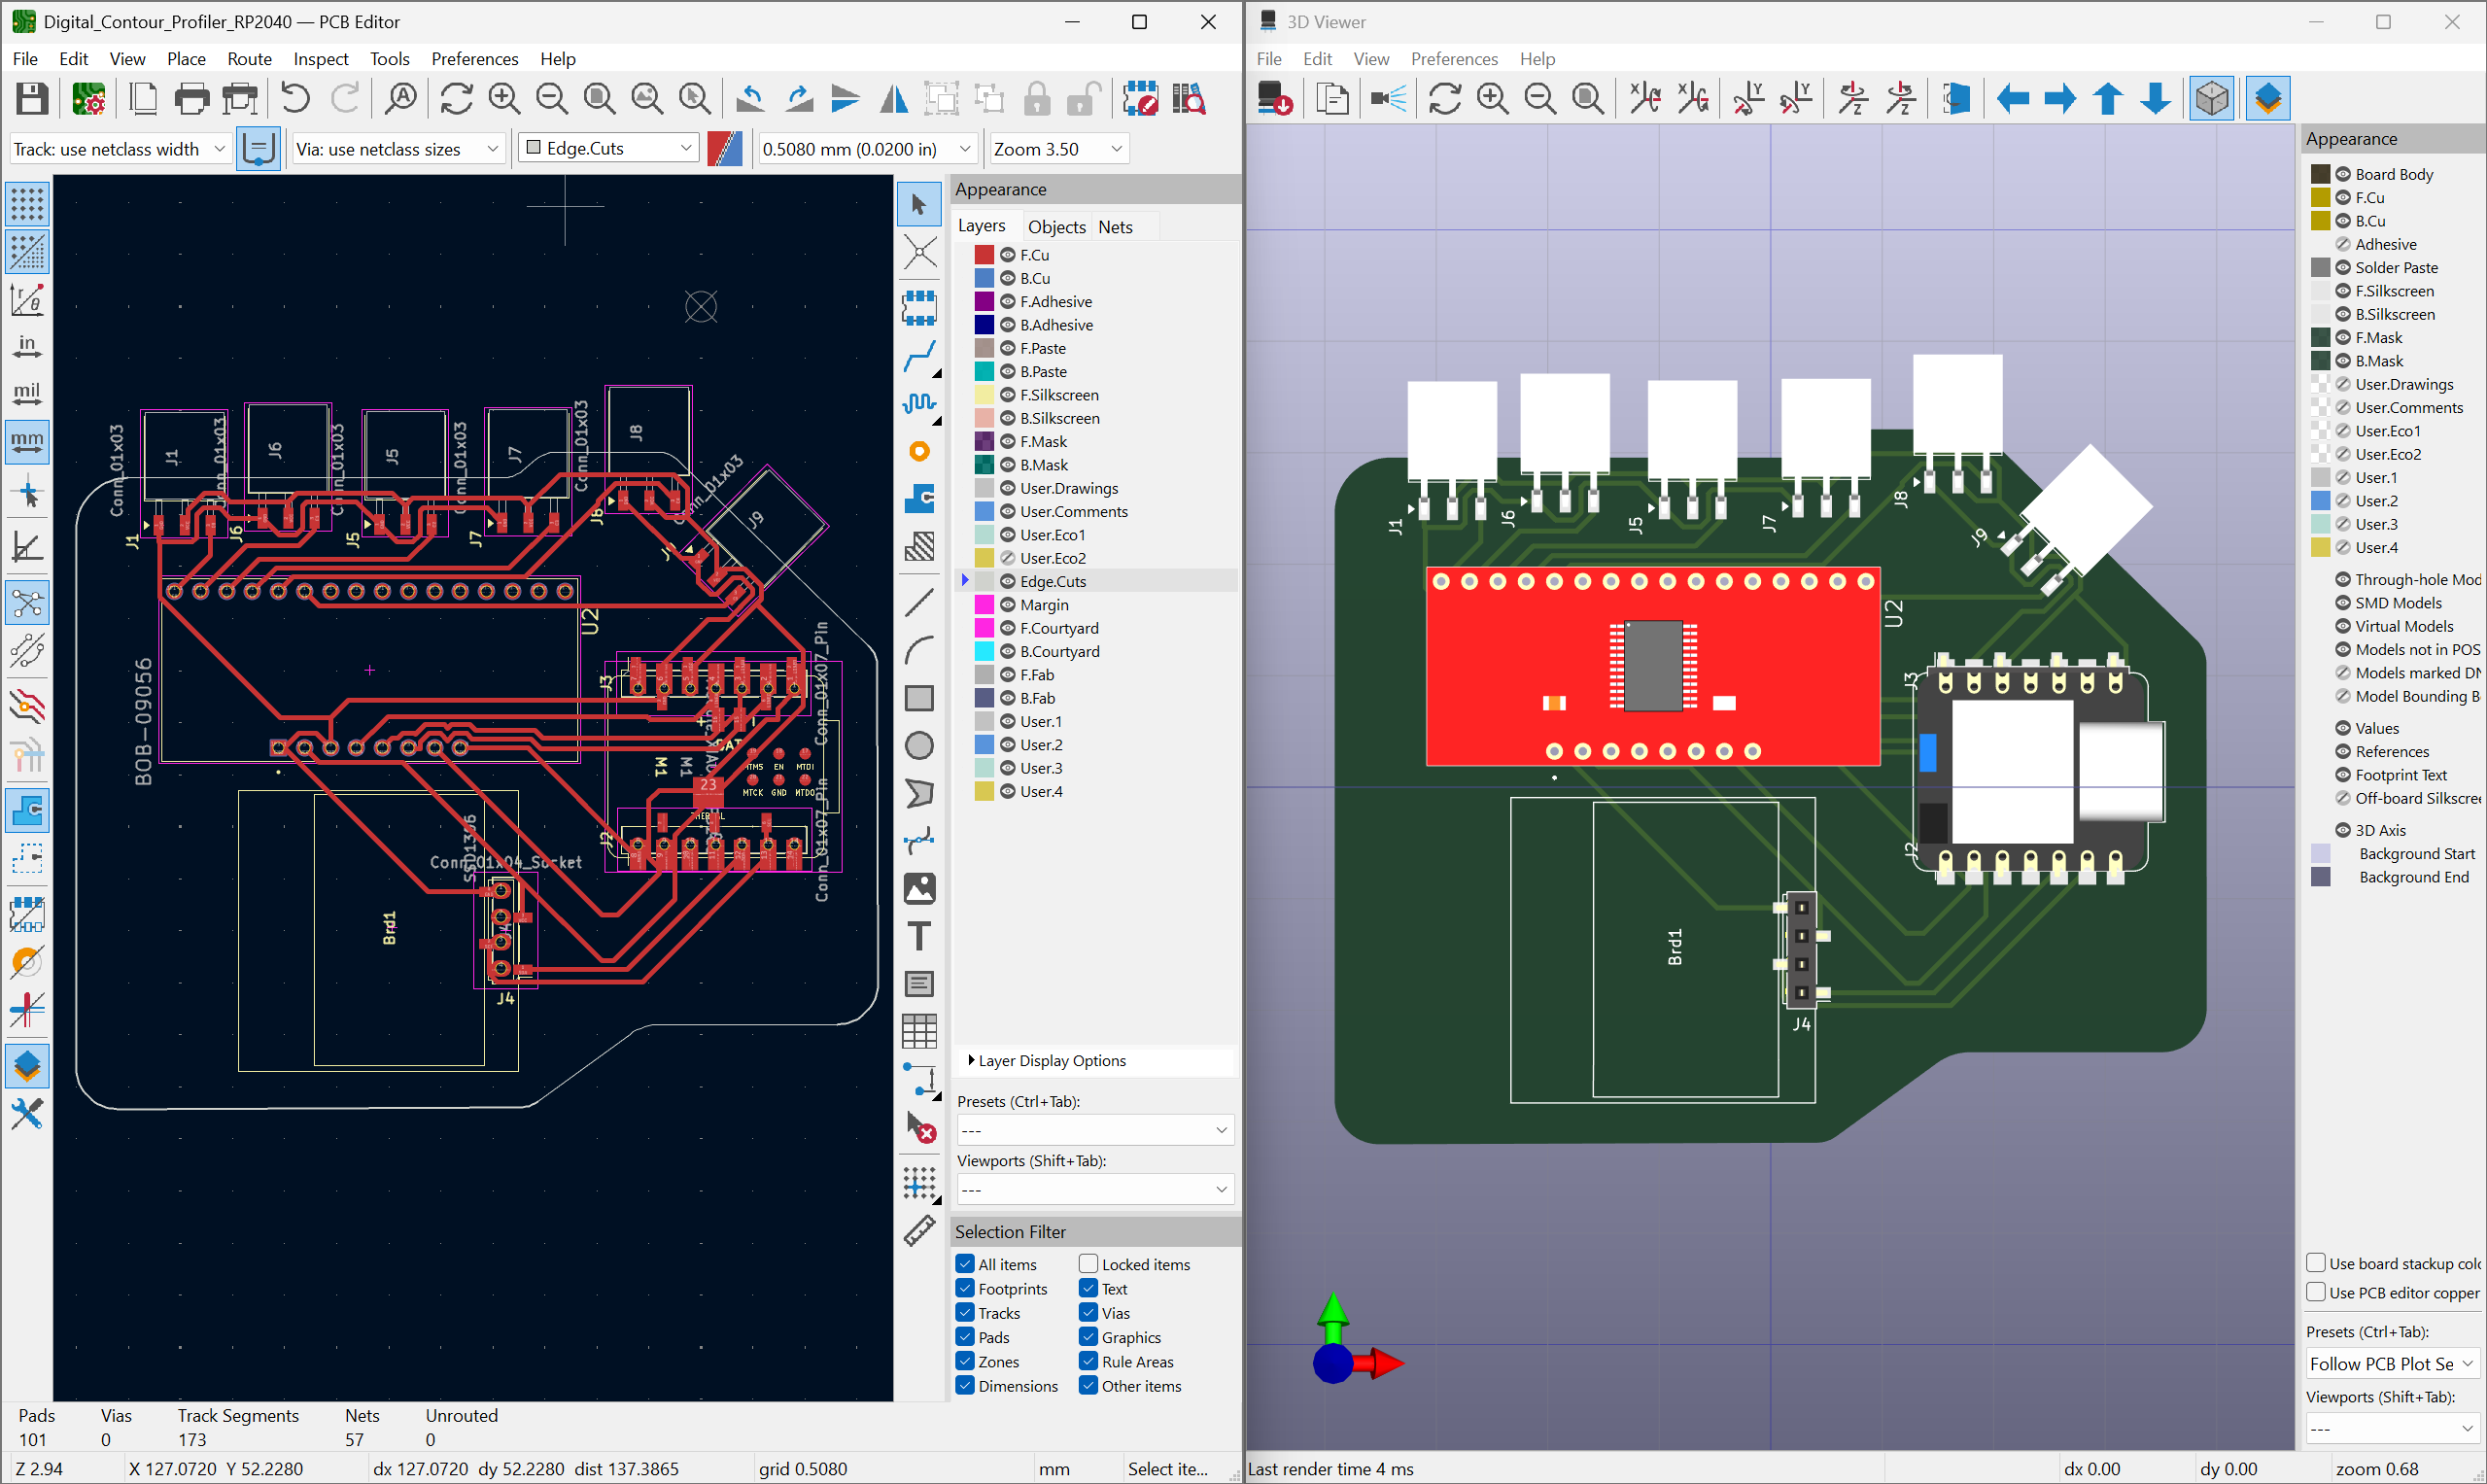
Week 06

PCB Design

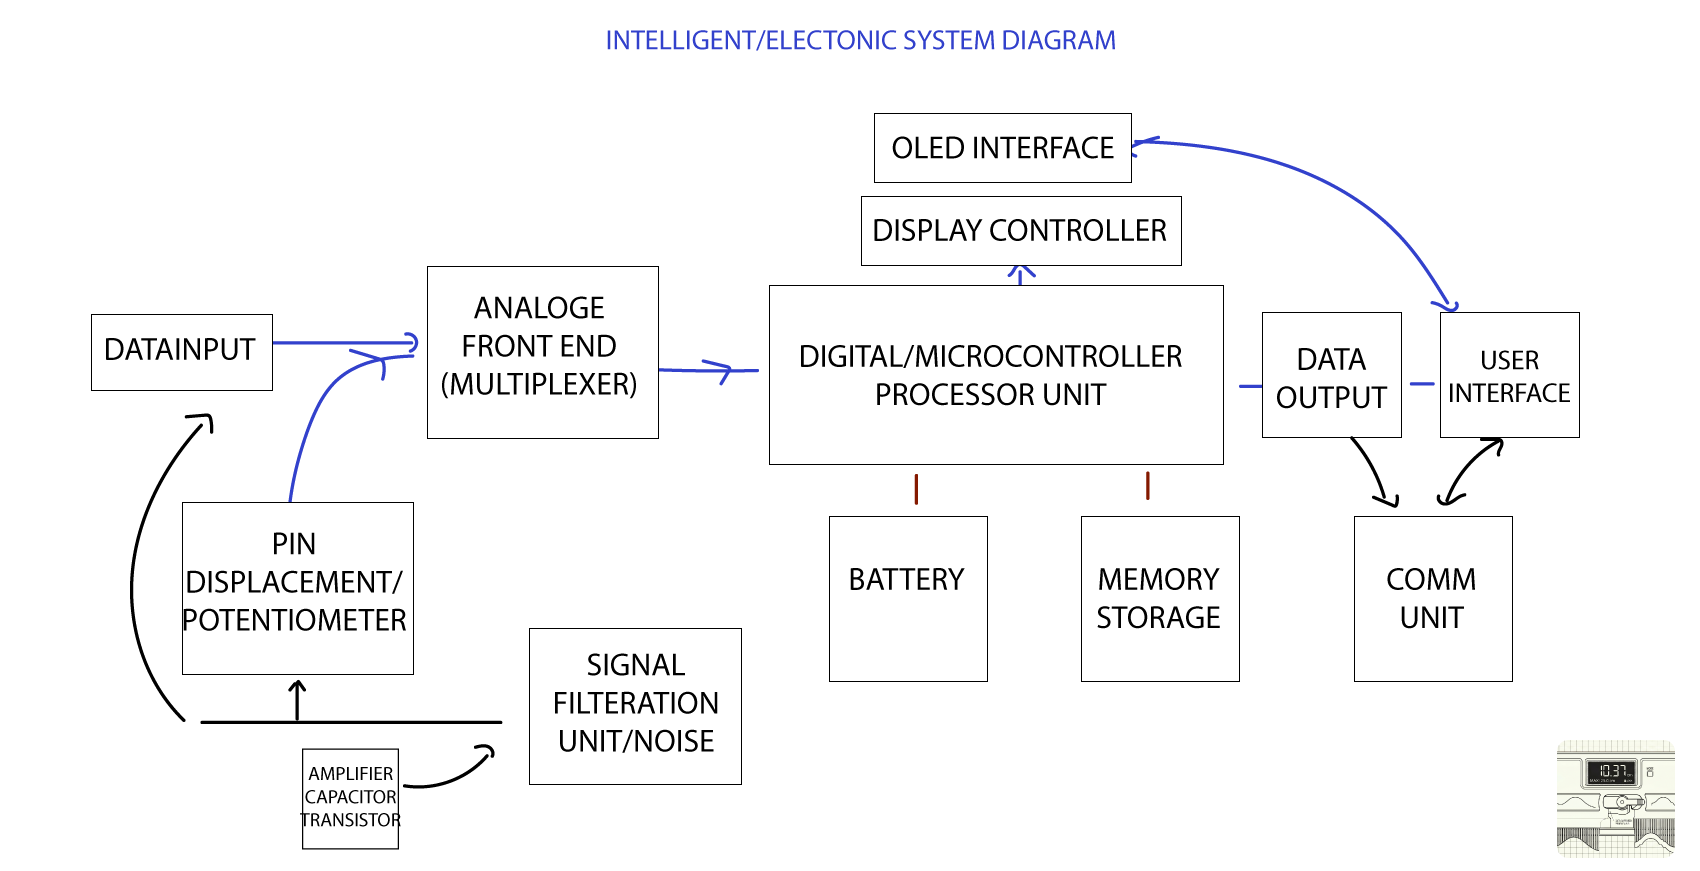
This week was a critical step for me to draft a base point for my electronic design, where I familiarized myself with multiplexers and started running simulations and drafting a partlist of electronics for my final project.

Week 07

Computer Controlled Machining

I kept doing 3D printing iterations in parallel to the weeks assignment and explored further how to create a custom potentiometer or decide on my actuator mechanism.

Current Phase: Prototyping
## Development in Progress The final project is currently under development. Detailed documentation will be added as system integration begins.
## Concept Overview ### The Problem In my line of work as a Mechanical Engineer, I worked in remote sites where we had to do pipe inspections and meet international standards, during that time I had to draft a quick solution to compensate the access to sophisticated/digital equipment to measure pipe deformations/dents. The manual method is by drawing a grid paper or printing it then marking the locations of the dent and using basic measurement devices to trace the dent profile. ### The Solution At the time , I dug into it more and found out this publication [Pipeline Dent Strain Assessment Using ASME B31.8](https://www.ndt.net/article/ndtnet/papers/Pipeline_Dent_Strain_Assessment_Using_ASME_B31.8.pdf) which inspired me to manufacture the manual contour profiler to resolve our problem at the time. However I realized a digital profiler would even make it all better since the method proposed in the paper, is still manual. My solution was to digitalize this tool which will increase the accuracy, work flow,save time and communicate/print/share the results in the reports issued. Furthermore, My wife line of work as a product designer,encouraged the thought as she faced multiple scenarios of trying to trace/map out certain products which cannot be easily obtained or at best, when I asked like what? a simple profile plate sometimes can be complex to replicate. ### Project Roadmap # Project Roadmap: Digital Contour Gauge ## 1. Project Timeline Overview | Week | Phase | Description | Key Result / Outcome | | :--- | :--- | :--- | :--- | | **Week 1** | **Decision Matrix** | Evaluation of ideas based on integration, scalability, and real-world application. | **Selected:** Digital Contour Gauge | | **Week 2** | **Research** | Literature review, component identification, and 3D print testing of existing models. | Foundational knowledge & mechanical benchmarks | | **Week 3** | **Sensor Ideation** | Deep dive into the potentiometer concept and physical sensor mechanisms. | Defined sensing logic | | **Week 4** | **Electronics I** | Component drafting, microcontroller selection, and initial simulations. | Identified Multiplexer & MCU | | **Week 5** | **Material Science** | Investigation of conductive materials for tine tracking (Velostat, copper, wire). | Material feasibility study | | **Week 6** | **Design (WIP)** | Initiation of the 3D modeling workflow and mechanical architecture. | Defined 7-Phase Design Plan | | **Week 7** | **Software POC** | Interface case studies and plotting functions in Python/IDE. | **POC:** Wave generation on OLED | | **Week 8-14**| **Integration** | **(Planned)** Interface finalization, PCB design, and system integration. | Final Prototype | --- ## 2. Week 6: 3D Modeling & Design Phases The modeling process is subdivided into the following sequence to ensure mechanical and electronic compatibility: * **Phase 1:** Tine Design (Individual gauge pins) * **Phase 2:** Enclosure (Main chassis) * **Phase 3:** Mechanical Assembly (Fitment testing) * **Phase 4:** Electronic Placement (KiCAD integration) * **Phase 5:** Mech/Elec Assembly (Merging hardware and housing) * **Phase 6:** BOM & Manufacturing (Part lists and methods) * **Phase 7:** Final Prototype --- ## 3. Future Tasks & Deliverables (Weeks 8 – 14) ### A. Interface & Software Development * Finalize the user interface for real-time contour visualization. * Integrate plotting functions with the hardware data stream. ### B. Electronic System Integration * **PCB Design:** Finalize the schematic and layout in KiCAD. * **Filtering Unit:** Implement signal conditioning for cleaner sensor data. * **Display Interface:** Finalize the OLED communication protocols. ### C. Power & Communication * **Battery & Storage:** Integrate portable power solutions and onboard memory. * **Communication Unit:** Finalize data transmission (e.g., USB, Bluetooth, or Serial). --- > **Status Note:** The project has successfully moved from theoretical research to a functional Proof of Concept (POC). Current focus is transitioning the "Work in Progress" 3D models into a manufacturable prototype.
Figure 1: Conceptual visualization of the final prototyp
Tine Modeling - Week02
Tine Printing
Tine Printing
PCB Design with multiplexer V1
Testing Graph plots using potentiometer
Figure 1: Electronic System Diagram