As part of this week, our group worked together on the networking and communications group assignment — building a modular test rig with two ESP32-C6 boards to verify five standard communication protocols (BLE, ESP-NOW, HTTP, I2C, and MQTT) and comparing their reliability, power usage, and speed, then documenting our shared findings before our individual projects. You can read the complete group assignment, including the code for each protocol and our shared documentation, here:
Group AssignmentThis week I built the exact communication architecture my final project PrintVault Pro uses: a device that owns the sensors (the XIAO ESP32-S3) talks to a gateway (the Raspberry Pi 5) over BLE, and the gateway re-publishes that data to a browser or app over WiFi. Two different communication protocols, chained together, each chosen for what it is good at.
Group Assignment
Project Overview
BLE + WiFi
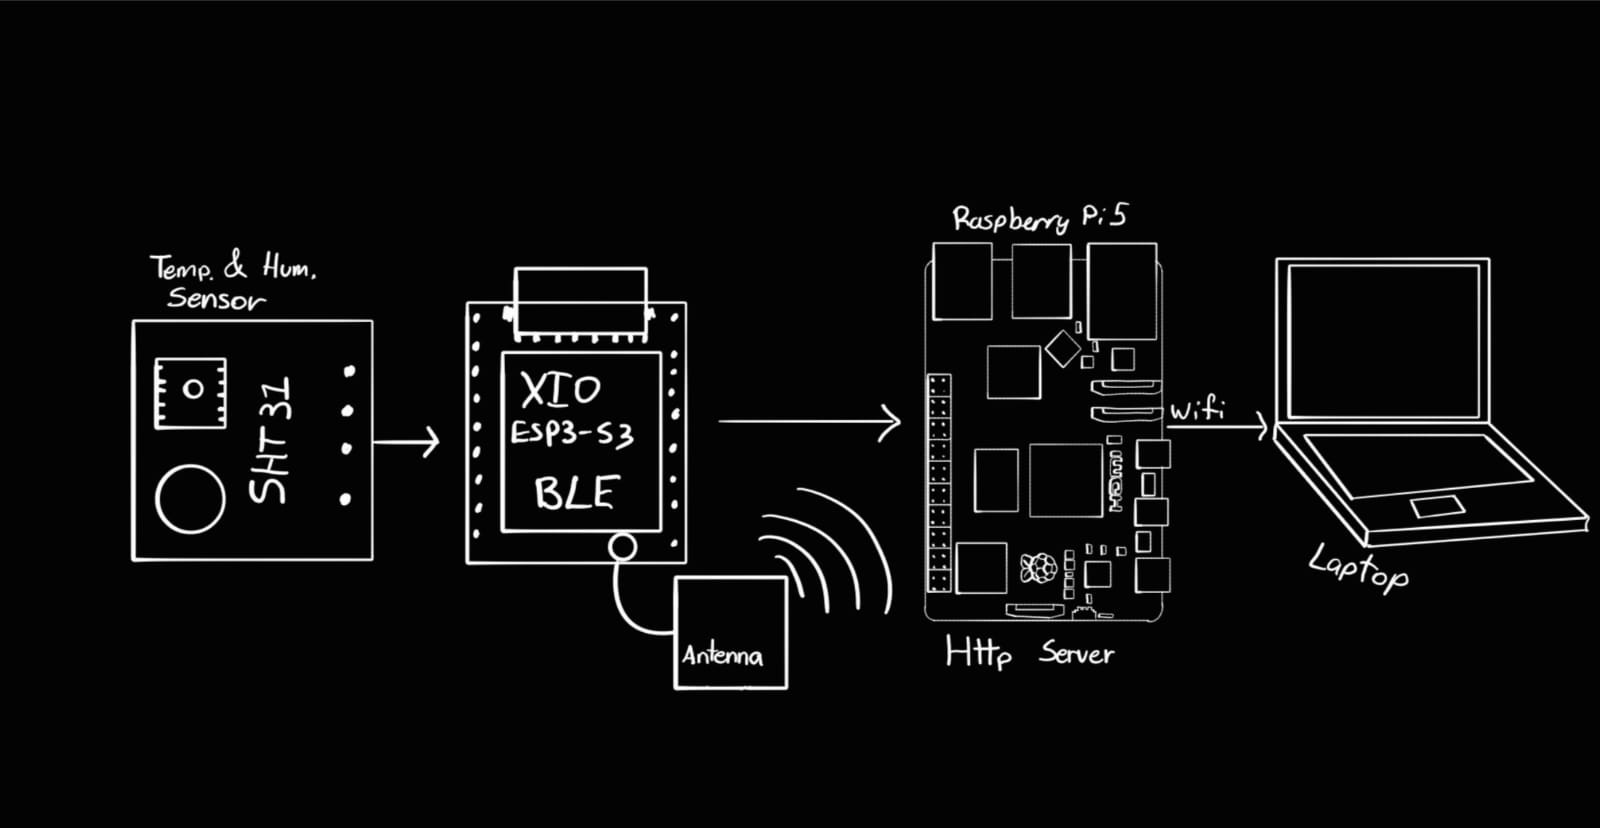
Instead of a single device serving a web page, this assignment uses two devices and two network links. The reason is that the two devices are good at different things, and my final project needs both:
- The XIAO ESP32-S3 sits next to the sensor and actuators. It reads the SHT31 temperature/humidity sensor and publishes its state — but it does not connect to WiFi. It sends its data over Bluetooth Low Energy (BLE).
- The Raspberry Pi 5 is the gateway. It receives the XIAO's data over BLE, and re-publishes it over WiFi so a phone, a laptop, or my desktop app can read it.
So the full path of a single temperature reading is:
SHT31 → XIAO ESP32-S3 → (BLE) → Raspberry Pi 5 → (WiFi / HTTP + WebSocket) → web client
This is exactly how PrintVault Pro works. The enclosure's microcontroller is close to the heater and sensor and only speaks BLE; the Raspberry Pi, which also runs the camera and the AI, is the one that puts everything on the network. This week isolates and tests that communication chain on its own.
Why two protocols
Design decision
A fair question is: why not just let the XIAO connect to WiFi and serve the page itself, like a simpler setup would? The answer comes from the needs of the final project:
- The camera and the AI live on the Pi. The camera physically plugs into the Raspberry Pi, and the YOLO model that detects print failures needs the Pi's processing power. The data has to pass through the Pi anyway — so the Pi is the natural place to centralize all communication.
- BLE is low-power and simple for device-to-device. Between the microcontroller and the gateway, sitting a few centimeters apart inside the same machine, BLE is a clean point-to-point link that doesn't depend on the WiFi router being reachable.
- WiFi gives range and reach. Once the data is on the Pi, WiFi lets any device on the network — or even a remote one through a VPN — read the state and watch the camera. BLE alone would limit the user to about ten meters.
So each link is used where it is strongest: BLE for the short, local device-to-gateway hop, and WiFi for the longer gateway-to-user hop.
Link 1 — BLE
XIAO → Raspberry Pi
The first link uses Bluetooth Low Energy with the Nordic UART Service (NUS). NUS is a widely used BLE profile that emulates a simple serial port over Bluetooth: it gives you two channels, one to send and one to receive, so two devices can exchange plain text or JSON as if they were connected by a wire.
BLE communication is organized around services and characteristics, each identified by a UUID:
| Element | UUID | Role |
|---|---|---|
| Service (NUS) | 6e400001-… | Groups the two characteristics into one logical "serial port" |
| RX characteristic (Write) | 6e400002-… | The Pi writes commands here → the XIAO receives them |
| TX characteristic (Notify) | 6e400003-… | The XIAO notifies its state here → the Pi receives it |
In this model the XIAO is the BLE server (peripheral): it advertises itself, and the Raspberry Pi is the client (central) that scans for it, connects, and subscribes to notifications. Once subscribed, every time the XIAO updates its state it pushes a notification to the Pi — the Pi doesn't have to keep asking. This push model is efficient and is why BLE notifications are a good fit for live sensor data.
The XIAO sends its state once per second as a single line of JSON, terminated by a newline:
{"t":32.4,"h":38}
(In the final project this same line also carries heater, fan, lights, mode, setpoint and status — here it is trimmed to the sensor data that this week is about.)
XIAO Code
ESP32-S3 · Arduino
The XIAO firmware sets up the BLE server with the NUS service, reads the SHT31 once per second, and notifies the JSON state on the TX characteristic. The libraries used:
#include <Wire.h>
#include <Adafruit_SHT31.h>
#include <BLEDevice.h>
#include <BLEServer.h>
#include <BLEUtils.h>
#include <BLE2902.h>
Wire.h/Adafruit_SHT31.h— read the temperature/humidity sensor over I²C.BLEDevice.h,BLEServer.h,BLEUtils.h— the ESP32 BLE stack: create the device, the server, the service and the characteristics.BLE2902.h— the descriptor that lets a client enable notifications on the TX characteristic.
#include <Wire.h>
#include <Adafruit_SHT31.h>
#include <BLEDevice.h>
#include <BLEServer.h>
#include <BLEUtils.h>
#include <BLE2902.h>

#define DEVICE_NAME   "FAB_ENCLOSER"
#define SERVICE_UUID  "6e400001-b5a3-f393-e0a9-e50e24dcca9e"
#define RX_CHAR_UUID  "6e400002-b5a3-f393-e0a9-e50e24dcca9e"  // Pi  -> XIAO
#define TX_CHAR_UUID  "6e400003-b5a3-f393-e0a9-e50e24dcca9e"  // XIAO -> Pi

Adafruit_SHT31 sht31 = Adafruit_SHT31();

BLEServer*         pServer = nullptr;
BLECharacteristic* pTxChar = nullptr;
bool deviceConnected = false;

unsigned long lastSend = 0;

// Re-advertise automatically when the central disconnects
class ServerCallbacks : public BLEServerCallbacks {
  void onConnect(BLEServer* s) override    { deviceConnected = true; }
  void onDisconnect(BLEServer* s) override {
    deviceConnected = false;
    BLEDevice::startAdvertising();
  }
};

void setup() {
  Serial.begin(115200);

  Wire.begin();
  sht31.begin(0x44);

  // --- BLE setup ---
  BLEDevice::init(DEVICE_NAME);
  pServer = BLEDevice::createServer();
  pServer->setCallbacks(new ServerCallbacks());

  BLEService* pService = pServer->createService(SERVICE_UUID);

  // TX: the XIAO notifies its state here
  pTxChar = pService->createCharacteristic(
      TX_CHAR_UUID, BLECharacteristic::PROPERTY_NOTIFY);
  pTxChar->addDescriptor(new BLE2902());

  // RX: the Pi writes commands here (not used this week, ready for the final project)
  pService->createCharacteristic(
      RX_CHAR_UUID,
      BLECharacteristic::PROPERTY_WRITE | BLECharacteristic::PROPERTY_WRITE_NR);

  pService->start();

  // Start advertising so the Pi can find this device
  BLEAdvertising* pAdv = BLEDevice::getAdvertising();
  pAdv->addServiceUUID(SERVICE_UUID);
  pAdv->setScanResponse(true);
  BLEDevice::startAdvertising();

  Serial.println("BLE advertising as FAB_ENCLOSER");
}

void loop() {
  // Once per second: read the sensor and notify the JSON state
  if (millis() - lastSend >= 1000) {
    lastSend = millis();

    float t = sht31.readTemperature();
    float h = sht31.readHumidity();

    if (deviceConnected && !isnan(t) && !isnan(h)) {
      char buf[64];
      snprintf(buf, sizeof(buf), "{\"t\":%.1f,\"h\":%d}\n", t, (int)h);
      pTxChar->setValue((uint8_t*)buf, strlen(buf));
      pTxChar->notify();   // push to the Pi
    }
  }
}
XIAO Code Explanation
Analysis
Creating the BLE server
BLEDevice::init(DEVICE_NAME) starts the BLE stack and sets the name the device advertises.
createServer() makes this board a BLE peripheral, and createService(SERVICE_UUID)
creates the Nordic UART Service that groups the two characteristics.
The two characteristics
The TX characteristic is created with PROPERTY_NOTIFY so it can push values
to the client, and a BLE2902 descriptor is attached — that descriptor is what lets the Pi turn
notifications on. The RX characteristic is created with write properties; it isn't used
this week, but it's already there for the final project, where the Pi sends commands back to the XIAO.
Advertising and reconnection
startAdvertising() makes the XIAO discoverable so the Pi's scan can find it. The
ServerCallbacks class re-starts advertising automatically on disconnect, so if the Pi drops
and comes back, the link re-establishes without resetting the board.
Sending the state
In loop(), once per second the firmware reads the sensor, formats a compact JSON string, sets
it on the TX characteristic with setValue(), and calls notify() to push it to the
Pi. The isnan() check avoids sending a reading when the sensor glitches.
Link 2 — WiFi
Raspberry Pi → Web client
The second link runs on the Raspberry Pi. The Pi is the BLE client on one side (it scans for the XIAO, connects, and subscribes to its notifications) and a web server on the other side. It receives each JSON line over BLE, keeps the latest value, and serves it over WiFi.
On the WiFi side I use two HTTP mechanisms, the same two the final project uses:
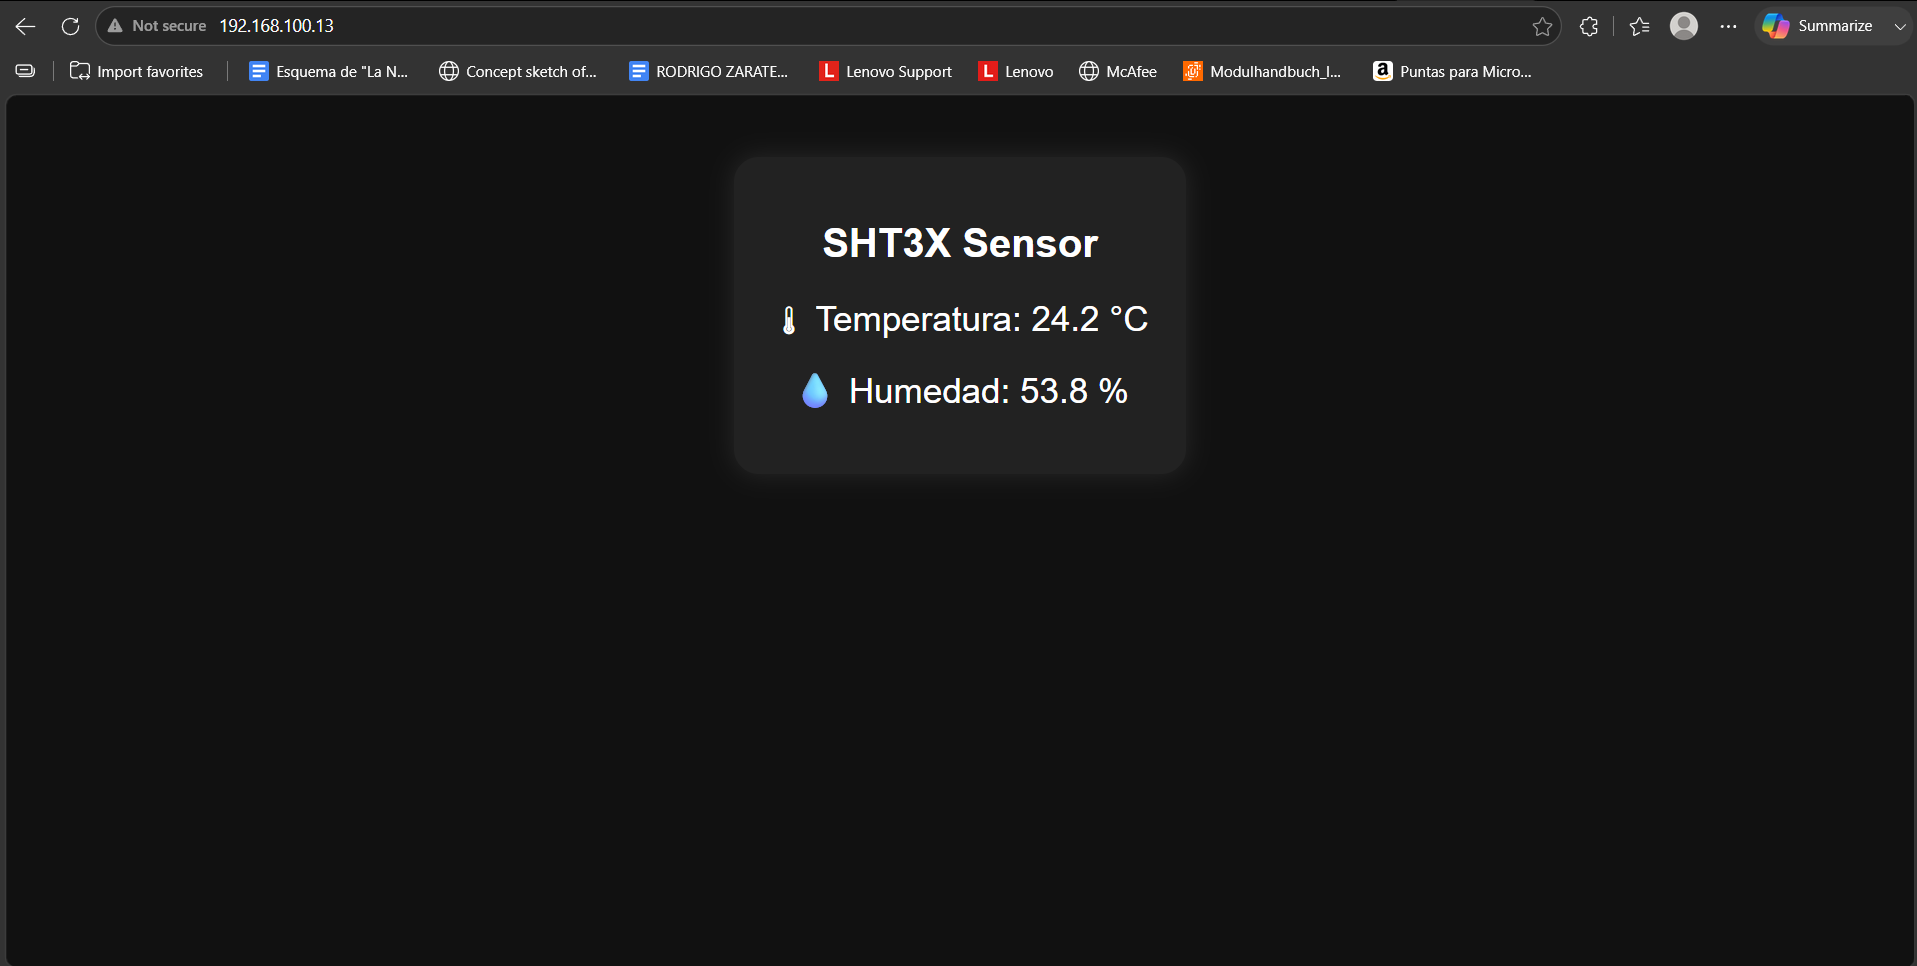
- A plain HTTP page — open the Pi's IP in a browser and you get a page showing the current temperature and humidity. Simple and works on any device with no software.
- A WebSocket — unlike a normal page that has to reload to update, a WebSocket keeps a connection open and lets the server push new data the instant it arrives. This is what the desktop app uses for truly live updates, with no polling.
The difference matters: with plain HTTP the browser asks again every few seconds (request–response, like a normal web page). With a WebSocket the data flows the moment the XIAO sends it, end to end, which is what makes the live dashboard feel instant.
I used Python with FastAPI on the Pi (the same framework as the final project) together with Bleak, a Python BLE library, to connect to the XIAO.
Raspberry Pi Code
Python · FastAPI + Bleak
The gateway script connects to the XIAO over BLE, stores the latest reading, and serves it over WiFi through an HTTP page and a WebSocket. Dependencies:
pip install fastapi "uvicorn[standard]" bleak
import asyncio
import json
from contextlib import asynccontextmanager
from fastapi import FastAPI, WebSocket
from fastapi.responses import HTMLResponse
import uvicorn
from bleak import BleakClient, BleakScanner
# Must match the XIAO firmware
DEVICE_NAME = "FAB_ENCLOSER"
TX_CHAR_UUID = "6e400003-b5a3-f393-e0a9-e50e24dcca9e" # XIAO -> Pi
latest = {"t": None, "h": None} # last reading received over BLE
clients = set() # connected WebSocket clients
loop = None
# ---- BLE side: connect to the XIAO and listen for notifications ----
def on_notify(_char, data: bytearray):
line = data.decode(errors="ignore").strip()
try:
state = json.loads(line)
except json.JSONDecodeError:
return
latest.update(state)
# push to every connected WebSocket client
for ws in list(clients):
asyncio.run_coroutine_threadsafe(ws.send_text(json.dumps(latest)), loop)
async def ble_task():
while True:
device = await BleakScanner.find_device_by_name(DEVICE_NAME, timeout=10)
if device is None:
await asyncio.sleep(3)
continue
try:
async with BleakClient(device) as client:
await client.start_notify(TX_CHAR_UUID, on_notify)
print("Connected to XIAO over BLE")
while client.is_connected:
await asyncio.sleep(1)
except Exception as e:
print("BLE error:", e)
await asyncio.sleep(3) # retry
# ---- WiFi side: HTTP page + WebSocket ----
@asynccontextmanager
async def lifespan(app):
global loop
loop = asyncio.get_event_loop()
asyncio.create_task(ble_task())
yield
app = FastAPI(lifespan=lifespan)
PAGE = """
<!DOCTYPE html><html><head><meta charset='utf-8'>
<meta name='viewport' content='width=device-width, initial-scale=1'>
<title>PrintVault Pro - Live</title></head><body>
<h1>SHT31 via XIAO -> Pi</h1>
<p>Temperature: <span id='t'>--</span> °C</p>
<p>Humidity: <span id='h'>--</span> %</p>
<script>
const ws = new WebSocket('ws://' + location.host + '/ws');
ws.onmessage = (e) => {
const d = JSON.parse(e.data);
if (d.t !== null) document.getElementById('t').textContent = d.t;
if (d.h !== null) document.getElementById('h').textContent = d.h;
};
</script>
</body></html>
"""
@app.get("/", response_class=HTMLResponse)
async def index():
return PAGE
@app.websocket("/ws")
async def ws_endpoint(ws: WebSocket):
await ws.accept()
clients.add(ws)
await ws.send_text(json.dumps(latest)) # send current value immediately
try:
while True:
await ws.receive_text() # keep the connection open
except Exception:
pass
finally:
clients.discard(ws)
if __name__ == "__main__":
uvicorn.run(app, host="0.0.0.0", port=8000)
Raspberry Pi Code Explanation
Analysis
Connecting to the XIAO (BLE client)
ble_task() uses Bleak to scan for the device named FAB_ENCLOSER, connect, and
call start_notify() on the TX characteristic. From then on, every notification the XIAO
pushes triggers on_notify(). If the connection drops, the loop scans and reconnects
automatically — the same resilience the final project needs.
Receiving and storing data
on_notify() decodes the incoming bytes, parses the JSON line, and updates the
latest dictionary. This is the moment the data crosses from the BLE world into the Pi.
Serving the HTTP page
The / route returns a small HTML page. Opening the Pi's IP at port 8000 in a browser loads
this page. The page itself opens a WebSocket back to the Pi.
The WebSocket bridge
The /ws endpoint accepts WebSocket connections and keeps them in a clients set.
Whenever a new BLE reading arrives, on_notify() pushes it to every connected client with
send_text(). Because BLE runs in an asyncio task and the notification callback runs in a
different thread context, run_coroutine_threadsafe() safely hands the message back to the
event loop. The result: the instant the XIAO sends a value, every open browser updates — no refresh, no
polling.
End-to-end data flow
Putting it together
Following a single temperature reading through the whole chain:
| Step | Where | What happens |
|---|---|---|
| 1 | SHT31 → XIAO | The sensor is read over I²C, once per second |
| 2 | XIAO (BLE notify) | The value is packed into JSON and pushed on the TX characteristic |
| 3 | BLE link | The notification travels over Bluetooth Low Energy to the Pi |
| 4 | Raspberry Pi (Bleak) | The notification callback parses the JSON and stores the latest value |
| 5 | Raspberry Pi (FastAPI) | The value is pushed to every connected WebSocket client over WiFi |
| 6 | Browser / app | The page updates the displayed temperature instantly |
Final Result
System Behavior
The final system chains two communication links so that data measured on the XIAO appears live in a browser served by the Raspberry Pi:
- XIAO ESP32-S3 advertising and notifying its state over BLE
- Raspberry Pi 5 connecting to the XIAO as a BLE client and reconnecting automatically
- Raspberry Pi serving an HTTP page and a WebSocket over WiFi on port 8000
- Live temperature and humidity, pushed end to end with no manual refresh
- Accessible from any browser on the same network
Reflection
This week taught me that "networking" isn't only about one device serving a page — it's about choosing the right protocol for each hop and chaining them together. BLE is ideal for the short, local link from the microcontroller to the gateway, while WiFi gives the range and the live push I need to reach a phone or a laptop. Bridging the two on the Raspberry Pi is the core idea behind my whole final project.
Understanding the BLE service/characteristic model, the notify (push) mechanism, and the difference between a request–response HTTP page and a persistent WebSocket gave me the exact tools PrintVault Pro needs: the enclosure's sensor and control data flows from the XIAO, through the Pi, and out to the user in real time.