Telemetry & Logic
Verify accurate execution of the decision matrix comparing local I2C sensor data with Wi-Fi API data without blocking the microcontroller.
Final Project
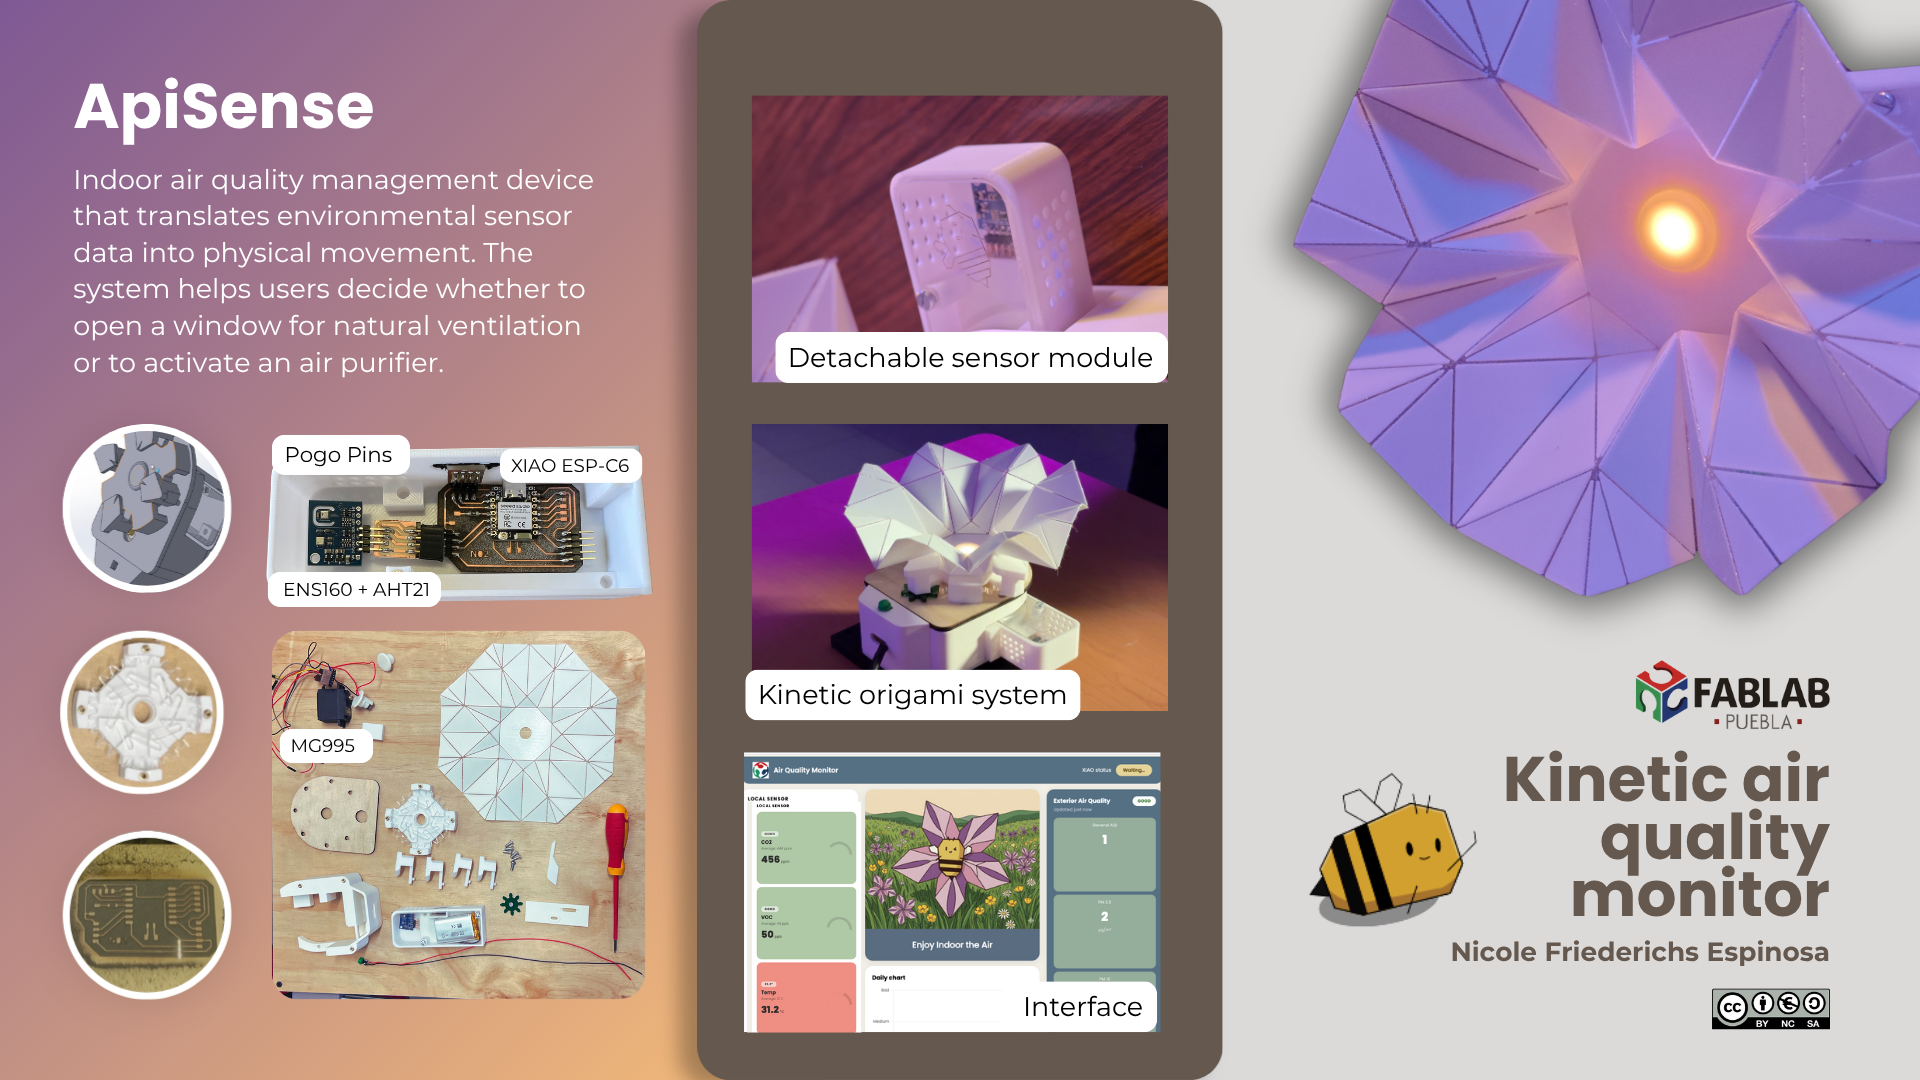
My final proyect consists on a indoor air quality management device that translates environmental sensor data into physical movement. The system helps users decide whether to open a window for natural ventilation or to activate an air purifier.
While exploring everyday environmental problems, I originally considered building an indoor air purifier. But as my research deepened, I identified a more fundamental issue: air purifiers are expensive, and once their filters are saturated with contaminants, they can release those pollutants back into the room, turning a solution into a new problem.
This made me rethink the real question. Before investing in a purifier, you first need to know if you actually need one. Most people have no way to compare the air they breathe indoors against what's outside. Without that comparison, you might ventilate when you shouldn't or keep a window shut when outdoor air is actually cleaner.
That gap is what I decided to address: an indoor–outdoor air quality sensor that gives you objective, real-time data to make an informed decision. During my research into why this matters, I found that:
99% of the population breathes air that exceeds the quality limits recommended by the WHO. On average, people spend approximately 90% of their time indoors, where concentrations of some pollutants are often 2 to 5 times higher than typical outdoor concentrations. Household air pollution was responsible for an estimated 2.9 million deaths per year in 2021, including over 309,000 deaths of children under the age of 5.Factors that contribute to a more dangerous indoor environment:
Young adults, students, and professionals who spend long days in closed rooms, studios, or home offices — and experience fatigue, heavy air, dust, or allergies — looking for an accessible way to understand their environment before taking action.
Effects of pollutants:
Indoor air pollution is not an isolated issue it's a constant condition in the spaces where people study, work, and spend most of their time. But addressing it blindly, without knowing whether opening a window would help or hurt, can make things worse. This confirmed the need for an accessible, portable air quality monitor that empowers users with real, actionable data before any ventilation or purification decision. After defining what I was going to do, I started brainstorming to make the system integration of the project. This helped me to have everything planned and to know elxactly how I was going to develop my project.
To start this project it was very helpfull to have everything planned, but to do that first it had to be clear what I was going to do. That's why I started with defining the concept of the product, which is:
An indoor air quality management device that translates environmental sensor data into physical movement. The system helps users decide whether to open a window for natural ventilation or to activate an air purifier.
Design and build a modular air quality monitor that translates environmental data into physical movement through a kinetic origami panel. The system must integrate local sensor telemetry with external government data to intuitively guide the user on whether to ventilate the room naturally or use an air purifier, while allowing the sensor unit to be easily detached for portable testing across different rooms.
People often lack intuitive, real-time awareness of indoor air quality compared to outdoor conditions. In highly polluted or geographically unique areas, such as Mexico City (CDMX) with severe PM2.5 smog alerts, or Puebla with frequent volcanic ash fall. This lack of information becomes a critical health hazard. Users might open a window believing they are naturally ventilating their room, only to inadvertently draw in hazardous external pollutants, drastically worsening indoor air quality. Furthermore, traditional monitors rely on easily ignored numerical screens that lack actionable context, and being strictly tethered to a wall makes it difficult to evaluate an entire house without purchasing multiple units.
After I had a clear concept I started doing the requirements of the project, some of them were modifyed or added after the risk diagram:
Verify accurate execution of the decision matrix comparing local I2C sensor data with Wi-Fi API data without blocking the microcontroller.
Absence of material tearing, jamming, or servo stalling after repeated expansion and contraction cycles of the origami panel.
Continuous system operation, stable I2C communication, and automatic battery switchover when detaching and reattaching the portable module.
Temperature and humidity readings must remain consistent with ambient room conditions, entirely unaffected by the internal heat generated by the ESP32-C6.
The project is structured into four incremental phases, each building on the validated output of the previous one.
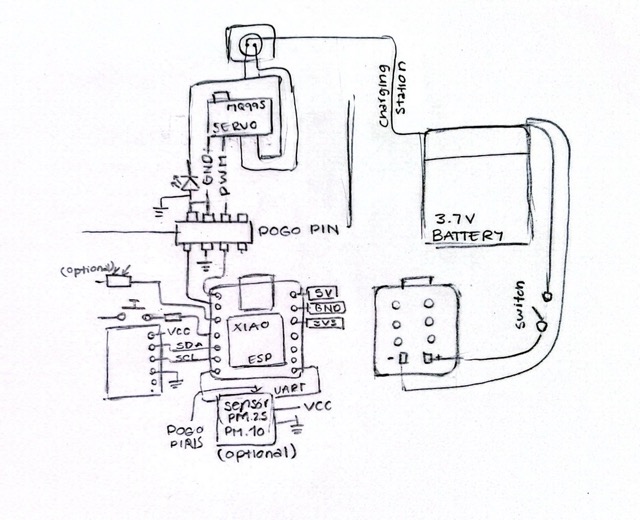
The core hardware stack and the connections planned between them.
The firmware is divided into two logical layers: a backend running on the microcontroller, and a frontend served on demand to the user's browser.
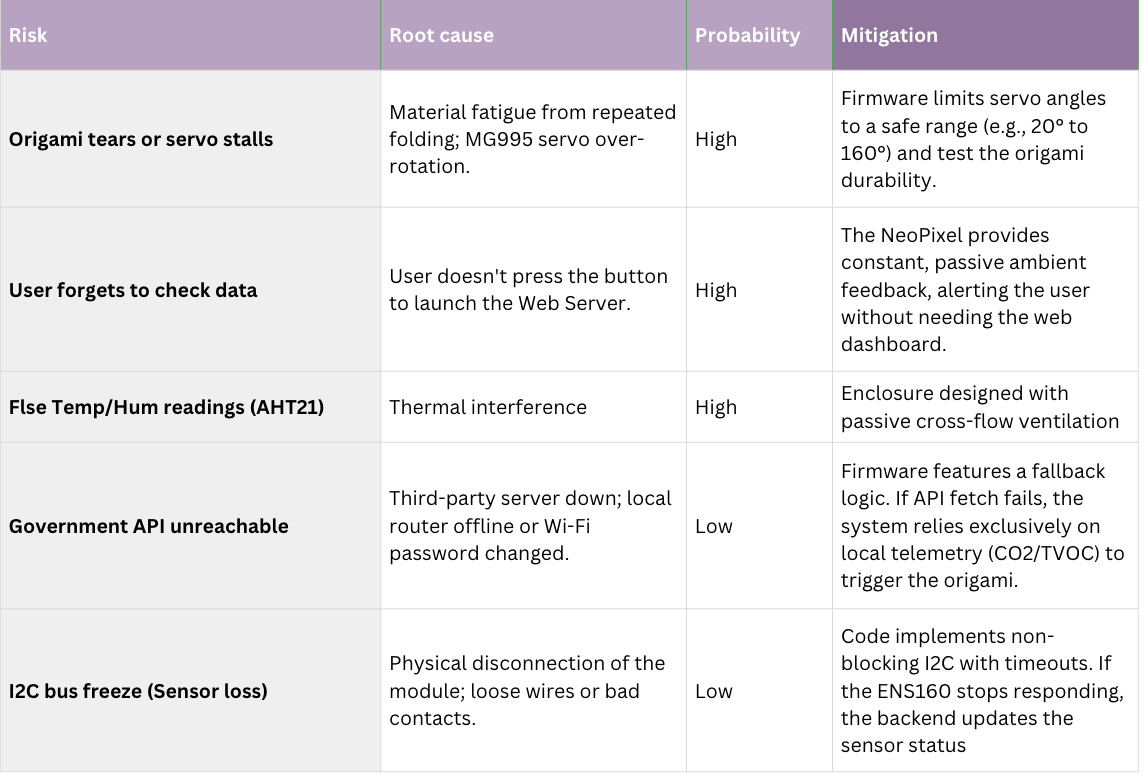
I developed a risk diagram to anticipate everything that could go wrong, staying one step ahead to prevent issues before they occur (I based the information on the diagram on what AI told me it could happen since this is my first project and I only have a general idea of what could go wrong).
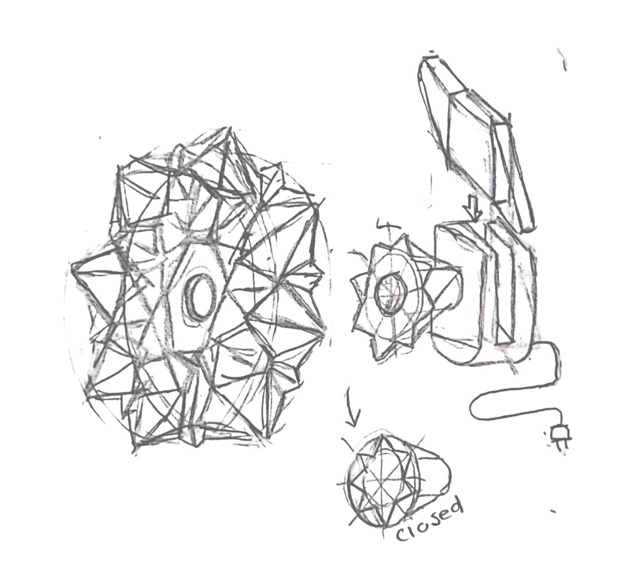
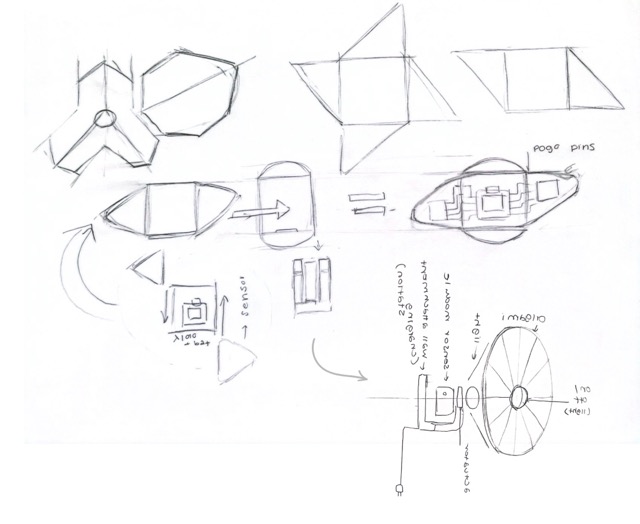
After the risk analysis, I began sketching how the entire system would be integrated, considering enclosure design and the points raised in the risk diagram. I explored several forms for the portable pod, ultimately selecting the shape that resembles the leaves of a flower.
The enclosure combines 3D-printed PLA for the portable pod and the actuator mechanism, with a CNC-cut rigid wood base. Joints rely on M3 screws and brass threaded inserts to ensure durability over repeated disassembly — no adhesives are used.
The pod's geometry incorporates lower side intakes and upper exhaust vents to create passive cross-flow ventilation. This chimney effect successfully isolates the environmental sensors from the heat generated by the ESP32-C6 microcontroller.
An environmental monitoring system that measures indoor air quality, compares it with outdoor data, and generates both a physical and a visual response. The design is split into two attachable modules connected via pogo pins, which allows the main sensor to be portable without interrupting the system's operation.
The portable "brain" of the project. Runs independently on a LiPo battery.
A wall-powered station that charges the top module and powers the high-current components.
My project merges concepts from kinetic art, modular electronics, and environmental monitoring. I drew inspiration from these projects:

I will design a two-part modular system across three layers:
I will design the structural housing for both the base and the portable sensor module, ensuring they mate perfectly using pogo pins. I will also design the kinetic origami pattern that the servo will actuate.
I will design and manufacture two custom PCBs. The first PCB will house the XIAO ESP32-C6, the LiPo battery circuit, and the I2C sensors (ENS160 + AHT21). The second PCB will be located in the base to handle power distribution, servo motor connections, and LED/NeoPixel indicators — including pull-down safety resistors.
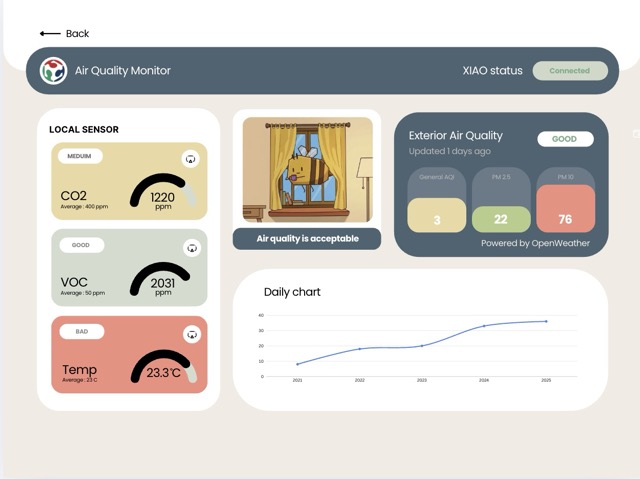
I will design a web interface hosted on Git using HTML, CSS, and JavaScript. This dashboard will use MQTT over WebSockets to graph real-time sensor data, and use fetch() to pull outdoor air quality data from a government API for comparison.
Prices are estimates and will be updated as purchases are made.
| Category | Item | Details | Qty | Unit Price (USD) | Source |
|---|---|---|---|---|---|
| Microcontroller | XIAO ESP32-C6 | Seeed Studio | 1 | $7.18 | Unit Electronics |
| Air Quality Sensor | ENS160 + AHT21 Module | CO₂ + Temp/Hum | 1 | $11.49 | Unit Electronics |
| Motor | Servo MG995 | — | 1 | $5.74 | Fab Lab Inventory |
| Connectors | Pogo Pins (Spring-loaded) | — | 4 | $16.03 | Amazon MX |
| Power | LiPo Battery 3.7 V 2000 mAh | — | 1 | $13.73 | Amazon MX |
| Lighting | NeoPixel Ring / RGB LEDs | WS2812 | 1 | $8.10 | Amazon MX |
| Material | PLA Filament | — | 1 | $20.00 | InovaMarket |
| Switch | Rocker Switch (SPST) | 1-pole, 2-position | 1 | $1.15 | Steren |
| Button | Push Button (round metal) | NO / NC | 1 | $5.69 | Steren |
| Components | SMD Resistors, Pin Headers, Copper Board | Assorted | 1 | $5.00 | Fab Lab Inventory |
Estimated Total: $94.11 USD
To demonstrate individual mastery of Fab Academy skills, this project integrates:
Will the pogo pin connection be stable enough to reliably charge the LiPo battery and maintain signal integrity when the module is docked?
Can the origami structure withstand repeated physical expansion and contraction over time without the material wearing out or tearing?
Will the pull-down resistor safety mechanism respond fast enough to prevent the servo and lights from acting erratically the exact moment the top module is detached?
The project will be evaluated using a spiral development approach, establishing a Minimum Viable Product (MVP) to ensure core Fab Academy requirements are met first, with more complex integrations as secondary goals.
After weeks of design, fabrication, programming, and iteration, here is the complete working system.
A one-minute overview showing the full system in operation: sensor readings, NeoPixel feedback, origami actuation, and the live web interface.
Project summary poster covering the concept, system architecture, fabrication methods, and results.
Project License
// Modular Active Air Quality Monitor //
© 2026 Nicole Friederichs Espinosa //
Non-commercial use only.
This work may be reproduced, modified, distributed, performed, and displayed for non-commercial purposes only, but must acknowledge "Modular Active Air Quality Monitor" by Nicole Friederichs Espinosa. Any commercial use of this work or its derivatives, including sale, monetization, or incorporation into a product or service offered for compensation, requires prior written permission from the author.
Copyright is retained and must be preserved in all copies and derivatives. No patent, trademark, or other intellectual property rights beyond those stated here are granted; all rights not expressly granted are reserved.
This project has not been certified for electrical safety or any regulatory standard and is intended for educational and personal use only; it is provided as-is, no warranty is provided, and users accept all liability.