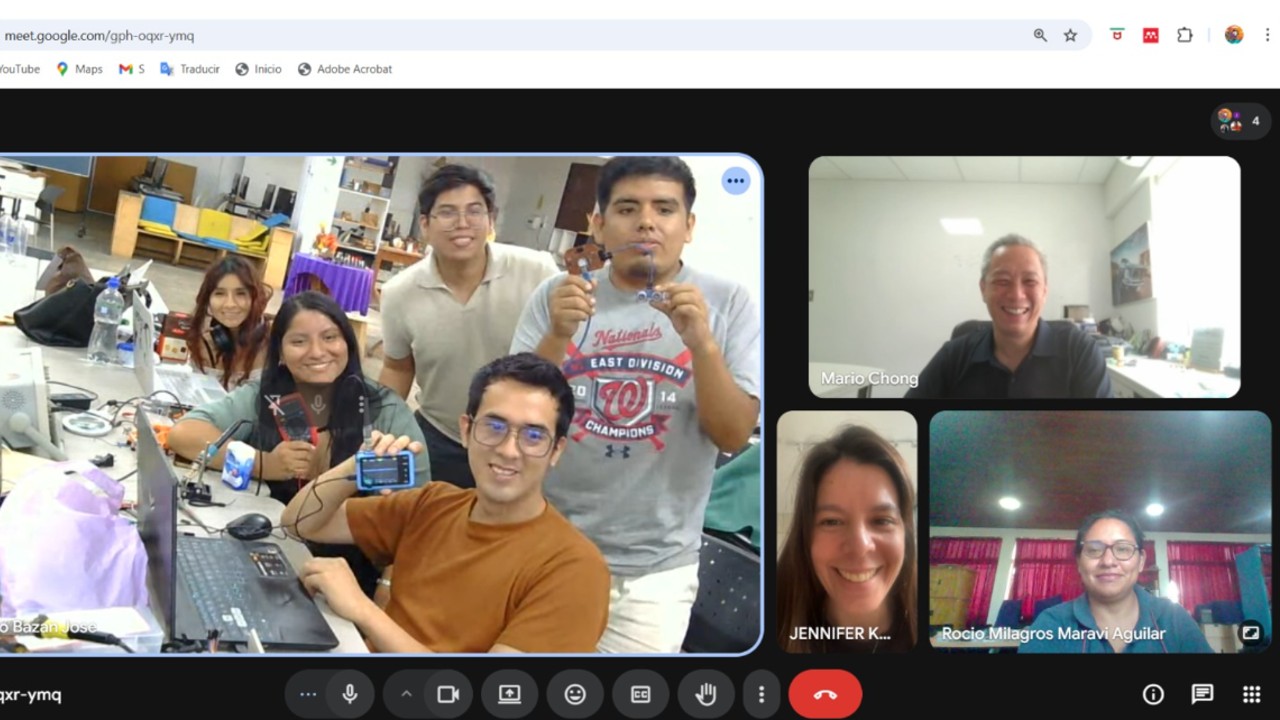
For the group part, since I am in Madre de Dios and could not travel to Lima due to work-related reasons, I connected virtually with my classmates in order to develop the work, and I learned a lot during those sessions, which helped me in the development of the individual work.
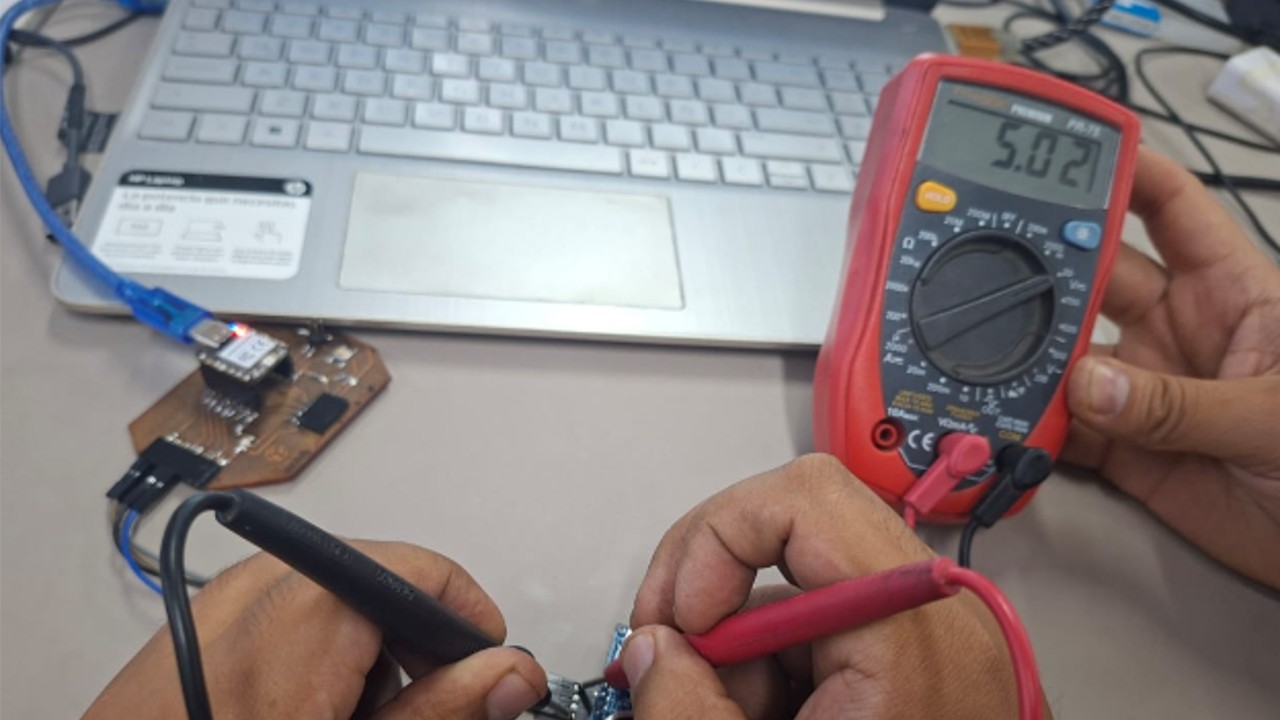
In this group work, we used laboratory measurement tools to analyze input devices using a microcontroller board specifically designed for this purpose. To do this, we verified the operation of sensors using a board based on the Seeed Studio XIAO RP2040 microcontroller, together with an HC-SR04 ultrasonic distance sensor and an LDR LM393 photoresistor. In addition, we analyzed the obtained signals using a multimeter and an oscilloscope, which allowed us to observe their behavior in real time.
Equipment used
Tool
Model
Use
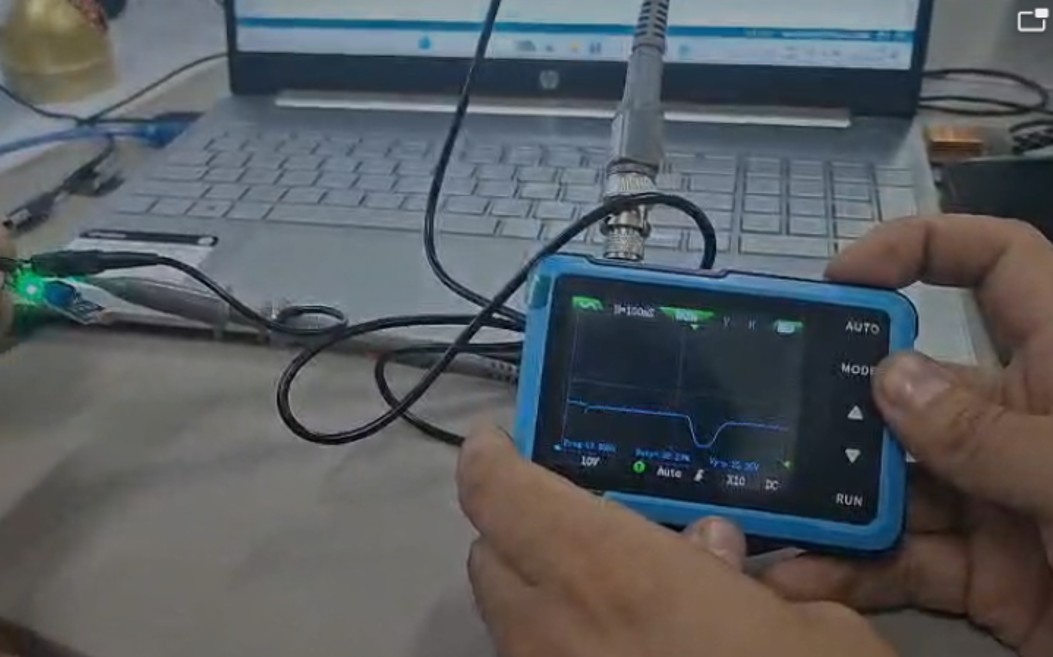
Portable mini digital oscilloscope
DSO152 FNIRSI
Visualize waveforms, verify voltages, and signal stability
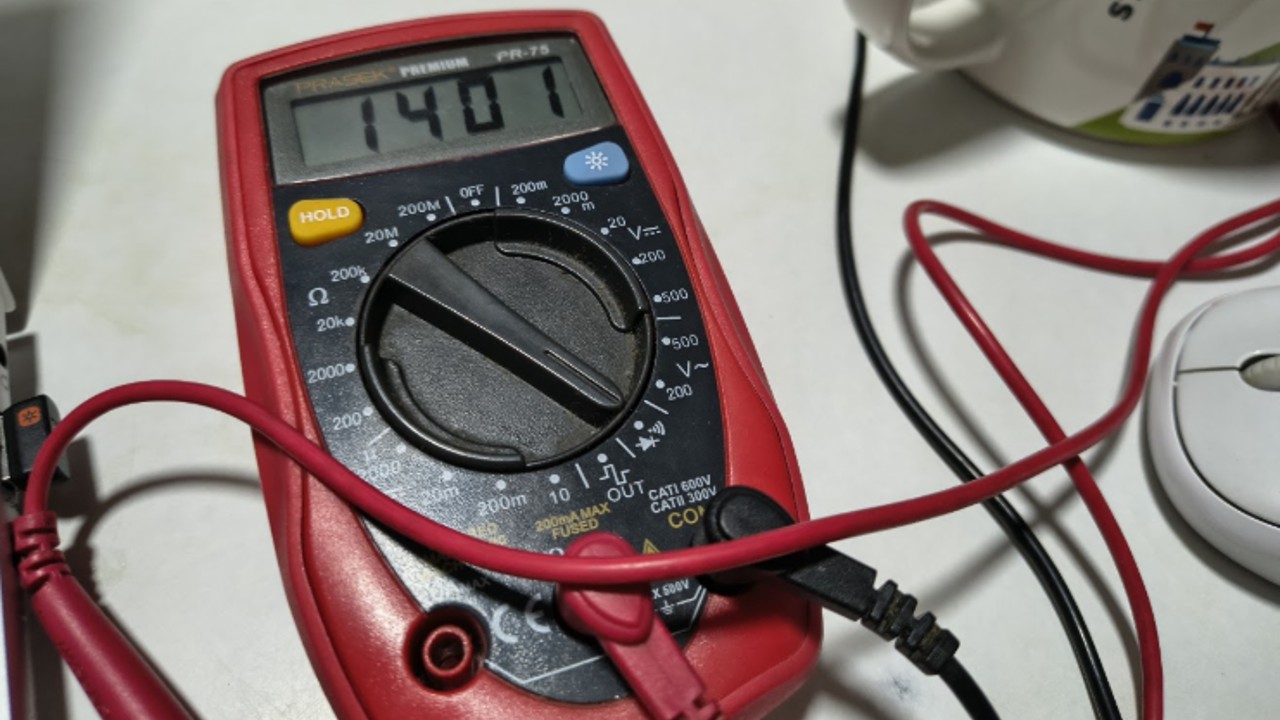
Digital multimeter
PR-75
Verify power supply, continuity, and rule out short circuits
Microcontroller board
PCB with XIAO RP2040
Generate and measure signals
Power supply
USB
Power and program the board
Img 1
Img 2
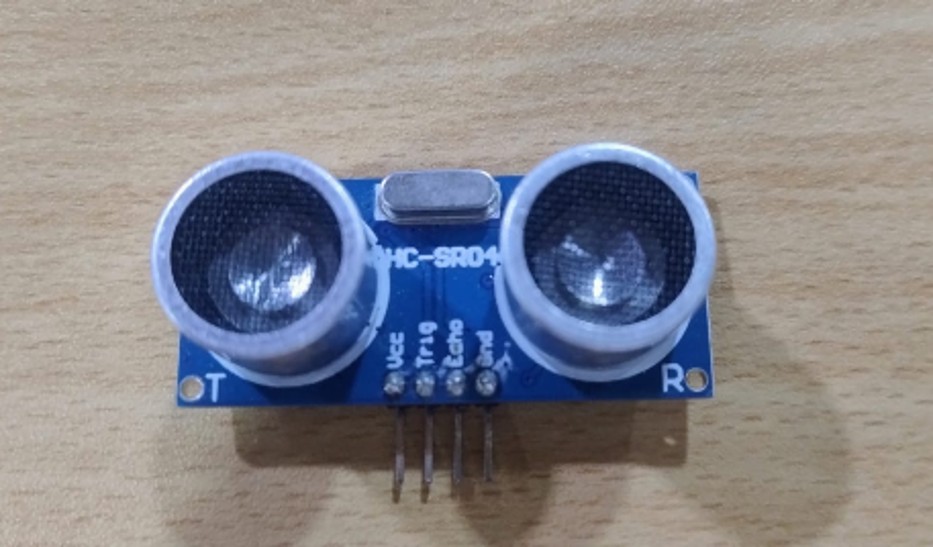
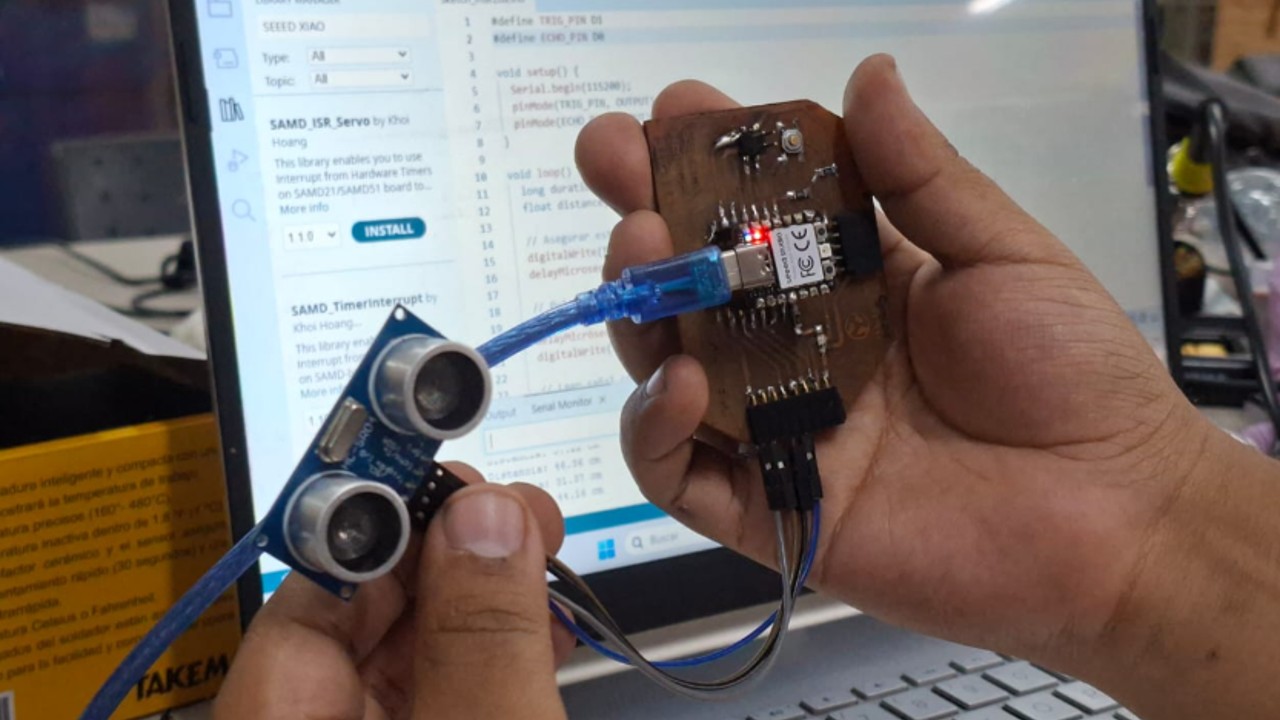
a) Procedure 1: Digital input (HC-SR04)
First, we reviewed the specifications of the HC-SR04 ultrasonic sensor, which works through the Trigger and Echo pins to measure distances by calculating the return time of the signal.
Img 3
Then we made the connection:
VCC → 5V
Trigger → output signal
Echo → input signal
GND → ground
Later, we programmed the board in Arduino IDE and observed the distance values in the serial monitor. This allowed us to verify the correct operation of the sensor and validate the input signal.
Results:
Variations in the distance in centimeters were observed when changing the position of the object, confirming that the sensor was working correctly.
Learnings:
Connecting sensors to a custom board
Reading technical specifications
Using the XIAO RP2040 with digital sensors
Verifying signals through Arduino
Img 4
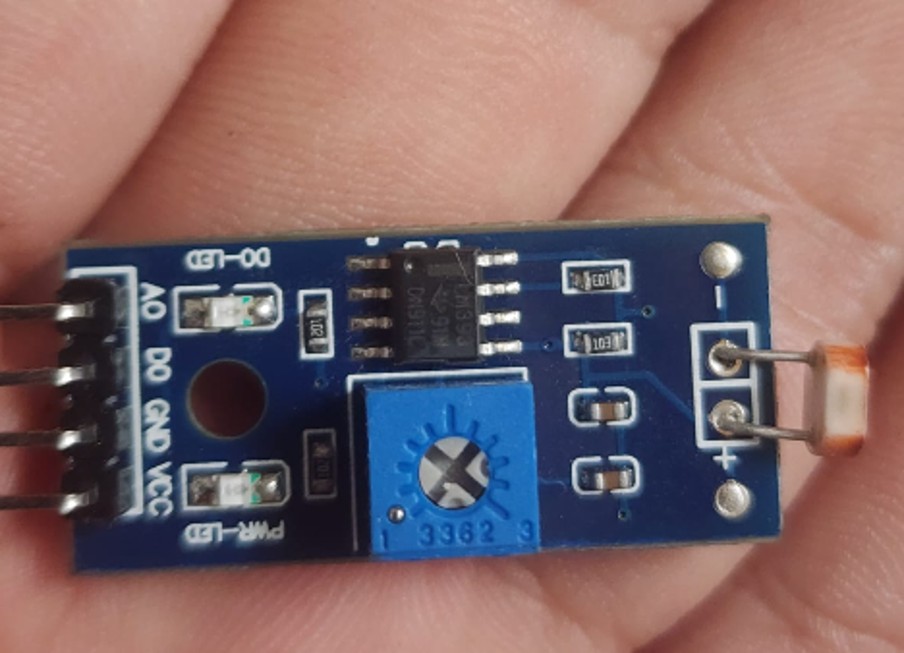
b) Procedure 2: Analog input (LDR LM393)
In this case, we analyzed a light sensor (LDR LM393), which allows light intensity to be measured through an analog and digital output.
Img 5
We connected the sensor as follows:
VCC → 5V
DO → digital output
A0 → analog output
GND → ground
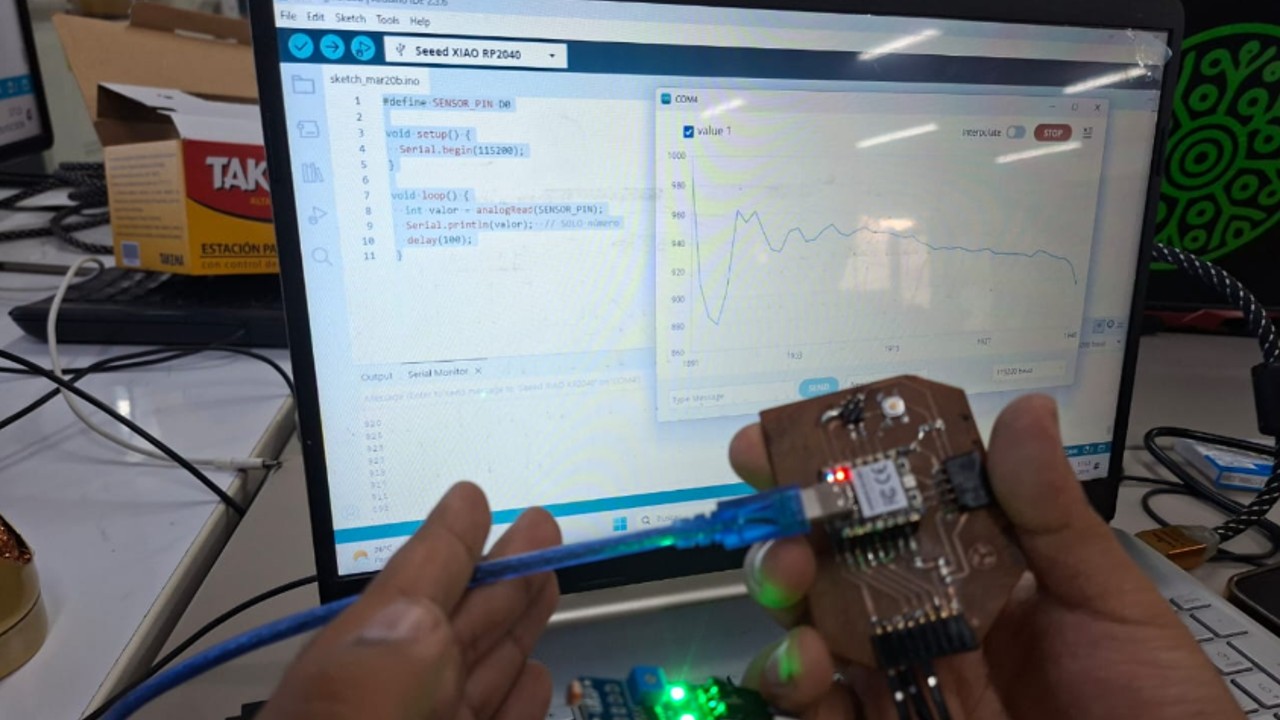
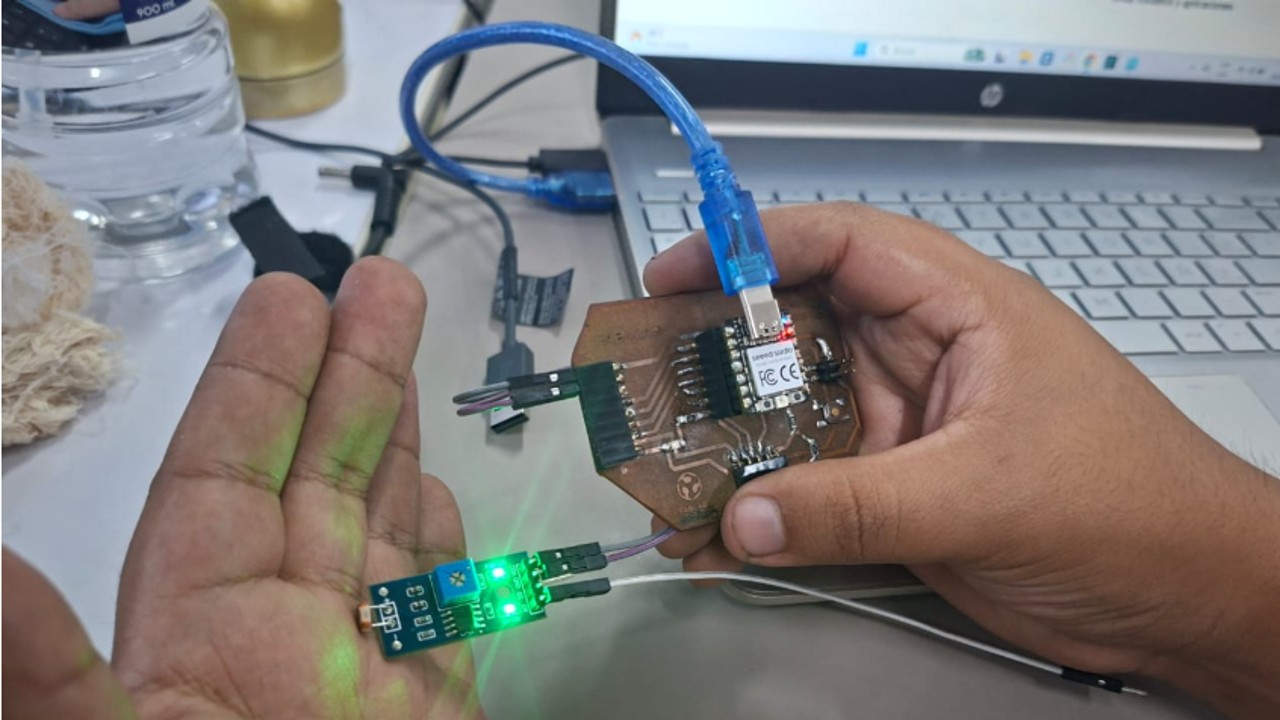
Then we programmed the XIAO RP2040 to read analog values and visualize the data in the serial monitor.
Results:
Changes in the values were observed depending on the amount of light, confirming the correct functioning of the sensor.
Learnings:
Use of analog sensors
Reading values with Arduino
Interpretation of variable signals
Use of the portable oscilloscope
Img 6
Img 7
Img 8
c) Difficulties encountered
During the process we faced several problems:
At first, we did not know the sensors (HC-SR04 and LDR LM393)
Errors in the connections
Incorrect use of pins (D1 was used instead of D0 at the beginning)
After reviewing the connections and correcting the pins, we managed to obtain correct results.
d) Tips and recommendations
Multimeter
Verify VCC and GND before measuring
Use continuity mode to detect short circuits
Confirm a good ground connection
Oscilloscope
Connect GND first
Start with safe scales (1 V/div, 1 ms/div)
Use trigger to stabilize the signal
Adjust manually after autoset
Important:
Always review the device specifications:
VCC
GND
Outputs
Datasheet
e) Key lesson
First, the power supply must be verified and short circuits ruled out with the multimeter, and then the oscilloscope must be used correctly configured to observe clean signals and validate the operation of the circuit.
f) Conclusions
This activity made it possible to understand how to safely verify a board before measuring signals, how to correctly connect an oscilloscope, and how to interpret digital and analog signals in real hardware.
We also learned that a correct ground connection, the proper selection of GPIO pins, and a good oscilloscope configuration are essential to obtain reliable measurements and validate the operation of the system.
II) Individual Assignment
I worked on the board that I produced in week 8. For this, I used 2 sensors related to my final project, and in this case I got the sensors.
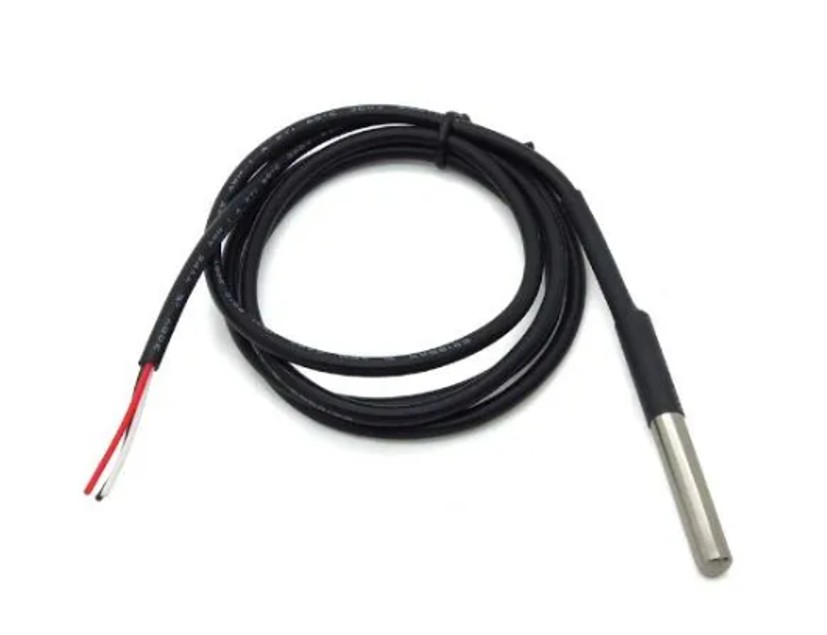
a) Digital temperature sensor DS18B20
The DS18B20 sensor is a digital device widely used for temperature measurement in electronic projects, both at the academic and industrial level. It is characterized by its ease of use, high precision, and its ability to communicate through the 1-Wire protocol, which allows the use of a single microcontroller pin for data transmission.
One of its main advantages is that each sensor has a unique 64-bit identifier, which allows multiple sensors to be connected on the same bus without interference. In addition, it can work with different microcontrollers such as Arduino, ESP32, or Raspberry Pi, which makes it a versatile solution for monitoring systems. More information here:
https://naylampmechatronics.com/blog/46_tutorial-sensor-digital-de-temperatura-ds18b20.html
Img 9
Main features
Measurement range: -55 °C to +125 °C
Accuracy: ±0.5 °C in the range from -10 °C to 85 °C
Resolution: Programmable from 9 to 12 bits
Operating voltage: 3.0 V to 5.5 V
Communication protocol: 1-Wire (only requires one data pin)
Conversion time: up to 750 ms depending on the resolution
Unique identification: internal 64-bit code for multiple sensors
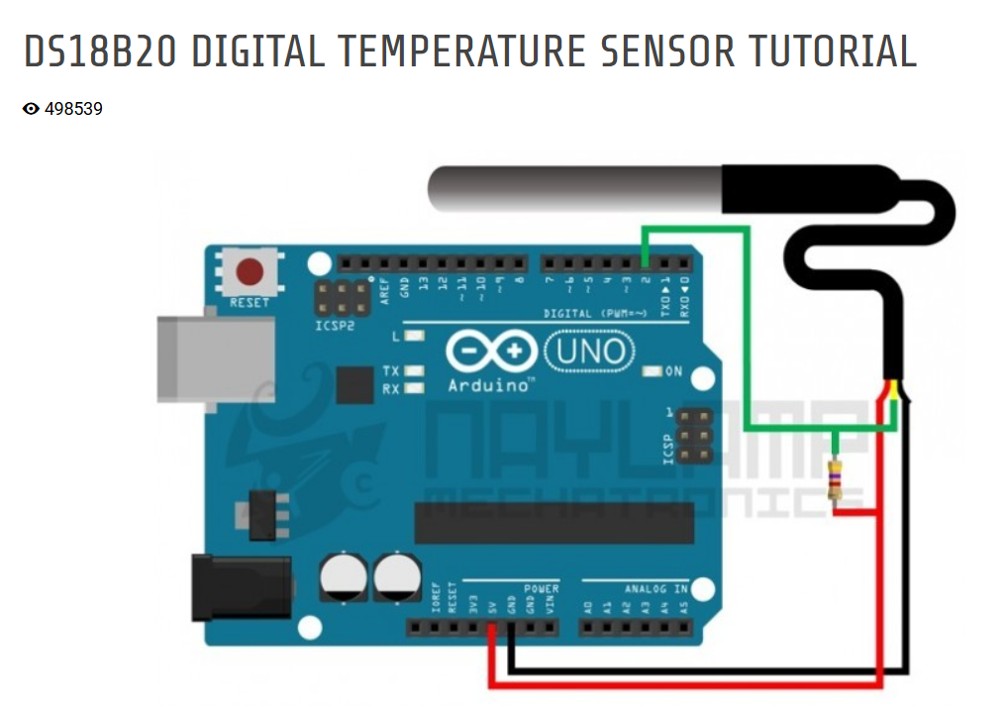
Operation
The sensor measures temperature and directly converts it into a digital signal, eliminating the need for external analog converters. This information is transmitted to the microcontroller through the 1-Wire protocol, which considerably simplifies the wiring.
In addition, it can operate in normal power mode or in parasite mode, where it is powered directly from the data line, further reducing the number of required connections.
Img 10
Useful life
The DS18B20 is a sensor designed for long-term applications. Its useful life depends mainly on the conditions of use (temperature, humidity, and physical protection), but under normal conditions it can operate for several years without significant degradation, especially in encapsulated or waterproof versions that protect the sensor from external environments.
Applications
Environmental monitoring systems
Temperature control in industrial processes
Home automation systems
HVAC systems (heating and ventilation)
Liquid temperature measurement (waterproof version)
Advantages
High precision and stability
Easy connection (only one pin)
Possibility of using multiple sensors
Compatible with many microcontrollers
Available in a waterproof version
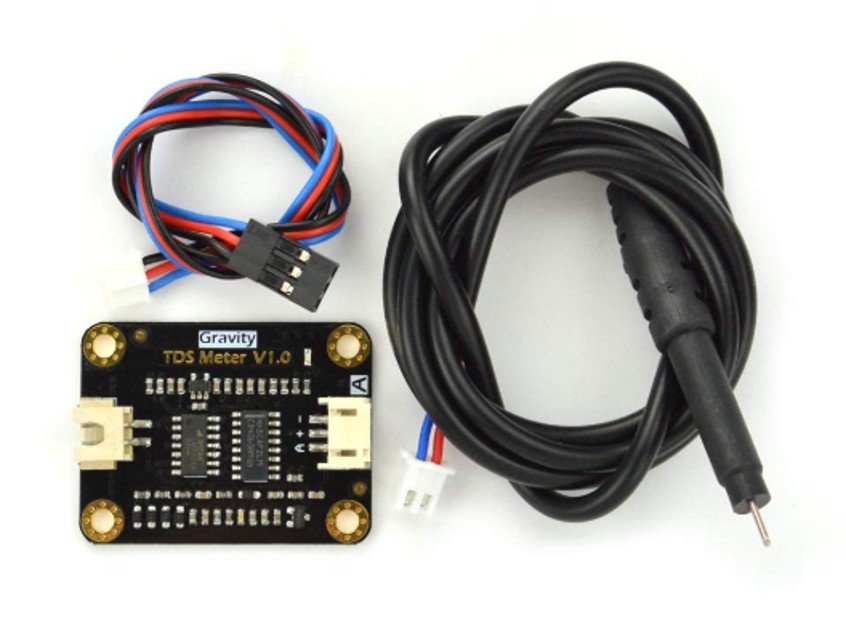
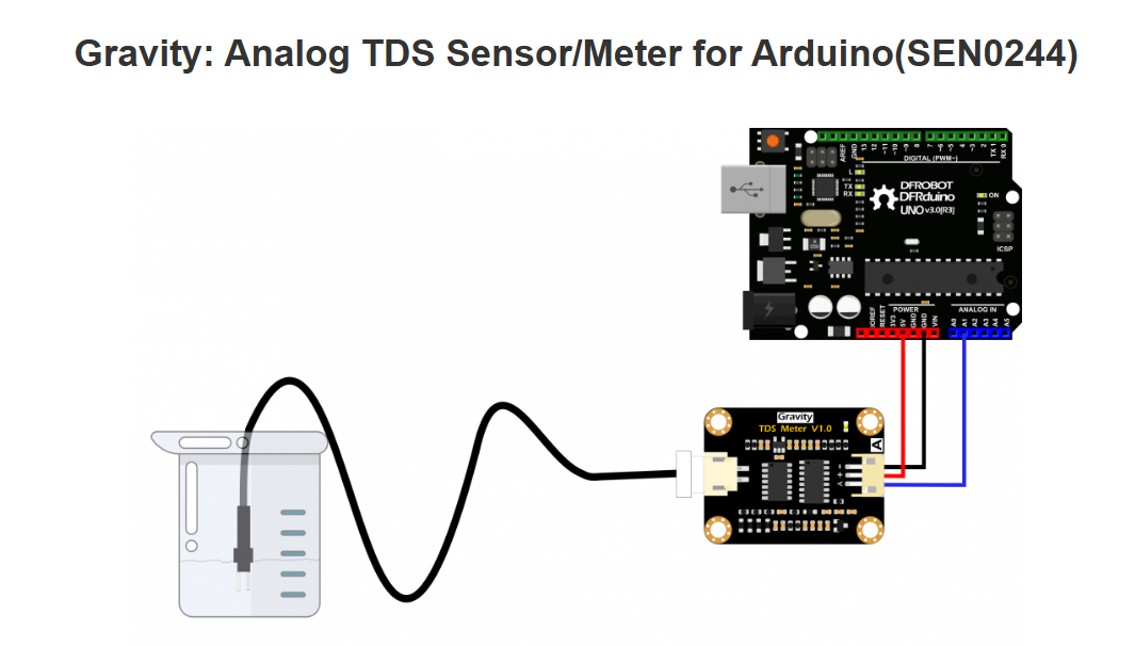
b) Water quality sensor Gravity TDS Meter V1.0
The sensor used is the Gravity TDS Meter V1.0, a device designed to measure the amount of total dissolved solids (TDS) in water. This type of sensor is widely used in applications such as water quality monitoring, hydroponic systems, aquariums, and environmental projects.
This system is composed of two main parts:
A submersible probe, which is responsible for performing the measurement in the water
An electronic module (Gravity TDS Meter V1.0), which processes the obtained signal
Measurement type: electrical conductivity of water
Probe: waterproof, suitable for immersion
Technology: AC signal to avoid polarization
Operation
The sensor measures the electrical conductivity of water through its probe. Dissolved solids (salts, minerals, nutrients) increase conductivity, which makes it possible to estimate the TDS concentration.
Higher conductivity → higher TDS
Lower conductivity → purer water
The probe generates a signal that is processed by the module, which delivers an analog voltage proportional to the TDS level.
It is important to highlight that:
The probe performs the measurement directly in the water
The electronic module processes and stabilizes the signal
Img 12
Important technical detail
The Gravity TDS Meter V1.0 module uses alternating current (AC) excitation, which allows:
Preventing electrode corrosion
Reducing polarization
Improving measurement stability
This increases the reliability of the sensor in continuous measurements.
Useful life
The sensor has a long useful life, especially thanks to the use of AC signal. However, its duration depends on factors such as:
Water quality (content of salts or chemicals)
Frequency of use
Cleaning and maintenance of the probe
Under normal conditions, it can operate for several years without significant degradation.
Important considerations
The probe is waterproof, but the electronic module is not
Do not use in liquids with temperatures above 55 °C
Avoid impacts or dirt on the probe
Calibration is recommended to obtain greater accuracy
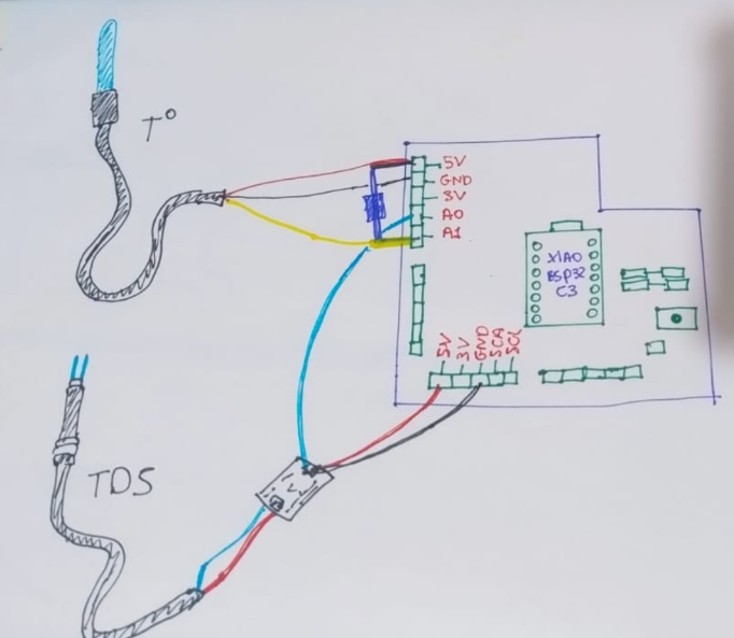
On my board I connected a DS18B20 temperature sensor and a Gravity TDS Meter V1.0 water quality sensor. The temperature sensor was connected to pin A0, in addition to 5V and GND, using a 4.7 kΩ pull-up resistor between 5V and A0 to ensure a stable reading in the sensor communication. On the other hand, the TDS sensor was connected to pin A1, together with 5V and GND.
From this practice I better understood how to integrate analog and digital sensors to a board designed by myself, and I also understood that it is not enough to make the physical connection: it is necessary to carefully review the pin assignment, the power supply, and the reading logic in the code in order to obtain correct data. In particular, I learned that the TDS sensor depends on temperature to obtain a more precise measurement, so it was important to integrate both sensors in the same system.
Img 13
Img 14
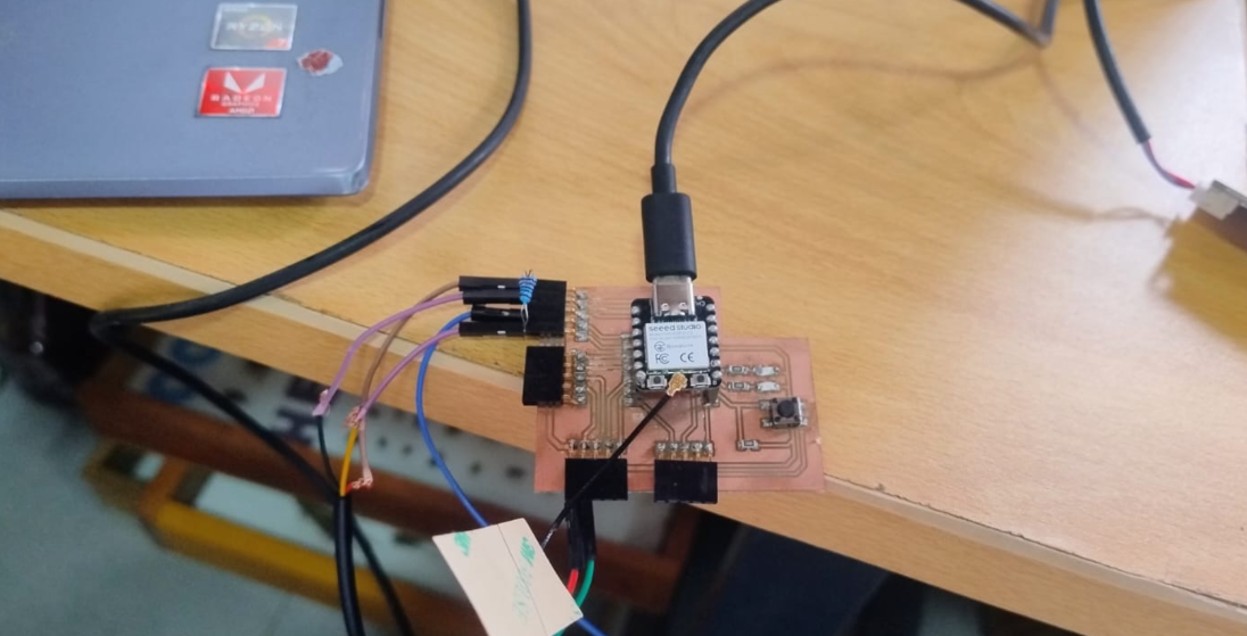
Connection process
The connection of the sensors did not generate many problems for me, since I followed the tutorials for each device and respected their basic power and signal connections. In the case of the DS18B20, it was important to consider the 4.7 kΩ pull-up resistor, while the TDS module only required its analog output, power, and ground.
Thanks to this, I managed to mount both sensors on my board and leave them ready for the programming and testing stage, although I see them as messy, but it has helped me understand that I must redesign my board for my final project.
Img 15
How the code works
To make both sensors work, I used a code that a friend from Systems Engineering helped me correct. The program was developed for a XIAO ESP32-C3 board and integrates three main functions: reading the DS18B20 temperature sensor, reading the TDS sensor, and controlling two LEDs through a button.
First, the code defines the pins used by each component: the DS18B20, the TDS, the button, and the LEDs. Then it initializes the libraries required for communication with the temperature sensor and configures the internal memory to store the calibration value of the TDS.
During execution, the program performs periodic readings of temperature and the analog value of the TDS sensor. To improve the stability of the TDS measurement, the code takes several readings, calculates an average, and then applies a compensation according to the temperature recorded by the DS18B20. This is important because the conductivity of water changes with temperature, and therefore the TDS value needs to be corrected to be more reliable.
In addition, the program includes a serial port calibration routine, which allows the K factor of the sensor to be adjusted using a known solution. It also controls two LEDs with a button: when the button is pressed, the LEDs turn on; when it is released, they turn off.
/*******
TDS Meter + DS18B20 + LED Control with Button
For XIAO ESP32-C3
Functionalities:
- TDS reading (dissolved solids)
- Temperature reading with DS18B20
- LED control on D9 and D10 with button on D8
- Calibration and configuration through serial port
******/
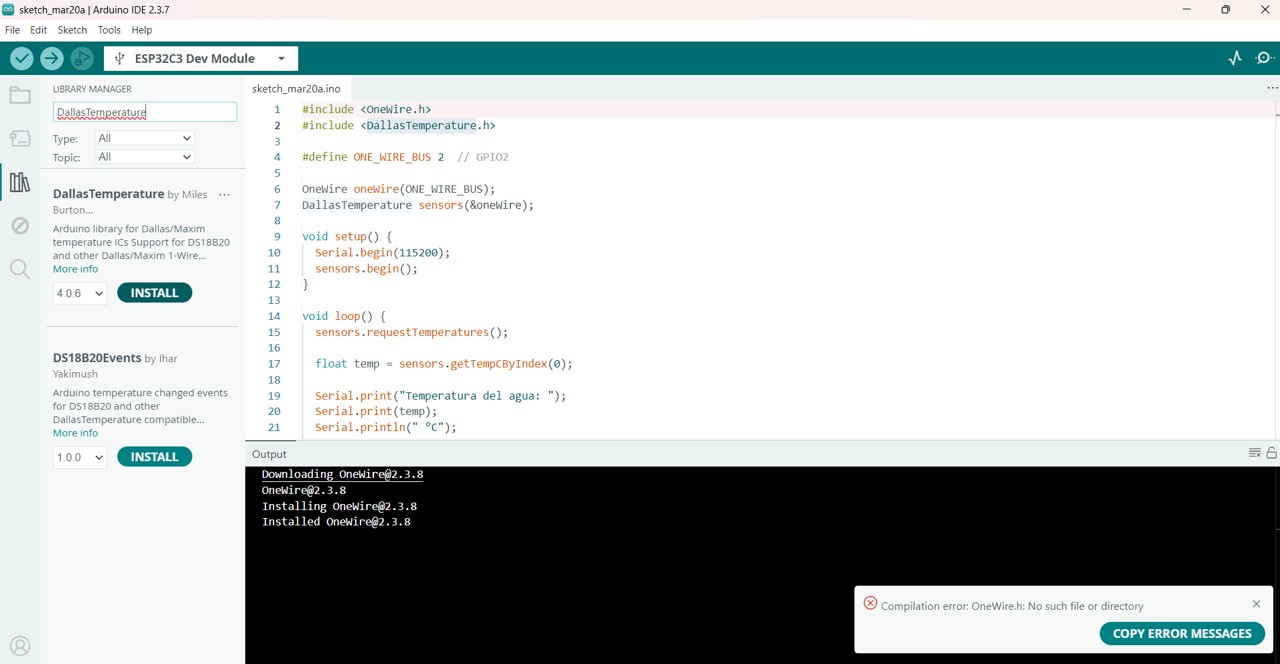
#include <OneWire.h>
#include <DallasTemperature.h>
#include <Preferences.h>
// ============ PINS ============
// For XIAO ESP32-C3:
// A0 = GPIO0, A1 = GPIO1, D8 = GPIO21, D9 = GPIO22, D10 = GPIO23
#define DS18B20_PIN A1 // GPIO1 (previously A1) - Temperature sensor
#define TDS_PIN A0 // GPIO0 (previously A0) - TDS sensor (analog)
const int BOTON_PIN = 8; // GPIO21 (previously D8) - Control button
const int LED1_PIN = 9; // GPIO22 (previously D9) - LED 1
const int LED2_PIN = 10; // GPIO23 (previously D10) - LED 2
// ============ OBJECTS ============
OneWire oneWire(DS18B20_PIN);
DallasTemperature ds18b20(&oneWire);
Preferences preferences;
// ============ TDS VARIABLES ============
float kValue = 1.0;
float temperature = 25;
float tdsValue = 0;
float voltage = 0;
int adcValue = 0;
// ============ LED VARIABLES ============
bool lastButtonState = HIGH;
unsigned long lastDebounceTime = 0;
const unsigned long debounceDelay = 50;
// ============ TIMING ============
unsigned long lastReadTime = 0;
const unsigned long readInterval = 2000;
void setup() {
Serial.begin(115200);
delay(1000);
// ============ CONFIGURE LEDs ============
pinMode(LED1_PIN, OUTPUT);
pinMode(LED2_PIN, OUTPUT);
digitalWrite(LED1_PIN, LOW);
digitalWrite(LED2_PIN, LOW);
// ============ CONFIGURE BUTTON ============
pinMode(BOTON_PIN, INPUT_PULLUP); // Internal pull-up, button connects to GND
// ============ CONFIGURE TDS ============
preferences.begin("tds", false);
kValue = preferences.getFloat("kvalue", 1.0);
preferences.end();
if (kValue < 0.1 || kValue > 10) {
kValue = 1.0;
Serial.println("⚠️ Using default K factor: 1.0");
} else {
Serial.print("✅ Loaded K factor: ");
Serial.println(kValue, 4);
}
// ============ CONFIGURE DS18B20 ============
ds18b20.begin();
int deviceCount = ds18b20.getDeviceCount();
Serial.println("\\n╔════════════════════════════════════════════════╗");
Serial.println("║ TDS Meter + LEDs - XIAO ESP32-C3 ║");
Serial.println("╠════════════════════════════════════════════════╣");
Serial.print("║ DS18B20: GPIO1 ");
if (deviceCount > 0) {
Serial.println(" ✅ ║");
} else {
Serial.println(" ❌ ║");
}
Serial.println("║ TDS: GPIO0 ║");
Serial.println("║ Button: GPIO21 (pushbutton to GND) ║");
Serial.println("║ LED 1: GPIO22 ║");
Serial.println("║ LED 2: GPIO23 ║");
Serial.print("║ K Factor: ");
Serial.print(kValue, 4);
Serial.println(" ║");
Serial.println("╚════════════════════════════════════════════════╝");
if (deviceCount == 0) {
Serial.println("\\n⚠️ DS18B20 not detected. Using fixed temperature 25°C");
} else {
Serial.print("\\n✅ DS18B20 detected (");
Serial.print(deviceCount);
Serial.println(" device)\\n");
}
analogReadResolution(12);
Serial.println("\\n📌 AVAILABLE COMMANDS:");
Serial.println(" cal:707 - Calibrate TDS with 707 ppm buffer");
Serial.println(" reset - Reset TDS calibration");
Serial.println(" show - Show current configuration");
Serial.println(" temp - Read temperature manually");
Serial.println("\\n🔘 Button on GPIO21: keep pressed to turn LEDs on\\n");
}
void loop() {
// ============ 1. SENSOR READING ============
unsigned long now = millis();
if (now - lastReadTime >= readInterval) {
lastReadTime = now;
// Read temperature
ds18b20.requestTemperatures();
float temp = ds18b20.getTempCByIndex(0);
if (temp != DEVICE_DISCONNECTED_C && !isnan(temp) && temp > -50 && temp < 125) {
temperature = temp;
}
// Read TDS (average of 10 readings)
long sumADC = 0;
for (int i = 0; i < 10; i++) {
sumADC += analogRead(TDS_PIN);
delay(5);
}
adcValue = sumADC / 10;
voltage = adcValue * (2.5 / 4095.0);
// Calculate TDS
if (voltage >= 0.01 && voltage <= 2.4) {
float v = voltage;
float v3 = v * v * v;
float v2 = v * v;
float tdsRaw = (133.42 * v3 - 255.86 * v2 + 857.39 * v) * kValue;
float tempComp = 1.0 + 0.02 * (temperature - 25.0);
tdsValue = tdsRaw / tempComp;
if (tdsValue < 0) tdsValue = 0;
} else if (voltage < 0.01) {
tdsValue = 0;
} else {
tdsValue = 9999;
}
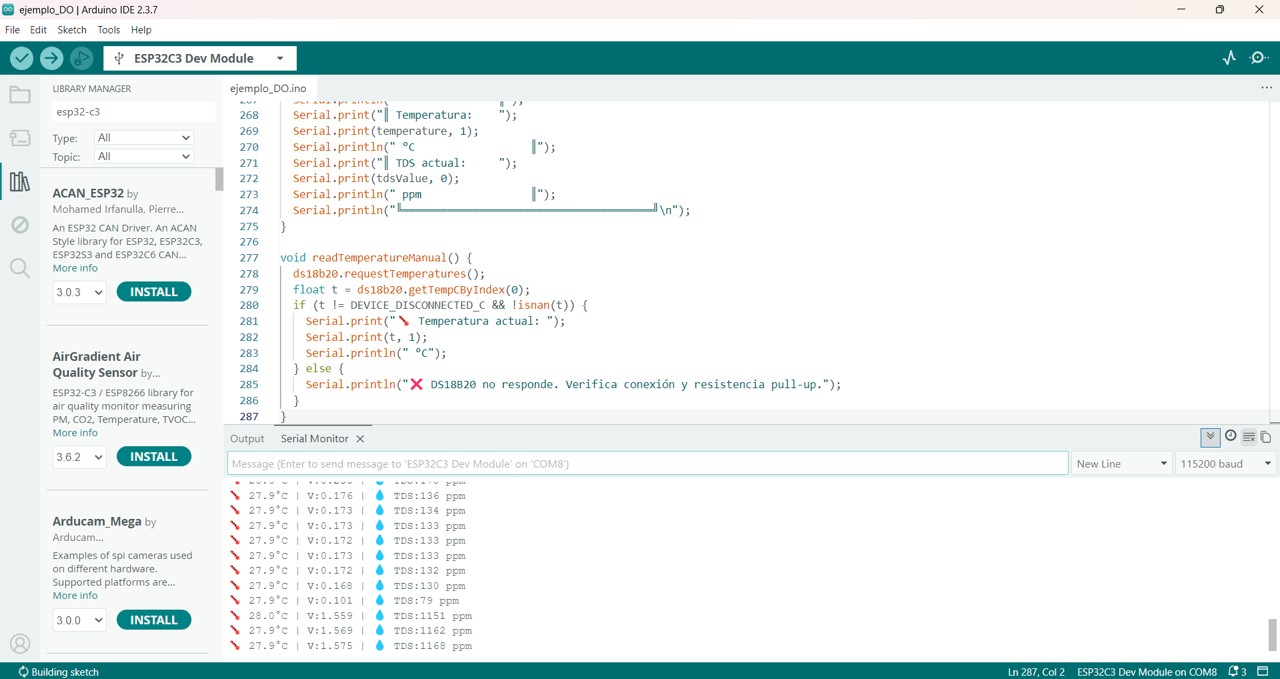
// Show on serial monitor
Serial.print("🌡️ ");
Serial.print(temperature, 1);
Serial.print("°C | V:");
Serial.print(voltage, 3);
Serial.print(" | 💧 TDS:");
Serial.print(tdsValue, 0);
Serial.println(" ppm");
}
// ============ 2. LED CONTROL WITH BUTTON ============
int estadoBoton = digitalRead(BOTON_PIN);
if (estadoBoton == LOW) {
digitalWrite(LED1_PIN, HIGH);
digitalWrite(LED2_PIN, HIGH);
if (lastButtonState == HIGH) {
if ((now - lastDebounceTime) > debounceDelay) {
lastDebounceTime = now;
Serial.println("🔘 Button PRESSED → LEDs ON");
}
}
} else {
digitalWrite(LED1_PIN, LOW);
digitalWrite(LED2_PIN, LOW);
if (lastButtonState == LOW) {
if ((now - lastDebounceTime) > debounceDelay) {
lastDebounceTime = now;
Serial.println("⚪ Button RELEASED → LEDs OFF");
}
}
}
lastButtonState = estadoBoton;
// ============ 3. SERIAL COMMANDS ============
if (Serial.available()) {
String cmd = Serial.readStringUntil('\\n');
cmd.trim();
cmd.toLowerCase();
if (cmd == "cal:707") {
calibrateTDS();
} else if (cmd == "reset") {
resetCalibration();
} else if (cmd == "show") {
showConfig();
} else if (cmd == "temp") {
readTemperatureManual();
} else {
Serial.println("Unknown command. Use: cal:707, reset, show, temp");
}
}
}
void calibrateTDS() {
Serial.println("\\n=== TDS CALIBRATION ===");
Serial.println("Immerse probe in 707 ppm buffer");
Serial.println("Waiting 10 seconds...");
delay(10000);
long sumADC = 0;
for (int i = 0; i < 20; i++) {
sumADC += analogRead(TDS_PIN);
delay(100);
Serial.print(".");
}
Serial.println();
adcValue = sumADC / 20;
voltage = adcValue * (2.5 / 4095.0);
float v = voltage;
float v3 = v * v * v;
float v2 = v * v;
float tdsRaw = (133.42 * v3 - 255.86 * v2 + 857.39 * v);
float tempComp = 1.0 + 0.02 * (temperature - 25.0);
float measuredTDS = tdsRaw / tempComp;
if (measuredTDS > 0) {
kValue = 707.0 / measuredTDS;
preferences.begin("tds", false);
preferences.putFloat("kvalue", kValue);
preferences.end();
Serial.print("✅ New K factor: ");
Serial.println(kValue, 4);
Serial.print(" Measured voltage: ");
Serial.print(voltage, 4);
Serial.println(" V");
} else {
Serial.println("❌ Calibration error");
}
}
void resetCalibration() {
kValue = 1.0;
preferences.begin("tds", false);
preferences.putFloat("kvalue", kValue);
preferences.end();
Serial.println("✅ Calibration reset to K = 1.0");
}
void showConfig() {
Serial.println("\\n╔═══════════════════════════════════════╗");
Serial.println("║ CURRENT CONFIGURATION ║");
Serial.println("╠═══════════════════════════════════════╣");
Serial.print("║ TDS K Factor: ");
Serial.print(kValue, 4);
Serial.println(" ║");
Serial.print("║ Temperature: ");
Serial.print(temperature, 1);
Serial.println(" °C ║");
Serial.print("║ Current TDS: ");
Serial.print(tdsValue, 0);
Serial.println(" ppm ║");
Serial.println("╚═══════════════════════════════════════╝\\n");
}
void readTemperatureManual() {
ds18b20.requestTemperatures();
float t = ds18b20.getTempCByIndex(0);
if (t != DEVICE_DISCONNECTED_C && !isnan(t)) {
Serial.print("🌡️ Current temperature: ");
Serial.print(t, 1);
Serial.println(" °C");
} else {
Serial.println("❌ DS18B20 is not responding. Check connection and pull-up resistor.");
}
}
Img 16
Problems found and how I solved them
During the development, I mainly had problems in the code part, not so much in the physical connection. The greatest difficulty was the pin designation, because initially I was not correctly using the correspondence between the analog/digital pins and the real GPIOs of the microcontroller. This caused the sensors not to respond as I expected.
After reviewing the program and correcting the pin assignment, both sensors started working correctly. This part was important because it allowed me to understand that, even if the circuit is well connected, a logical error in the software can completely prevent the data from being read.
Another relevant aspect was understanding that the TDS sensor should not be interpreted in isolation, since its measurement depends on the water temperature. By integrating the DS18B20 within the same code, I was able to obtain thermal compensation and a more realistic TDS reading.
Img 17
Img 18
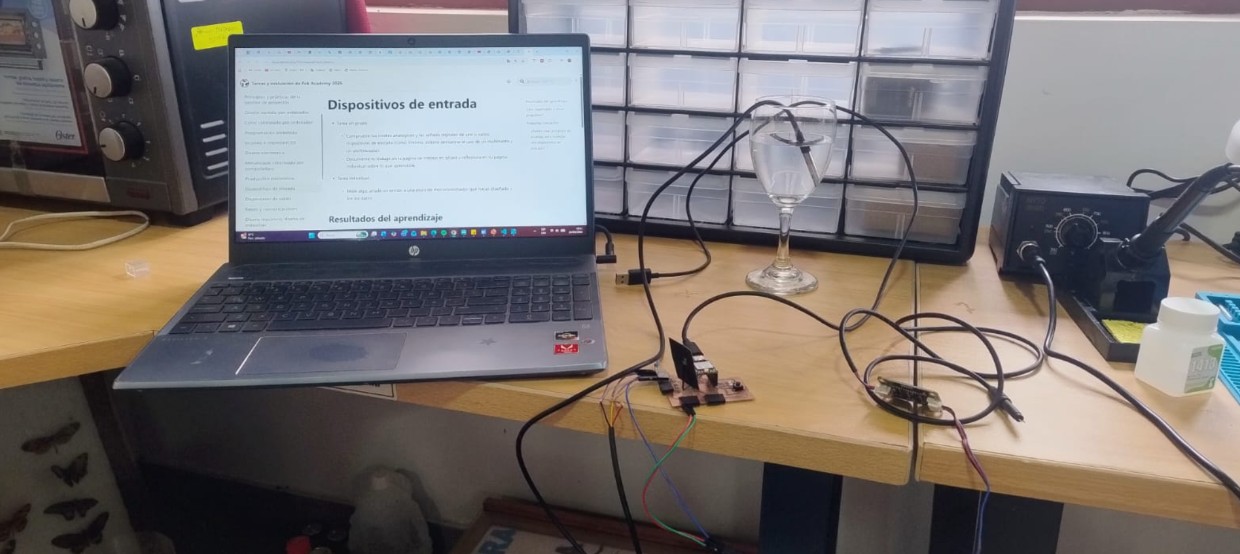
Calibration of the TDS sensor
To calibrate the TDS sensor, I used a standard solution that indicated 1413 on the bottle. However, when performing the tests, my system measured around 1168. This led me to review the calibration process in more detail and better understand how this value is interpreted.
In this case, the value 1413 that appears on the solution normally corresponds to electrical conductivity (µS/cm) and not directly to ppm of TDS. In many TDS systems, that conductivity value is converted to approximately 707 ppm, depending on the conversion factor used by the sensor. Therefore, the difference observed in my tests allowed me to understand that the calibration depends on both the K factor and the temperature compensation, as well as on the way the code converts the analog signal to ppm.
Thanks to this process, I understood that the TDS sensor needs to be calibrated carefully and that it is not enough to immerse it in a standard solution: it is also necessary to correctly interpret whether the reference value is expressed in conductivity or in TDS.
Video
Personal reflection
This experience helped me better understand the relationship between hardware and software in the development of electronic systems. On one hand, the physical connection of the sensors was relatively simple by following the tutorials; however, the real difficulty appeared in the programming and in the interpretation of the measurements.
I learned that small errors, such as an incorrect pin assignment, can completely prevent the system from working, and that some sensors, such as the TDS sensor, require additional variables such as temperature to obtain reliable results. I also understood that calibration is not only a technical part, but a fundamental step to ensure the quality of the final measurement.
Conclusion
In this practice, I managed to correctly integrate a DS18B20 temperature sensor and a TDS sensor into my custom board. The physical connection was relatively straightforward, but the greatest difficulty was in the code development and in the correct pin assignment. Finally, after correcting these errors, I got both sensors to work and understood that the TDS sensor depends on temperature in order to provide a more precise measurement.
In addition, the calibration process allowed me to learn to differentiate between conductivity values and TDS values, which was key to correctly interpreting the obtained results.
Files & Downloads
This section includes the files used for the input device assignment, including the code, PCB design, and sensor documentation. The measurement results and testing process are documented in the sections above.