Week 09 – Input Devices
This week is focused on Input Devices: understanding how to connect sensors to a microcontroller, how to probe analog levels and digital signals, and how to read and interpret real-world data from a device connected to a board that I designed.
On this page I document:
- The group assignment: probing analog and digital signals from an input device using test equipment.
- My individual assignment: adding a sensor to a microcontroller board and reading it.
- The design and fabrication workflow of the board.
- How the code works and how I captured sensor data.
- The problems I found and how I solved them.
- The design files, source code and a hero shot of the final board.
- The bonus pack: a Raspberry Pi system for face detection, PIR presence detection, and MQTT communication with ESP32 boards.
Assignment and Learning Outcomes
The weekly assignment is:
- Group assignment:
- Probe an input device’s analog levels and digital signals.
- As a minimum, demonstrate the use of a multimeter .
- Optionally, use a logic analyzer for digital communication signals.
- Individual assignment:
- Measure something: add a sensor to a microcontroller board that you have designed and read it.
The learning outcomes are:
- Understand how to interface input devices to a microcontroller.
- Measure and interpret analog and digital sensor signals.
- Read a physical property through a sensor and process it with code.
Checklist
In this page I answer the required questions:
- Linked to the group assignment page.
- Documented what I learned from interfacing an input device to my microcontroller.
- Documented my design and fabrication process or linked to a previous board.
- Explained how my code works.
- Explained the problems and how I fixed them.
- Included the original design files and source code.
- Included a hero shot of my board.
You can see the group documentation here:
Group Assignment – Probing Analog Levels and Digital Signals
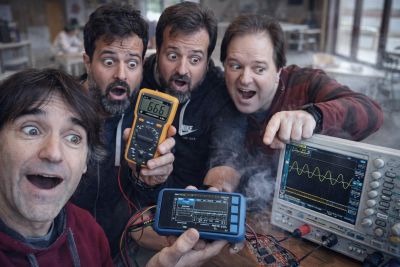
For the group assignment we analyzed the output of one or more input devices and observed their behaviour using laboratory instruments. The goal was to understand how a sensor or input device behaves electrically, both in analog and digital form.
At minimum, we demonstrated the use of a multimeter we haven´t in Ponferrada osciloscope for try it maybe in the next weeks we will get One. We also reviewed the use of a logic analyzer for digital signals when applicable.
Equipment Used
- Multimeter to measure voltage and continuity.
- Logic analyzer to inspect digital communication signals.
- Microcontroller board with sensor / input device connected.
- Jumper wires and USB connection.
What We Tested
- Analog levels from an input device output pin.
- Digital transitions on communication or switching pins.
- The relationship between the physical property and the measured electrical signal.
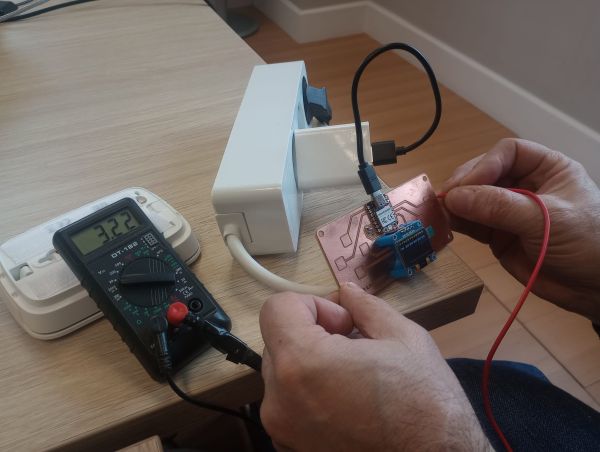
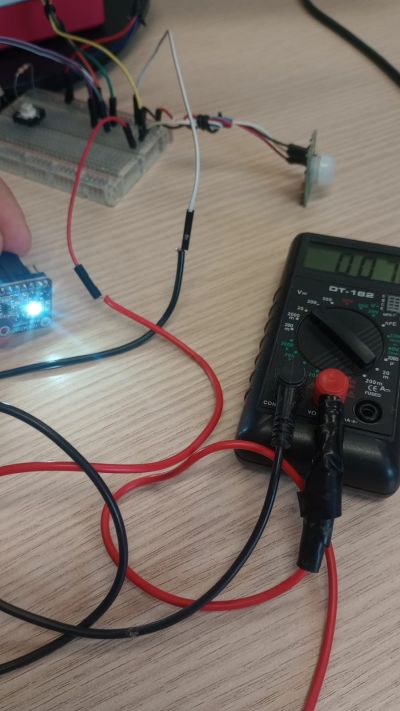
Multimeter
First, we used the multimeter to identify the main electrical values present in the circuit: power supply voltage, continuity between lines, and the voltage changes produced by the sensor.
- Connect the multimeter ground reference to the board GND.
- Measure the board supply voltage.
- Probe the sensor output pin.
- Observe how the voltage changes when the physical condition changes.
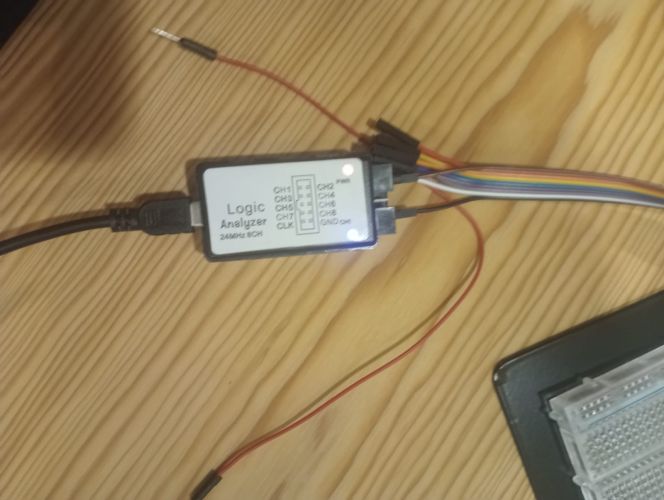
Logic Analyzer
For digital signals, especially when using communication protocols, the logic analyzer is very useful because it allows us to inspect logic states, timing, and protocol decoding.
In our case, we also reviewed how the logic analyzer can help verify whether a sensor is sending correct digital information to the microcontroller.
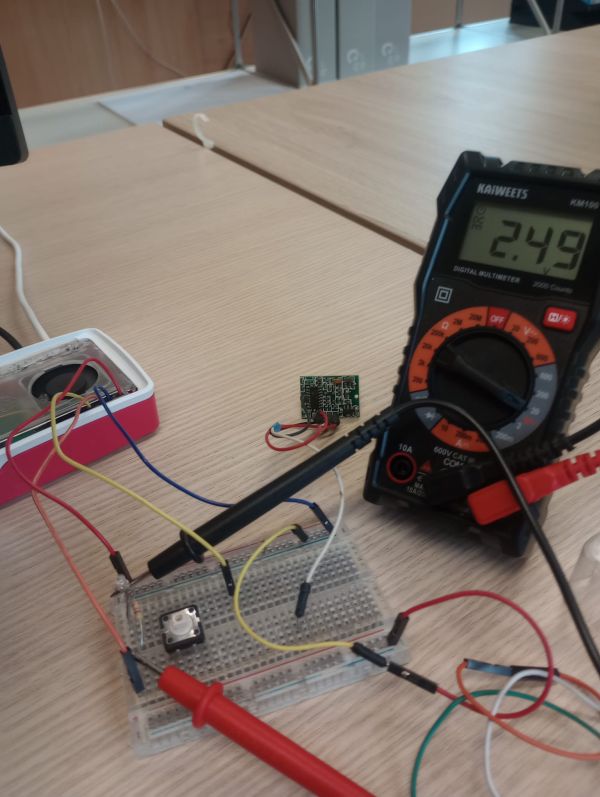
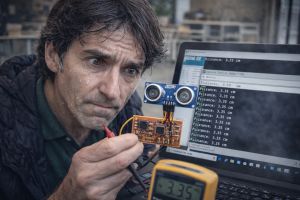
Multimeter
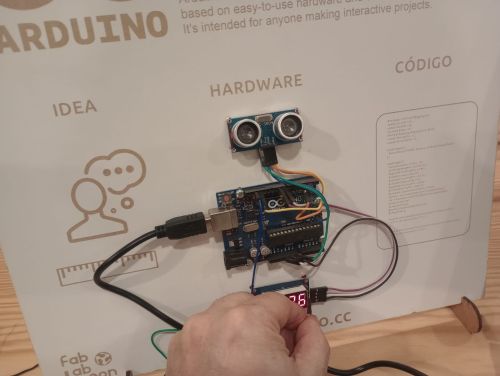
I use for text one of the arduinos working in the fablab Ponnferrada
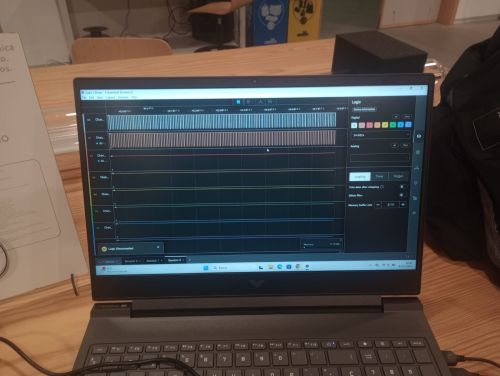
For digital signals, we use the software of the analyzer
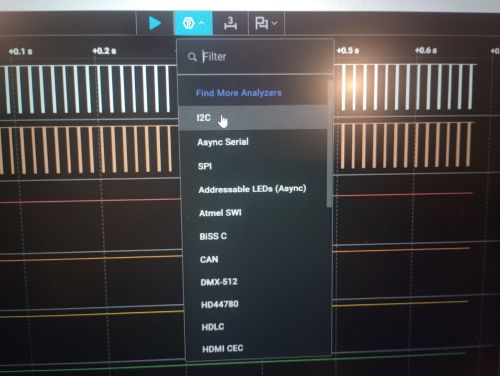
The analyzer are showing the I2C signal
What I Learned from the Group Assignment
- The multimeter is useful for checking static voltages and continuity, but it does not show signal shape over time.
- The logic analyzer is especially useful for digital communications and signal timing.
- Good grounding and correct reference connections are essential to obtain stable measurements.
- The measured electrical signal is directly related to the physical property sensed by the device.
This group assignment helped me understand that reading a sensor is not only about writing code. It is also about knowing what the signal looks like electrically and how the hardware behaves in real conditions.
Individual Assignment – Measure Something
For the individual assignment I added a sensor to a microcontroller board that I had designed and I read the sensor values using code.
My goal this week was to connect a sensor that could also be useful for my final project, following the recommendation from the local instructors.
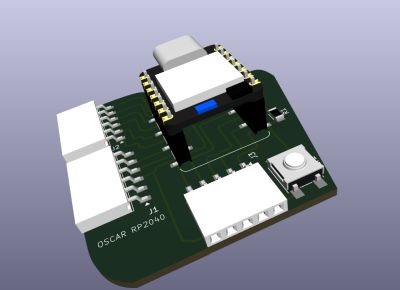
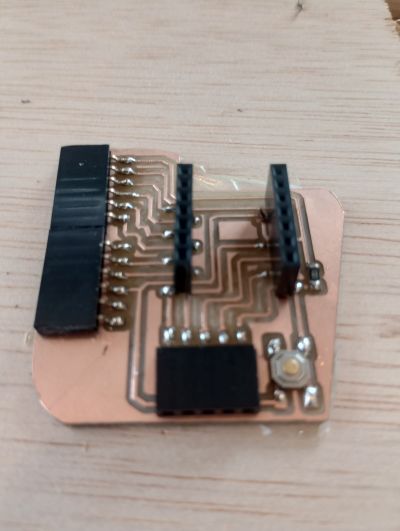
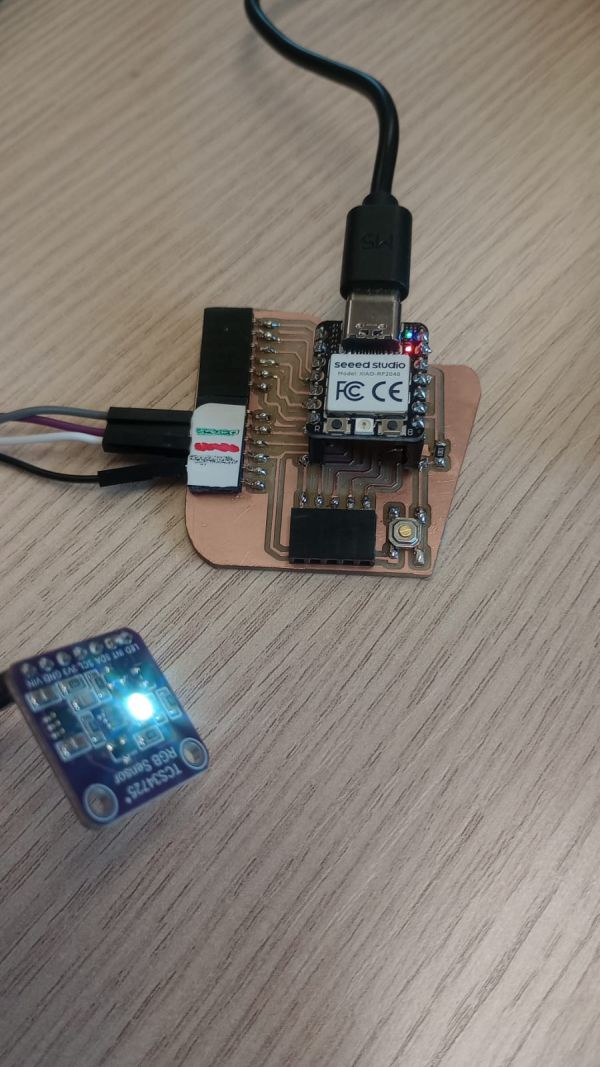
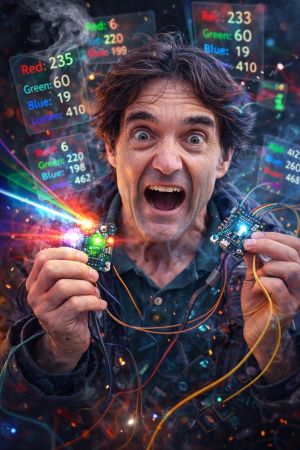
In this case I used a RGB Color sensor connected to a Seeed XIAO RP2040 . The sensor measures colors , and I read the values through the microcontroller using the Arduino environment.
- Sensor: TCS34725
- Board: Seeed XIAO RP2040
- Signal type: Digital I2C
- Output: Serial monitor reading / plotted values
Board Design and Fabrication
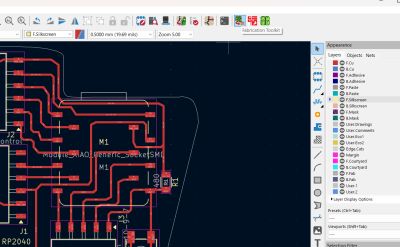
This week I followed a workflow similar to previous electronics weeks. I designed the board in KiCad, prepared the manufacturing files, milled the PCB, soldered the components, and tested the system.
If the board had already been designed in a previous week, this assignment builds on that base by adding the sensor and the necessary connections.
Design Workflow
- Design the sensor board or adapt a previous board in KiCad.
- Use the Fab Library for compatible symbols and footprints.
- Route the traces according to our milling constraints.
- Export the design files for fabrication.
- Convert Gerbers if needed and prepare the PNG files for Mods CE.
- Mill the board and solder the components.
Main Elements of the Board
- Microcontroller module or custom MCU circuit.
- Power connections.
- Sensor input pin and communication bus.
- Programming / debugging header.
- LED or button for debugging.
For the fabrication process I used the same PCB production workflow as in the previous electronics assignment.
Fabrication and Soldering
After finishing the design, I fabricated the board using the in-house PCB milling workflow. Then I soldered the microcontroller connections, sensor, and the remaining components.
Fabrication Workflow
- Export traces and outline.
- Generate the toolpaths in Mods CE.
- Mill the PCB on the machine.
- Clean the board after milling.
- Solder the components carefully.
- Inspect the board for shorts and bad joints.
Interfacing the Sensor
The next step was to connect the sensor to the microcontroller and verify that the board could read the signal correctly.
Depending on the type of sensor, the signal can be:
- Analog, where the voltage level changes continuously with the physical property.
- Digital, where the sensor sends logic states or protocol-based data.
Electrical Connection
- VCC connected to the board supply voltage.
- GND connected to common ground.
- Signal pin connected to the corresponding microcontroller input.
In my case, the sensor output was connected to / SDA-SCL / and power . This allowed the microcontroller to read the physical variable and print the values through the Arduino Serial Monitor.
Code and Reading the RGB Sensor (TCS34725)
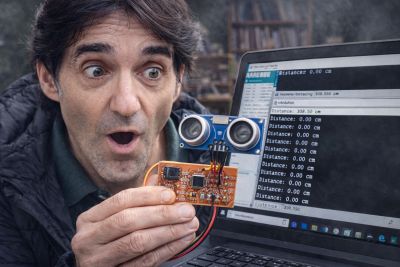
To test the RGB color sensor TCS34725, I wrote a program using the Arduino IDE. Unlike a simple analog sensor, this device communicates via I2C, allowing us to read precise values for red, green, blue, and overall light intensity.
How the Code Works
- The program includes the required libraries:
Wire.hfor I2C communication andAdafruit_TCS34725.hto control the sensor. - An instance of the sensor is created with a specific integration time and gain to adjust sensitivity.
- In
setup(), the serial communication is initialized and the sensor is started usingtcs.begin(). - If the sensor is not detected, the program stops and displays an error message.
- In
loop(), the sensor continuously reads raw color data: red (R), green (G), blue (B), and clear/light (C). - The measured values are formatted and sent to the Serial Monitor for visualization.
- A short delay is added to make the readings easier to observe.
Example Code
Arduino color sensor XIAO-RP2040
Show code
#include <Wire.h>
#include "Adafruit_TCS34725.h"
// Sensor configuration (integration time and gain)
Adafruit_TCS34725 tcs = Adafruit_TCS34725(
TCS34725_INTEGRATIONTIME_50MS,
TCS34725_GAIN_4X
);
void setup() {
Serial.begin(115200);
delay(2000);
// Initialize the sensor
if (!tcs.begin()) {
Serial.println("Error: TCS34725 not found");
while (1);
}
Serial.println("Sensor initialized");
}
void loop() {
uint16_t r, g, b, c;
// Read raw RGB and clear light values
tcs.getRawData(&r, &g, &b, &c);
// Print formatted values
Serial.print("Red: ");
Serial.print(r);
Serial.print(" , Green: ");
Serial.print(g);
Serial.print(" , Blue: ");
Serial.print(b);
Serial.print(" , Lumen: ");
Serial.println(c);
delay(500);
}
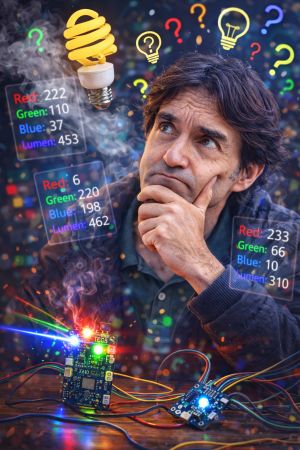
Understanding the Output
The sensor provides four values:
- Red (R): intensity of red light
- Green (G): intensity of green light
- Blue (B): intensity of blue light
- Clear (C): total light intensity (used as an approximation of brightness)
These values can be used to detect colors, measure ambient light, or trigger actions based on color conditions.
If the sensor was digital, the code changes depending on the protocol or data format.
For example, some digital sensors require a dedicated library or communication through I2C, UART, or 1-wire.
Measured Results
Once the program was uploaded, I verified that the XIAO RP2040 was reading the
TCS34725 RGB color sensor correctly through the serial monitor.
The values of Red, Green, Blue, and
brightness changed depending on the color or object placed in front of the sensor.
This confirmed that the board, the I2C communication, the wiring, and the Arduino code
were all working correctly together.
- When the observed color changed, the RGB values changed accordingly.
- The serial output allowed me to monitor the sensor response in real time.
- The measured values were consistent with the expected behaviour of the color sensor.
- The clear channel value (brightness) also changed depending on the amount of reflected light.
In this way, I could directly observe the relationship between the
color of the object and the digital values
captured by the microcontroller.
For example, when a red object was placed in front of the sensor, the red channel showed
a higher value than the green and blue channels. Similarly, different objects and lighting
conditions produced different RGB and brightness readings.
Bonus Pack – Raspberry Pi Face Detection, PIR Presence Detection and MQTT Communication
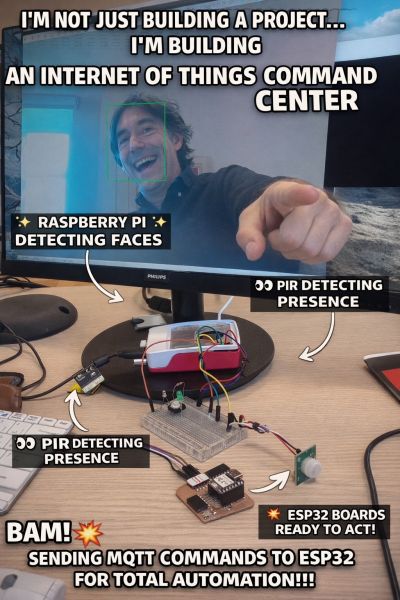
As a BONUS EXTENSION FOR MY FINAL PROJECT for this assignment, I decided to explore how
different input devices and processing systems can work together in a
more complete interactive setup.
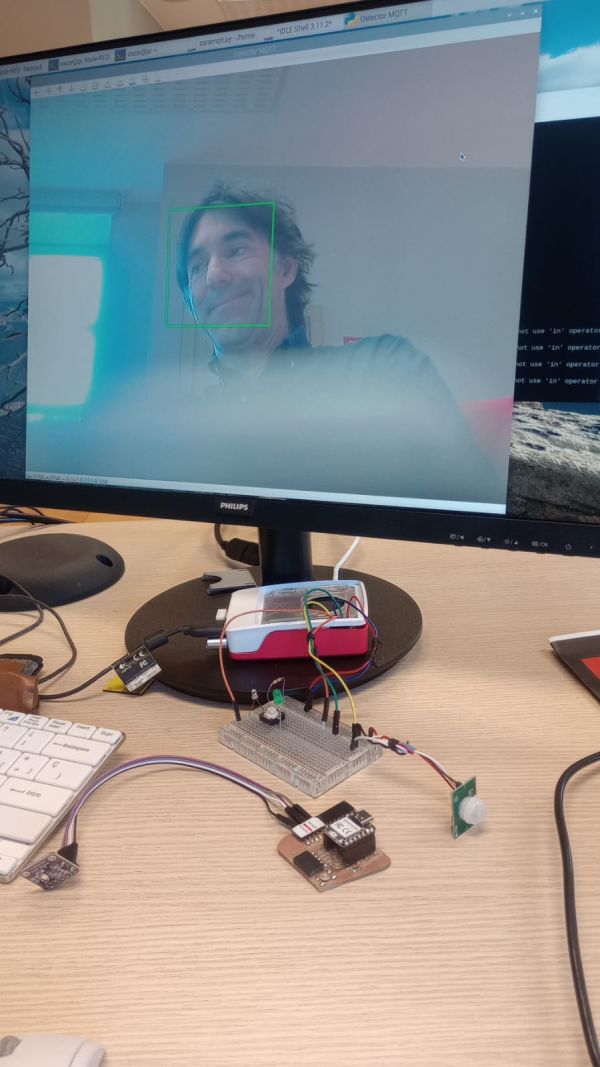
In this extra experiment, I use a Raspberry Pi as the main processing unit.
The Raspberry Pi performs face detection with a camera, while at the same time
it uses its GPIO pins to read a PIR motion sensor for presence detection.
Based on these inputs, the system sends commands through MQTT to several
ESP32 boards, which then react and perform different actions.This is part of my final project: a robot that detects people and rewards them with a hug when they put trash in the box.
System Overview
Before getting started, it is necessary to install Node-RED on the Raspberry Pi in case it is not already installed. You can download it from
https://nodered.org.
For MQTT communication, you will also need a broker such as Mosquitto, available at
https://mosquitto.org.
Ensuring these components are properly installed is essential for everything to work correctly. However, this setup is not part of this assignment and will be documented in future work.
To work with Node-RED, open a web browser and navigate to http://localhost:1880.
Full documentation is available at
https://nodered.org/docs/getting-started/raspberrypi
.
System Overview 2
- Main controller: Raspberry Pi
- Input 1: Face detection using a camera
- Input 2: Presence detection using a PIR sensor connected to GPIO
- Communication protocol: MQTT
- Output devices: ESP32 boards receiving MQTT messages and acting accordingly
Software Used
I divided the project into two software environments depending on the task:
-
Python on the Raspberry Pi for the face detection part.
Source Code
-
Node-RED on the Raspberry Pi for the PIR sensor reading and logic flow.
Source Code
Python Libraries
- cv2 (OpenCV) for image processing and face detection
- paho.mqtt for publishing MQTT messages to the ESP32 devices
To create the code, I relied on my knowledge of Python and Node-RED, but I also used AI as support
Node-RED
For the PIR part, I use the standard nodes already included in the
Node-RED installation for Raspberry Pi. These nodes allow me to
read the GPIO state, process the motion detection event, and integrate it into the MQTT workflow.
How It Works
- The camera connected to the Raspberry Pi captures video frames.
- Python processes the frames using OpenCV (cv2) to detect faces.
- At the same time, a PIR sensor connected to the Raspberry Pi GPIO detects motion or presence.
- When a face or presence event is detected, the Raspberry Pi sends a message using MQTT.
- The ESP32 boards subscribed to the MQTT topics receive the message.
- The ESP32 devices then perform the programmed action, such as turning on outputs, activating responses, or interacting with the environment.
Why I Added This Bonus Pack?
I added this extra section because it connects the weekly topic of
input devices with a more advanced real-world application.
Instead of reading only one sensor from a microcontroller, this setup combines
computer vision, presence sensing, GPIO input,
and network communication with distributed embedded devices.
This is also directly related to my FINAL PROJECT , because it demonstrates how different
sensing technologies can be integrated into one smart interactive system.
Problems and Fixes
Problem 1 – Wrong Sensor Connection
- Problem: At first the sensor did not produce valid readings because one connection was incorrect.
- Fix: I checked the wiring pin by pin, verified VCC and GND, and corrected the signal connection. I paint colors
Problem 2 – Unstable Readings
- Problem: The measured values were noisy or unstable.
- Fix: I checked grounding, improved the wiring, and verified the signal using the multimeter.
Problem 3 – Code or Pin Definition Error
- Problem: The code was initially reading the wrong pin or using the wrong reading function.
- Fix: I reviewed the code and corrected the pin definition and the read method.
These problems helped me better understand that successful sensor interfacing depends on
both hardware debugging and software debugging.
Design Files, Source Code and Hero Shot
Design Files
Source Code
Summary and Reflection
This week helped me understand the complete workflow of
input devices, from probing signals with lab equipment to
connecting a sensor to a custom board and reading real data with code.
One of the most important things I learned is that sensor integration is not only about software.
It also requires understanding the signal electrically: whether it is analog or digital,
what voltage levels it produces, and how stable the signal is.
The use of the multimeter, oscilloscope, and
logic analyzer helped me understand what was really happening between
the sensor and the microcontroller.
In the individual assignment I completed the full process:
board design, fabrication, sensor connection, code development, and testing.
Seeing the measured values change in the serial monitor made it clear that the board
was correctly interfacing with the physical world.
This assignment is especially useful for future work because input devices are essential
for interactive systems and for my future final project development.