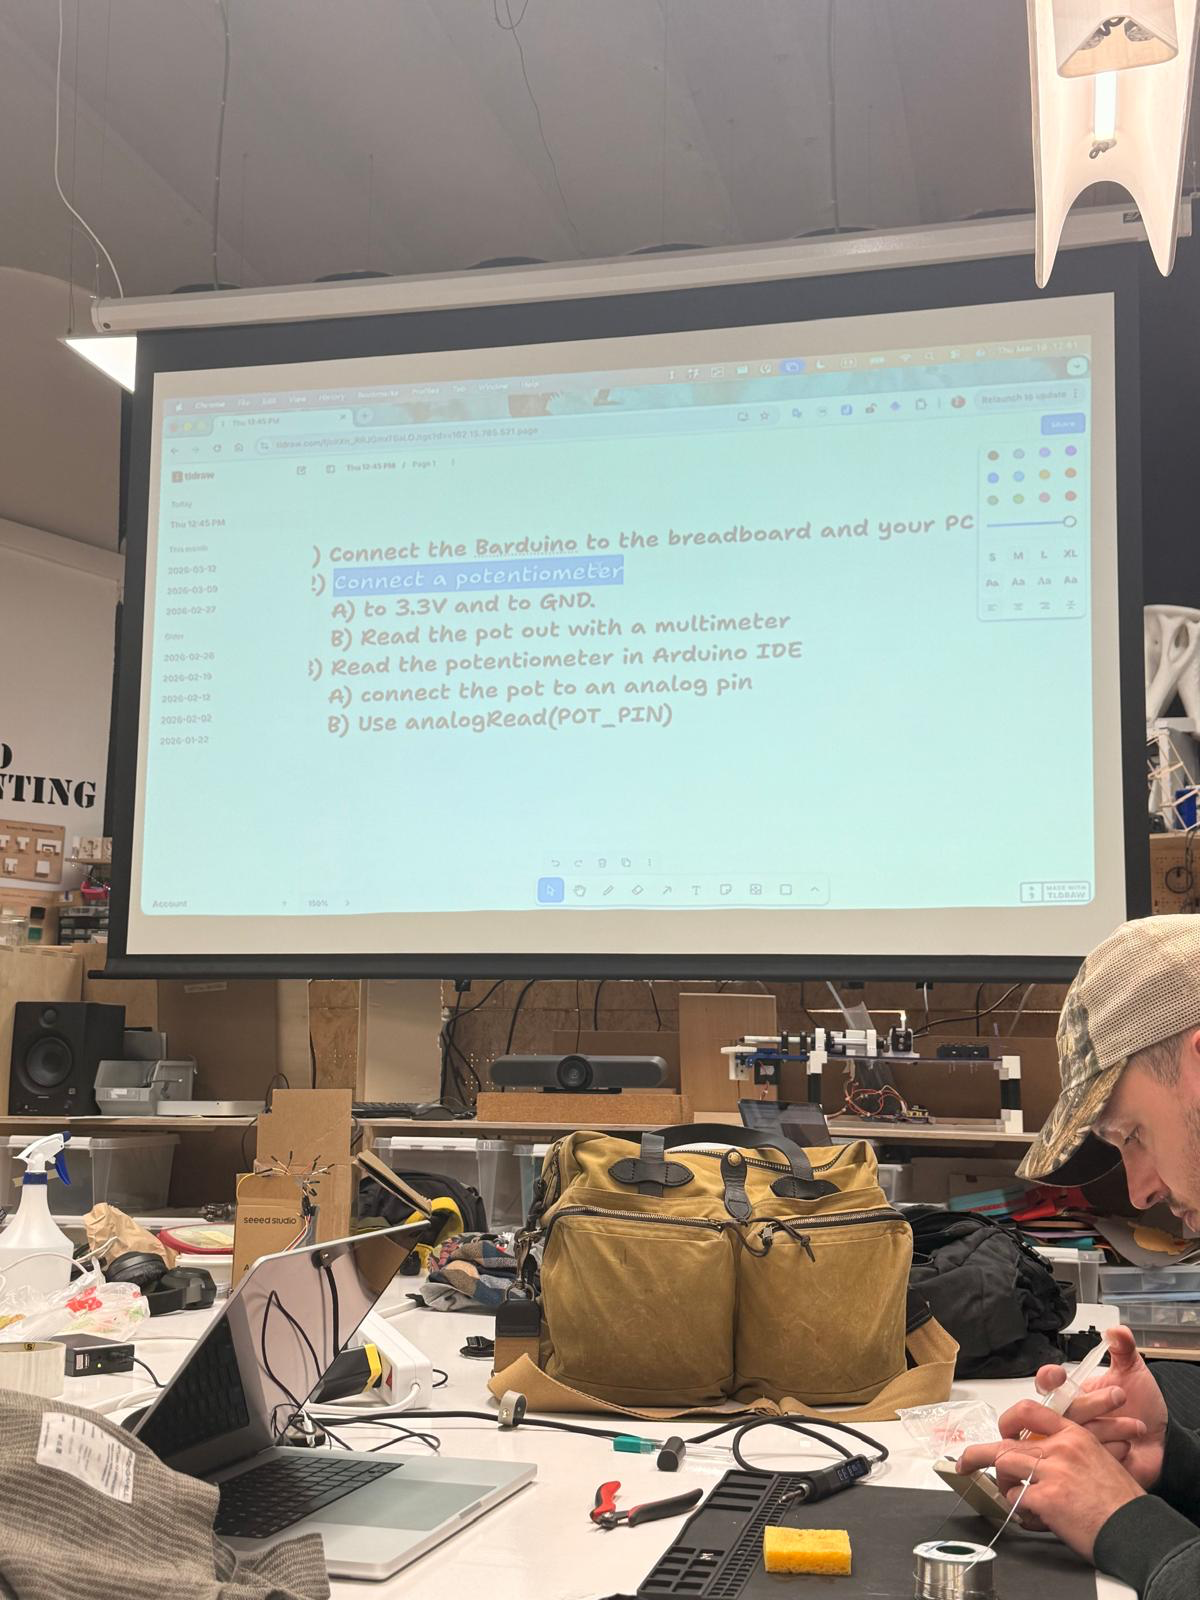
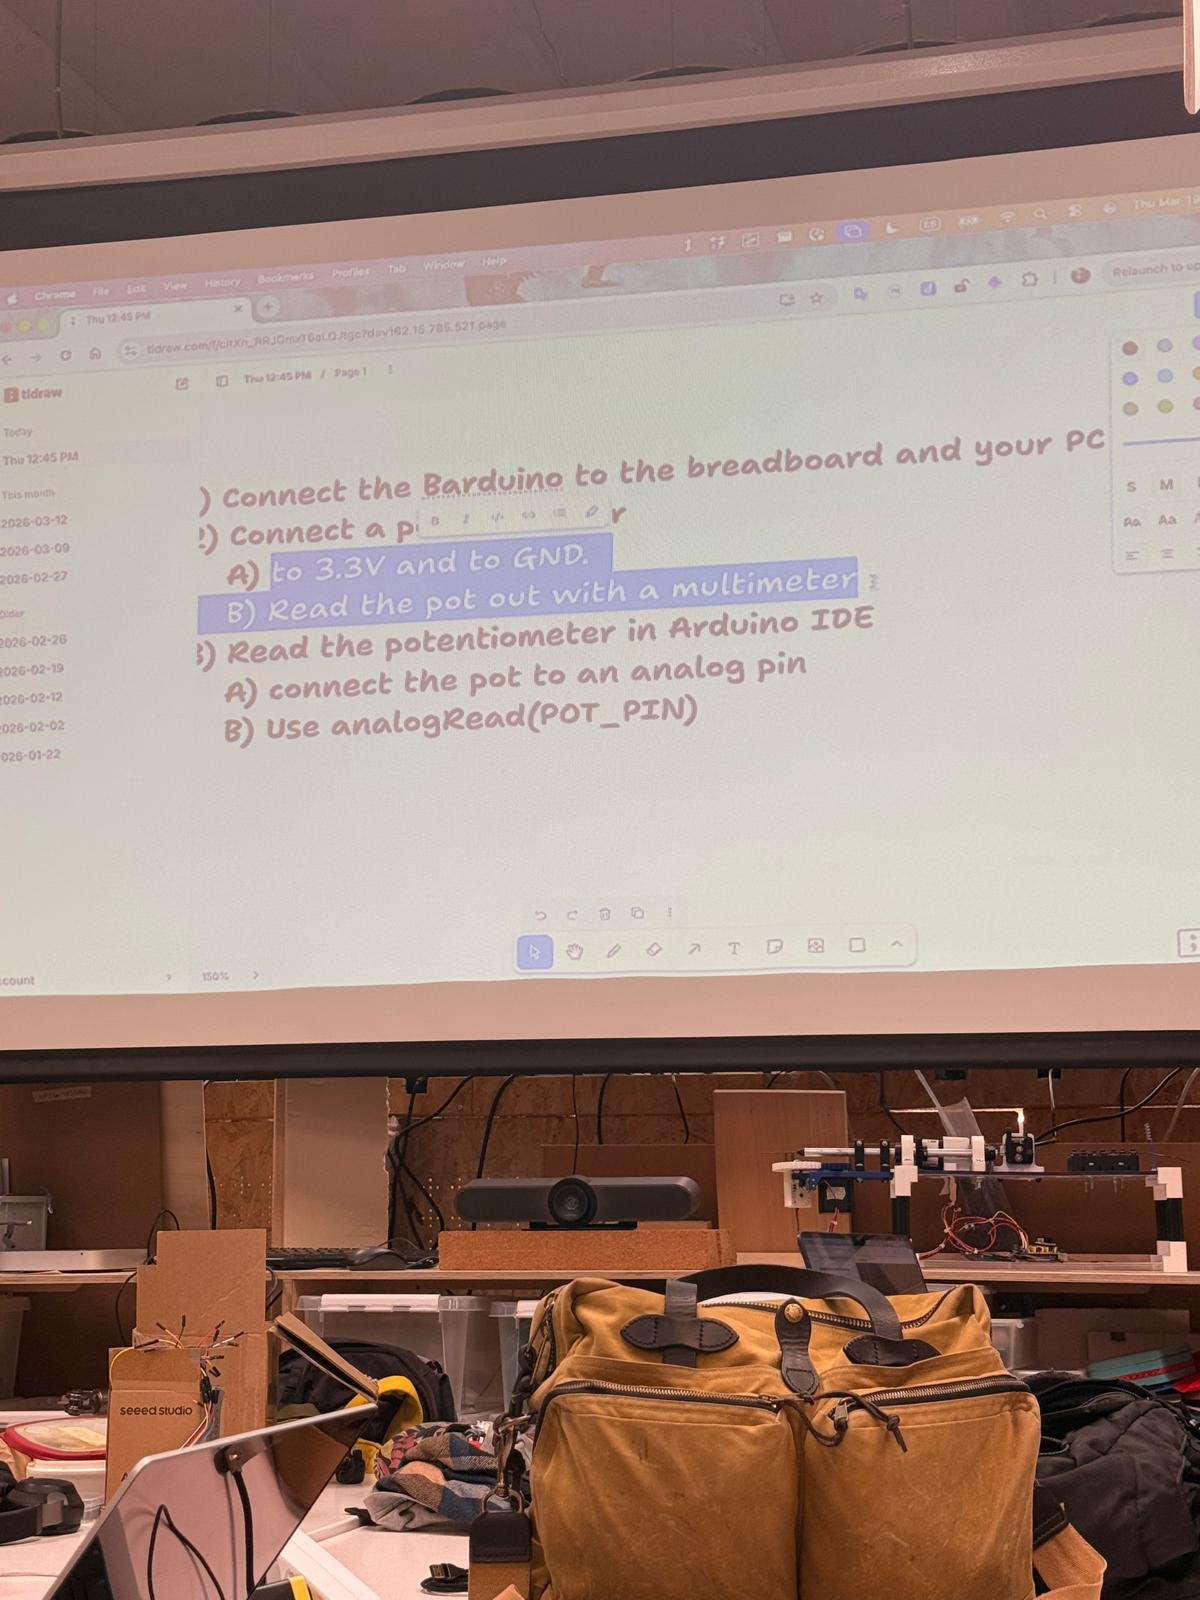
individual assignment
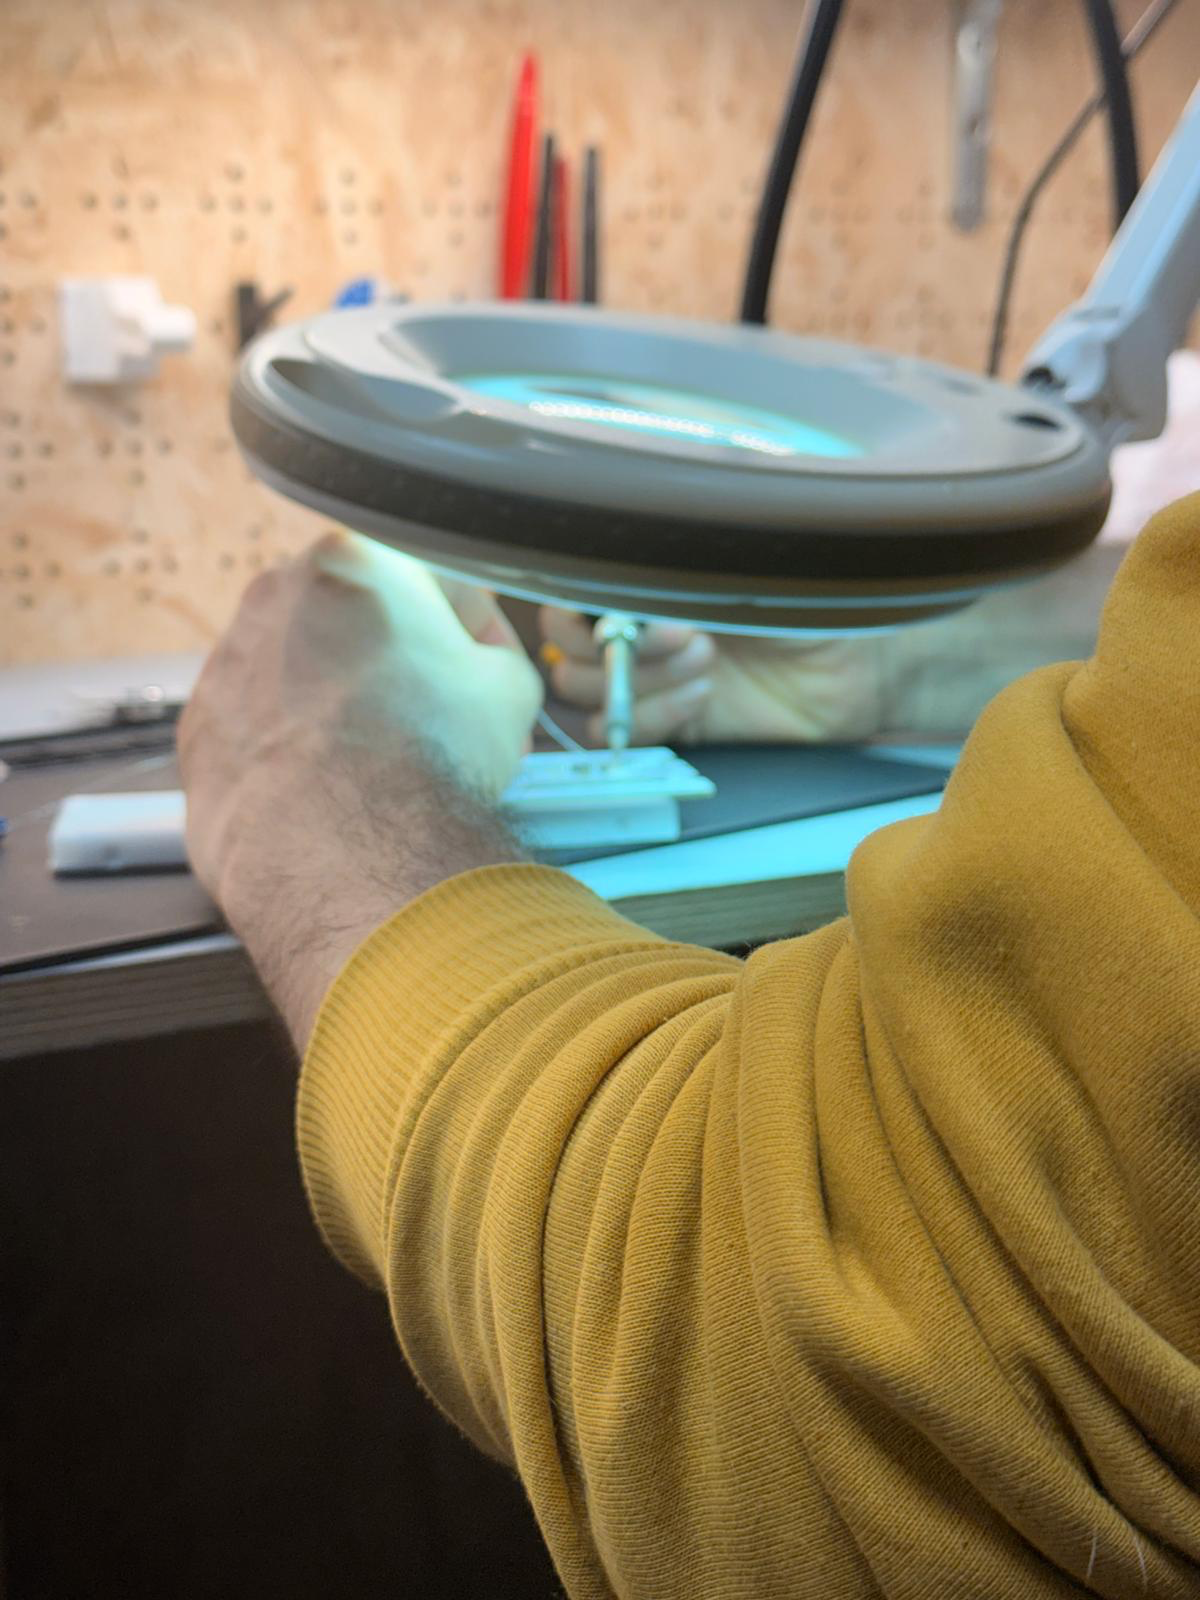
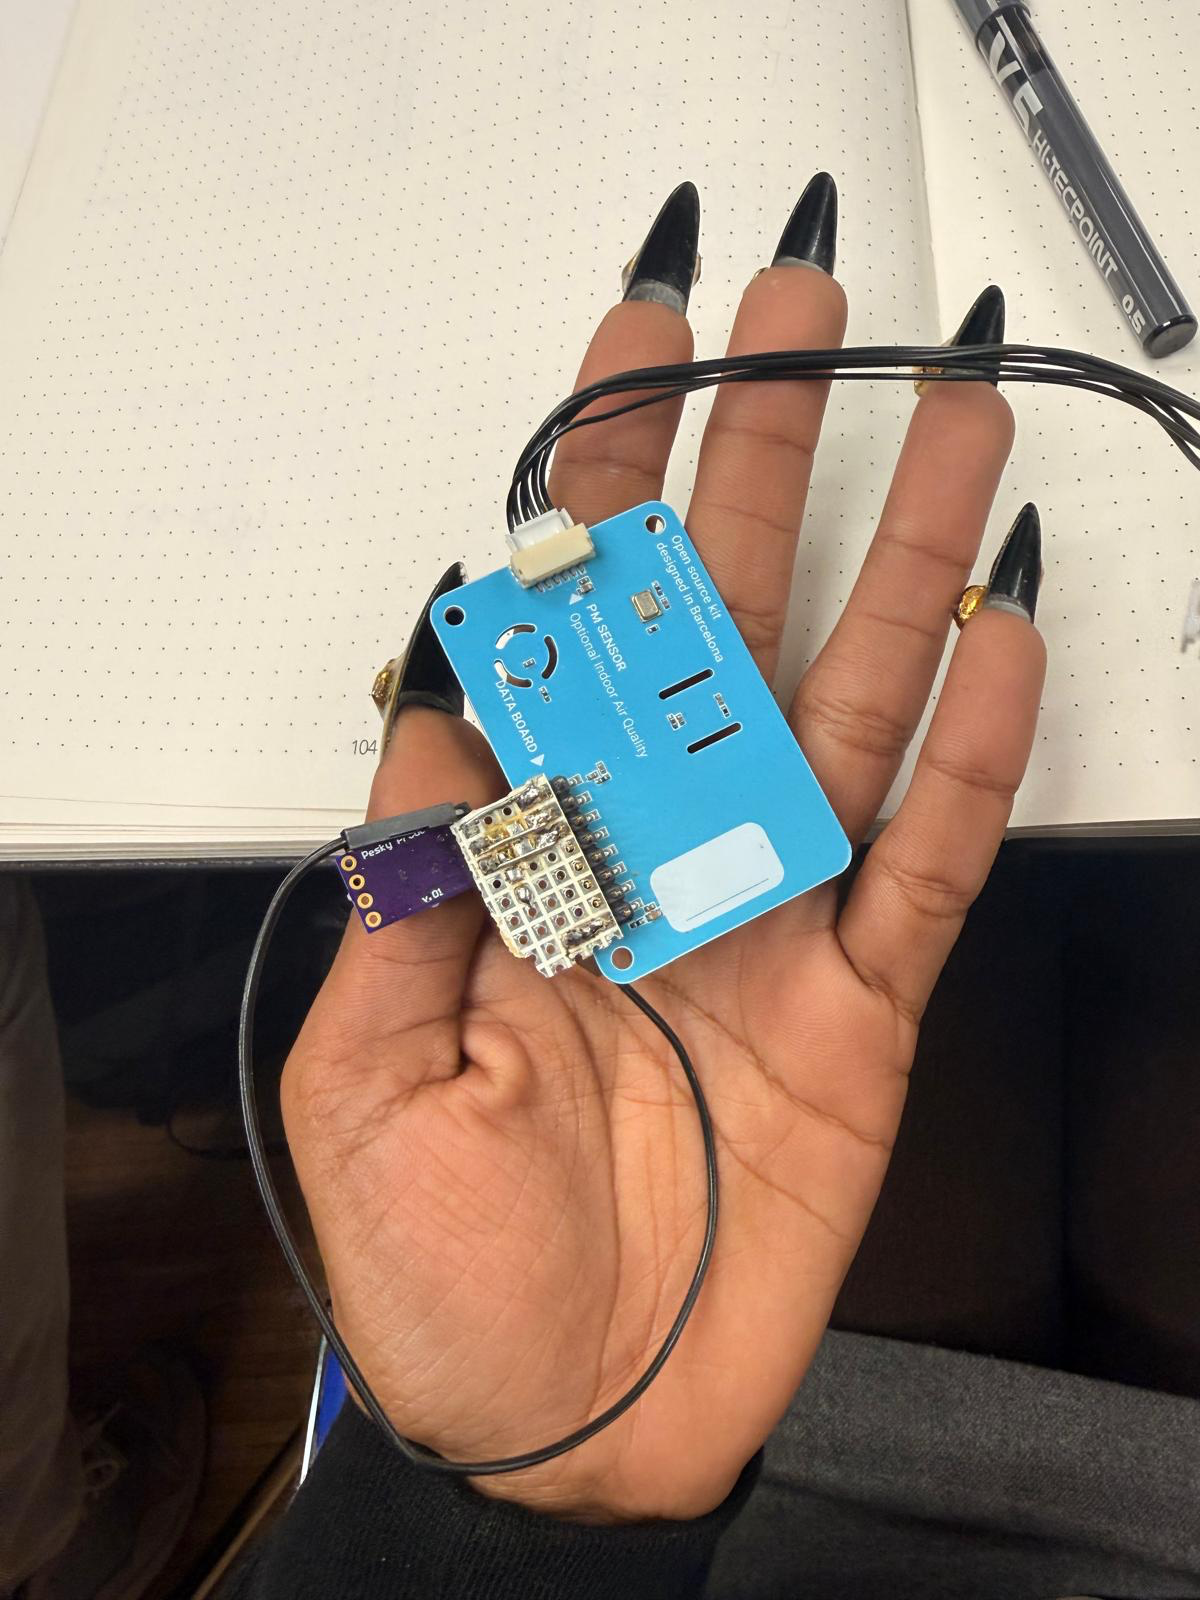
for this week's assignment, i explored a pulse sensor.
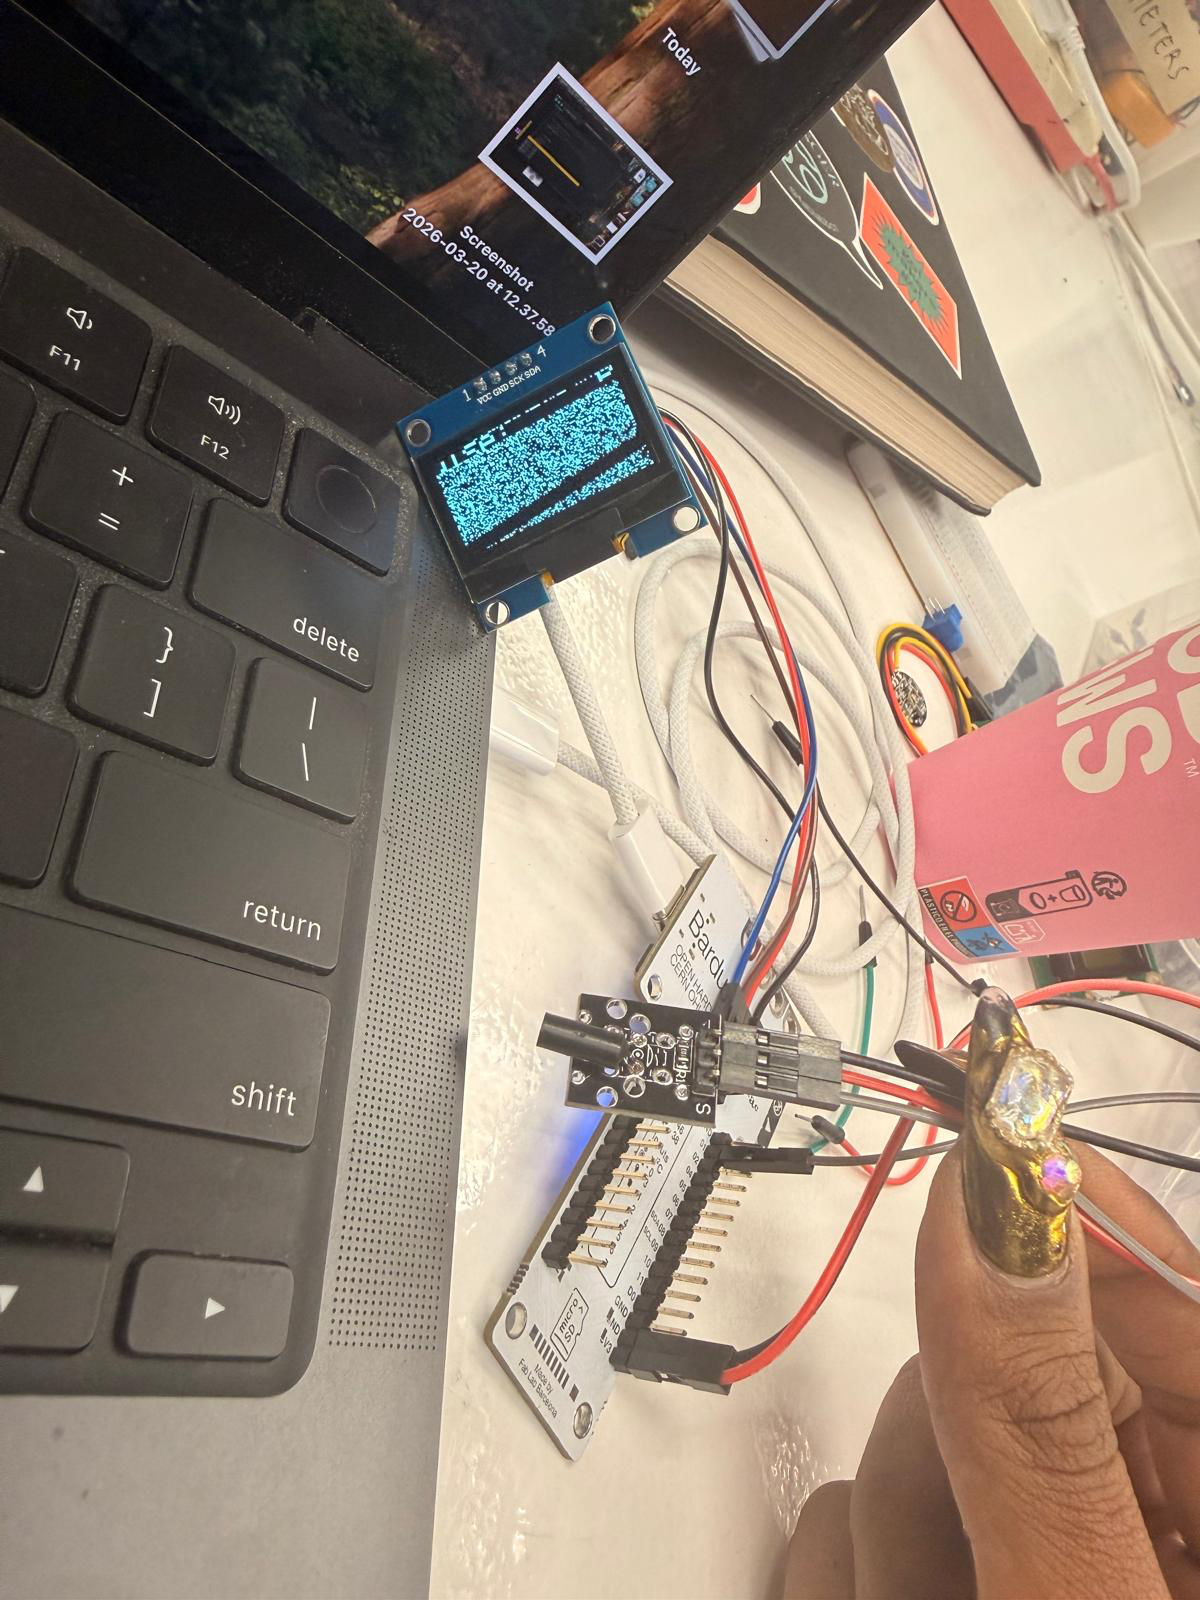
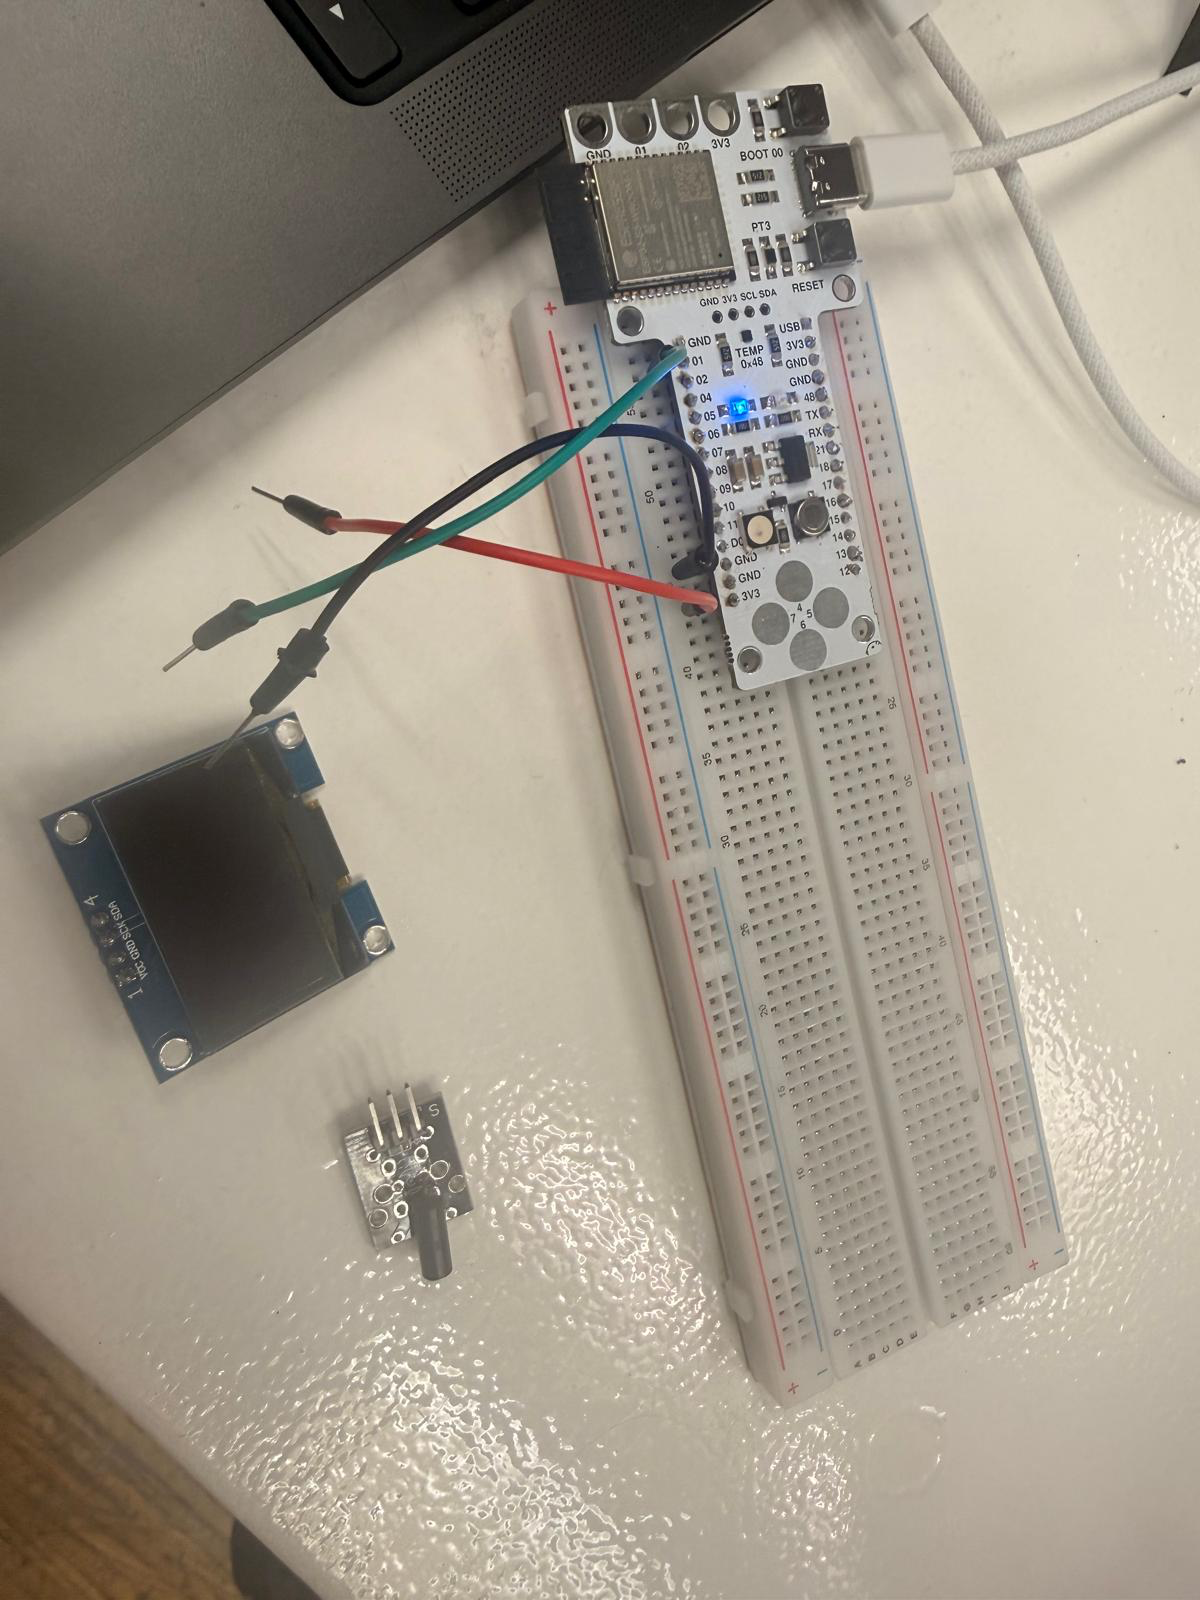
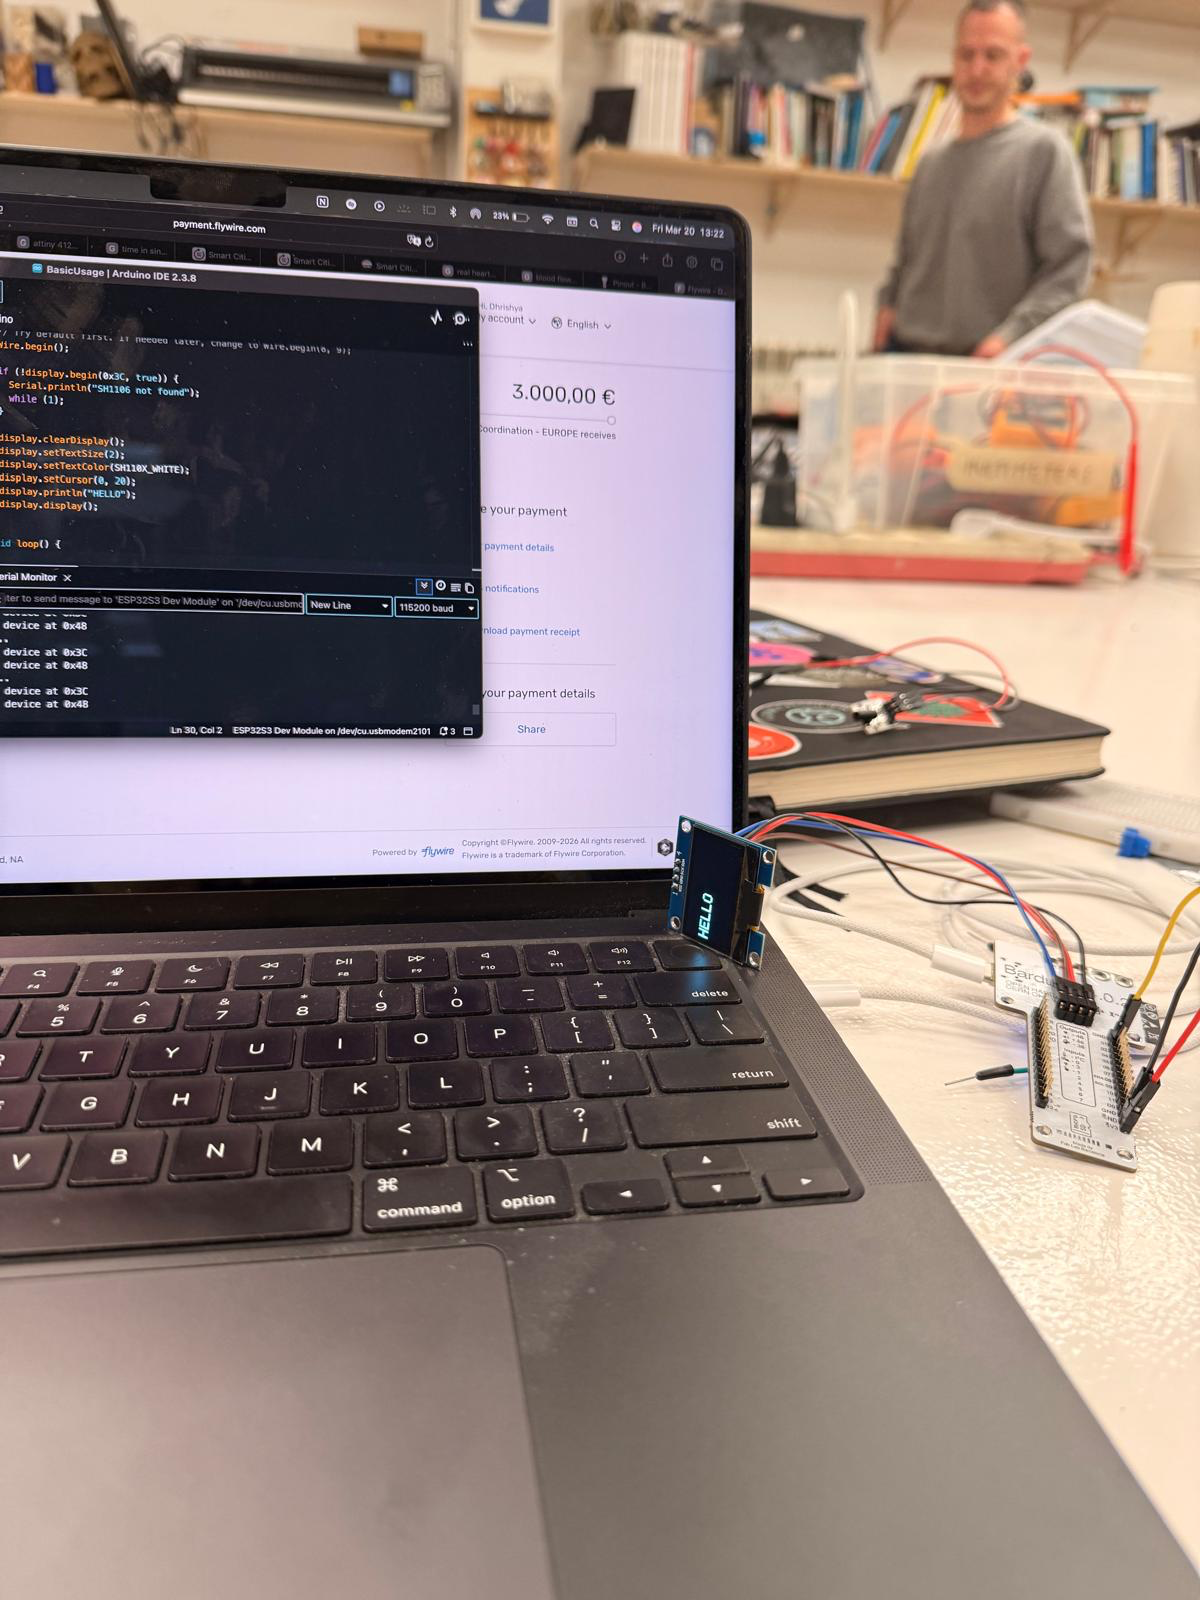
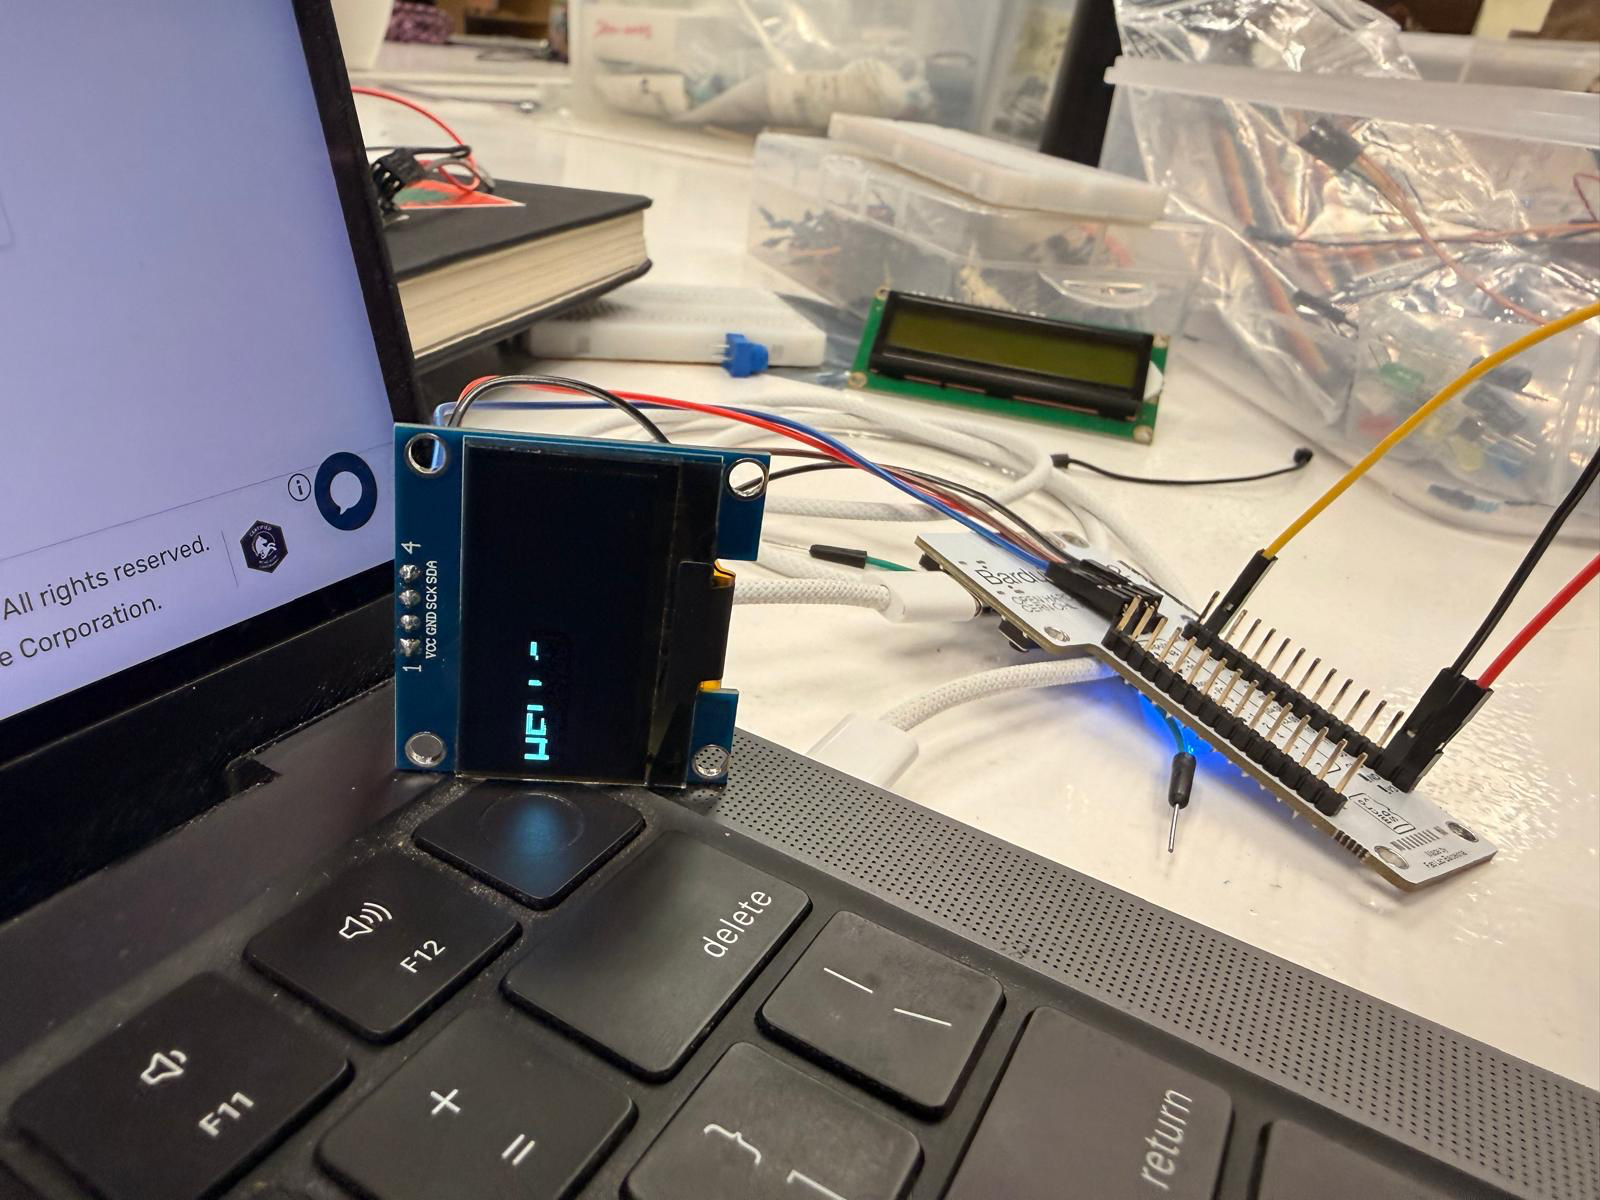
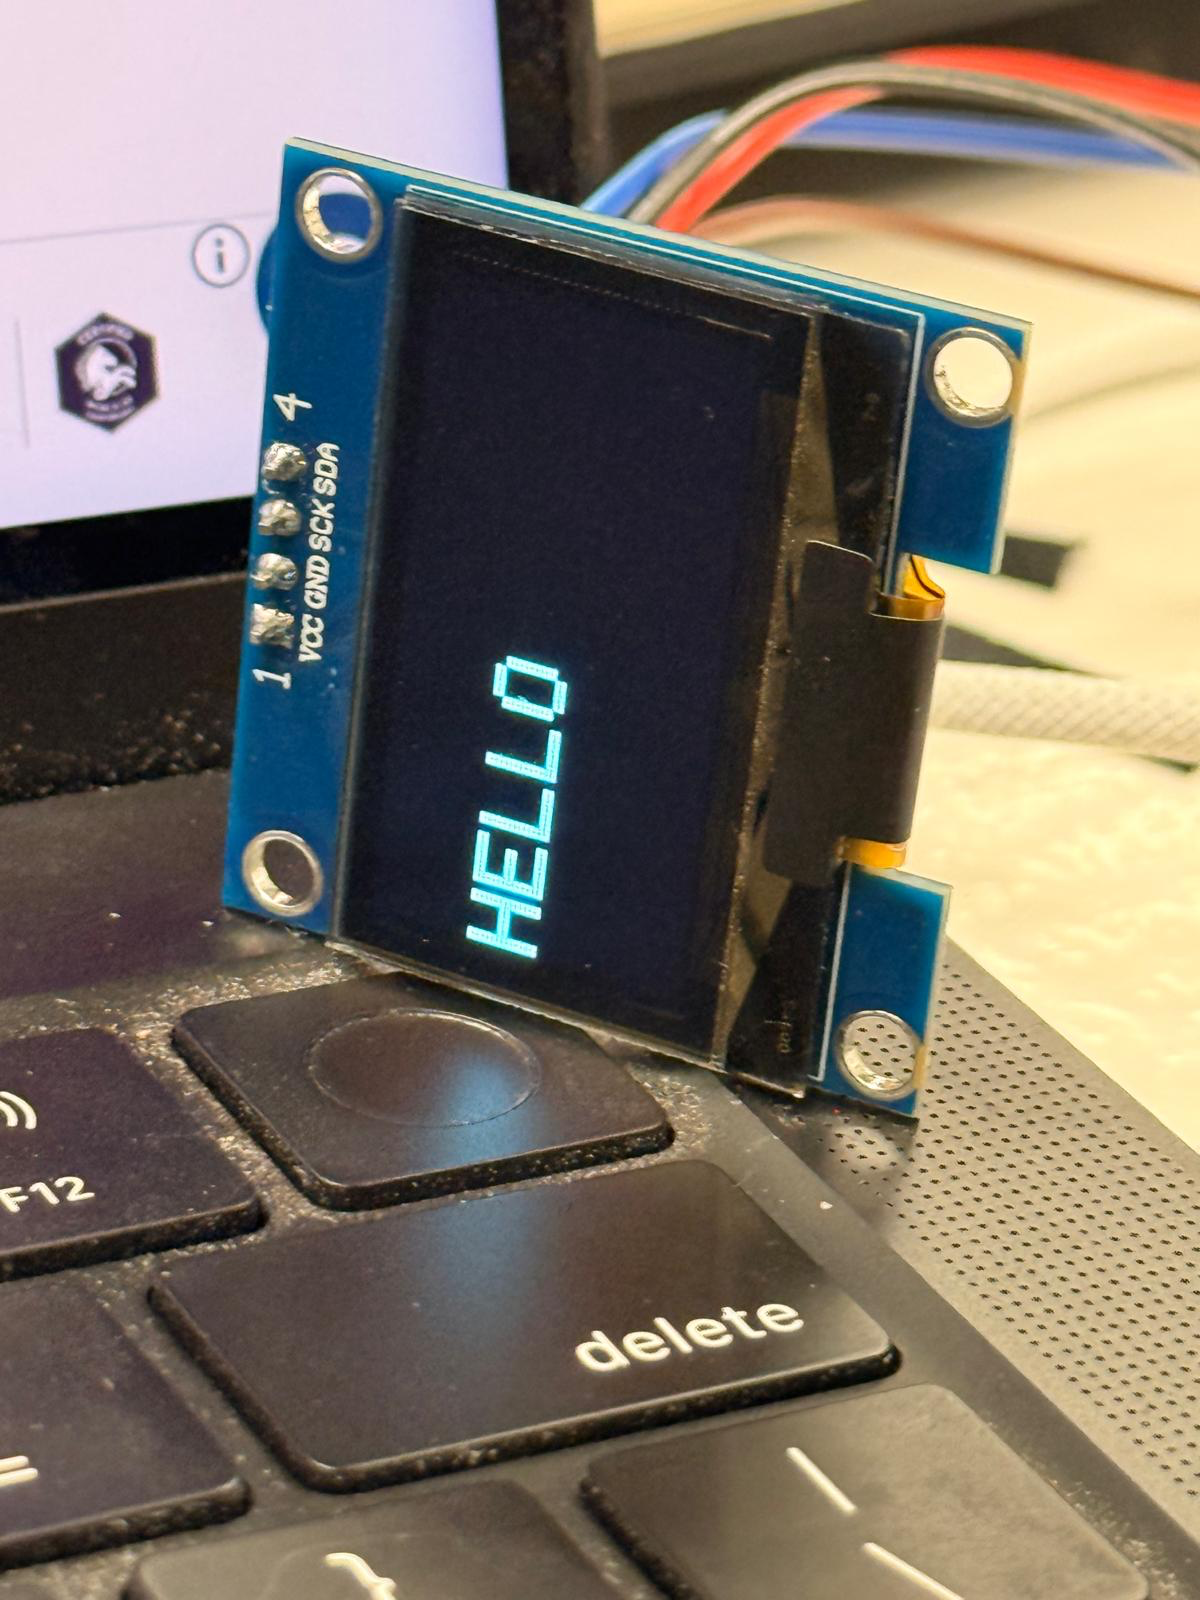
by connecting it to a barduino and a small oled screen, i was able to visualize the data in real-time.
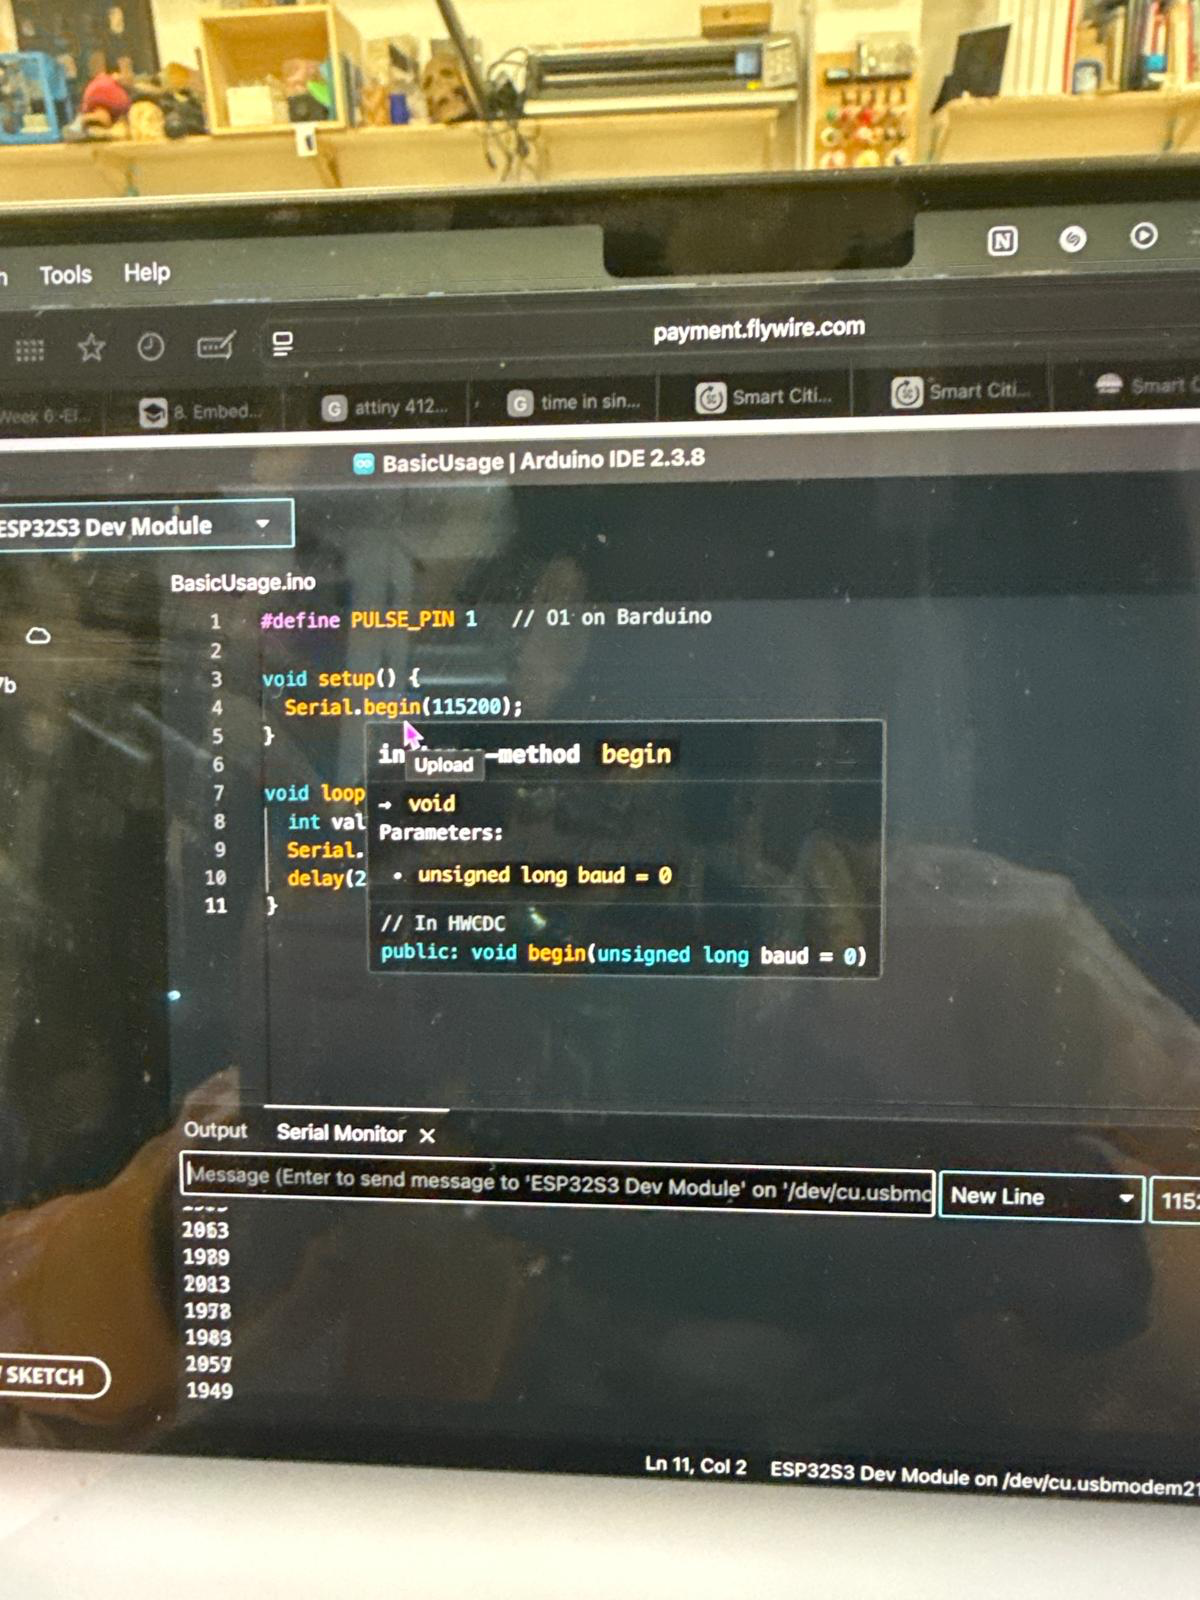
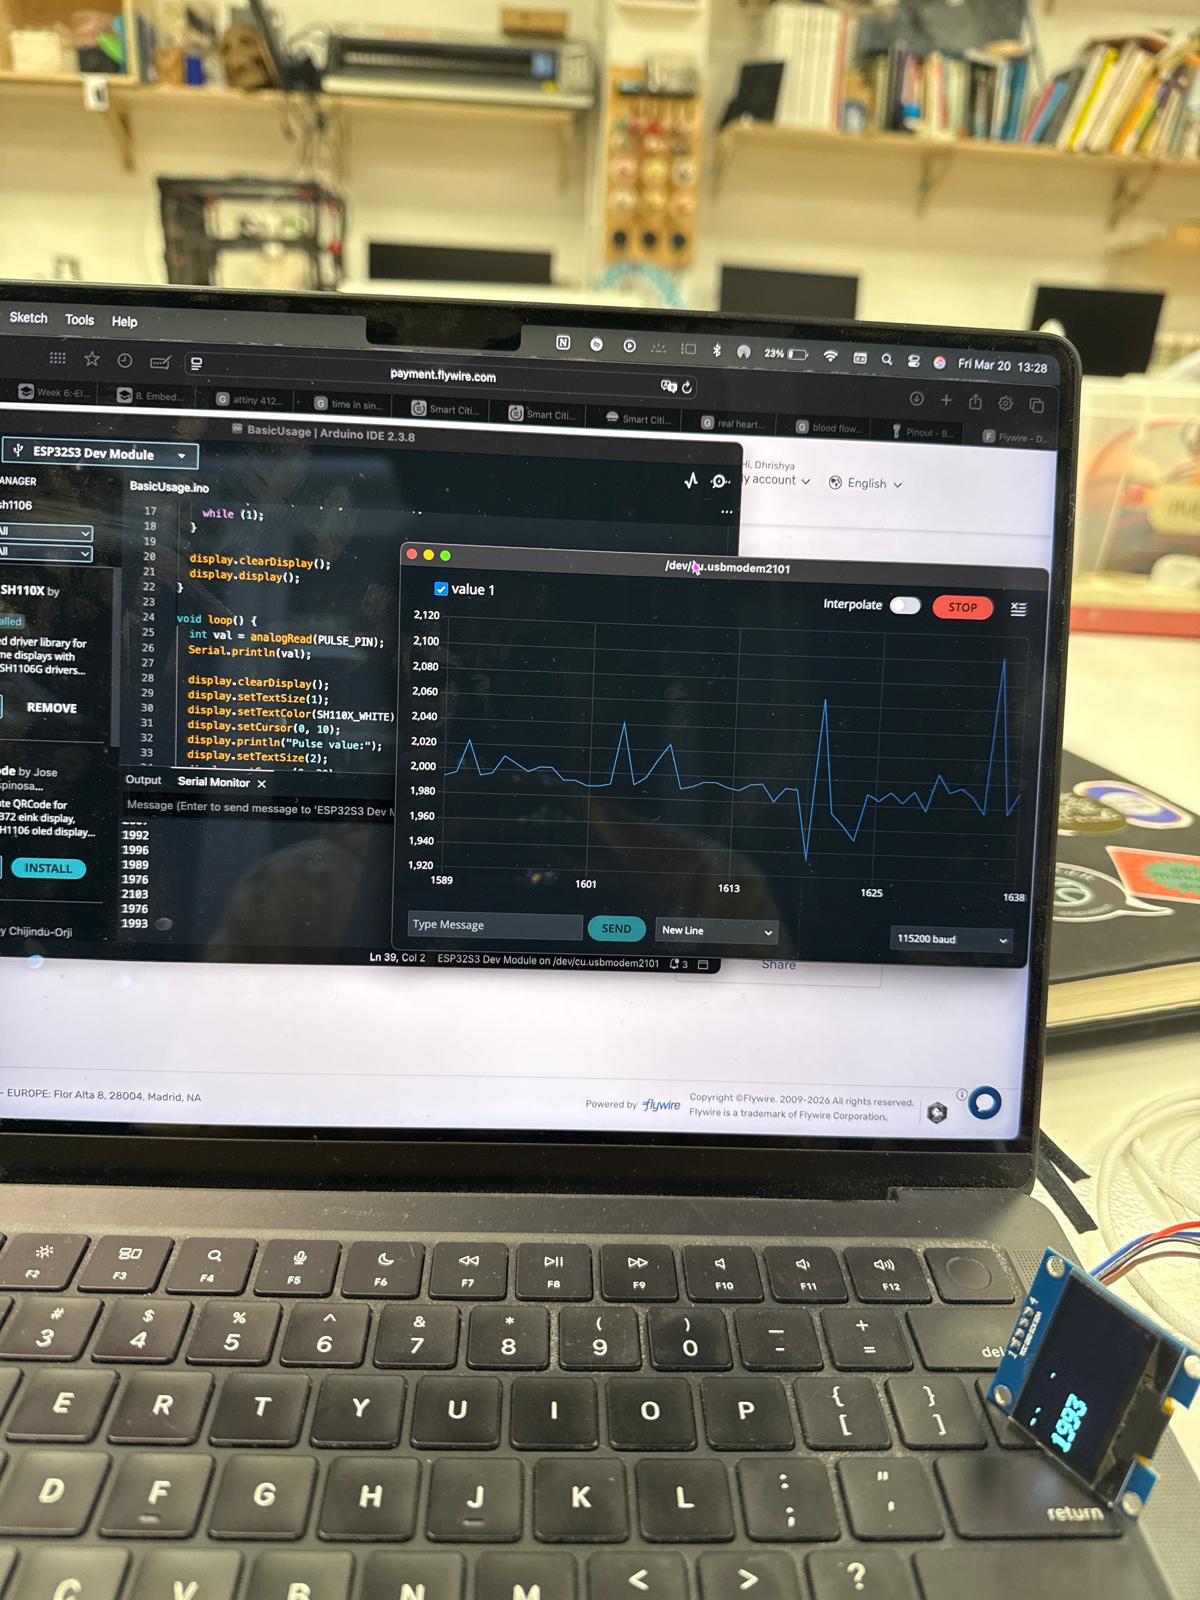
i wrote a small code to show the pulse sensor input into a serial monitor.
the serial monitor showed values from 0-4096, showing that it has a 12-bit system.
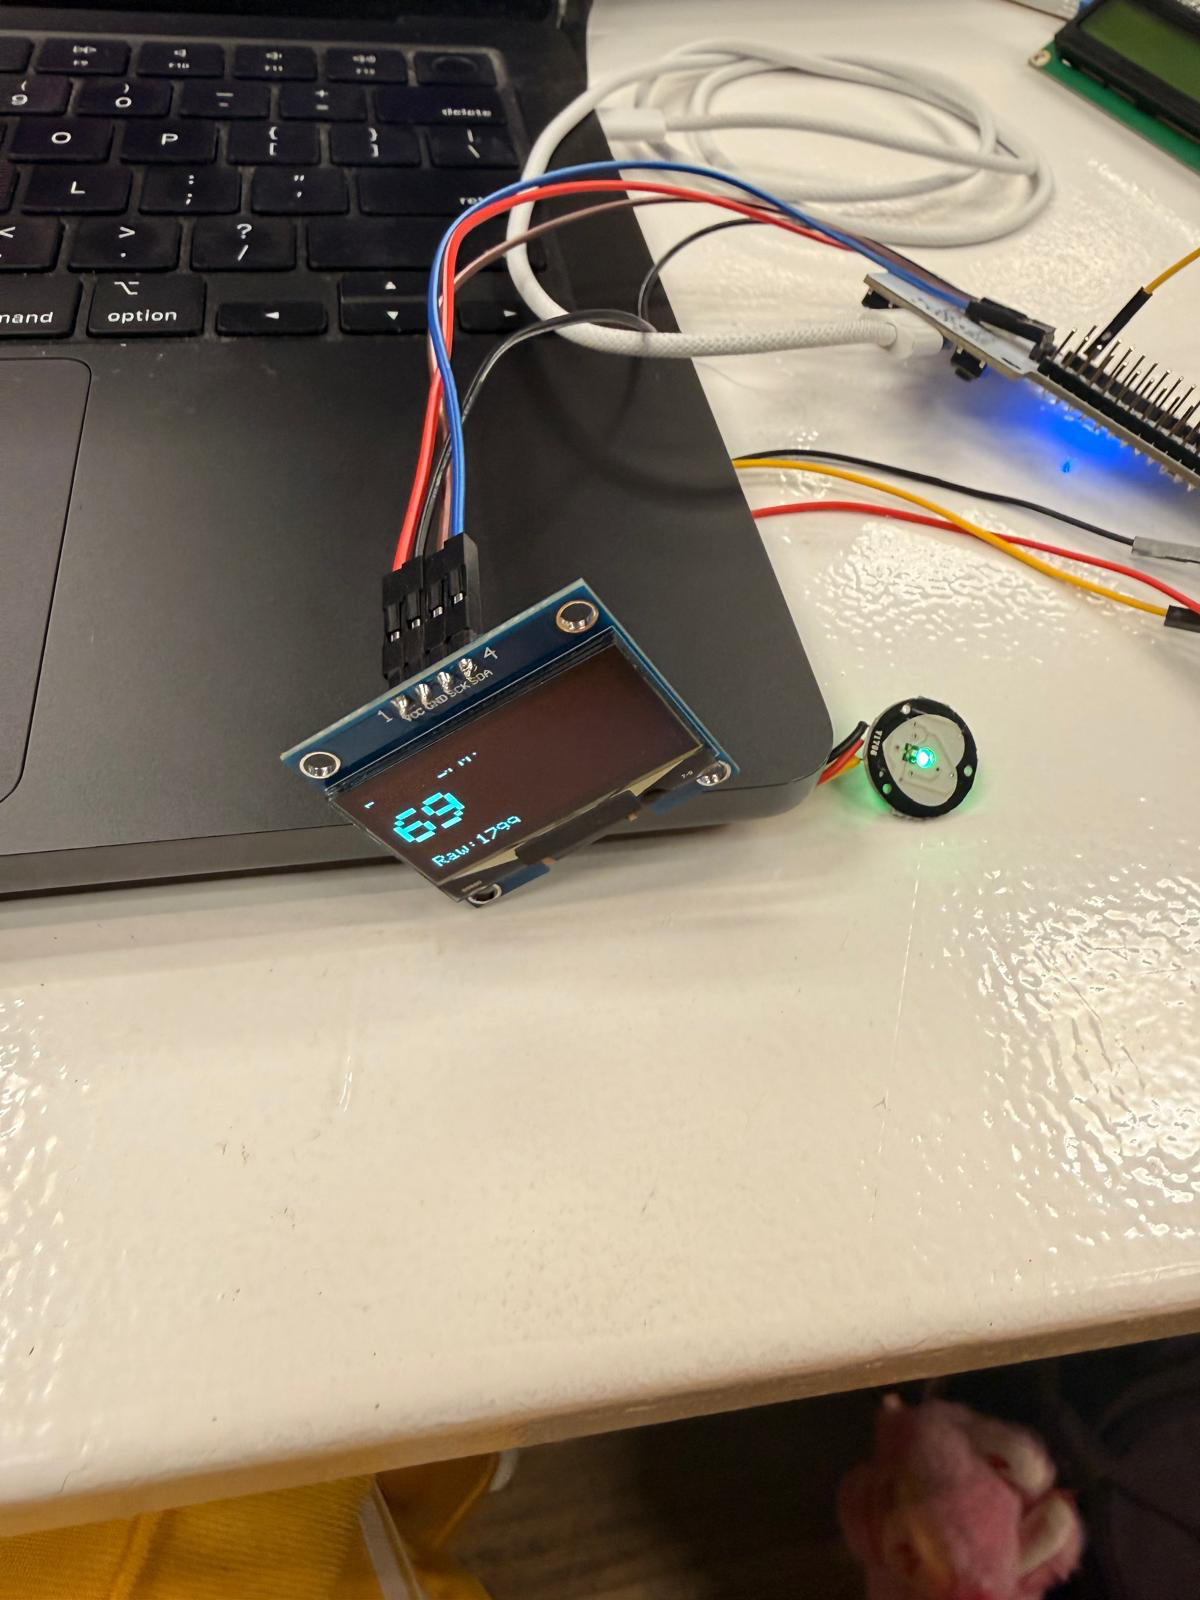
i then wrote another code to translate the values into beats per munyte (BPM), a simple waveform of the heartbeat and a small pulsating heart icon.
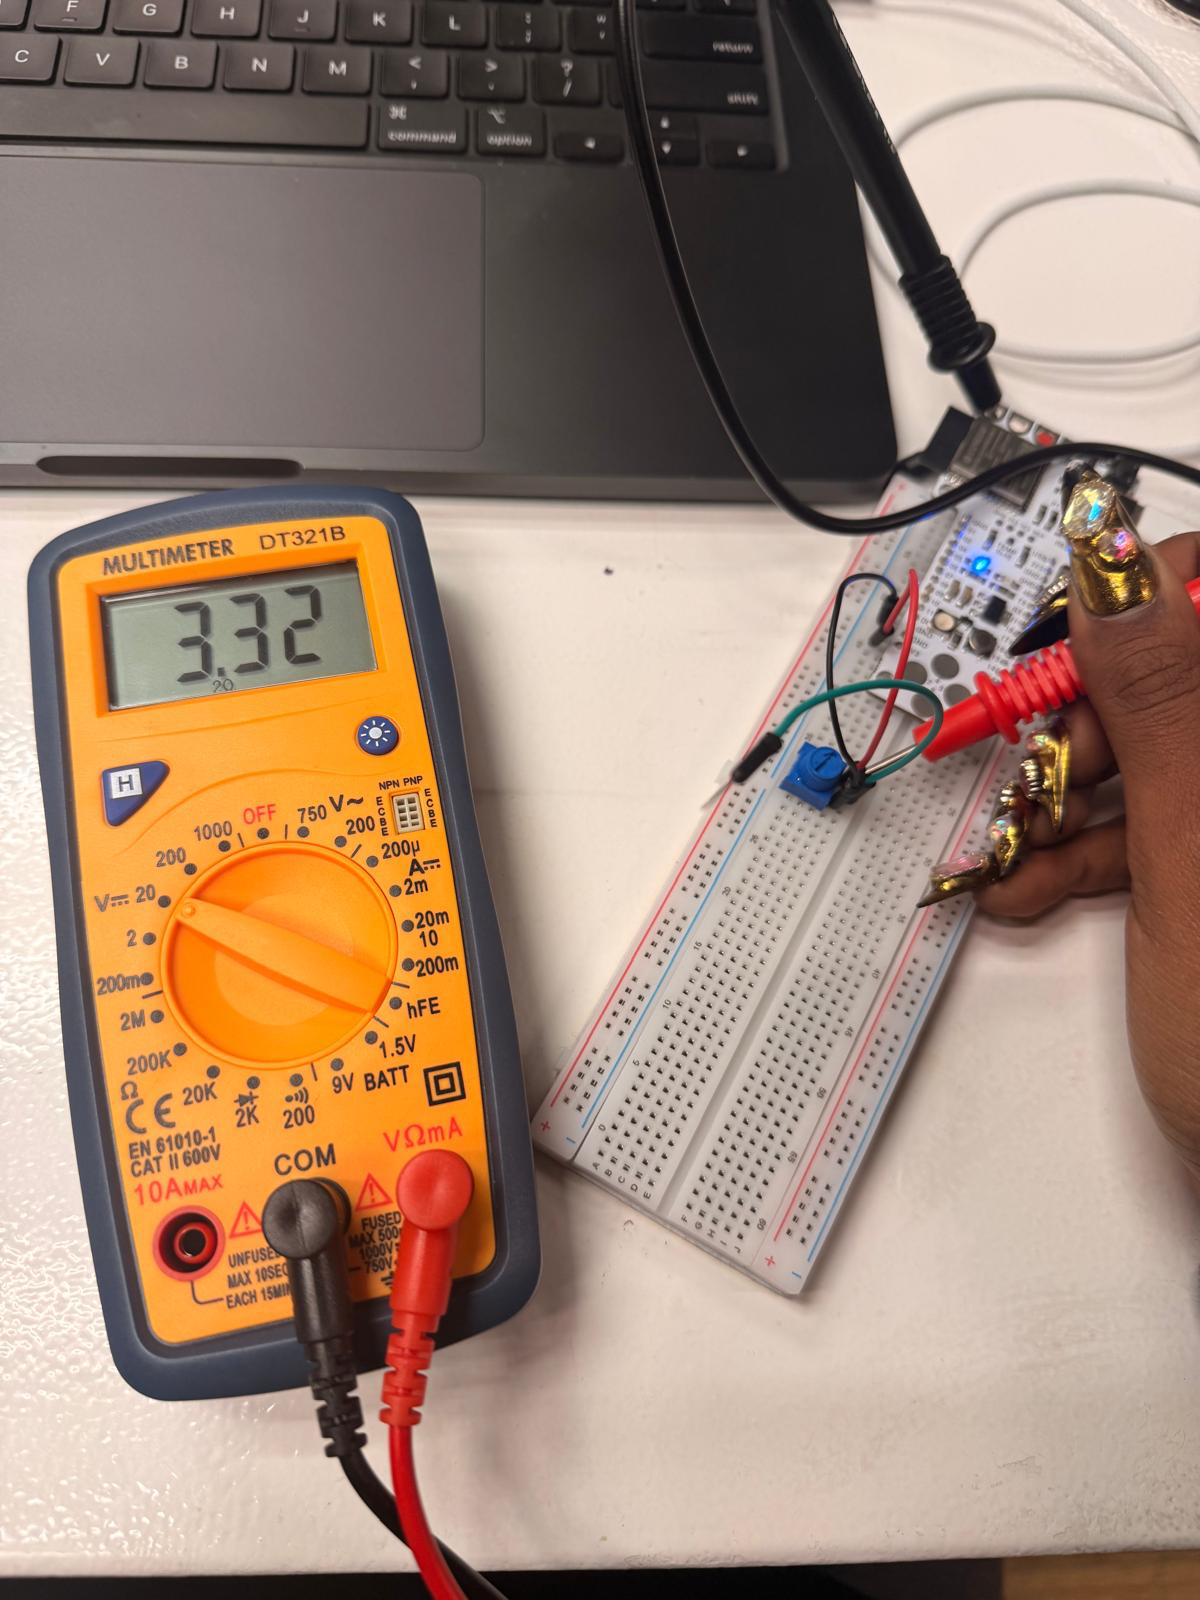
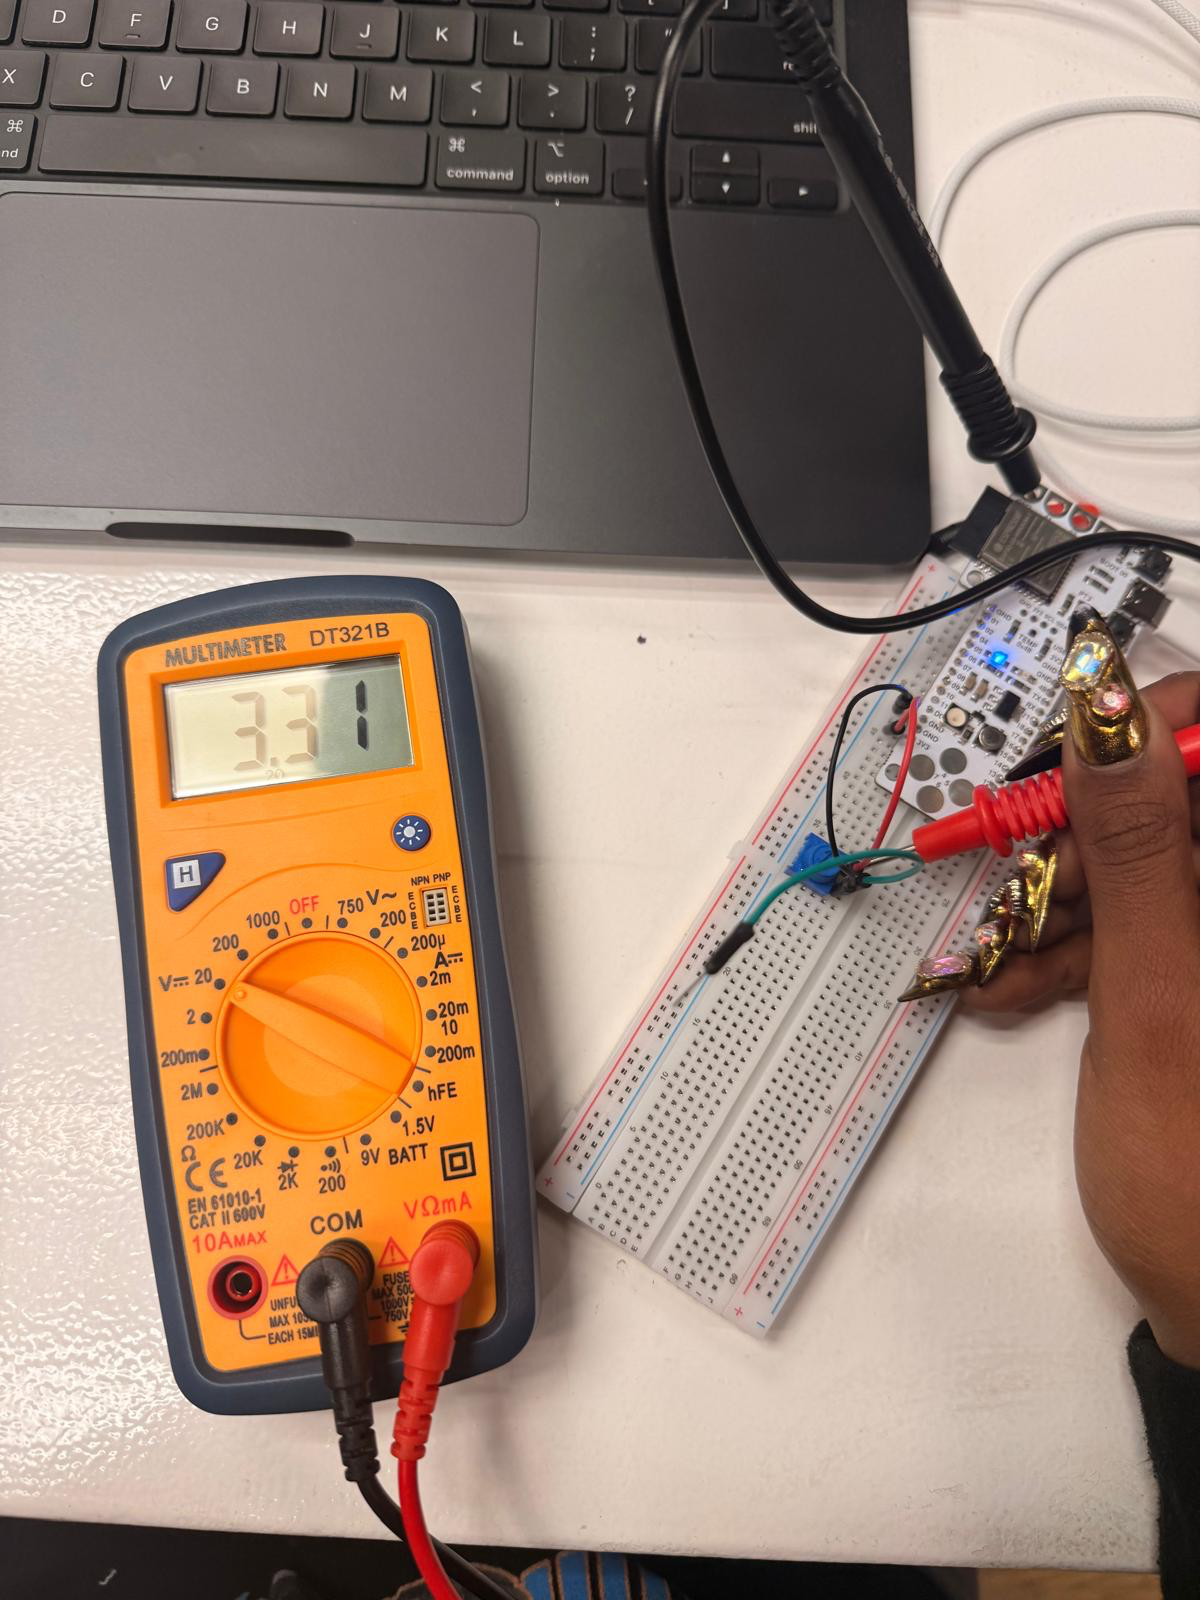
using the serial plotter, i was able to change the threshholds to maximise the calibration and visualise clear signals from the pulse monitor
now i need to connect this system to the board that i created
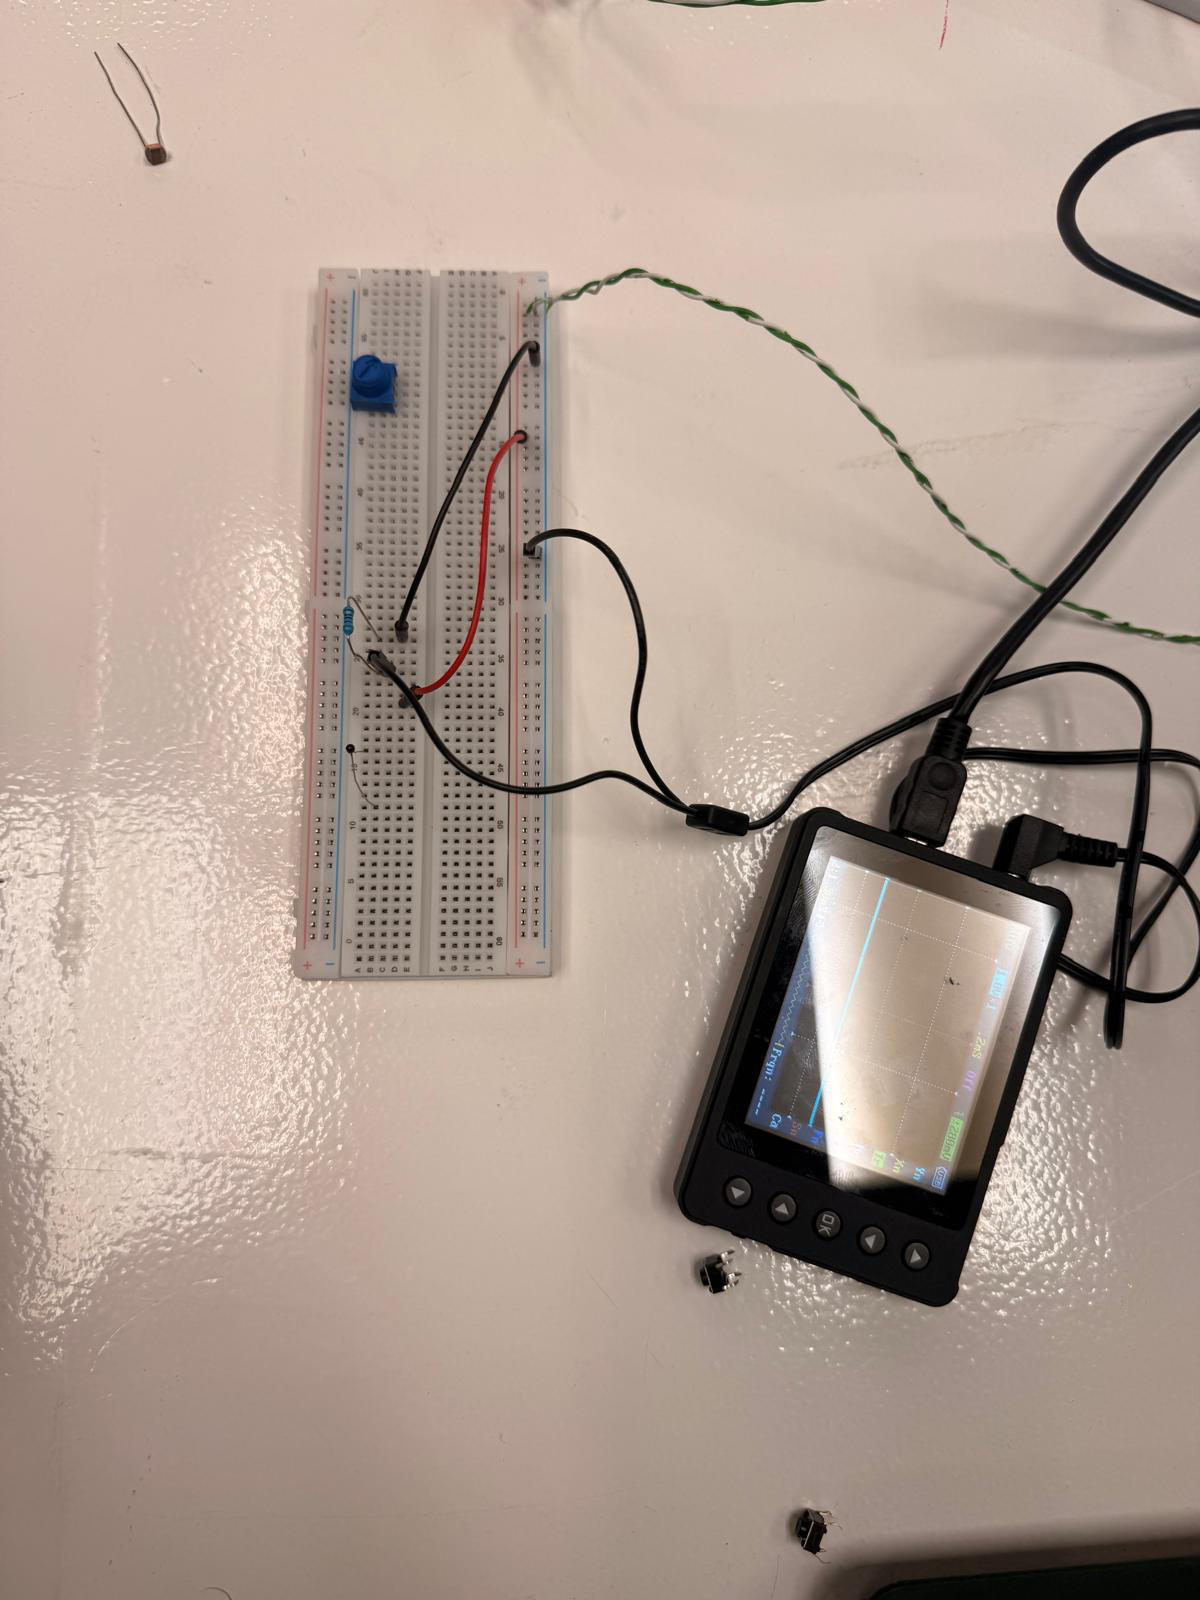
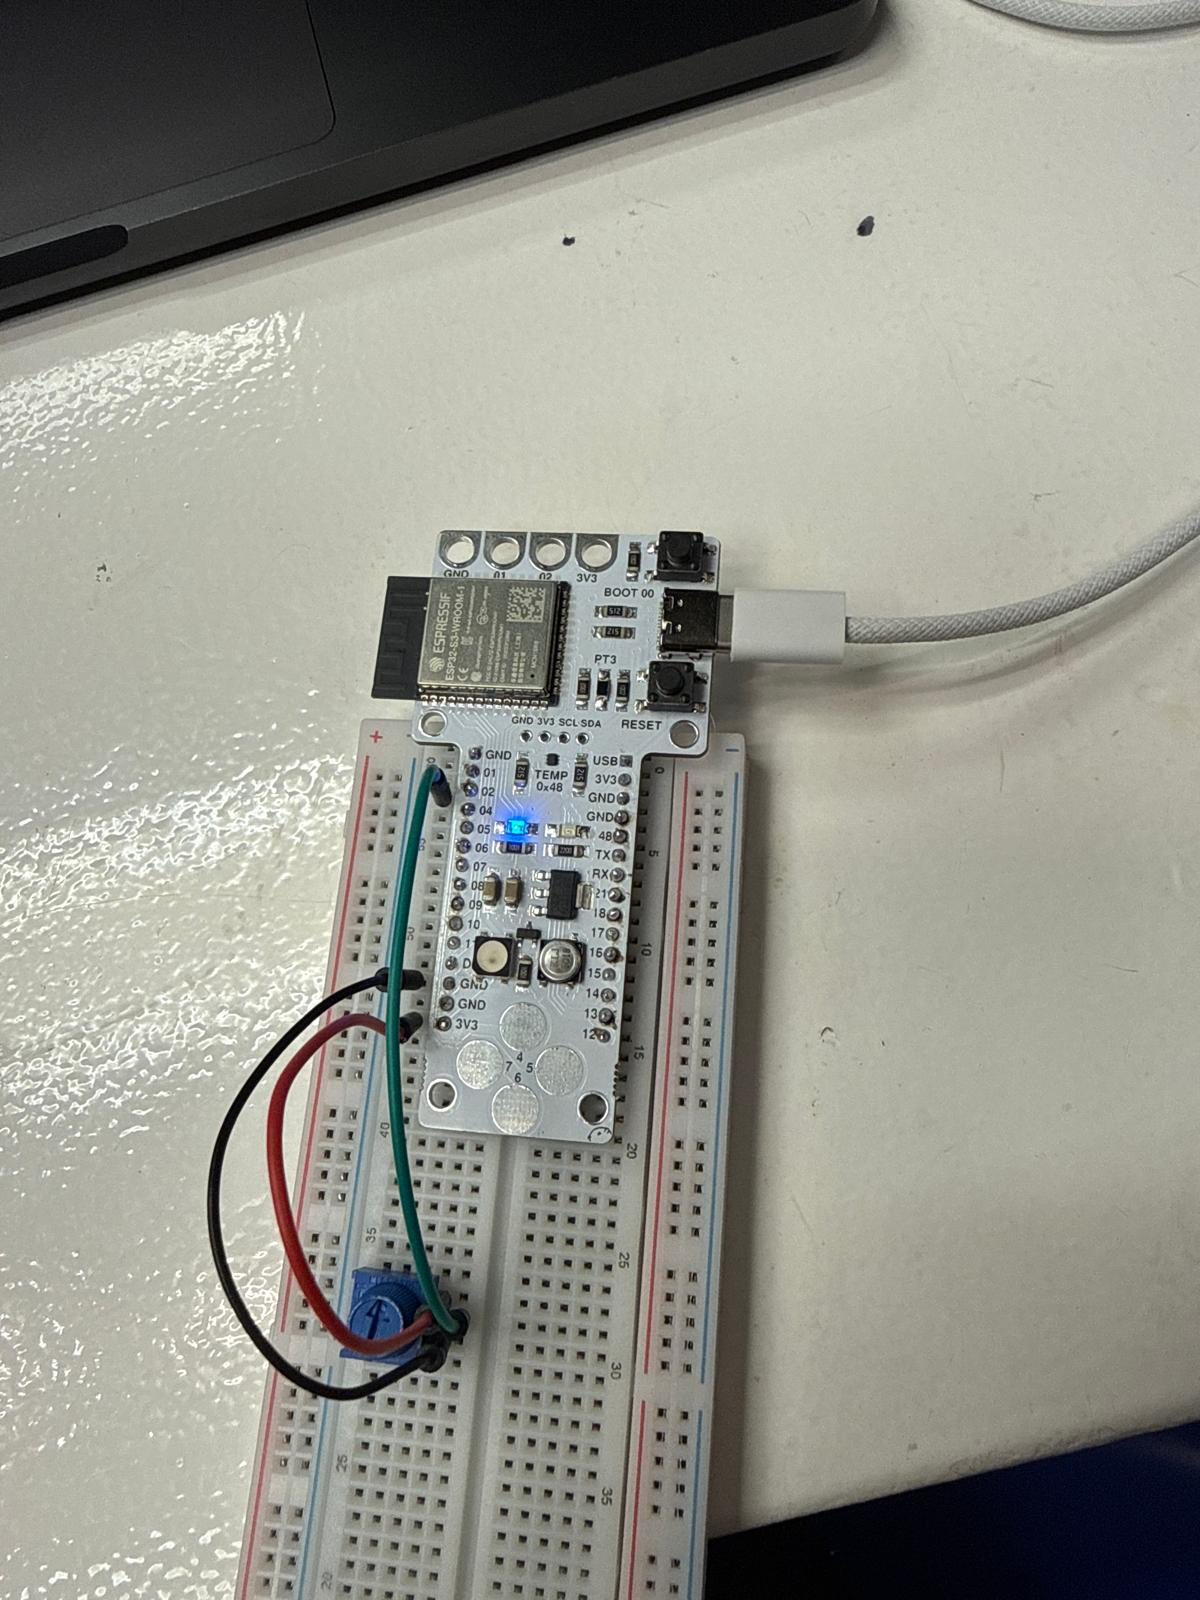
Now i decided to explore a pulse sensor with a ESP 32 board that I designed
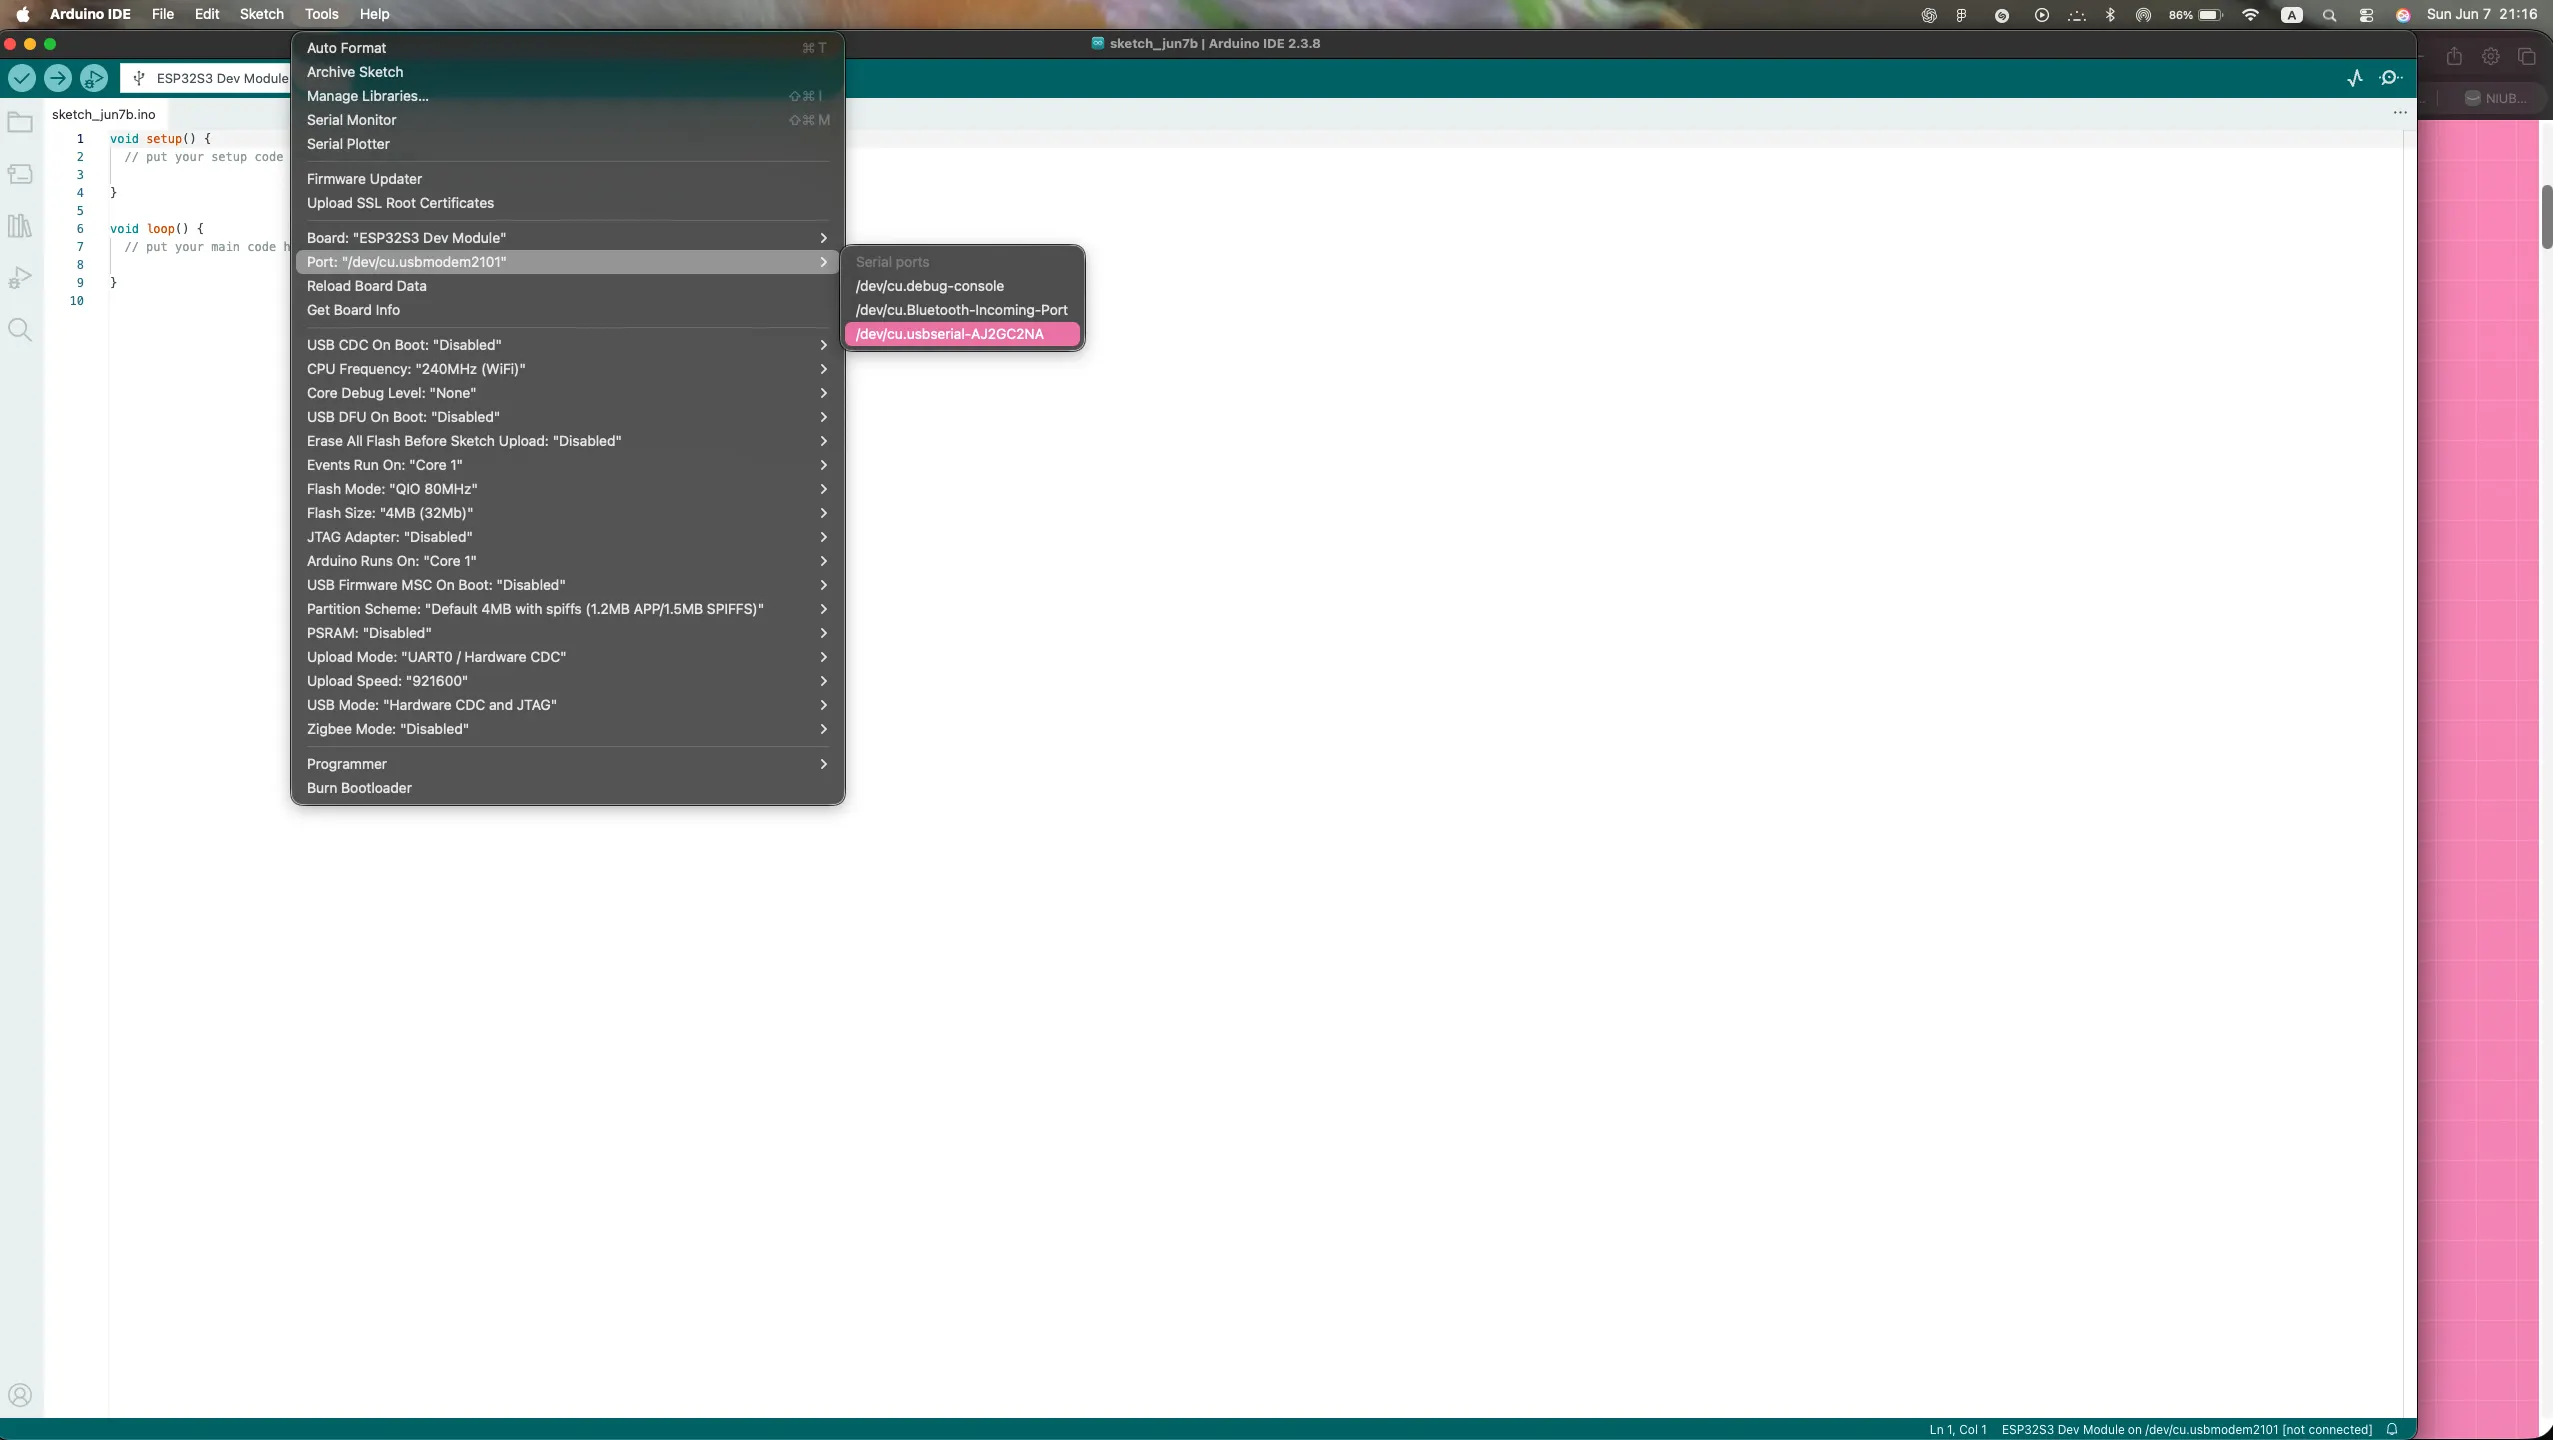
I connected the board with the serial connection UART header on my board to this UART adapter that I found on Amazon
selecting the port
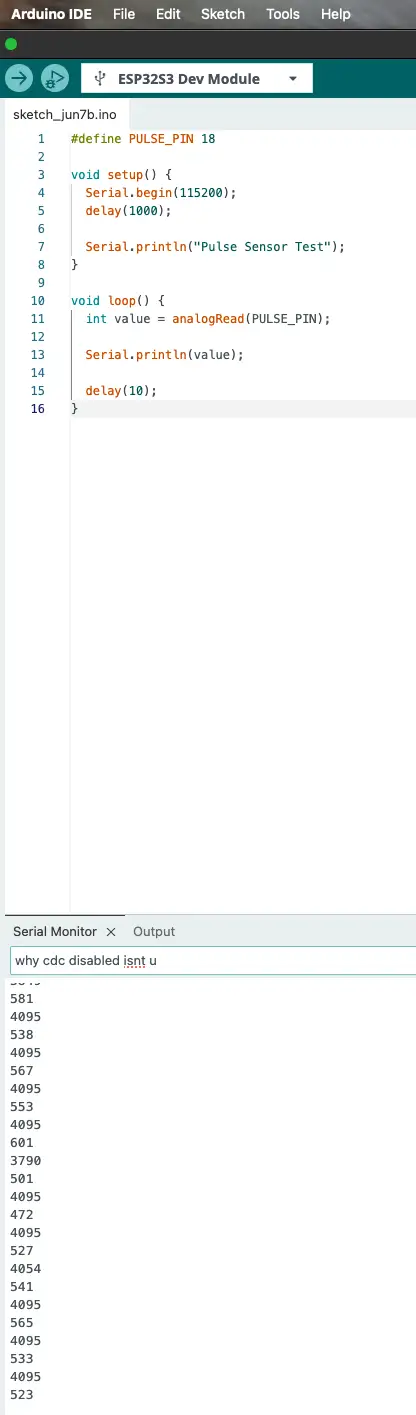
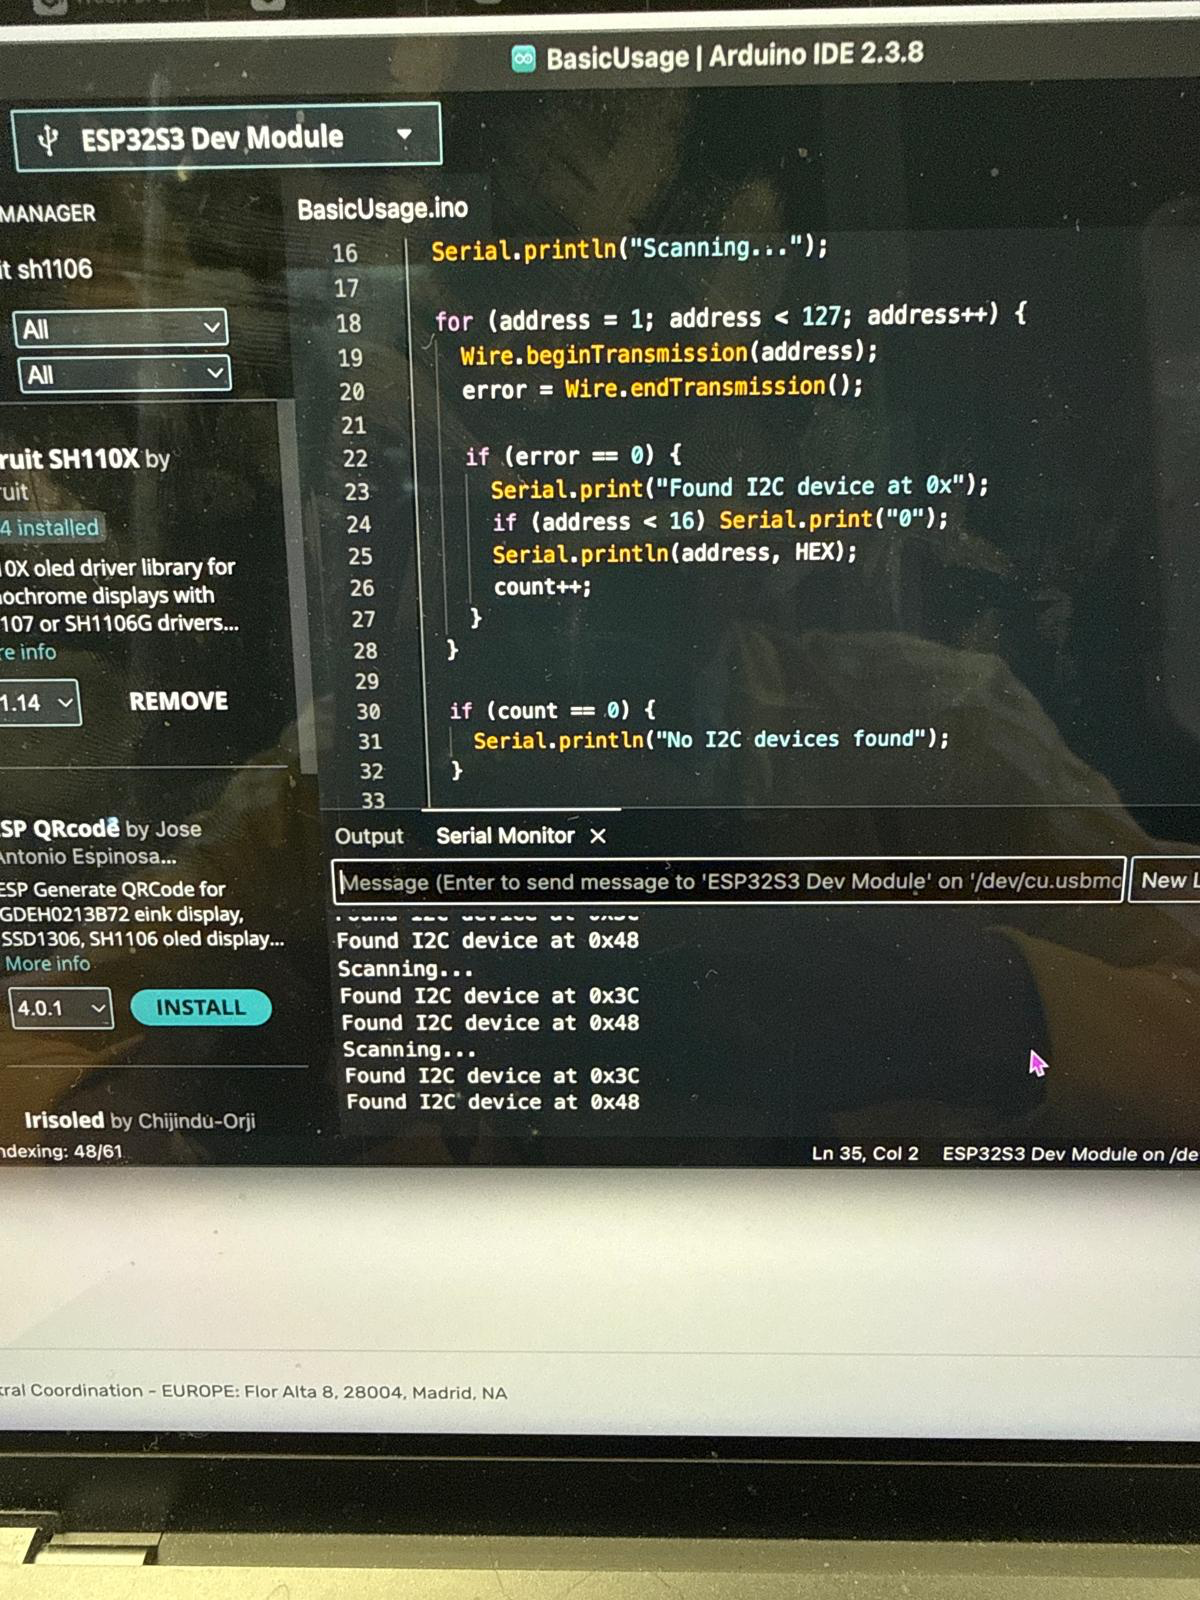
I've input this test code to see what happens
link to arduino code
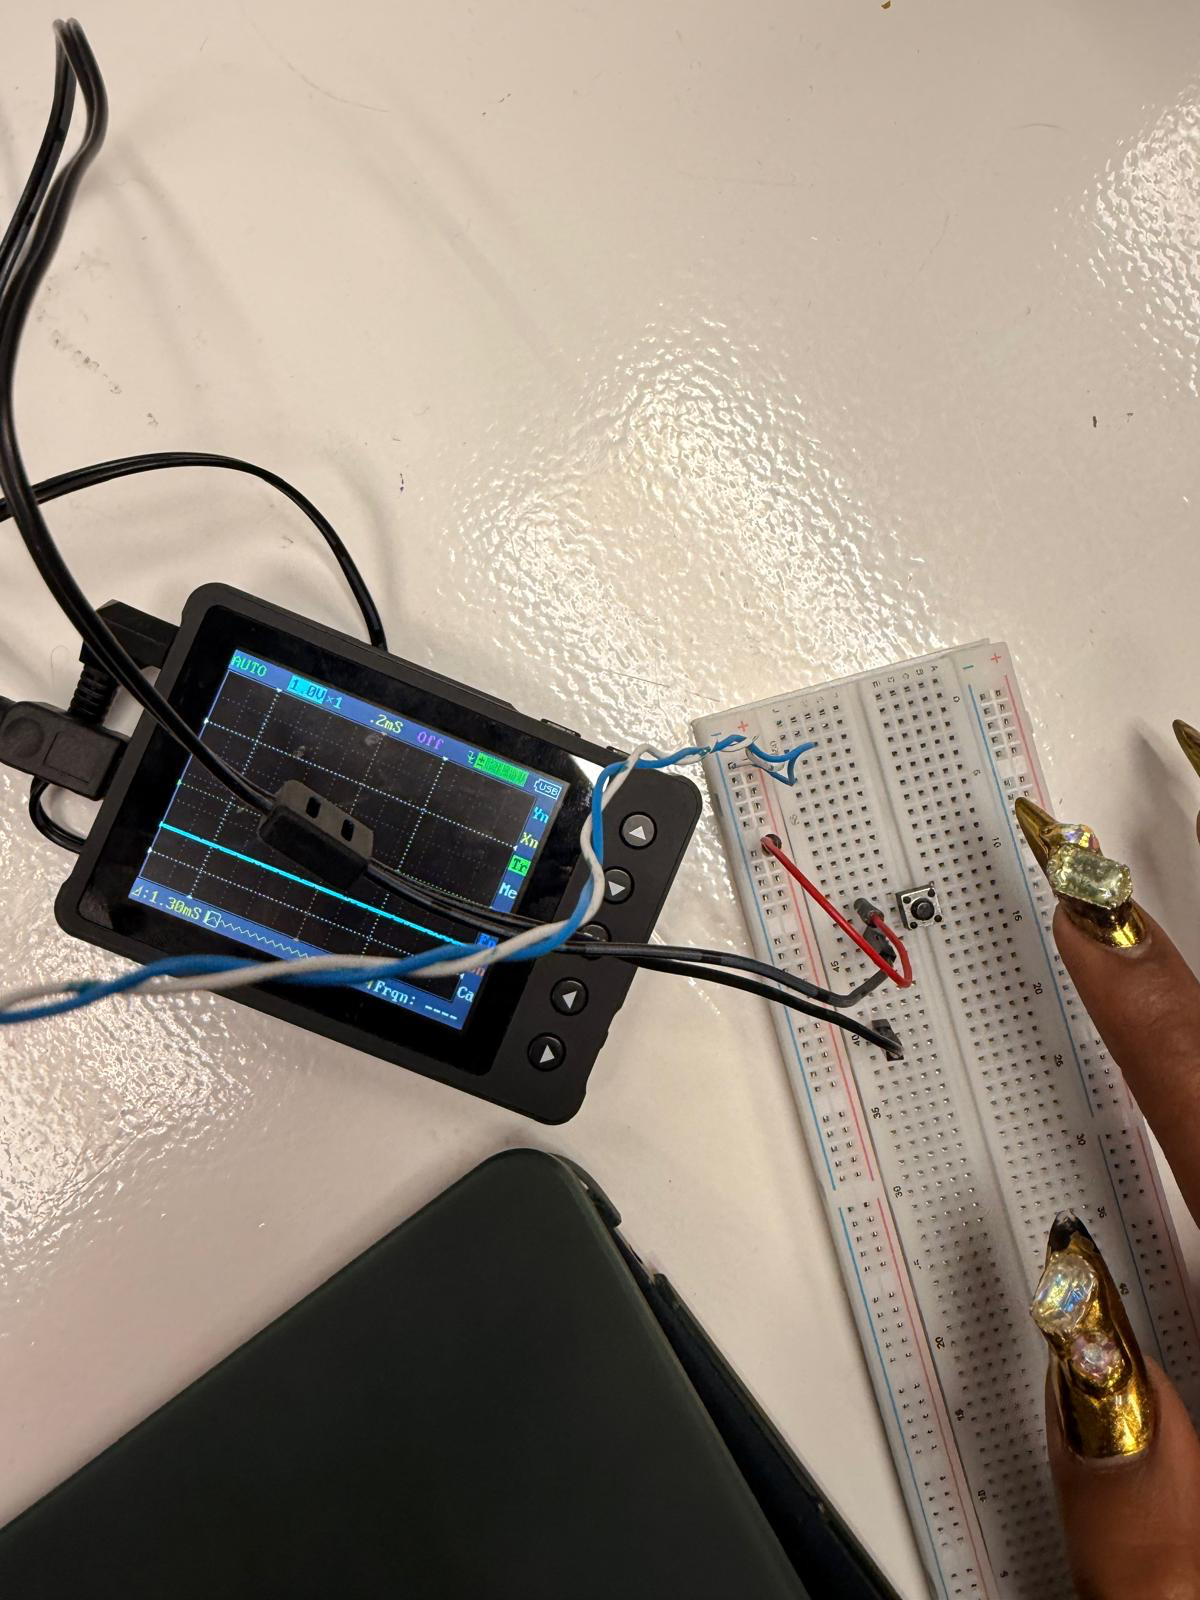
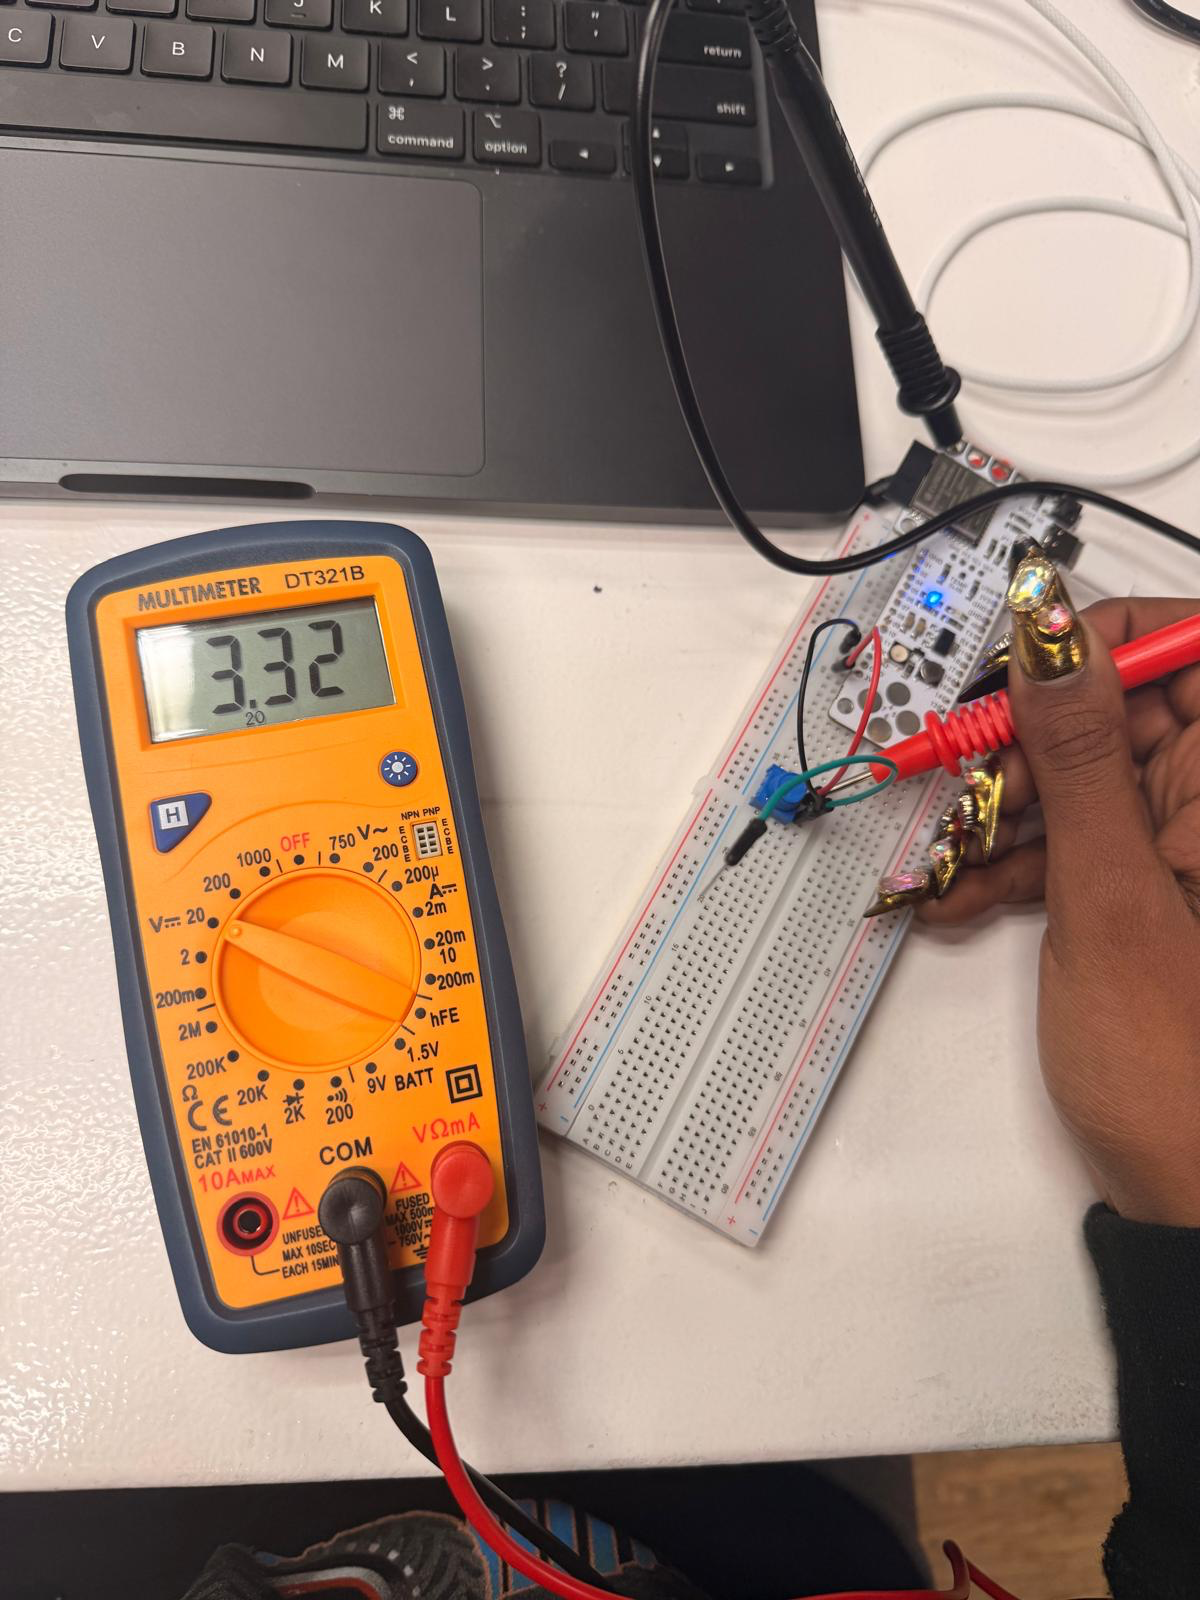
the values were moving really fast between 0 and 4096 since it has a 12 bit system
I decided to change the delay to 100 to see what was happening more clearly
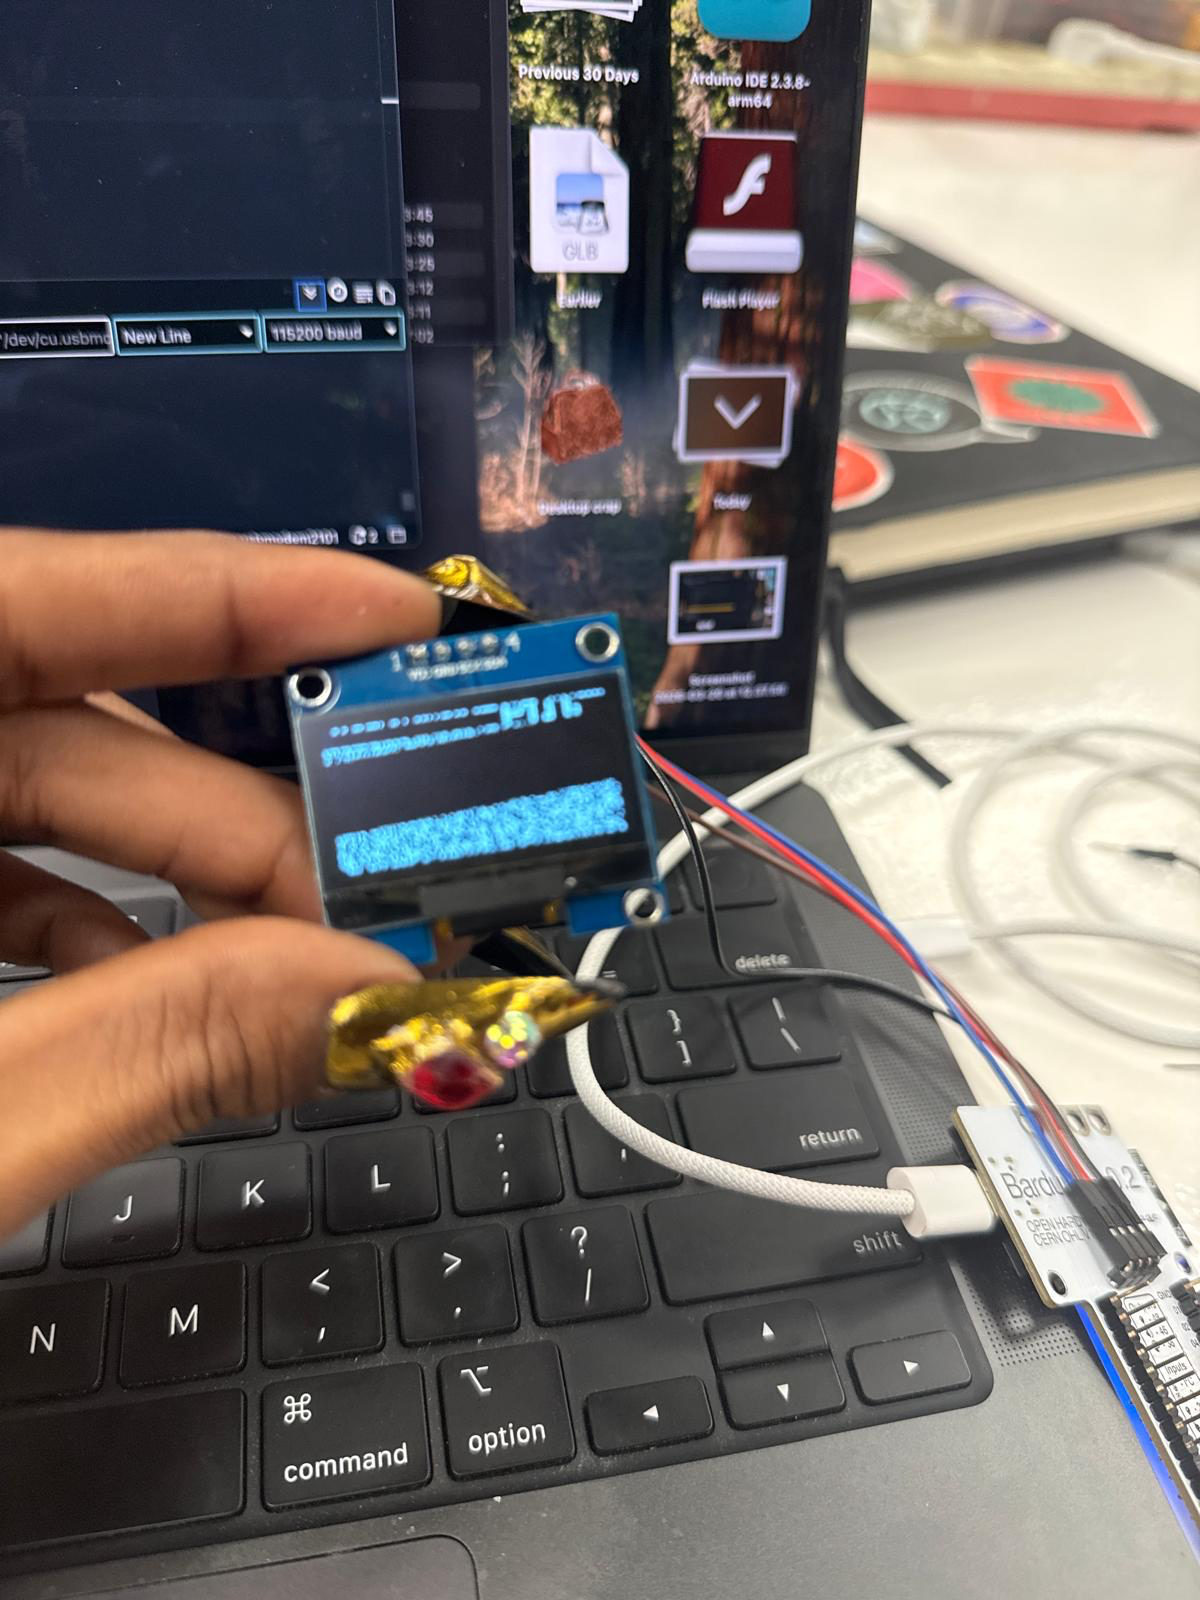
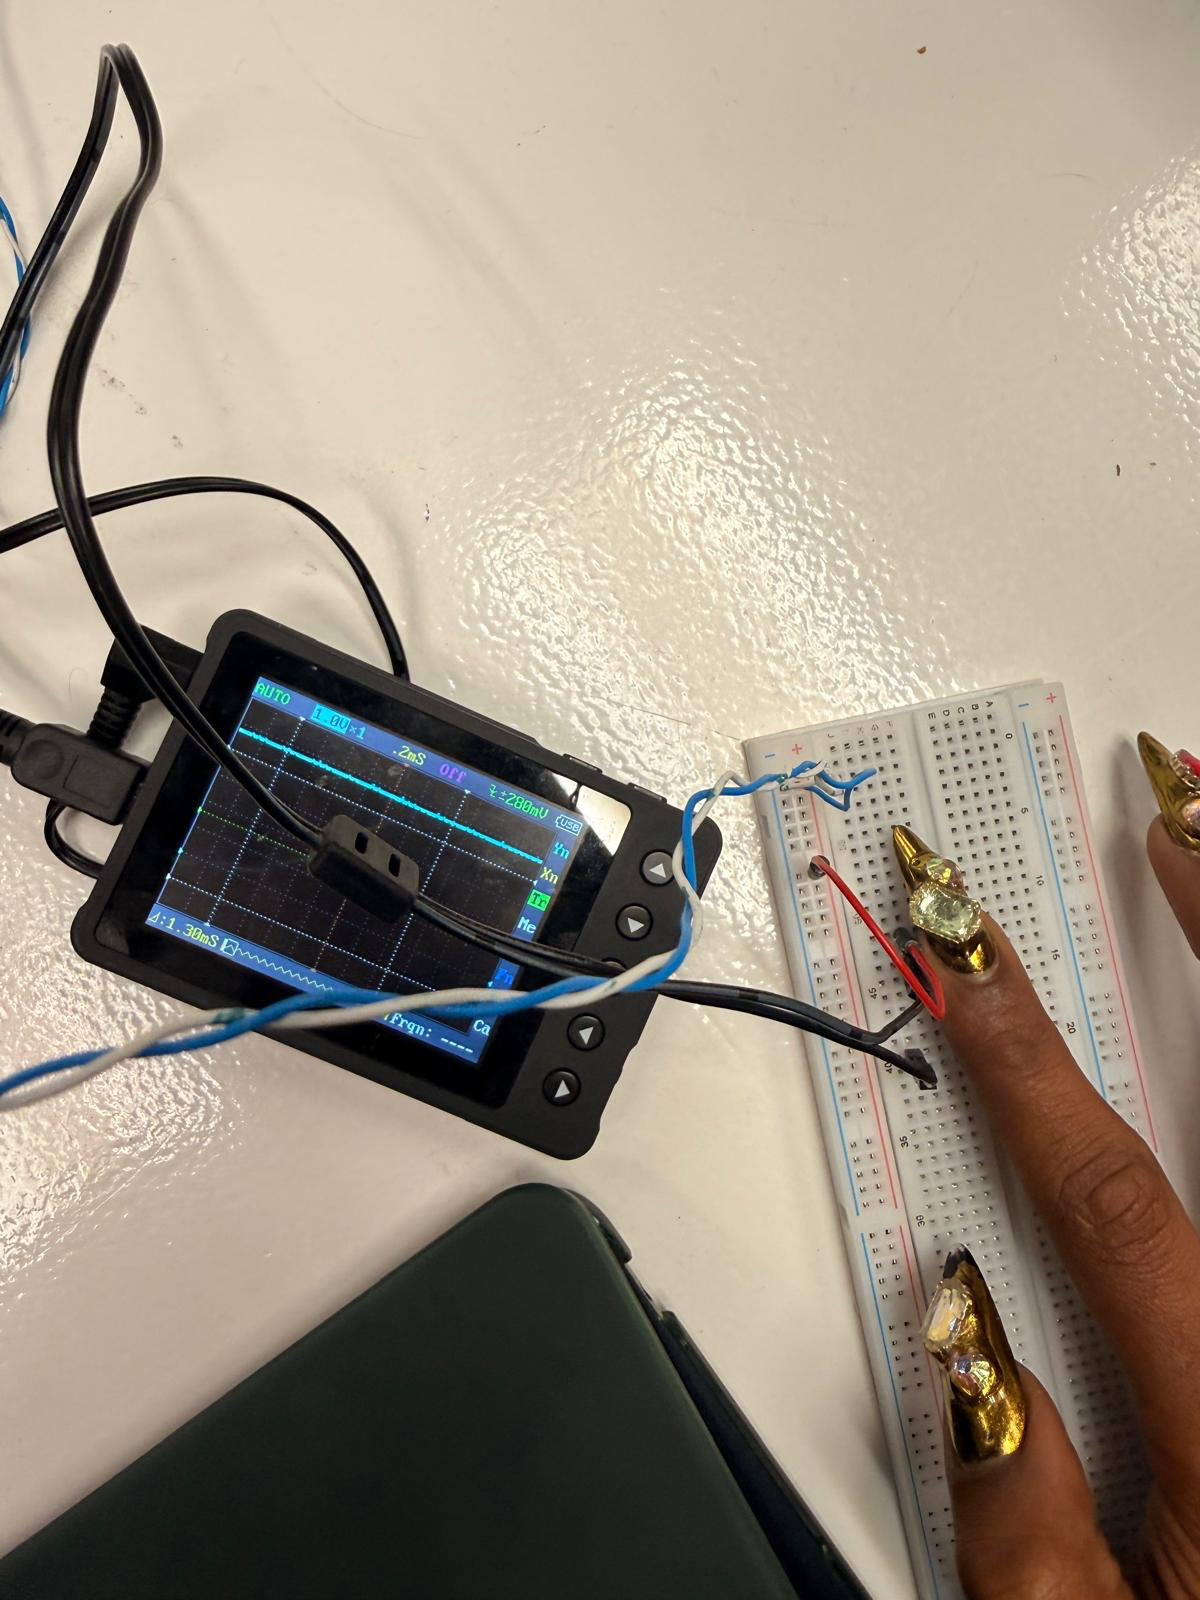
When I touched the sensor, the value was lower and when I didn't, the value were higher
So I used this code to visualise the pules sensor inputs on the serial plotter when my finger was on/off the sensor. I had to adjust the threshold values until finger on/off was clearly differentiated
Reflection
I learnt that the sensor is light dependent and senses the change in blood oxygenation. This is a pretty sensitive one and if it is calibrated well, it can be used for real biofeedback data. This is quite exciting and I will explore it more for my final project
1
2
3
4
5
6
7
8
9
10
11
12
13
14
15
16
17
18
19
20
21
22
23
24
25
group assignment
here is the link to the group assignment page Group Assignment week 9
notes
Put your notes here.