assignment
- individual assignment:
- write an application that interfaces a user with an - input &/or
output device that you made - group assignment:
- compare as many tool options as possible
The full group assignment can be found here
Group Assignment
Matlab
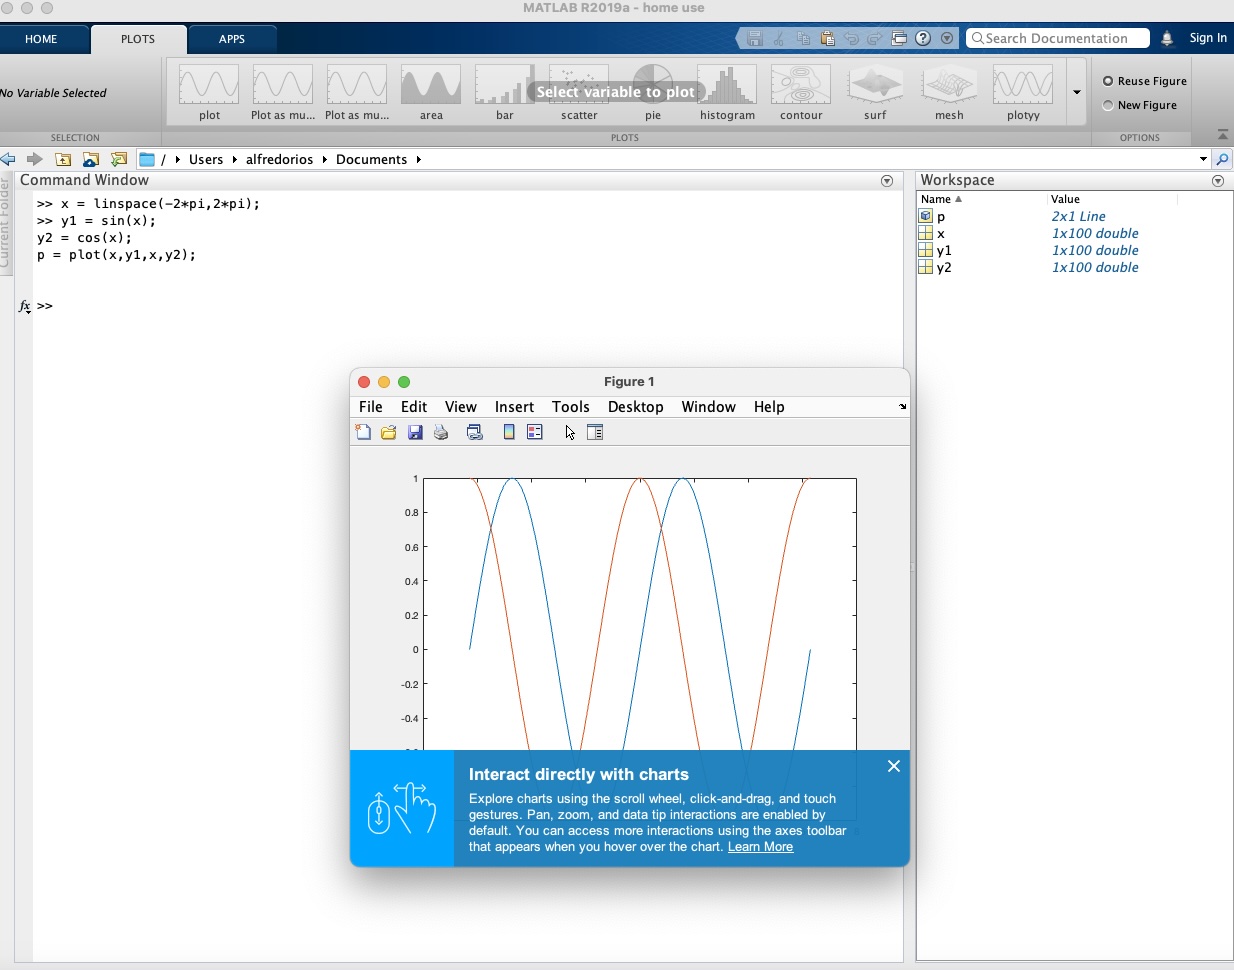
For the group assignment I tried Matlab. Matlab is a software package geared to mathematicians and specially engineers. There is a non commercial equivalent named Octave. Matlab can be used for data analysis, algorithm development and has good matrix manipulation modules. Has a rich interactive environment. It has a lot of toolboxes for example for image processing.
Mathematica
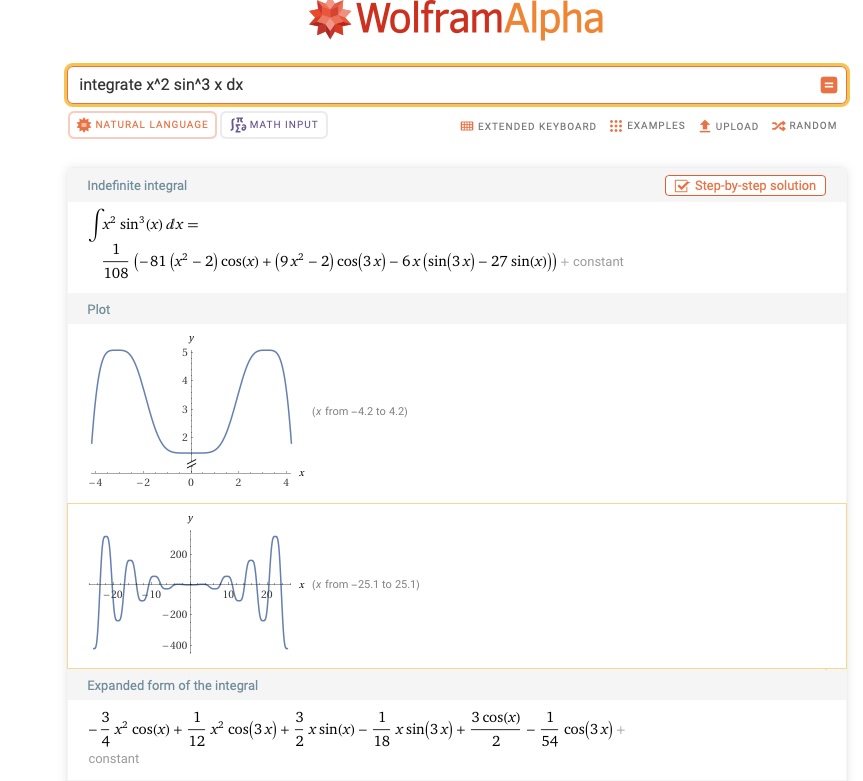
Mathematica is a powerful software platform designed for symbolic computation. It can be used to solve problems in algebra, calculus, and various areas of theoretical mathematics. I’ve used it in the past primarily for algebra, and I found it quite effective. It can handle a wide range of equation systems, perform derivatives and integrations, and often provides step-by-step solutions. Additionally, it offers graphical outputs, which make the results more intuitive and visually engaging.
Conclusion
I reviewed two mathematical applications/programming environments, both of which offer interactive interfaces. However, MATLAB stands out for its broad applicability, especially in engineering. It supports a wide range of tasks—from solving differential equations and performing data analysis, manipulating matrices to simulation studies.
On the other hand, Mathematica is more tailored to the needs of mathematicians. Its symbolic language makes it easy to write and manipulate equations, and it also supports step-by-step solutions, making it a powerful tool for exploring mathematical concepts in depth.
Individual Assigment
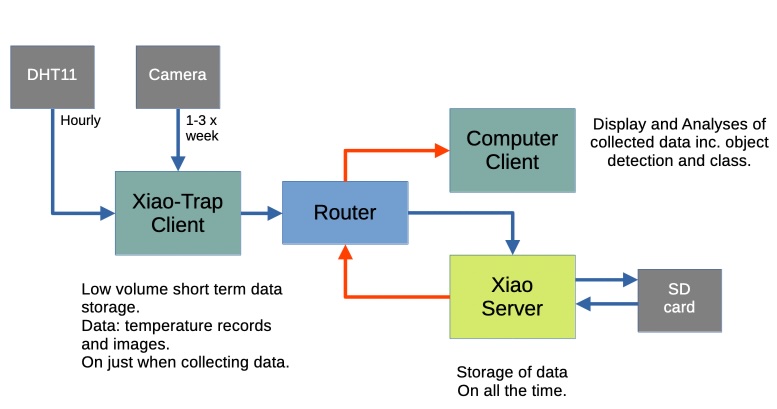
This week, I focused on continuing the development of my final project. In Week 11, I implemented Wi-Fi networking to enable communication between two Xiao boards. One board functions as a sensor or “smart trap” that captures images and collects temperature data. The other acts as a server, receiving this data and relaying it to a computer for retrieval and processing.
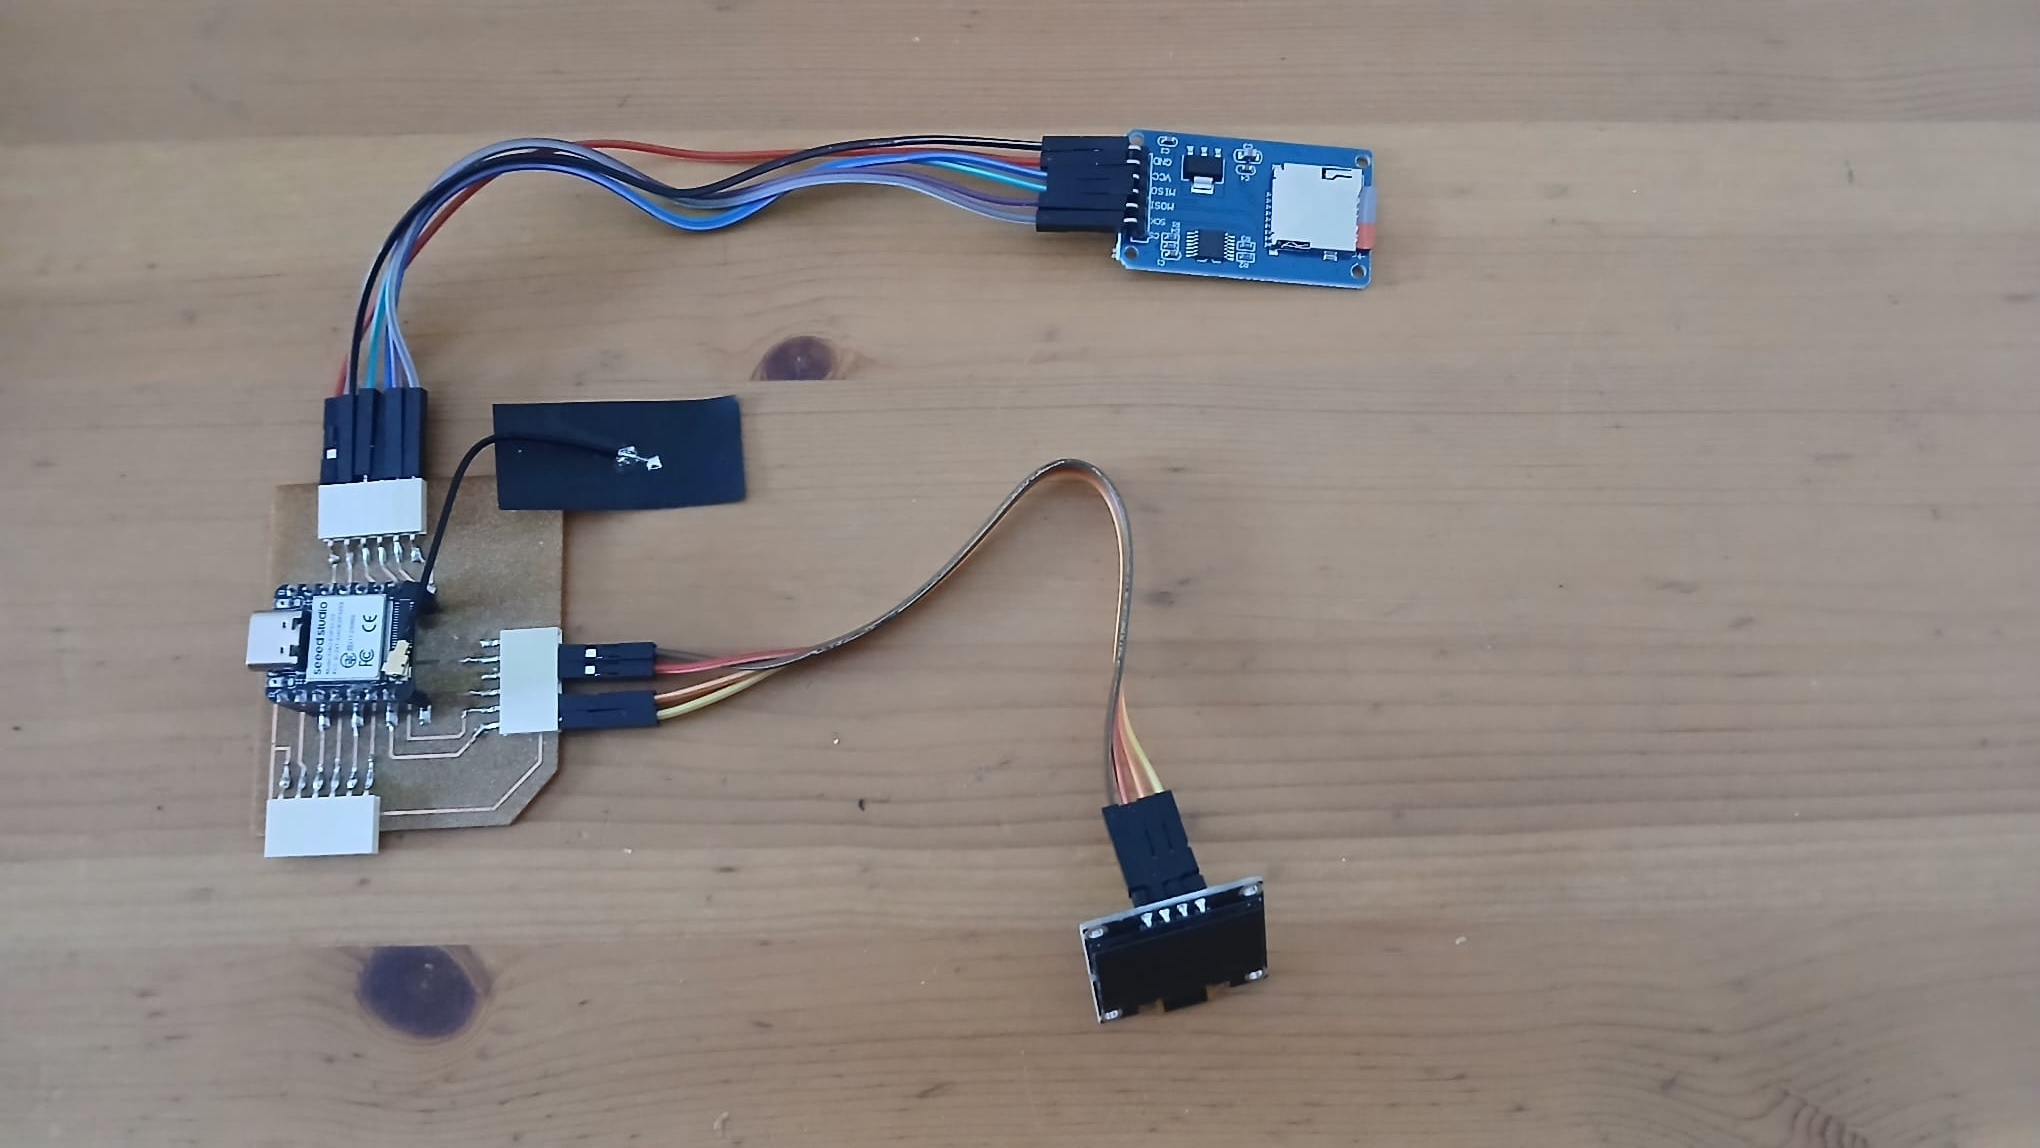
Below is a schematic representation of the communication between these three components:
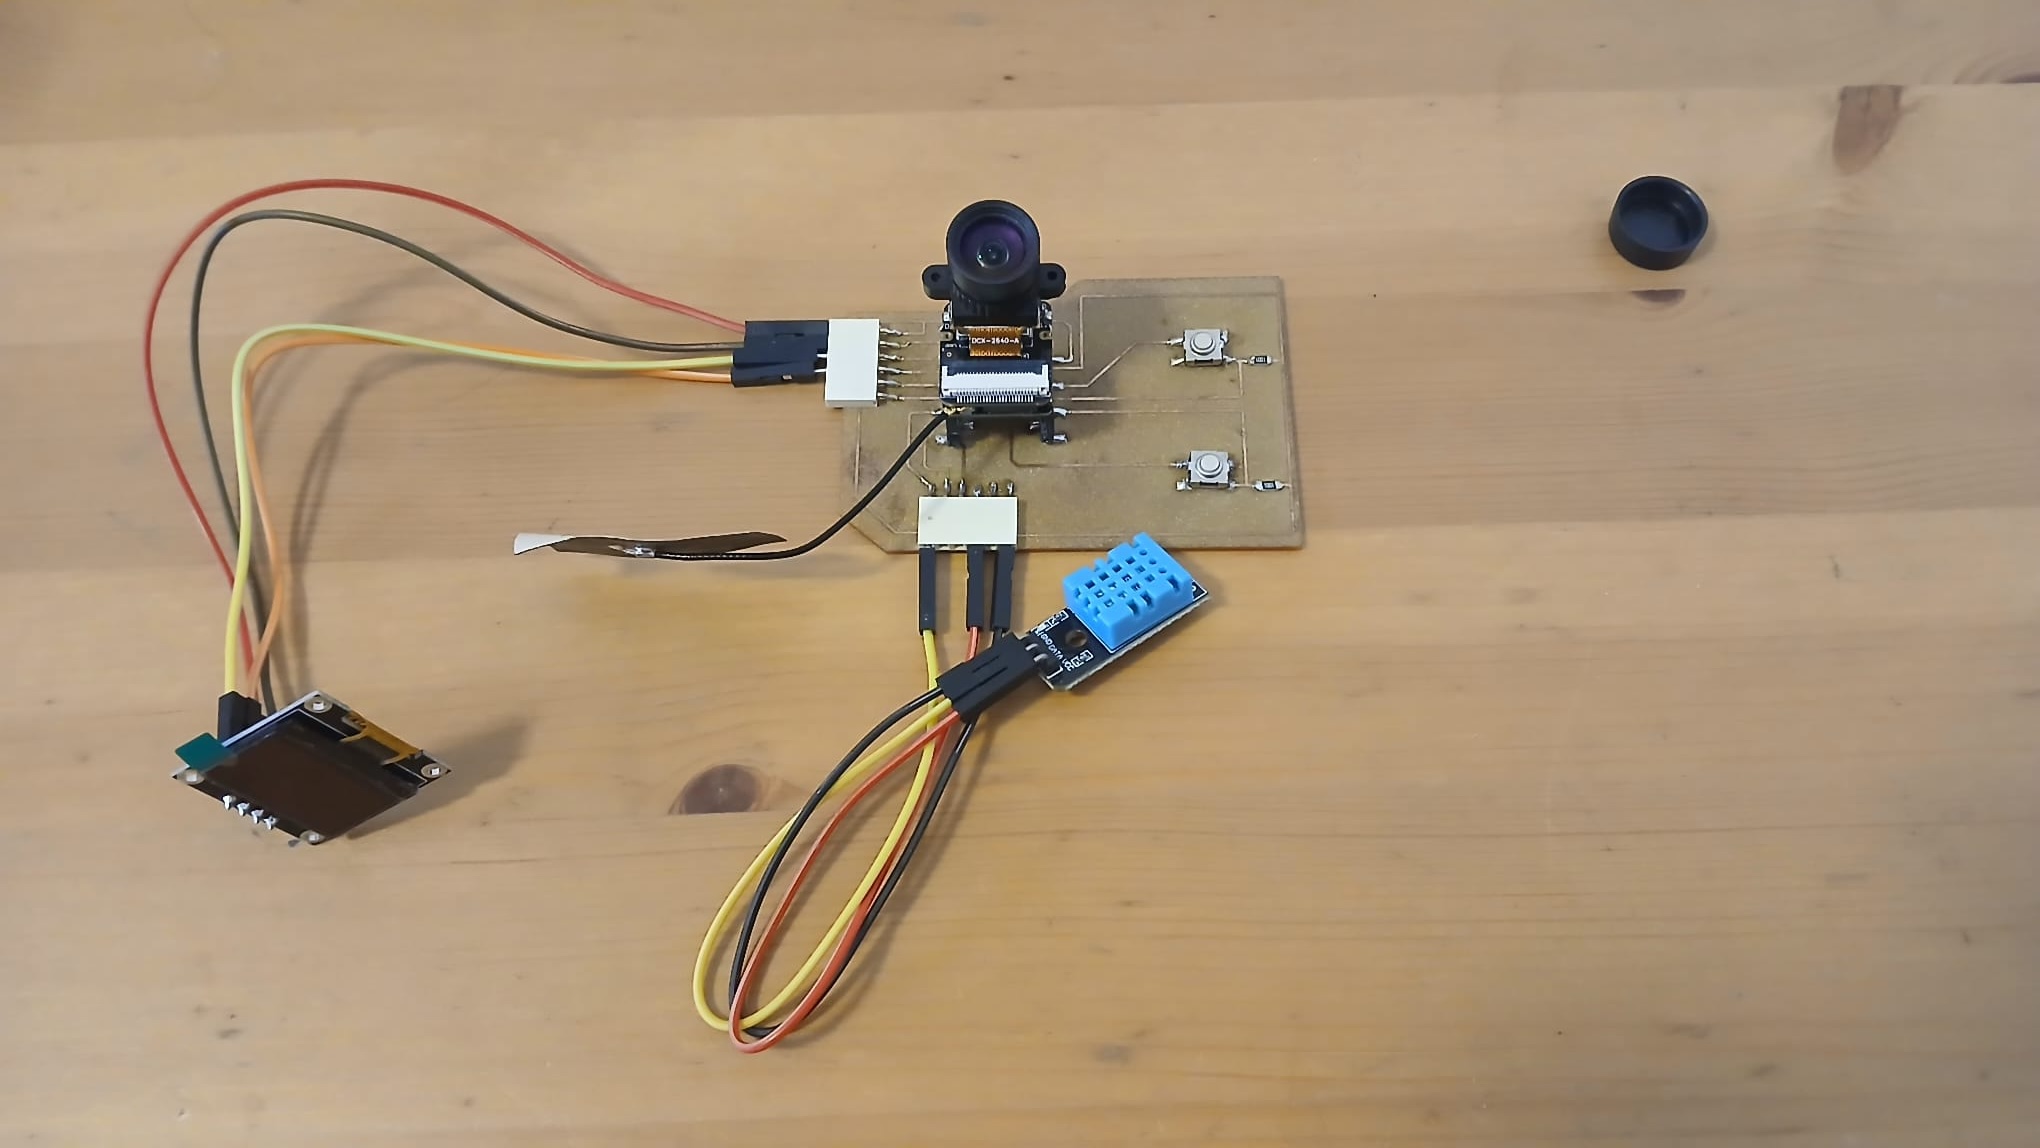
and here are the physical components:
Goal for This Week:
The objective was to develop a user interface that could:
- Connect to the Xiao server to retrieve stored data from the Xiao Smart Trap,
- Display the images captured by the trap and
- Visualize the recorded temperature data.
Result:
The final dashboard interface based on R’s Shiny framework is shown below:
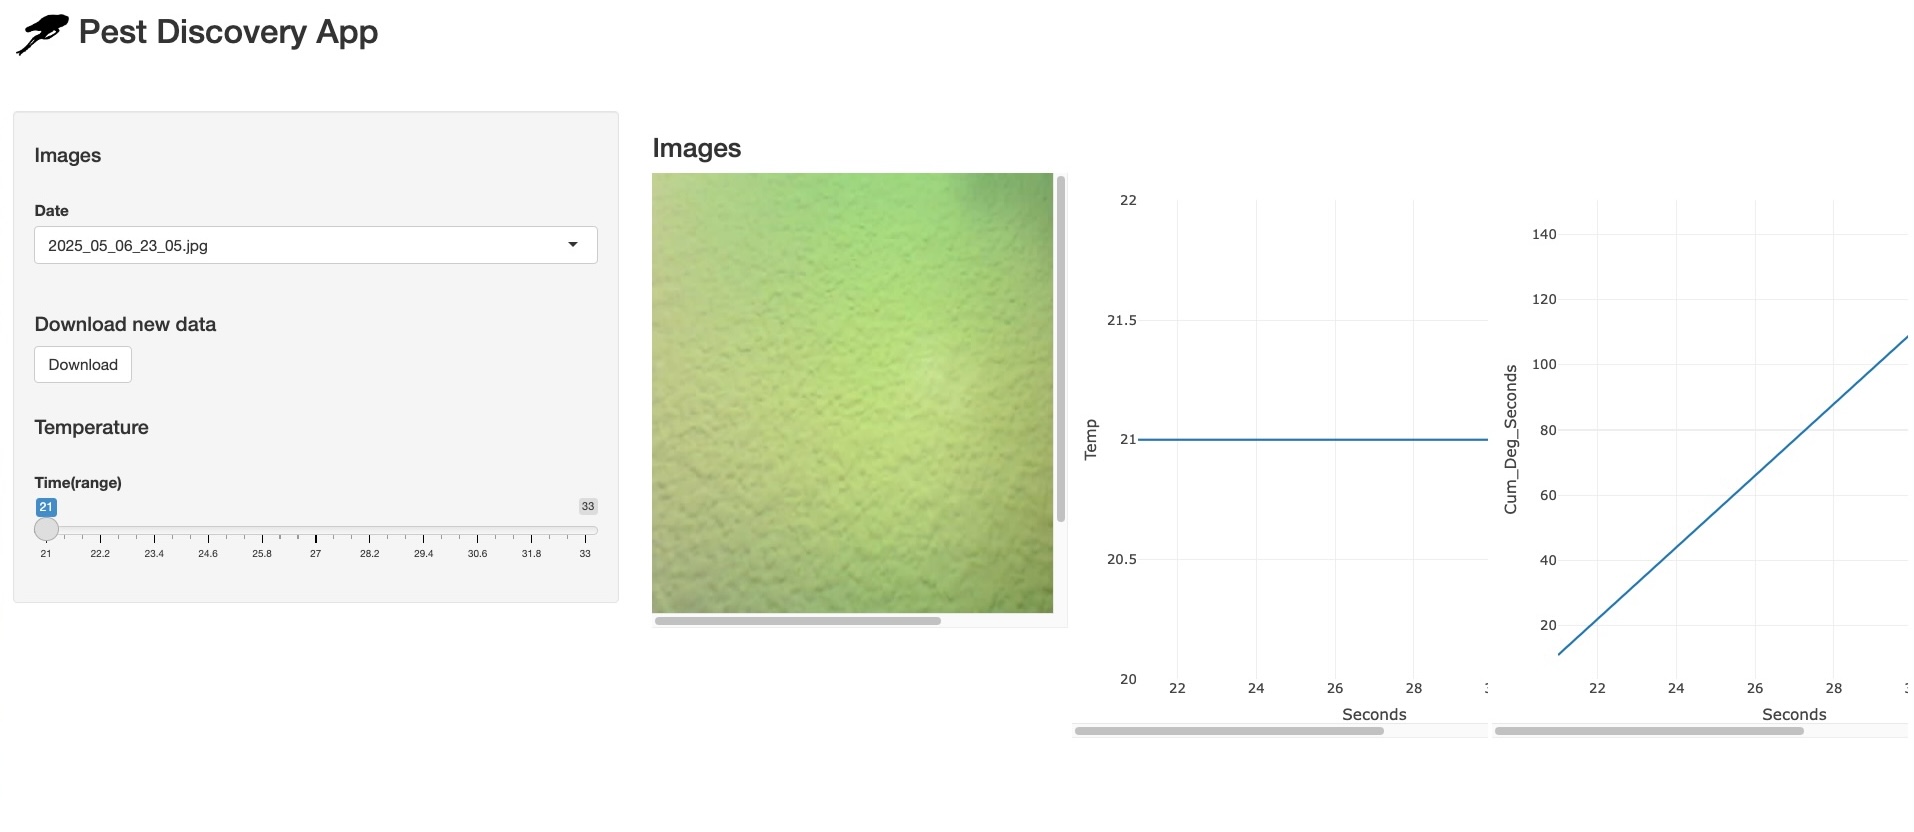
Dashboard Overview
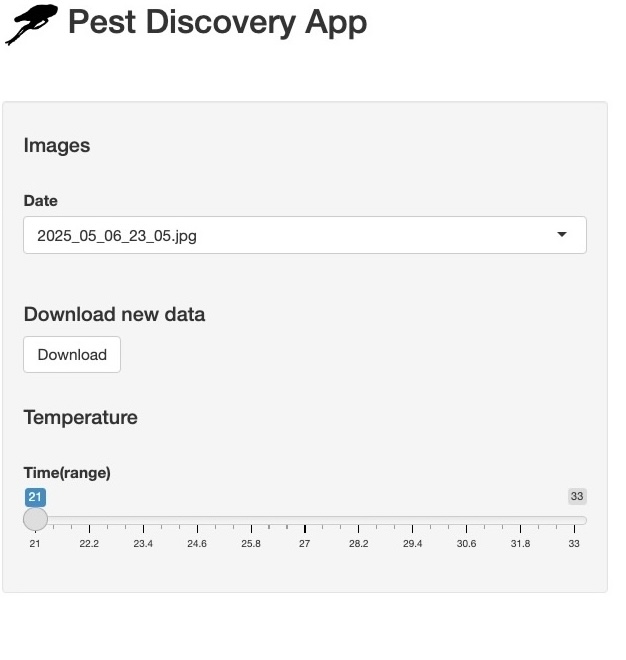
The dashboard interface includes a side panel that houses the main interactive widgets:
Image Selector:
A dropdown menu lets users select an image, with filenames indicating
the date and time of download.
Image Retrieval Button:
Triggers the code to fetch the selected image from the Xiao server. (Note: A corresponding button for temperature file retrieval is planned but not yet implemented.)
Temperature Filter Slider:
Allows users to define a starting time for filtering temperature records. The filtered data is then visualized in two graphs:
Temperature Over Time:
Displays real-time temperature data over elapsed seconds (demonstration purposes only).
Cumulative Degree-Time Graph:
Shows the accumulation of degree units (temperature above a base threshold) over time. This is designed to help estimate the developmental stage of a pest, using a reference point such as the discovery date.
Dashboard Code
Below is the code used to build the Shiny dashboard application. First, the required libraries are loaded to support the UI, server logic, and data handling
The following function is responsible for connecting to the Xiao server to retrieve data. It handles the network request and downloads the specified file from the server:
Note: Initially, I had this code in python and given that I knew shiny better than dash I translated it to R. Using:
https://www.codeconvert.ai/python-to-r-converter, still had to tinker a bit to get it running.
download_image <- function() {
  SERVER_IP <- '192.168.0.150'
  SERVER_PORT <- 1234

  tryCatch({
    client <- socketConnection(
      host = SERVER_IP,
      port = SERVER_PORT,
      server = FALSE,
      blocking = TRUE,
      open = "r+b"  # <-- critical change for binary
    )

    on.exit({
      if (isOpen(client)) close(client)
    }, add = TRUE)

    writeBin(as.integer(3), client)

    f <- file(paste("/Users/alfredorios/Documents/Fab_Academy/week14/PestSurvey/images/",format(Sys.time(), "%Y_%m_%d_%H_%M"),'.jpg',sep=""), 'wb')
    on.exit({
      if (isOpen(f)) close(f)
    }, add = TRUE)

    counter <- 0
    repeat {
      image_chunk <- readBin(client, what = "raw", n = 3072)
      if (length(image_chunk) == 0) break
      writeBin(image_chunk, f)
      counter <- counter + length(image_chunk)
    }
    cat(sprintf("Image received successfully! Total bytes received: %d\n", counter))
    return("Image received successfully!")
  }, error = function(e) {
    return(sprintf("Error: %s", e$message))
  })
}
Data Import and Interface Elements
Note: One challenge encountered during development is the instability of the connection to the Xiao server. Sometimes the connection is slow, and in other cases, the server may be unreachable.
The following code snippets perform key functions in the app:
Read Temperature Data
Reads a text file containing temperature records (expected to be downloaded from the Xiao server):
Temperature_table<-read.table("/Users/alfredorios/Documents/Fab_Academy/week14/PestSurvey/Temperature/Temp.txt",head=TRUE)Generate Image File List
Creates a data frame with the names of image files currently stored locally, which will be used to populate the dropdown menu in the UI:
Photo_df <- data.frame(Date = list.files("/Users/alfredorios/Documents/Fab_Academy/week14/PestSurvey/images"))Here is the user interphase of the shiny app, here is where the widgets are displayed in a sidebarPanel and then you have a main Panel where images and plots are displayed. This would be equivalent to a front end.
User Interface (UI) Layout
The user interface of the Shiny app is structured using a sidebarLayout, which organizes the widgets and visual outputs into two main sections:
sidebarPanel
This panel acts as the interactive control center, housing all the user input widgets. It includes: - A dropdown menu to select images (based on filename). - A button to request image downloads from the Xiao server. - A slider to filter temperature data by start time - (Planned: a button for retrieving temperature data from the Xiao Server) - (Planned: a radio button to images with detection boxes)
mainPanel
This is the display area, equivalent to a front end or dashboard output. It includes: - The selected image from the Xiao Smart Trap - A plot of the temperature readings over time - A cumulative degree-time plot to model a pest development stages
ui <- fluidPage(
  titlePanel(title=span(img(src="Planthopper_logo.png",height=40), "Pest Discovery App")),
  br(),br(),
  sidebarLayout(
    sidebarPanel(
      h4("Images"),br(),selectizeInput("Record_Date", "Date",
                     choices = Photo_df$Date,
                     selected = "", multiple = FALSE),br(),
      h4("Download new data"),
      #radioButtons("image_type", "Type",
      #             choices = c("Raw", "Detection"),
      #             selected = "Raw"),
      actionButton("do", "Download"),br(),br(),textOutput("text"),
      h4("Temperature"),br(),
      sliderInput(inputId = "Temperature_Slider",
                  label = "Time(range)",
                  min = min(Temperature_table$Seconds), max = max(Temperature_table$Seconds),
                  value =  min(Temperature_table$Seconds),
                  sep = "")
    ),
    mainPanel(
      h3("Images"),
      splitLayout(imageOutput("Trap_Image"),
      plotlyOutput('plot', height = "500px",width = "500px"),
      plotlyOutput('plot2', height = "500px",width = "500px"))
    )
  )
)
Server Logic
The server side of the Shiny app contains the functions responsible for processing the data, interacting with the UI components, and populating the user interface with dynamic content. This part handles the interactions, such as retrieving images, processing temperature data, and generating plots. Including
- Render the selected image in the UI based on the user’s selection.
- Download the selected image from the Xiao server when the “Download Image” button is clicked.
- Filter the temperature data based on the selected start time and visualize it as a plot.
- Plot the cumulative degree-time to represent the temperature above the base threshold over time.
server <- function(input, output) {

 output$plot<- renderPlotly({
   Temperature_table_f=Temperature_table%>%filter(Seconds>=input$Temperature_Slider)
   plot_ly(Temperature_table_f,x=~Seconds,y=~Temp,type="scatter",mode="lines")}
  )

 output$plot2<- renderPlotly({
   Temperature_table=Temperature_table%>%mutate(Cum_Deg_Seconds=cumsum(Temperature_table$Temp-(10)))
   Temperature_table_f=Temperature_table%>%filter(Seconds>=input$Temperature_Slider)
   plotly::plot_ly(Temperature_table_f,x=~Seconds,y=~Cum_Deg_Seconds,type="scatter",mode="lines")}
 )

 output$plot2<- renderPlotly({
   Temperature_table=Temperature_table%>%mutate(Cum_Deg_Seconds=cumsum((Temperature_table$Temp-10)*c(1,diff(Temperature_table$Seconds))))
   Temperature_table_f=Temperature_table%>%filter(Seconds>=input$Temperature_Slider)
   plotly::plot_ly(Temperature_table_f,x=~Seconds,y=~Cum_Deg_Seconds,type="scatter",mode="lines")}
 )

 output$text2 <- renderText({
   Temperature_table=Temperature_table%>%mutate(Cum_Deg_Seconds=cumsum(Temperature_table$Temp))
   Temperature_table_f=Temperature_table%>%filter(Seconds>=input$Temperature_Slider)
   paste("From the begginning of the time period the pest has reached",tail(Temperature_table_f$Cum_Deg_Seconds,n=1), "of its development (fictonal)")
   })

   observeEvent(input$do,{
    a1=download_image()
    output$text <- renderText({a1})
  })

  output$Trap_Image <- renderImage({
    filename <- file.path(getwd(), paste("images/",input$Record_Date,sep=""))
    if (!file.exists(filename)) {
      return(list(
        src = "",
        alt = "Image not found"
      ))
    }

    list(
      src = filename,
      contentType = 'image/jpeg',
      alt = "Pest_Image",
      width = 500,
      height = 500
    )
  }, deleteFile = FALSE)

}

shinyApp(ui = ui, server = server)
Key Learnings:
- Automation to populate drop down menus is very useful.
- Network connections are not very stable which makes me wonder if using C++ could help?
- I still need to implement loops for keeping the server on to respond to request frequently.
- Implementation of object detection, Yolo?