14. Interface and application programming
The goal of the is to get out of the console log interface to achieve a comfortable UI, For this week, I'm embarking on the development of a PC application designed to monitor the status of various inputs and outputs. This application will provide real-time status updates, ensuring that users can immediately see the current state of all connected inputs and outputs. Additionally, it will log historical data, allowing for the review of past statuses and trends over time.
Another week and another group assigment: this week we compared many interface making tools, from that im using QT designer, our group assignment also included creating mobile interfaces using AppInventor and FlutterFlow. AppInventor allowed us to quickly design and prototype simple apps with its intuitive drag-and-drop interface, On the other hand, we checked FlutterFlow that provided a more advanced platform for building visually appealing and responsive mobile applications. It offered a wide range of widgets and customization options, enabling us to create more sophisticated and functional interfaces.
My PCB and electronics
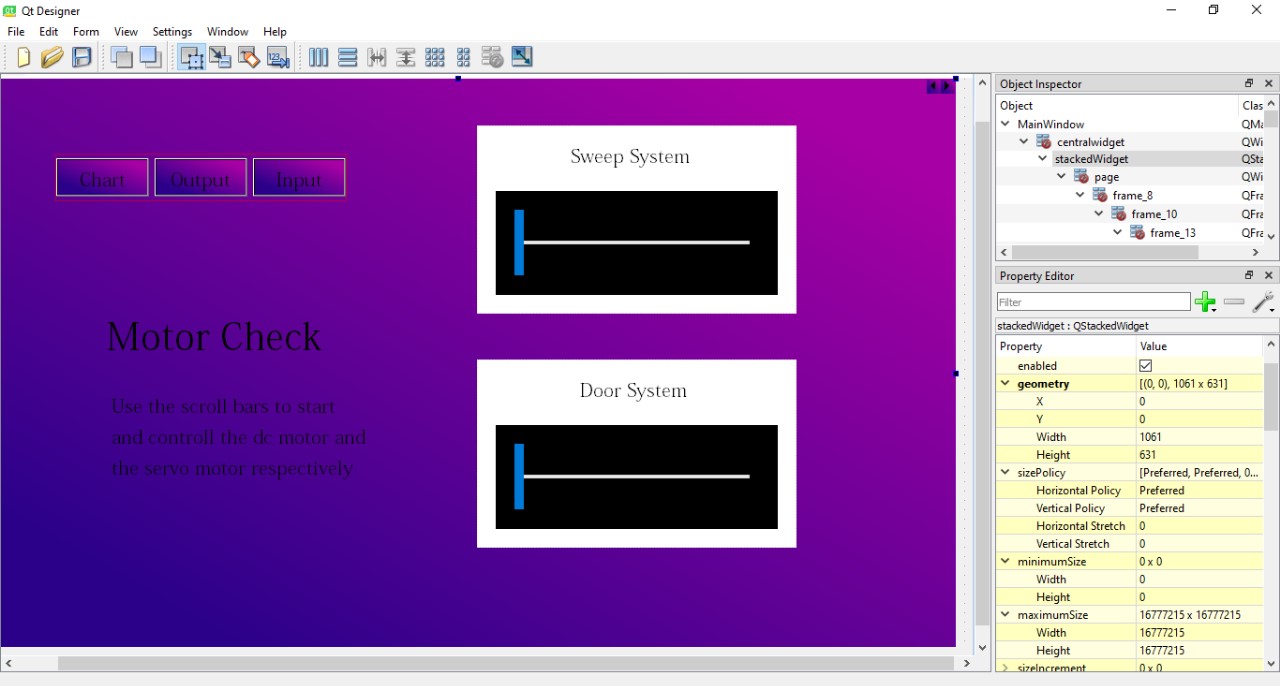
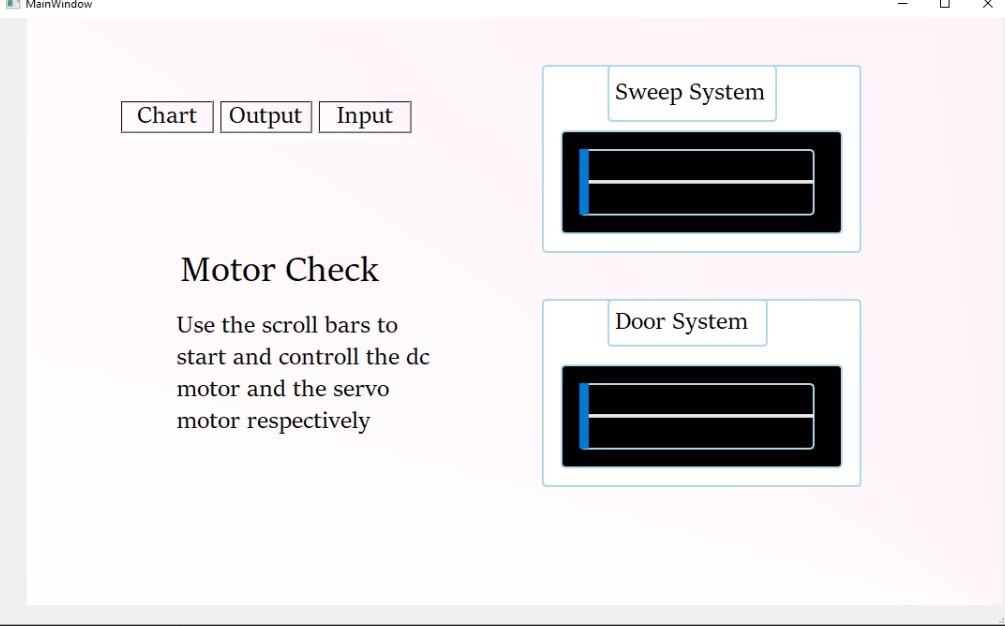
my project includes different inputs and outputs, as you can see in the pinout that is also on the final project page I have 3 devices that I want to check: the first is the door system controlled by a servo that to control I know I need to give it a value between 0 and 180 so I need a widget that allows me to send it that value from my interface, while the dc motor simply requires two digital signals using an ln298n that will act as a multiple relay to give it direction, in that case the value it must deliver is the time for each direction, so in both cases a scroll bar will suffice, to measure if the distance sensor works as it should I need to graph the measurements, as well as to keep a theoretical control of the times my project has been used.
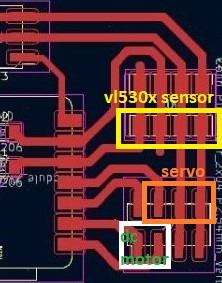
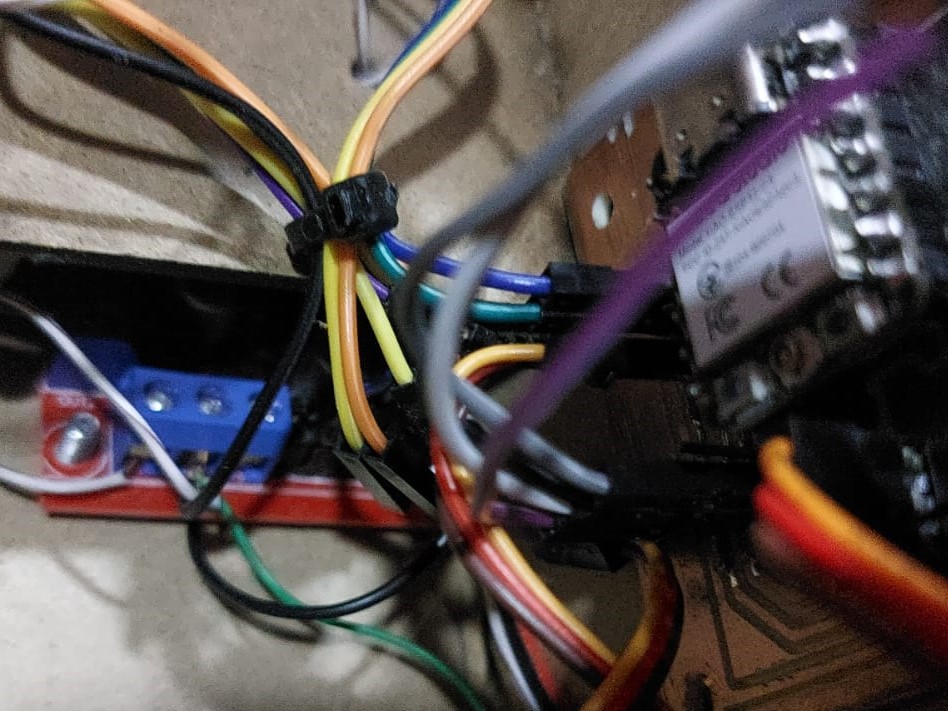
Getting the ln298n individually to solder is much more expensive and takes a long time to arrive, so using that module I wire three two signals from the board to the controller for left and right, as long as I don't have both high it will move.

QT designer
a powerful tool for designing and building graphical user interfaces (GUIs), allowed us to create complex desktop applications with ease. Its drag-and-drop functionality and wide range of widgets facilitated the design process, enabling us to focus more on the functionality and user experience of our applications. By integrating QT Designer with Python through PyQt, we were able to add interactive features and enhance the usability of our GUIs.This week files: .zip: the files include qt.ui file for qt designer, and qt.py for python, the complete interface.py file and microcontroller.ino file, the data in a .csv and a .jpg image required for the interface.
Previous Requirements
From the internet install python in your device and qt designer as well, with the code editor of your preference, then with python installed we are going to create a virtual enviroment in your CMD:
//ui is the name of your Virtual enviroment choose an appropriate one
python -m venv ui

ui\Scripts\activate

//to turn it off
ui\Scripts\deactivate
Using a python package manager we are going to download the following libraries:
pip install pyserial

pip install matplotlib

pip install pyqt6
QT designer
-
when we open qt designer we find the first 3 options to make pop-ups, the main interface, and to make small applications, we choose the main one where we can start choosing and dragging widgets, I start with a stacked widget since it allows me to have several pages and then by code easily move from one to another, by pressing right click we can see additional options for the widgets such as adding pages in this case, we also have the set stylesheet, which follows the same css cascade rules, so in the case of font styles, background or widgets with which we will use a style for the entire application we can put them here or in the empty background.
The widgets that I used the most are push button, frame which is an area to delimit within other widgets, the horizontal slider as input, the date edit which shows a calendar updated daily and the label which can be text or as I also use it in the first tab to contain images.
If we wanted to make a responsive interface, that is, one that changes size depending on the screen, we would have to enclose absolutely all the components within stacks and separate them with separators, in addition to enabling stretch and size policies.
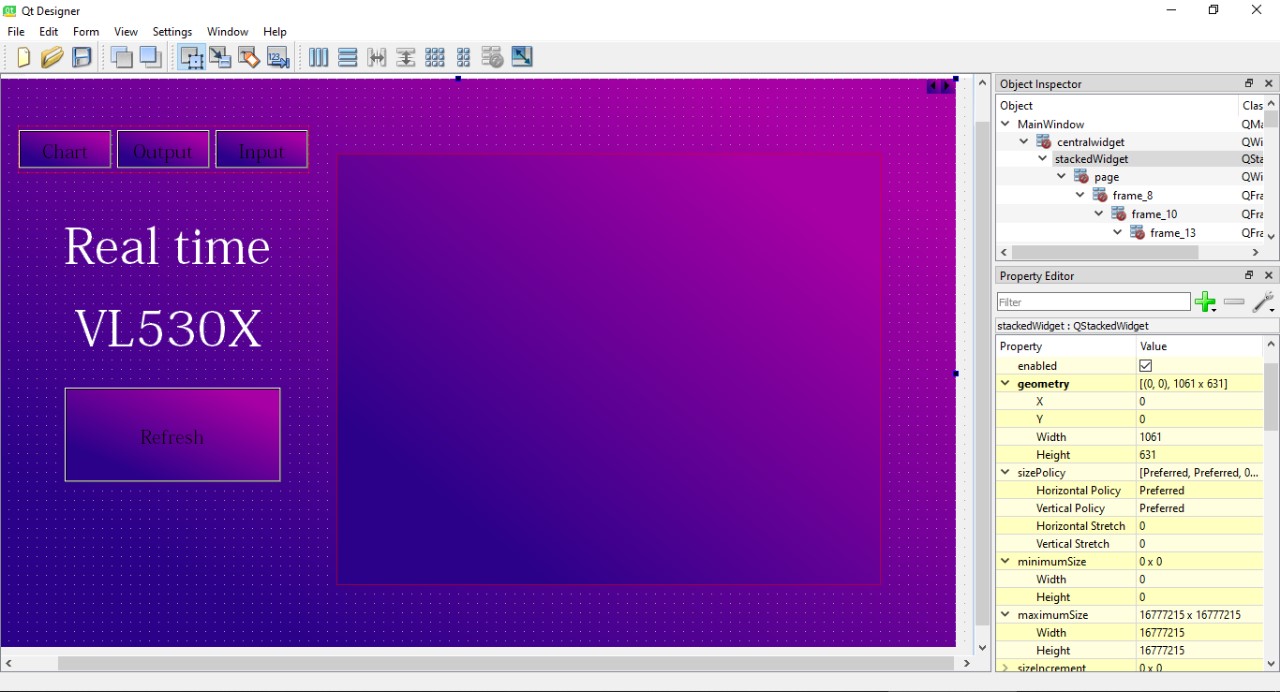
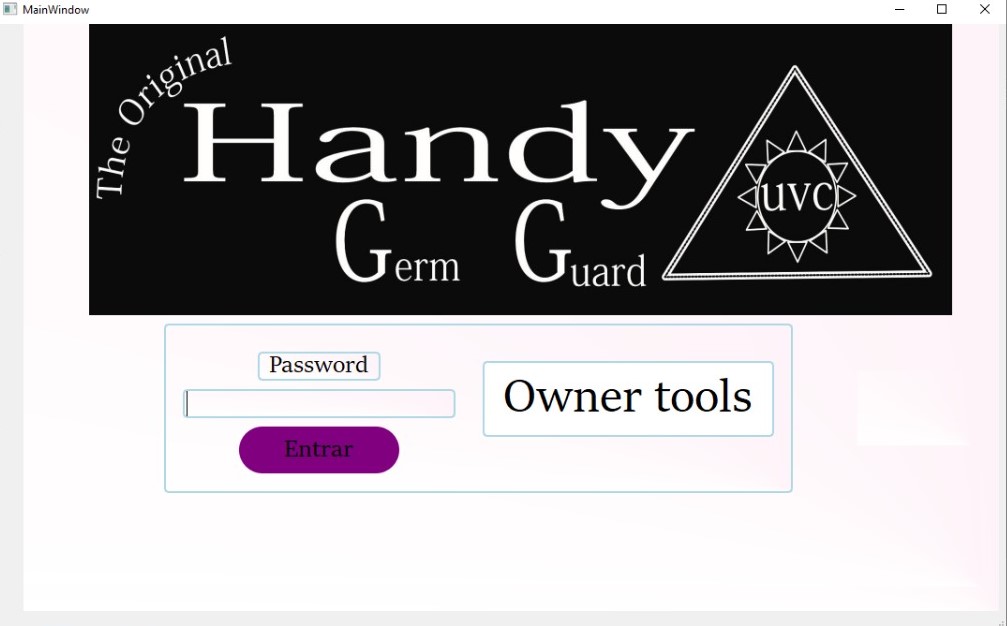
For this interface I designed four tabs: one for login with the aim of protecting the information, another for managing information related to daily use, another for the outputs to see their correct operation and another for inputs that could be used for the calibration of the VL530X sensor.
To pass the qt design to python, use the next command in the cmd with a previous empty python file created:
pyuic6 -x qtdesign.ui -o interface.py
Then in a new python file we will import the interface, we do this because when we update something in QT, whatever we wrote in the original Python file will be erased.
from interfaz import *

class MainWindow(QtWidgets.QMainWindow, Ui_MainWindow):
    def __init__(self, *args, **kwargs):
        QtWidgets.QMainWindow.__init__(self, *args, **kwargs)
        self.setupUi(self)
        # A partir de aqui ya va lo tuyo (tu logica)


if __name__ == '__main__':
    app = QtWidgets.QApplication([])
    window = MainWindow()
    window.show()
    app.exec()
The complete Python Code
In the full code you can see minor details but i want to talk here about the main parts of the code:
Move motors (just send data)
To comunicate with the microcontroller xiao esp32c3, via serial using functions from the pyserial library we write the key 'a' and the value multiplied by 6 and how it goes from 0 to 100 from 0 to 600 from 60 to 60.
 #Values from 0 to 100
    def move_sweep(self):
        y = int(self.horizontalSlider.value())
        y *= 6
        y = 'a'+str(y)
        self.serial.write(y.encode())
Read and plot data
In this function we send the key 'c' which in the Arduino code sends the distance sensor to be read, and then sends the list of values to the scatter plot class so that it can recreate it, you cannot just add the point.
 def read_sensor(self): # Funcition to see the value of the sensor
        self.serial.write(b'c')
        self.t.append(self.serial.readline())
        self.chartvl = chartvl(self.t)
        self.g2.addWidget(self.chartvl)
Bar chart class
We have two types of graphs that we created with the help of matplotlib, a bar graph to graph daily usage and a dispersion graph, the first one carries with it the function of reading the data stored in a .csv, and then dividing the dictionary data with the format {'date':'20/6/2024','hour':'14:23'}, into two lists where if the data already exists, add one to the counter.
class chart(FigureCanvas):
    def __init__(self, parent=None):
        self.fig , self.ax = plt.subplots(1, dpi=100, figsize=(5, 5), sharey=True, facecolor='white')
        super().__init__(self.fig)
        self.dict = []
        self.date_counts = {}
        self.result = []
        self.dates = []
        self.counts = []
        self.colores = ['red','blue','green','red', 'blue']


    def read_data(self):
        with open("data.csv") as file:
            reader = csv.DictReader(file)
            for row in reader:
                self.dict.append(row)
        for entry in self.dict:
            date = entry['Date']
            if date in self.date_counts:
                self.date_counts[date] += 1
            else:
                self.date_counts[date] = 1
        self.result = [{'Date': date, 'Count': count} for date, count in self.date_counts.items()]
        self.dates = [item['Date'] for item in self.result]
        self.counts = [item['Count'] for item in self.result]
        self.ax.bar(self.dates,self.counts, color = self.colores)
        self.fig.suptitle('Times used per day',size=9)
Scatter chart class
As I want this graph to be more or less in real time, it is necessary to press the button to request a measurement from the sensor, then in a list I pass the measurements to it to graph them, which is why the class requests an additional value.
class chartvl(FigureCanvas):
    def __init__(self,vals, parent=None):
        self.fig, self.ax = plt.subplots(1, dpi=100, figsize=(5, 5), facecolor='white')
        super().__init__(self.fig)

        self.vals = vals
        self.tamaño = list(range(1, len(vals) + 1))

        x_values = self.tamaño
        y_values = list(map(int, vals))

        # Create scatter plot
        self.ax.scatter(x_values, y_values, s = self.tamaño)
        self.ax.xaxis.set_major_locator(plt.MaxNLocator(integer=True))
        self.ax.yaxis.set_major_locator(plt.MaxNLocator(integer=True))
        self.fig.suptitle('Scatter Plot', size=9)
Arduino Code
The Arduino code was easy to do since I only had to make a cycle that was always checking the serial and depending on the key it would perform an action, also since serial.read reads only one byte it is very easy to drive the menu.
I had within my 4 options two signals that came from a button, meaning that they were only going to send the key while the scroll bar ones sent the values to move.
#include "ESP32Servo.h"
#include "Wire.h"
#include "VL53L0X.h" //Polulu library for this sensor

Servo myservo;  // create servo object to control a servo
VL53L0X sensor;
#define HIGH_ACCURACY

int pos = 0;    // variable to store the servo position
int posmot = 0; //dc motor pos for serial
const int mota = D0;
const int motb = D1;
String inputString = "";
void setup() {
  myservo.attach(D7);  // attaches the servo on pin 8 to the servo object
  myservo.write(pos); // set initial position
  pinMode(mota,OUTPUT);
  pinMode(motb,OUTPUT);
  Serial.begin(9600);
  Wire.begin();
  #if defined HIGH_ACCURACY
    // increase timing budget to 200 ms
    sensor.setMeasurementTimingBudget(200000);
  #endif
  digitalWrite(mota,LOW);
  digitalWrite(motb,LOW);
}

void loop() {
  if (Serial.available() > 0) {  // check if data is available to read
    char command = Serial.read(); // read the incoming byte
    if (command == 'a') {  // if the command is 'a'
      while(Serial.available()){
        char vals = Serial.read();
        inputString += vals;
      }
      int time = inputString.toInt();
      int temp = 0;

      if (posmot == 0){
        posmot = time;
        digitalWrite(motb,HIGH);
        delay(time);
        digitalWrite(motb,LOW);
      } else if (time>posmot){
        temp = time;
        time -= posmot;
        posmot = temp;
        digitalWrite(motb,HIGH);
        delay(time);
        digitalWrite(motb,LOW);
      } else{
        temp = time;
        time = posmot - time;
        posmot = temp;
        digitalWrite(mota,HIGH);
        delay(time);
        digitalWrite(mota,LOW);
      }
      inputString = "";
    }
    else if (command == 'b') {  // if the command is 'b'
      while(Serial.available()){
          char vals = Serial.read();
          inputString += vals;
        }
      pos = inputString.toInt();
      myservo.write(pos);  // move the servo to the new position
      inputString = "";
    }
    else if (command == 'c') {  // if the command is 'c'
      int p = sensor.readRangeSingleMillimeters();
      Serial.println(p);
    }
	else if (command == 'd') {  // if the command is 'd'
		//here should be the final code of the project
		delay(420000);
		Serial.println("1");
  }
}
Final looks at the interface and Mistakes I encountered along the way
-
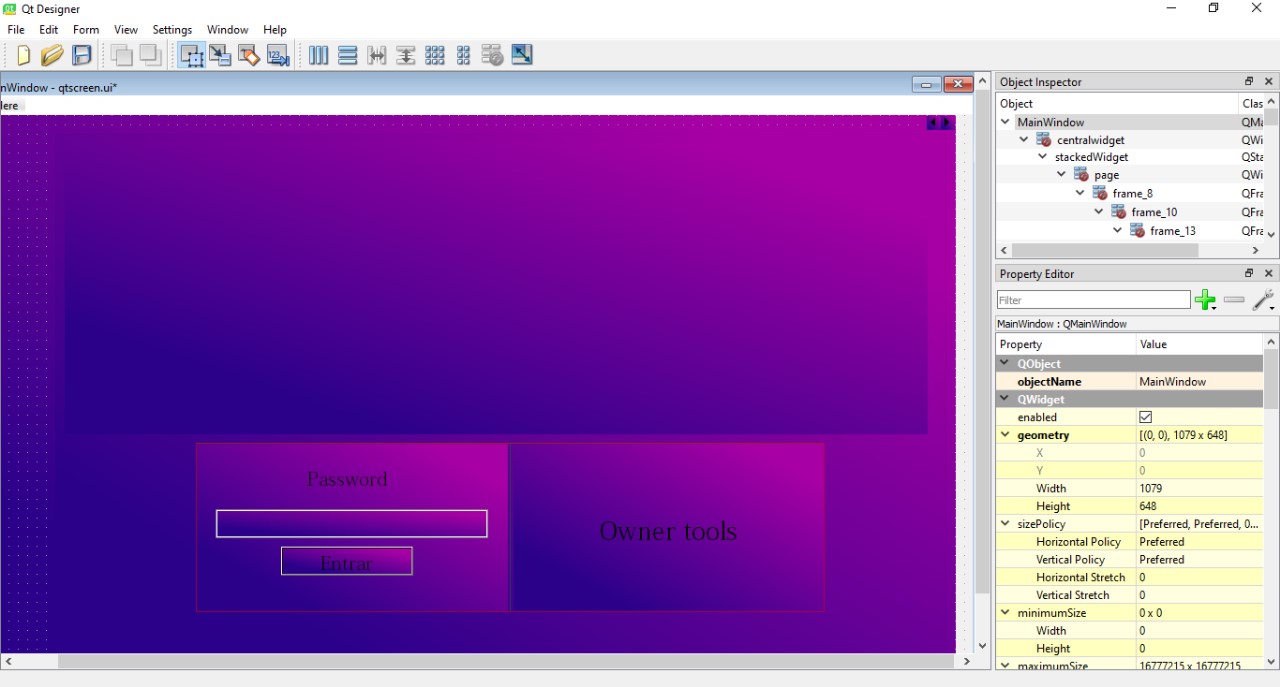
First page
With the interface finished we can see the login with a pop-up tab if the password is incorrect, to actually change the password you need to modify the code, in a future i would like to add more options.
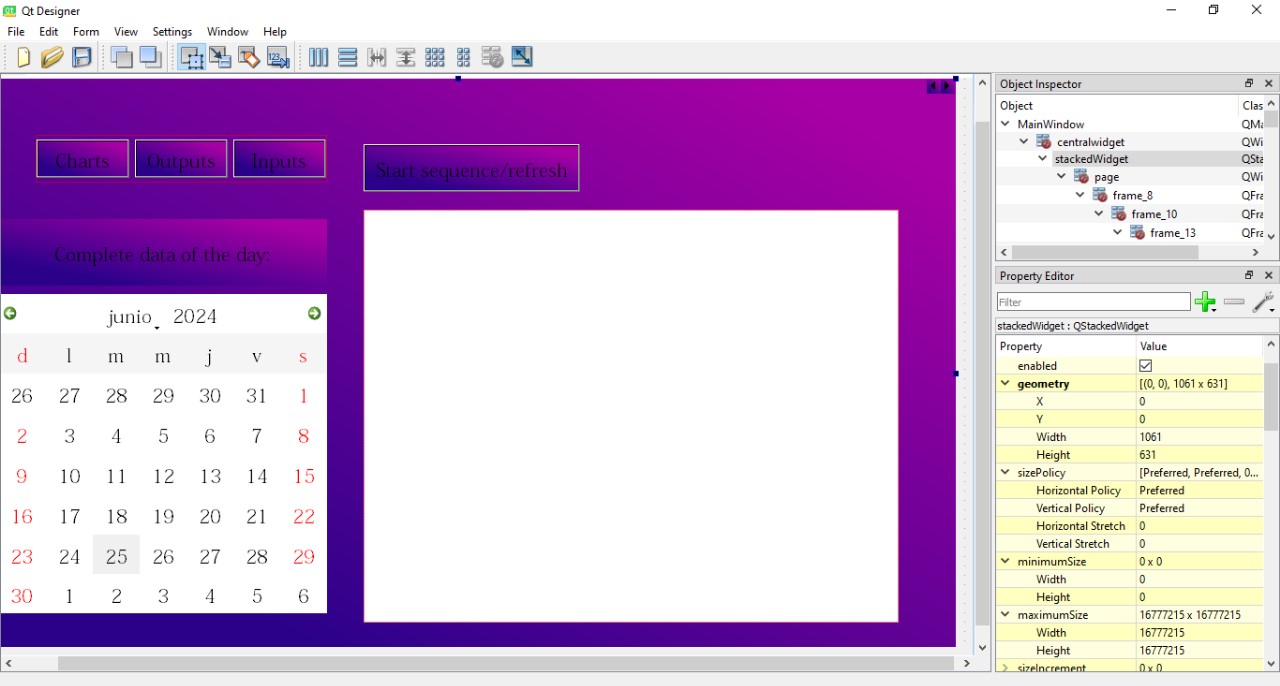
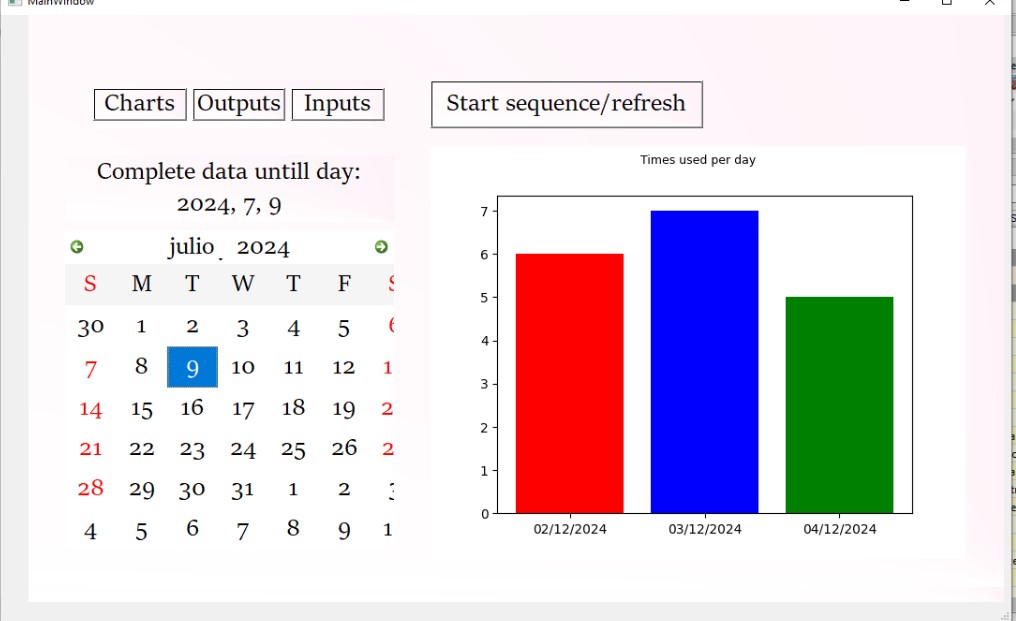
Second page
In this page we can actually see the first chart build, it contains a callendar with the actual date and the historic chart every time you click the button the interface sends the command "d" in serial and waits for the board to respond in serial with a "1" to then add the data to the bar chart class.
Third page
The first scrollbar sends the command and a input value from the interface via serial to the board, for example: "a100", then in the board the number become a int and is used by the board to save the position and to delay the amount of time it needs to move to reach the position, as you can see in the video i added then for the week if you move the scrollbar to the right it responds accordly, while the second one send the command and a position for the servo in order to open and close the door, for example: "b160" would open completely the door at the end of the scrollbar, this two commands dont wait for the board to respond, the dc motor wires are much bigger than needed to open and give service to the project.
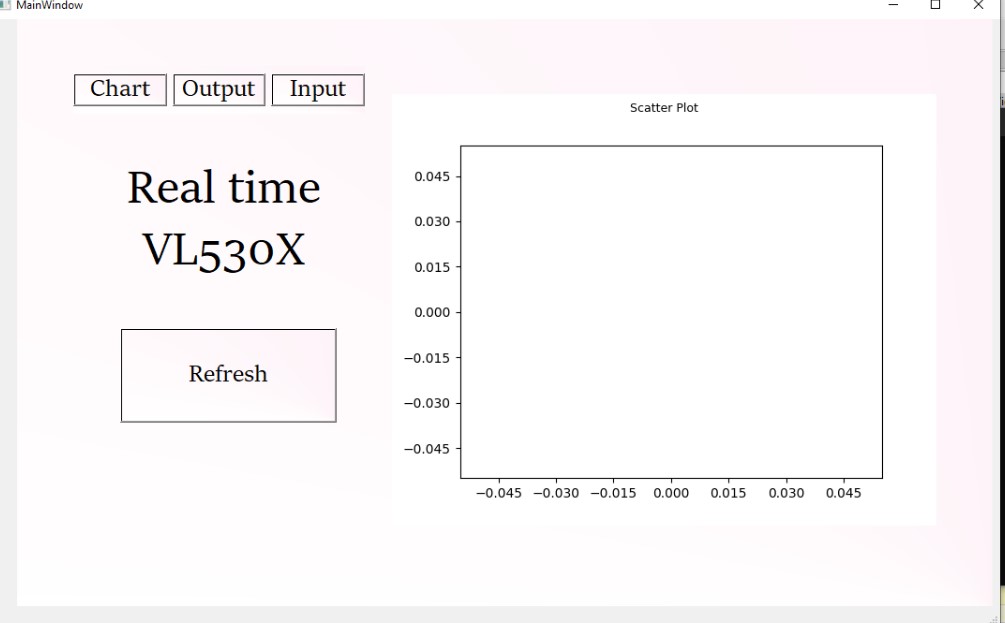
Fourth page
On the fourth page we have a scatter chart class, it does a meassure every time you click on the button to send the command "c", the board receives the order in the menu and takes a read in the VL530X sensor connected via I2C, the data requested saves in this session only, what cost me the most was updating the graphs when I received the information from the serial input, since if the Arduino code is not programmed correctly and returns the incorrect value or does not return it, the interface closes abruptly.
Hero shoot
In this small video you can see the final interface and the xiao esp32c3 with the arduino code created in this week, to control the dc remmember to have the power source connected to the project.
UI Feedback
My global instructor left me a comment about increasing the contrast in the interface to improve visibility, something really common in the user interface design area, the final files have changed already:
I needed another person feedback in order to realize the need to change to a ligh theme and a different font.
Final Comments
Creating a PC application using Qt Designer and Python with PyQt provided a user-friendly interface development environment with drag-and-drop functionality and extensive widget options, allowing a focus on functionality and user experience. Integration with PySerial facilitated communication with hardware, while Matplotlib enabled dynamic data visualization, crafting desktop applications for specific operational needs required a master in previous weeks like communications, outputs and inputs.