Appearance
System Integration & Project development
This week the major assignment is to communicate the final project progress.
Spiral project development

- Planning: Setting goals, identifying risks, and determining resources.
- Risk Analysis: Identifying and addressing potential issues and challenges.
- Engineering and Prototyping: Developing a prototype or version of the product.
- Evaluation: Testing and receiving feedback to refine the next iteration.
- After each cycle, the product is reviewed, improved, and prepared for the next spiral, allowing for adjustments based on user feedback, risk mitigation, and evolving requirements.
Project development Gantt chart.
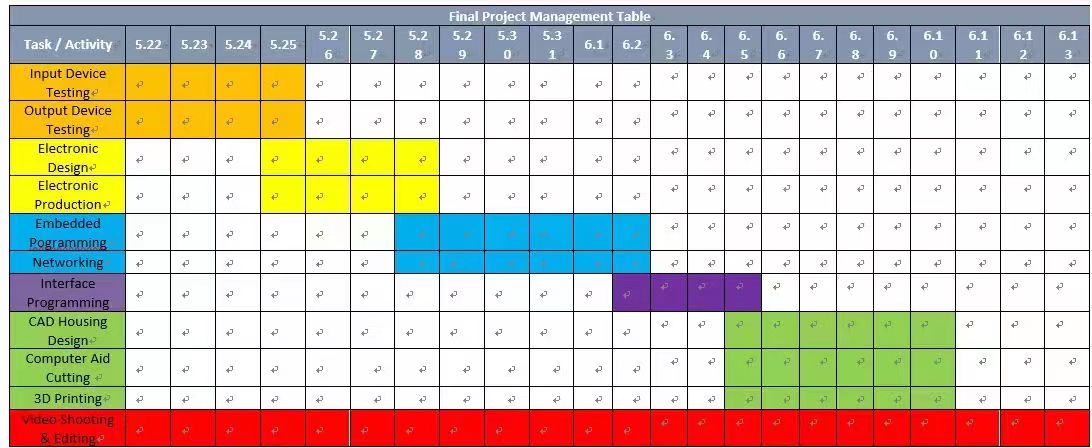
Project Tasks and Timeline Overview:
Input Device Testing (5.22 - 5.26) Testing various biosensors (e.g., motion, PPG, SKT) to ensure accurate signal collection from physiological inputs. Highlighted in yellow.
Output Device Testing (5.24 - 5.26) Verifying the functionality of the screen display to show motion sickness values accurately. Also highlighted in yellow.
Electronic Design (5.25 - 5.26) Designing the connection setup for biosensors to interface with the micro-controller unit (MCU). This task ensures proper sensor integration and data flow, shown in yellow.
Electronic Production (5.28) Producing the Printed Circuit Board (PCB) for sensor connections, highlighted in yellow, marking a key step in finalizing the hardware.
Embedded Programming (5.28 - 5.31) Developing and testing the bio-signal detection and data processing programs, deployable on the Raspberry Pi, and involving wifi data transmission. Shown in blue.
Networking (6.1 - 6.3) Setting up wifi communication between the Raspberry Pi and bio-signal detection module, allowing real-time data transfer. Highlighted in purple.
Interface Programming (6.2 - 6.4) Developing a user interface to display analyzed bio-signal data, making results accessible for end users. Shown in purple.
CAD Housing Design (6.3 - 6.6) Creating the housing design for the detection module using CAD, with a focus on ergonomics and durability. Highlighted in green.
Computer-Aided Cutting (6.5 - 6.8) Cutting the logo sticker for device branding, enhancing visual appeal and project identity. Also highlighted in green.
3D Printing (6.6 - 6.9) Producing the physical housing for the bio-signal detection module using 3D printing, creating a secure casing for the components. Shown in green.
Video Shooting & Editing (5.22 - 6.13) Documenting the project process, including demonstration videos for the final toolkit. This task spans the entire timeline, highlighted in red.
This timeline ensures all critical components—from hardware assembly to software deployment and final documentation—are addressed sequentially, facilitating smooth project development and alignment with the project’s objectives.
Idea Sketch
The figure below has shown the original idea design of this tool set.
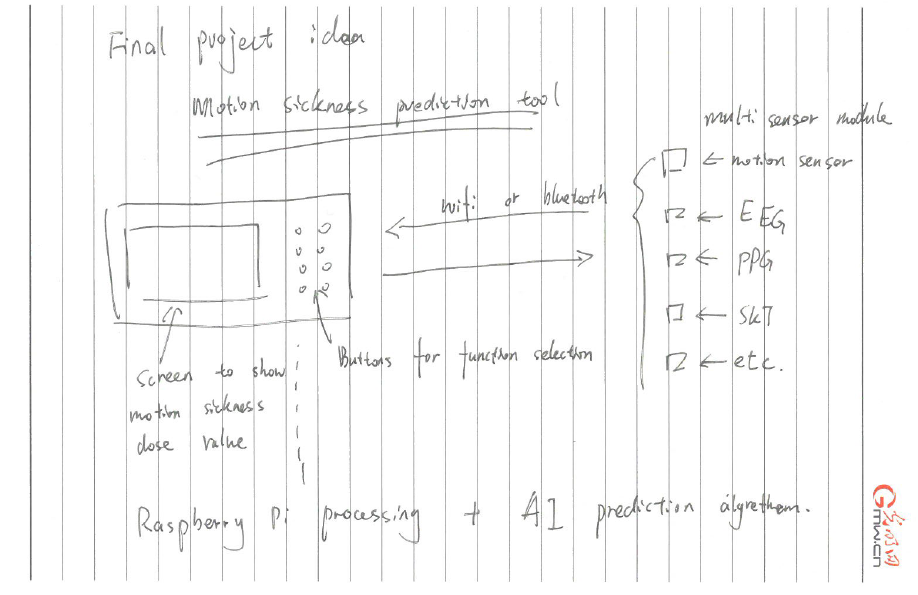
This detection tool consists of 5 parts:
- A set of sensors for collecting human physiological signals includes PPG, SKT etc.
- A data processor module based on Raspberry Pi with Wifi connection.
- A trained AI algorithm for data processing which can be deployed on Raspberry Pi.
- A screen to show motion sickness dose value.
- A control panel for function selection.
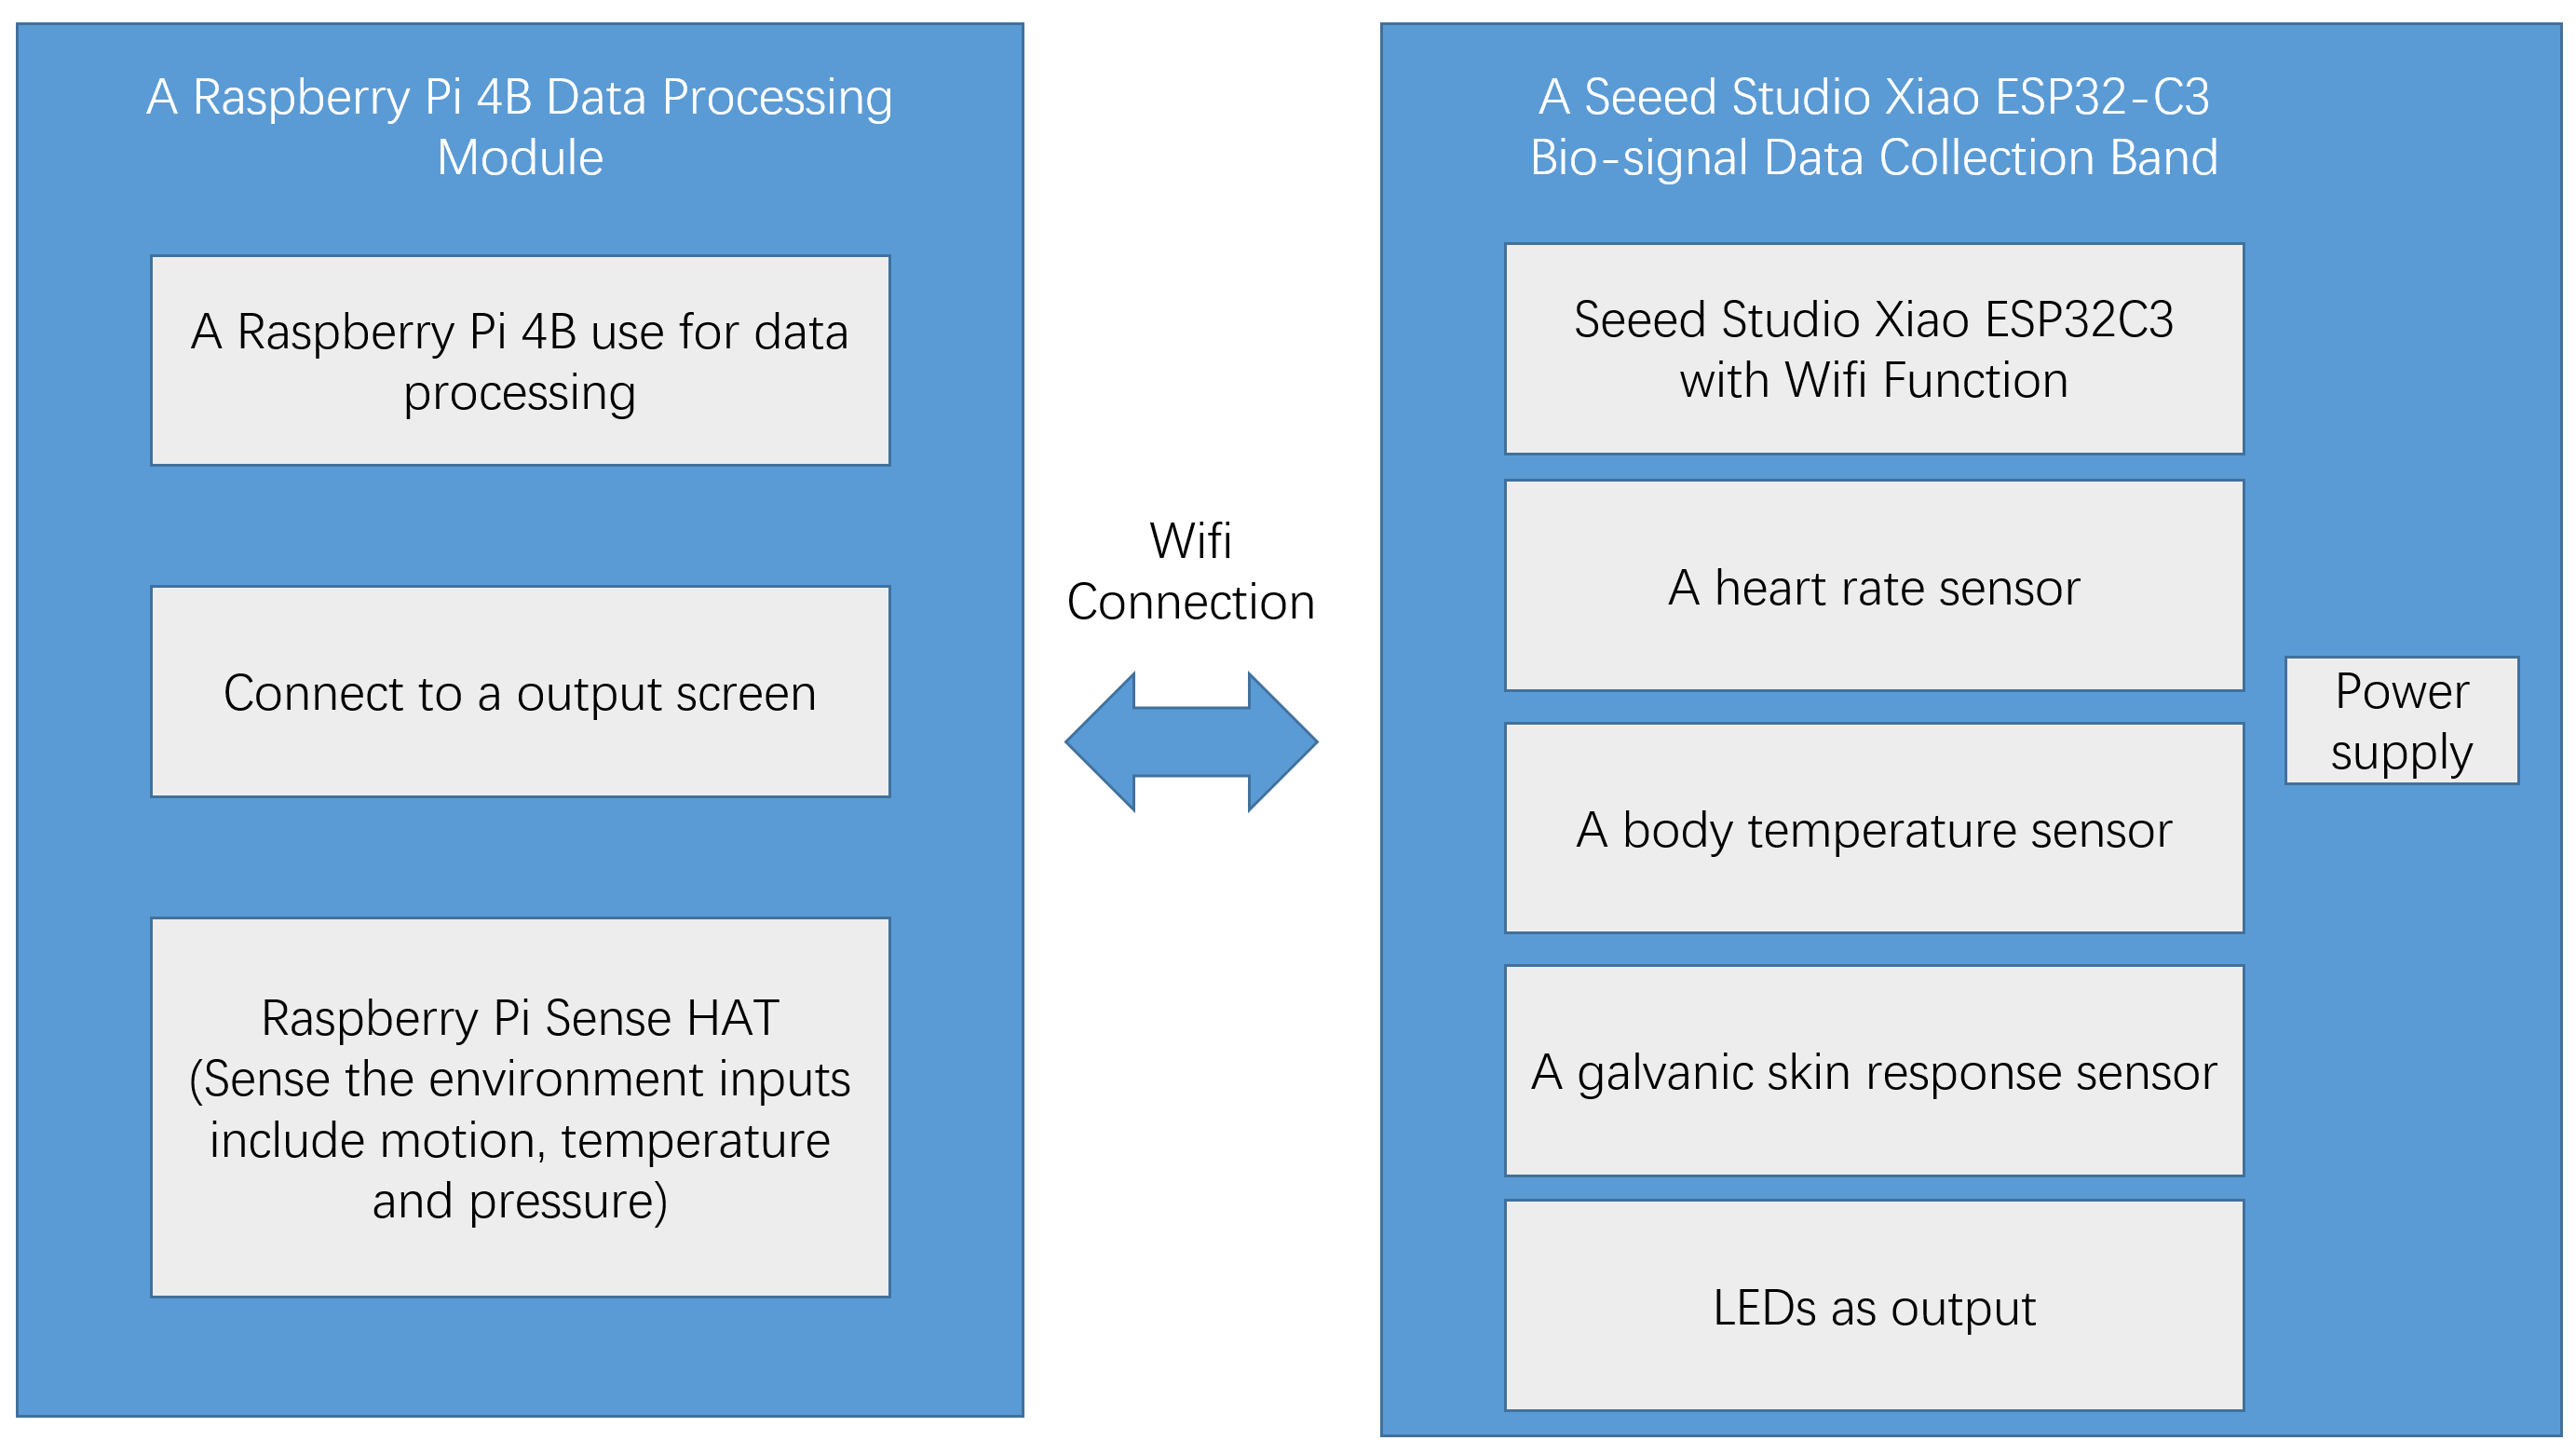
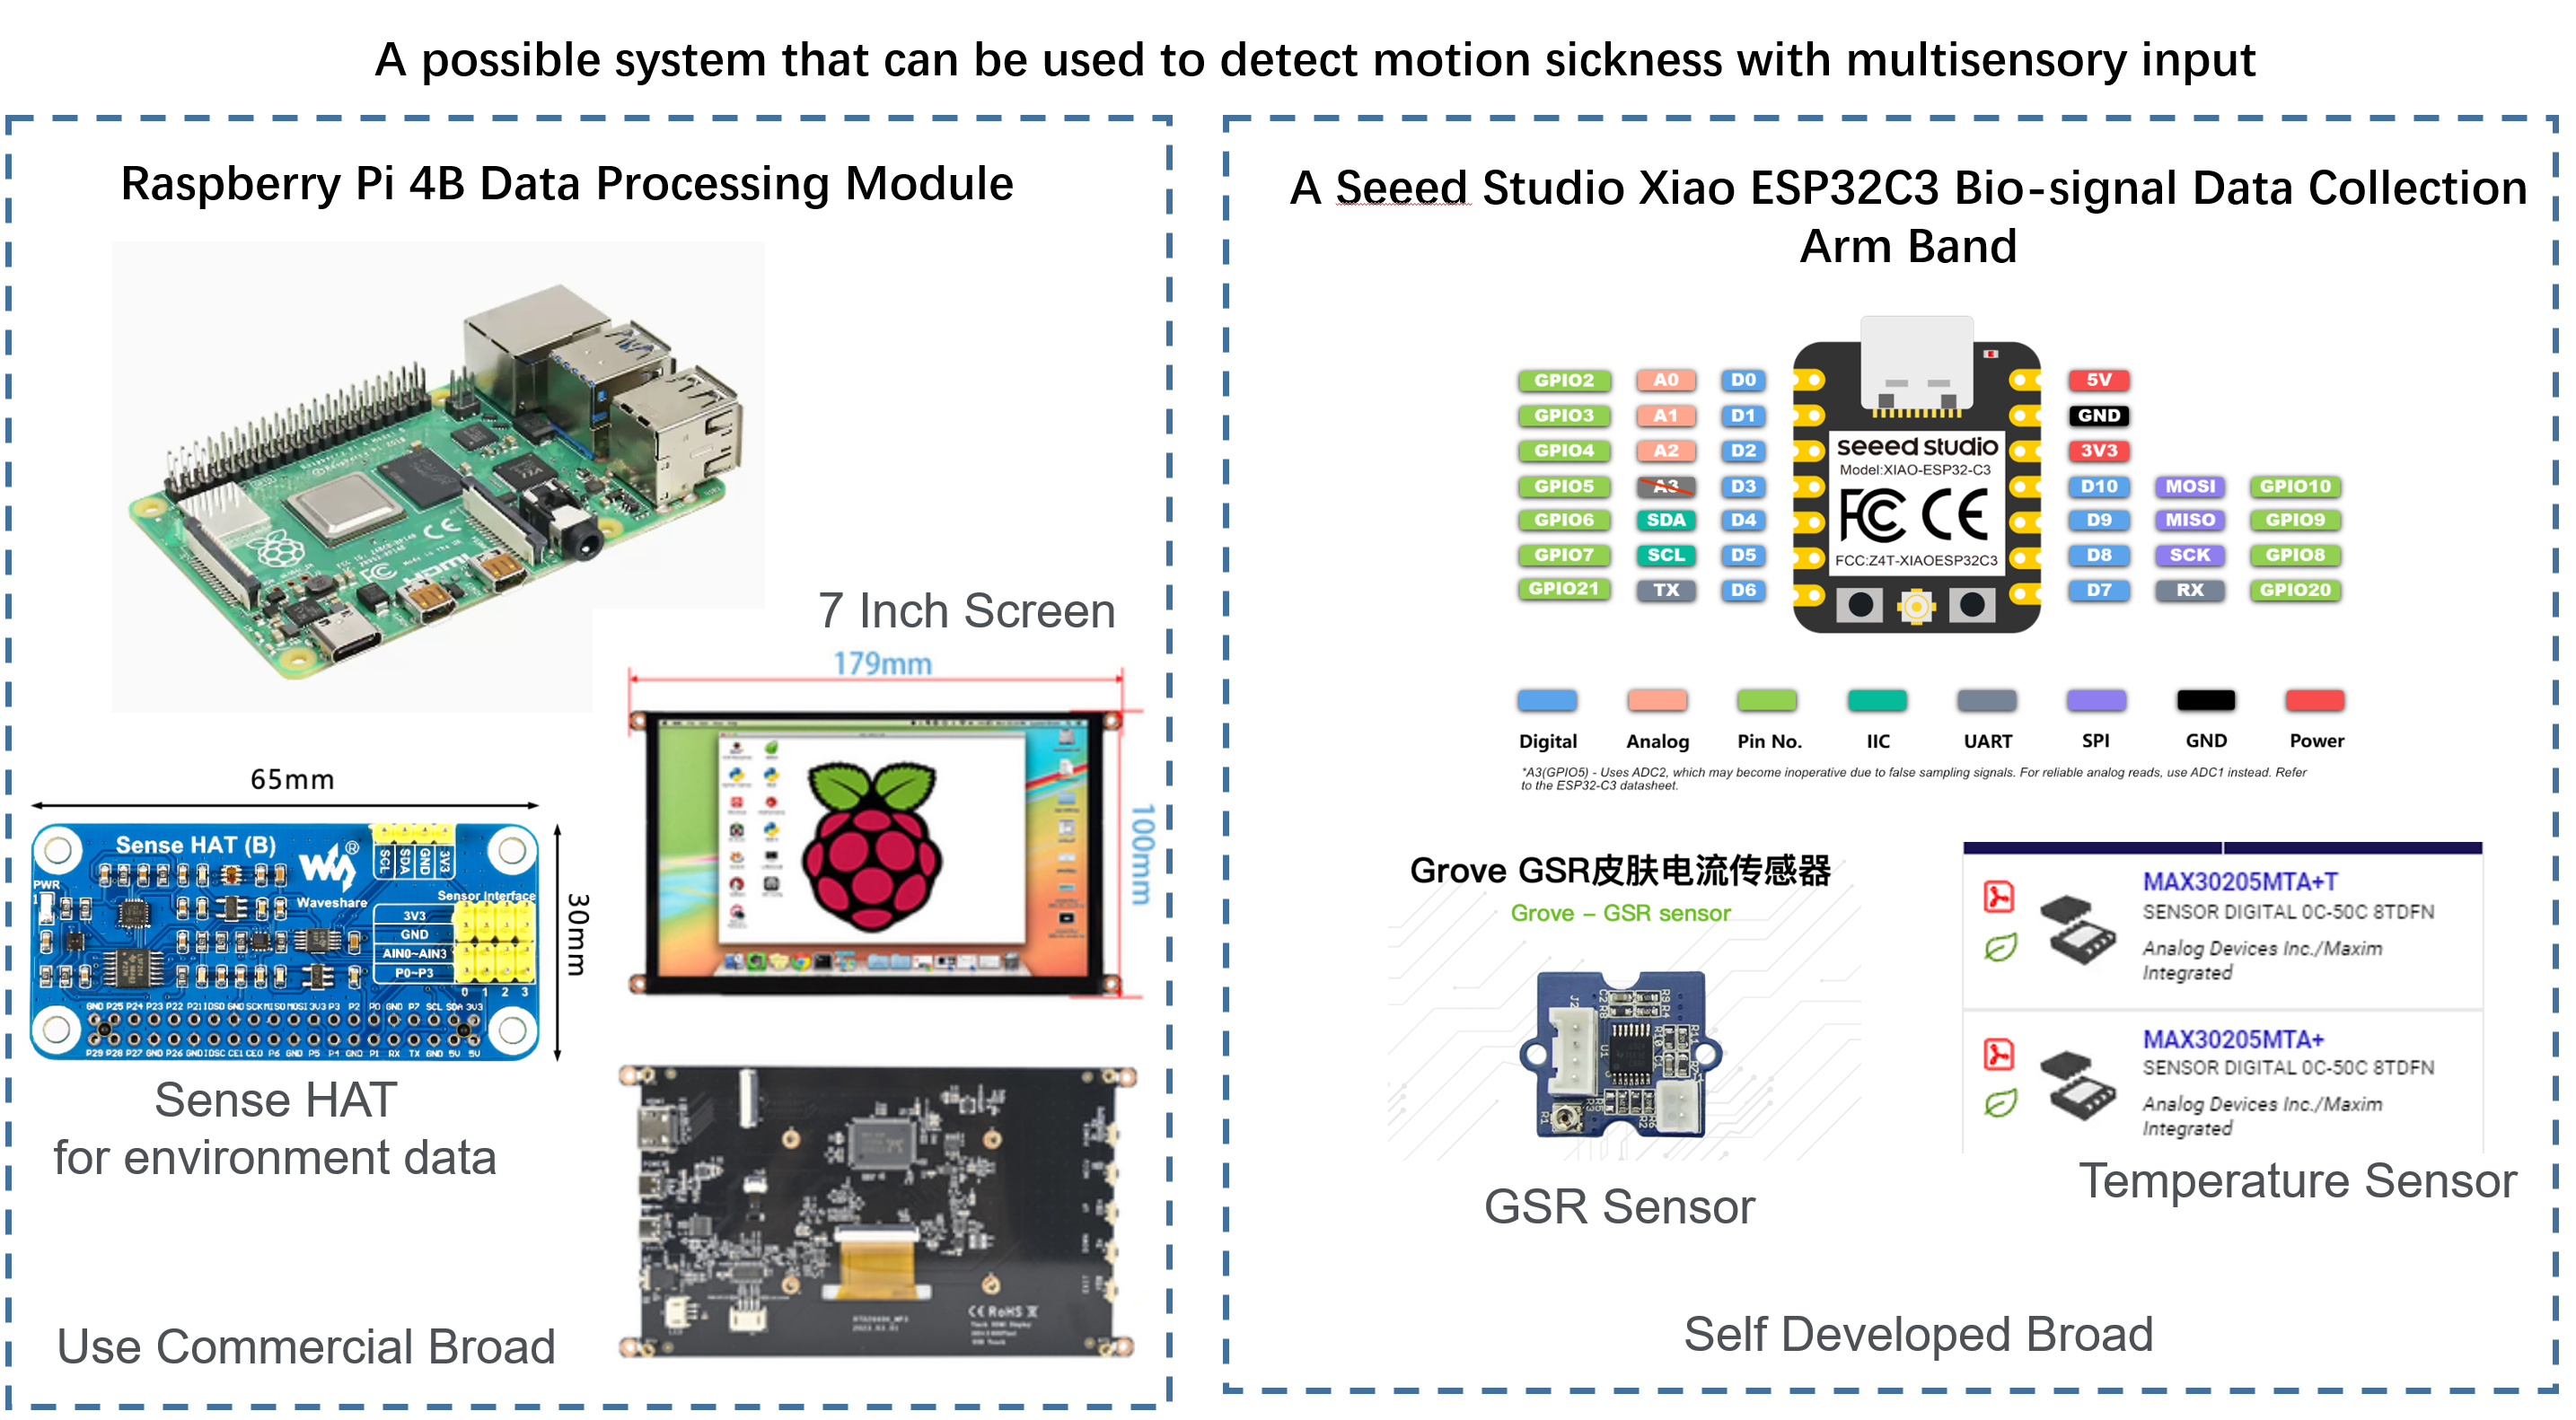
After weeks of learning I have adjusted my final project design and the idea is demonstrated as below. In this new design the Tool kit is divided into two parts: A Raspberry Pi 4B Data Processing Module and A Seeed Studio Xiao ESP32-C3 Biosignal Data Collection Module.
Computer Aided Design
Creating the housing design for the data processing & detection module using Fusion CAD, with a focus on ergonomics and durability.
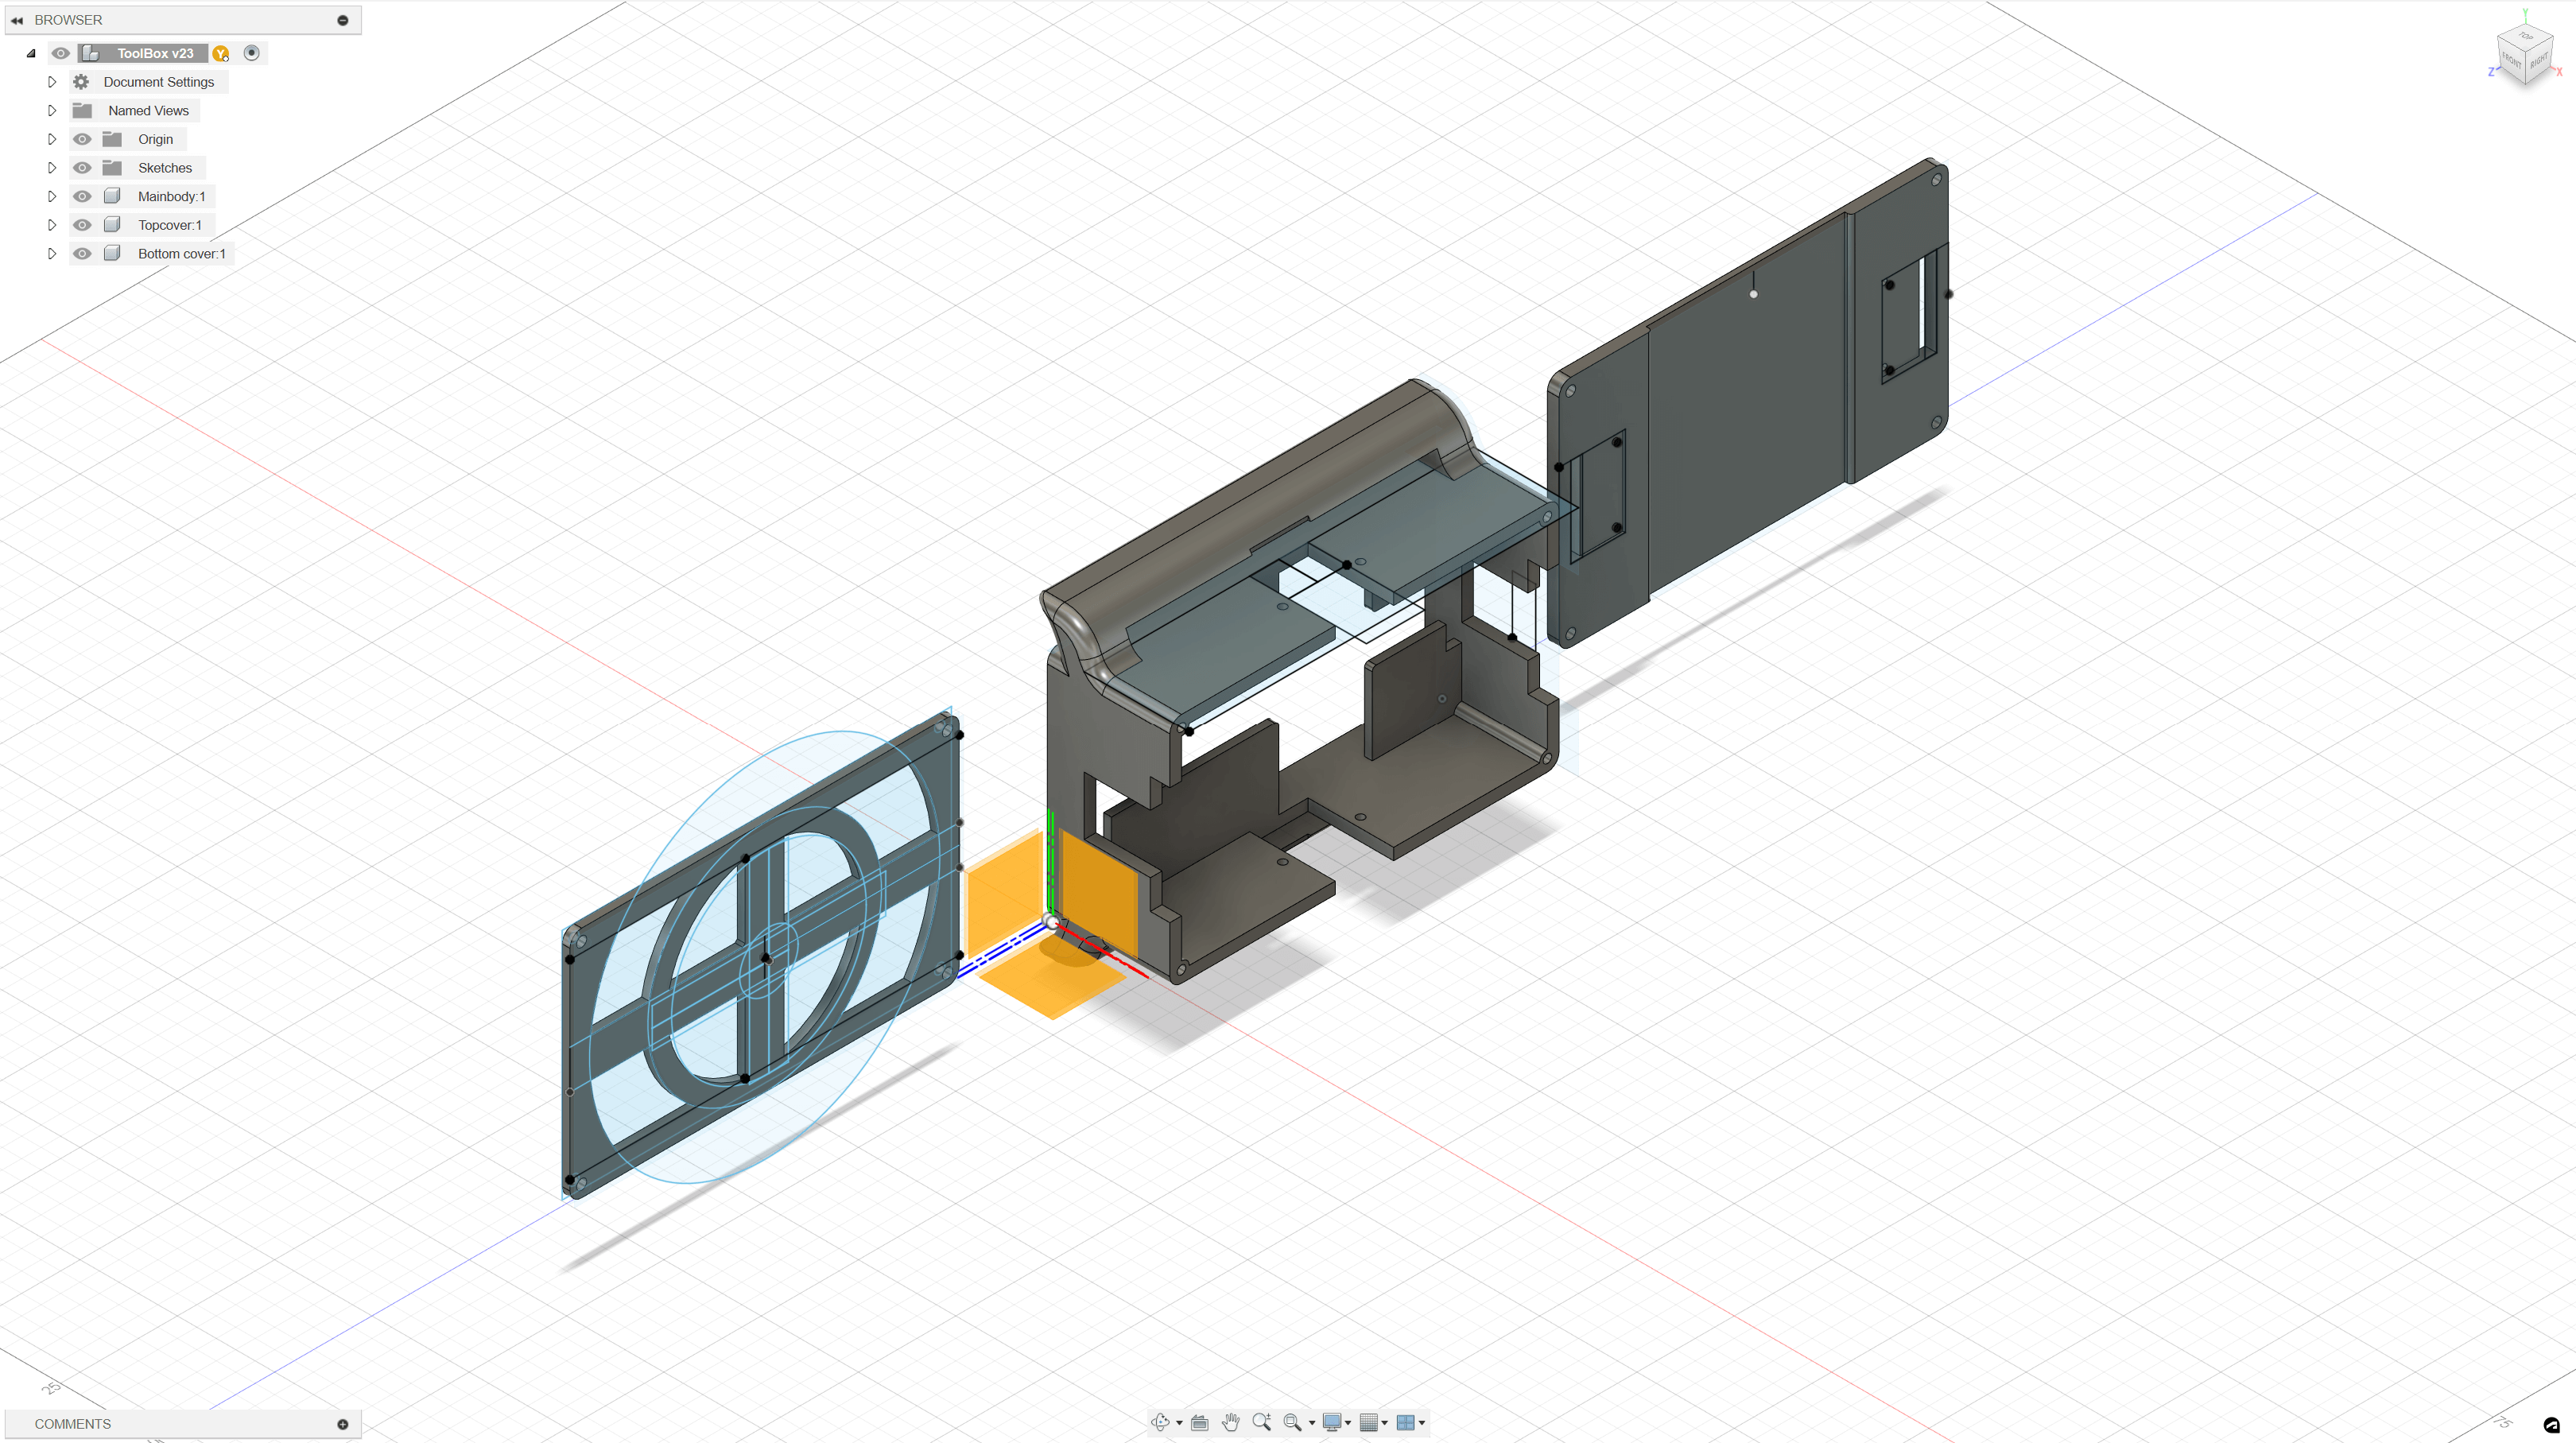
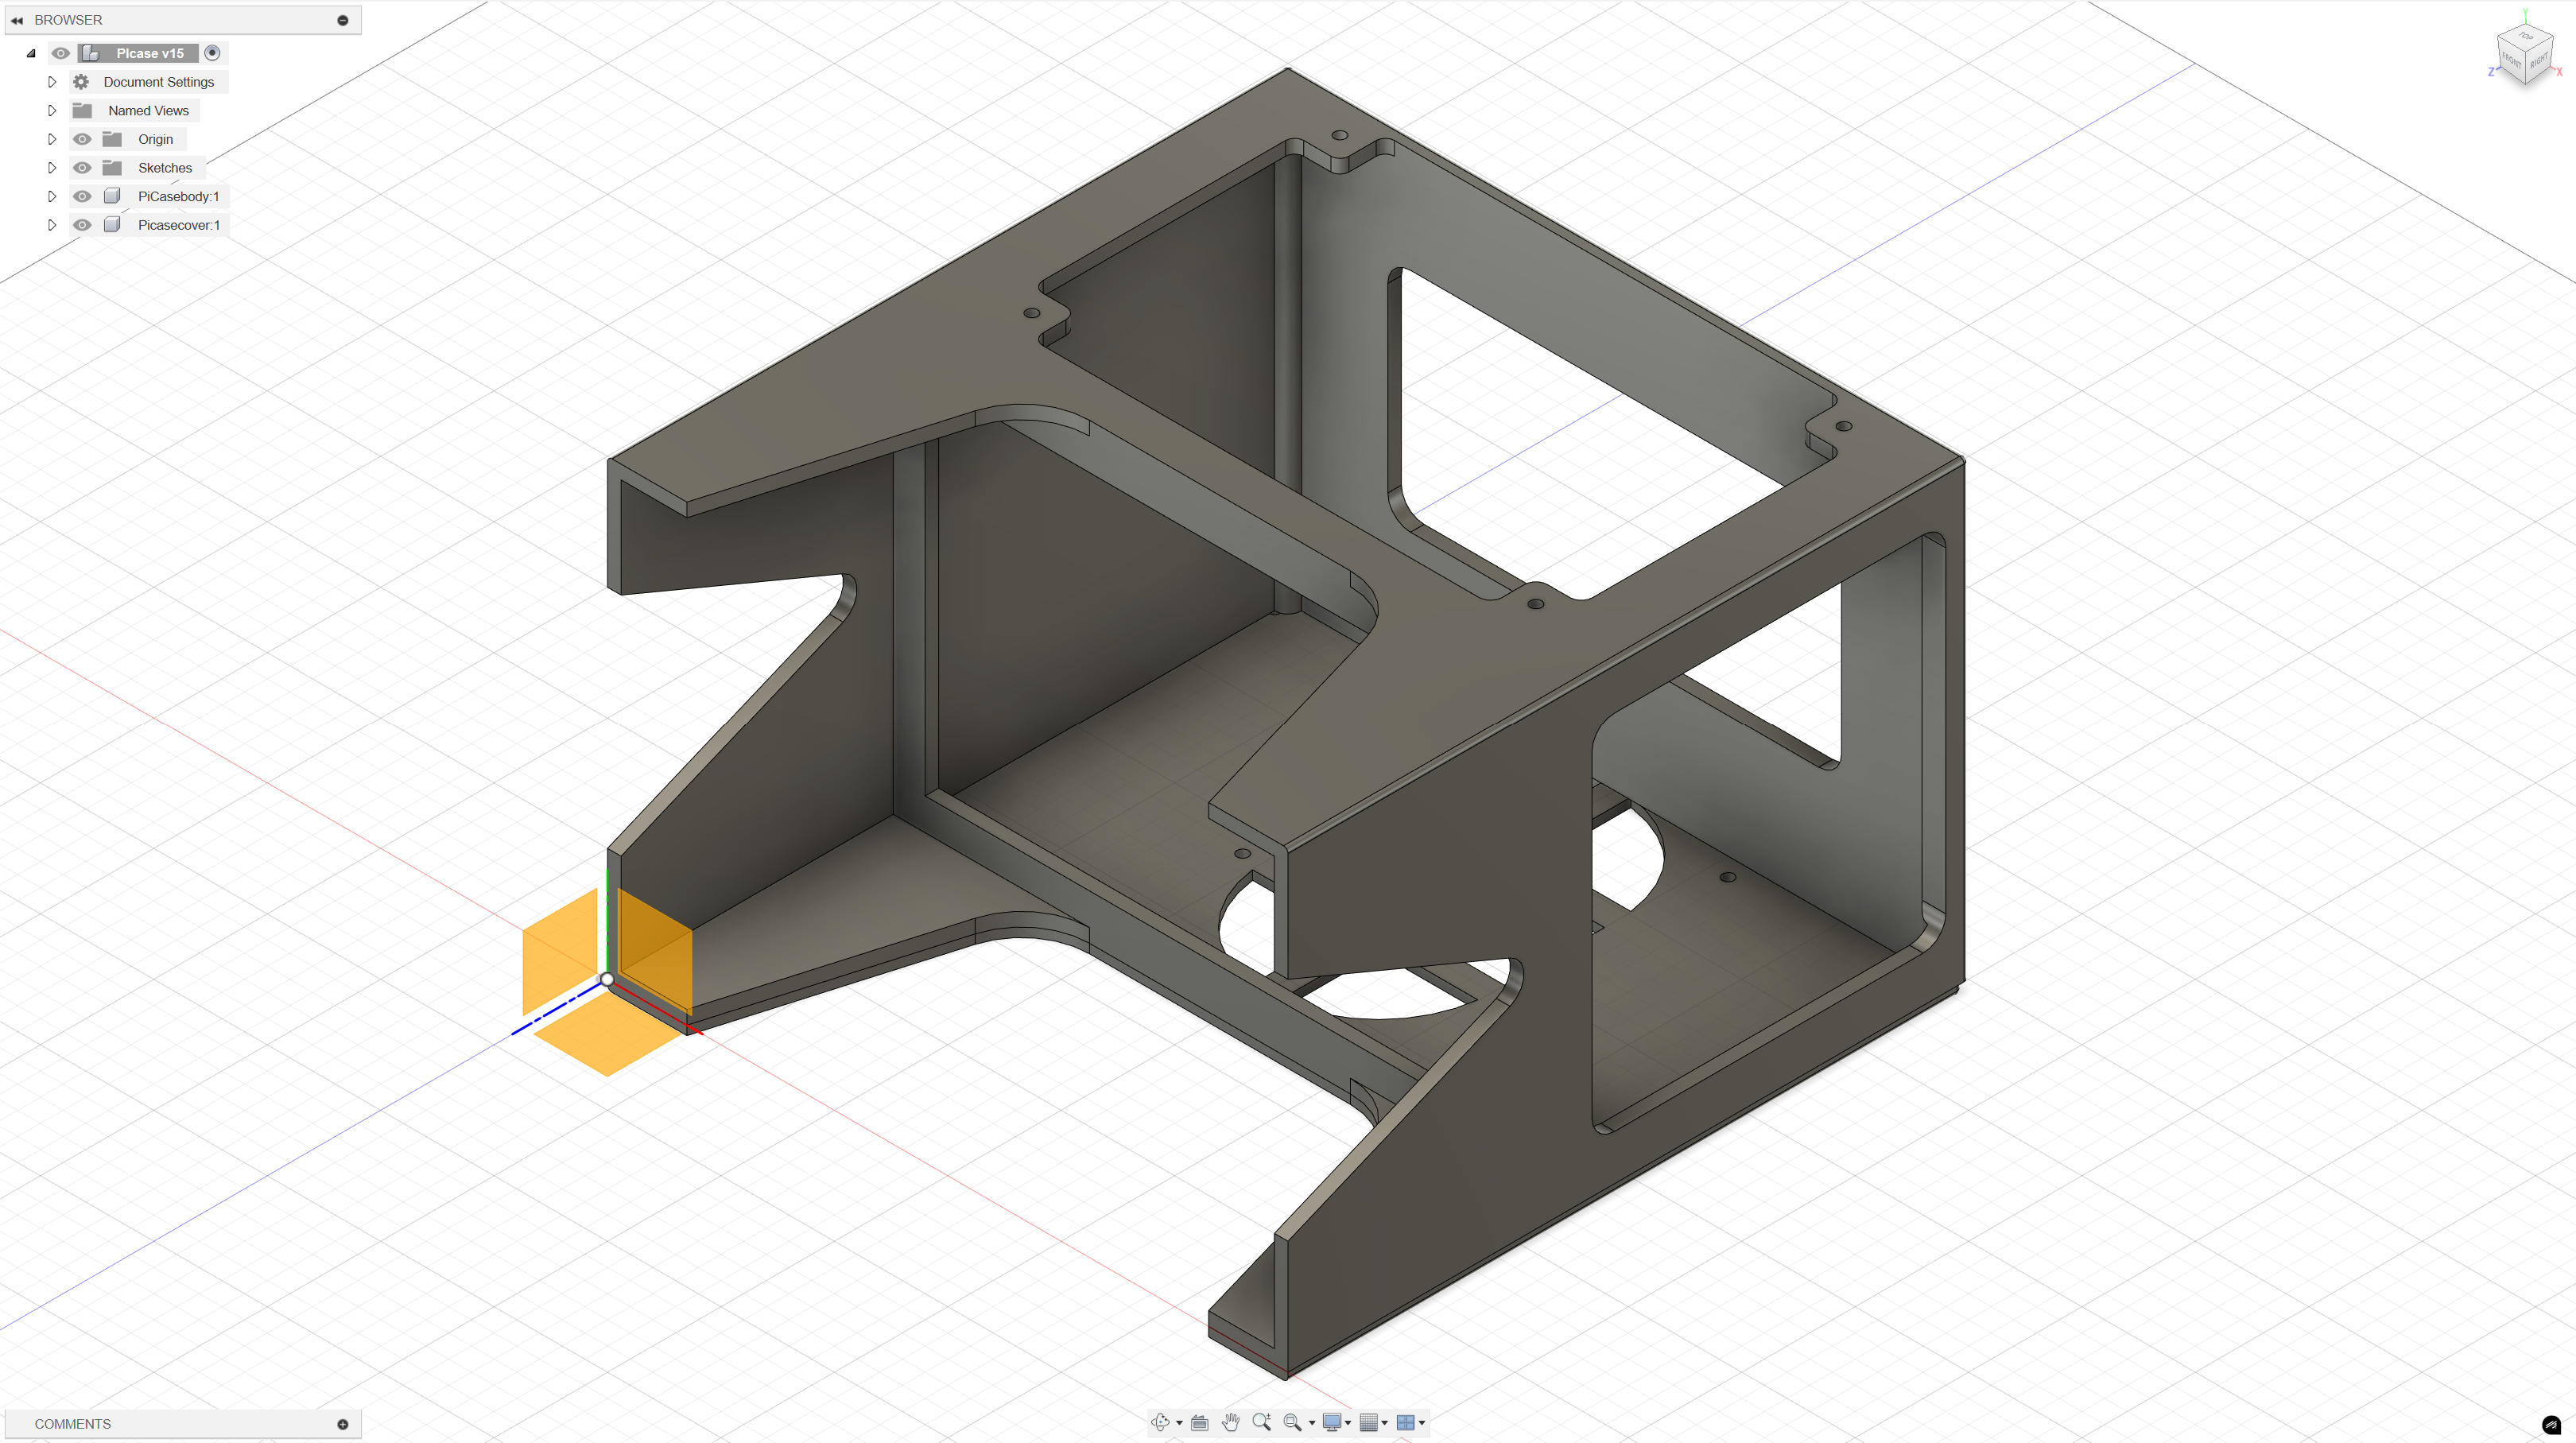
The 3D design process is document as video below.
You can download my 3D housing design by link below:
- https://a360.co/4fV8pz0
- https://a360.co/48ZJus8 The design flies are also uploaded to my repo: https://gitlab.fabcloud.org/academany/fabacademy/2023/labs/ningbo/students/yaorun-zhang/-/tree/main/docs/assignments/week18/designfiles?ref_type=heads
Computer Controlled Cutting
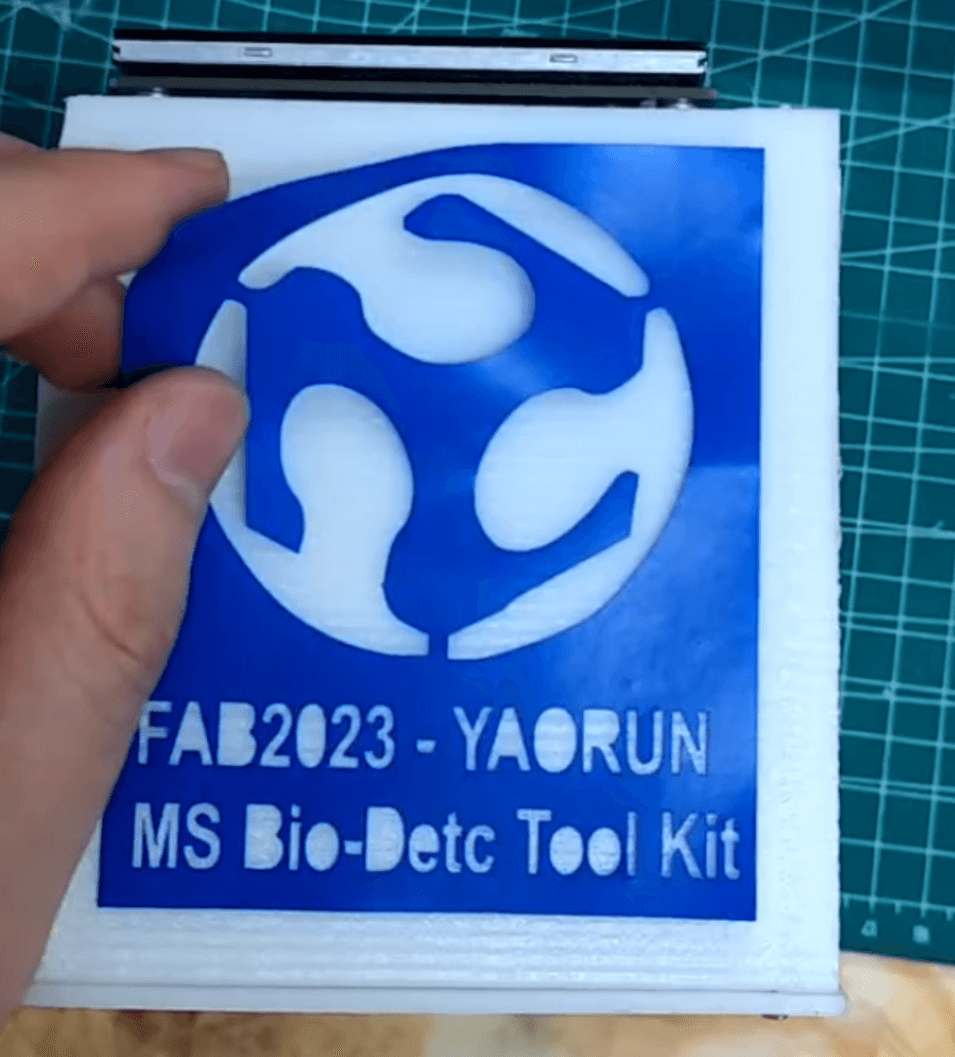
Design and cutting the logo sticker with a vinal cutter.
The vinal cutting process is shown as video below.
Find the vinyl cutting design file at link below:
3D Printing
3D print the data processing & detection module housing.
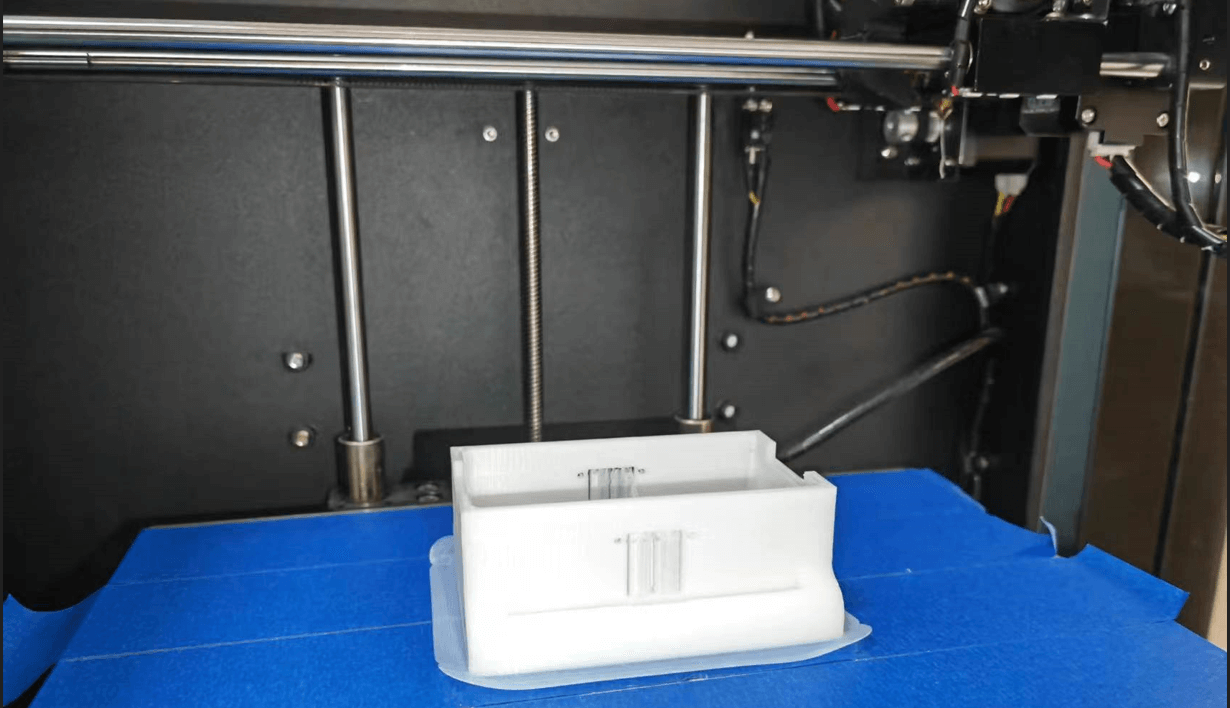
I printed my design using both an FDM and an SLA printer. The SLA printer's curing platform seems to have issues, so the FDM printer produced better results.
Input & Output device testing
Testing the input sensors and output screen.
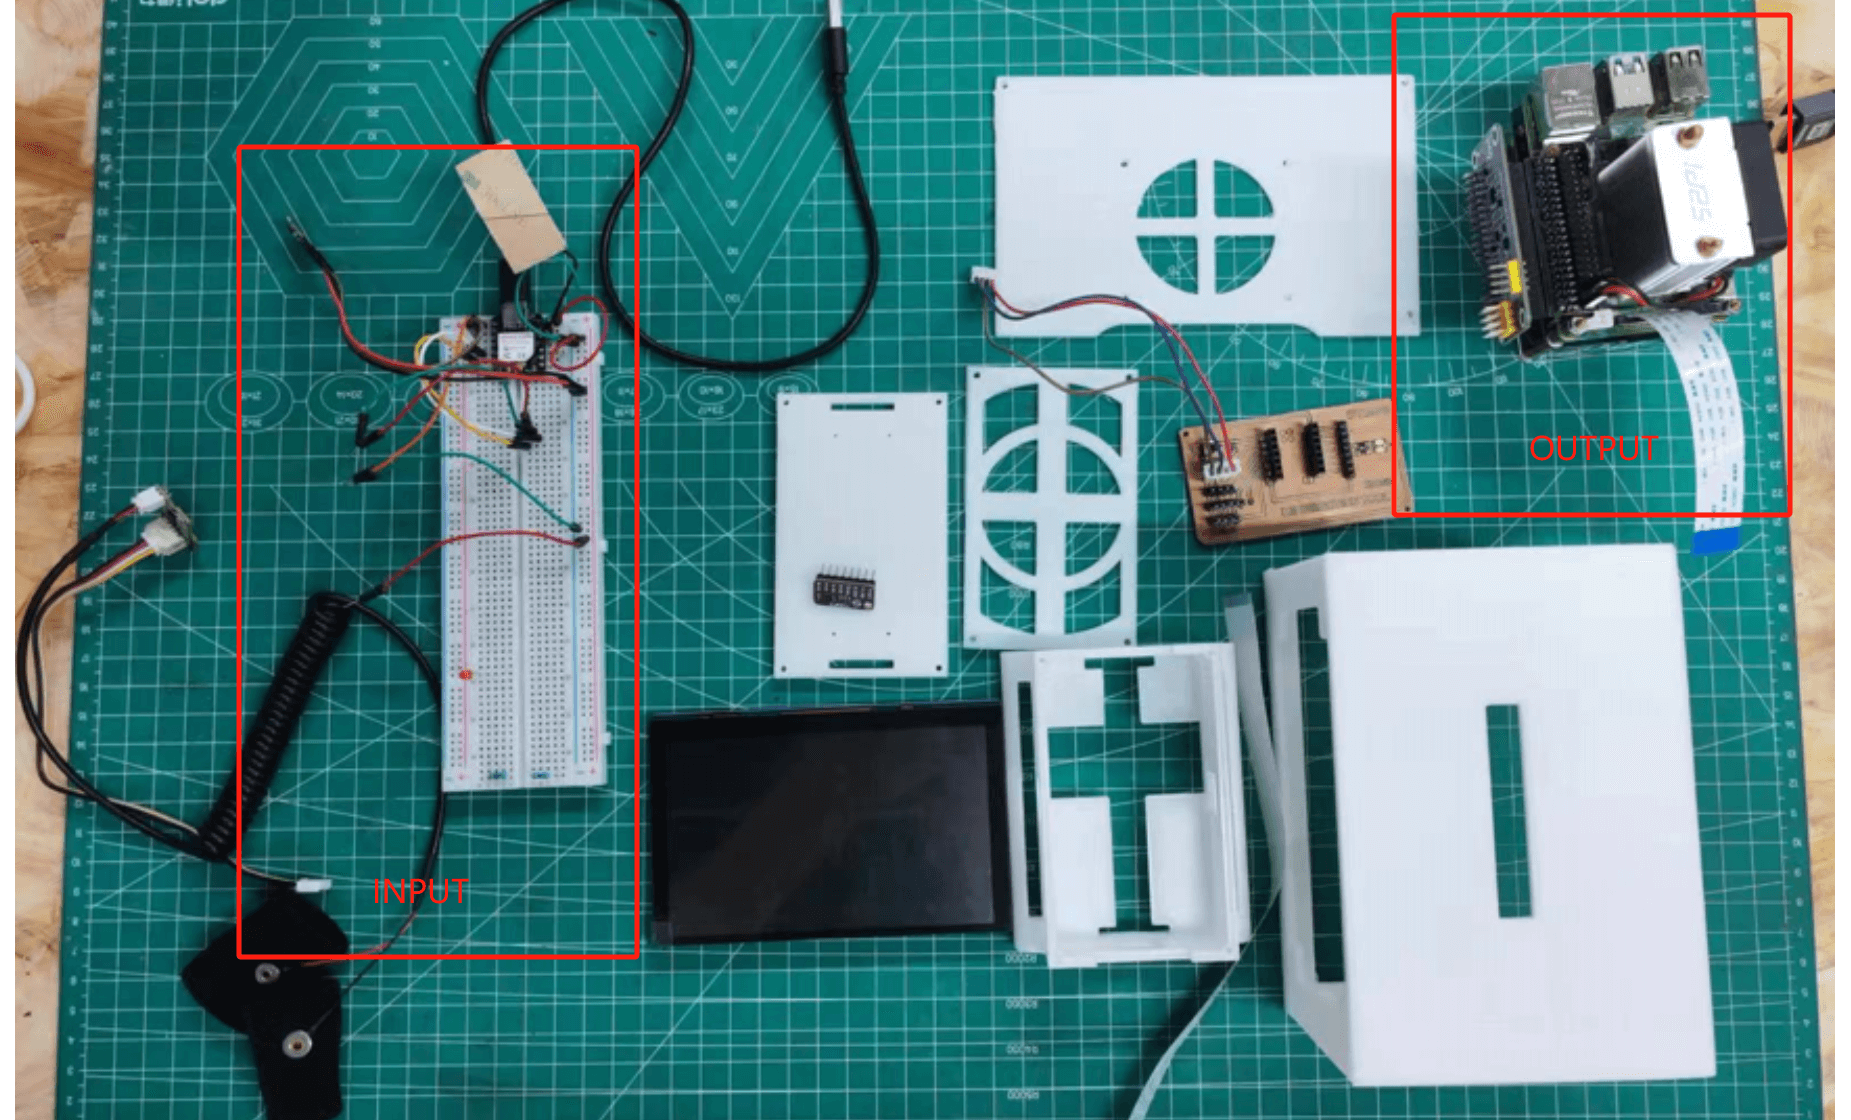
Here is a video shows me testing different sensors.
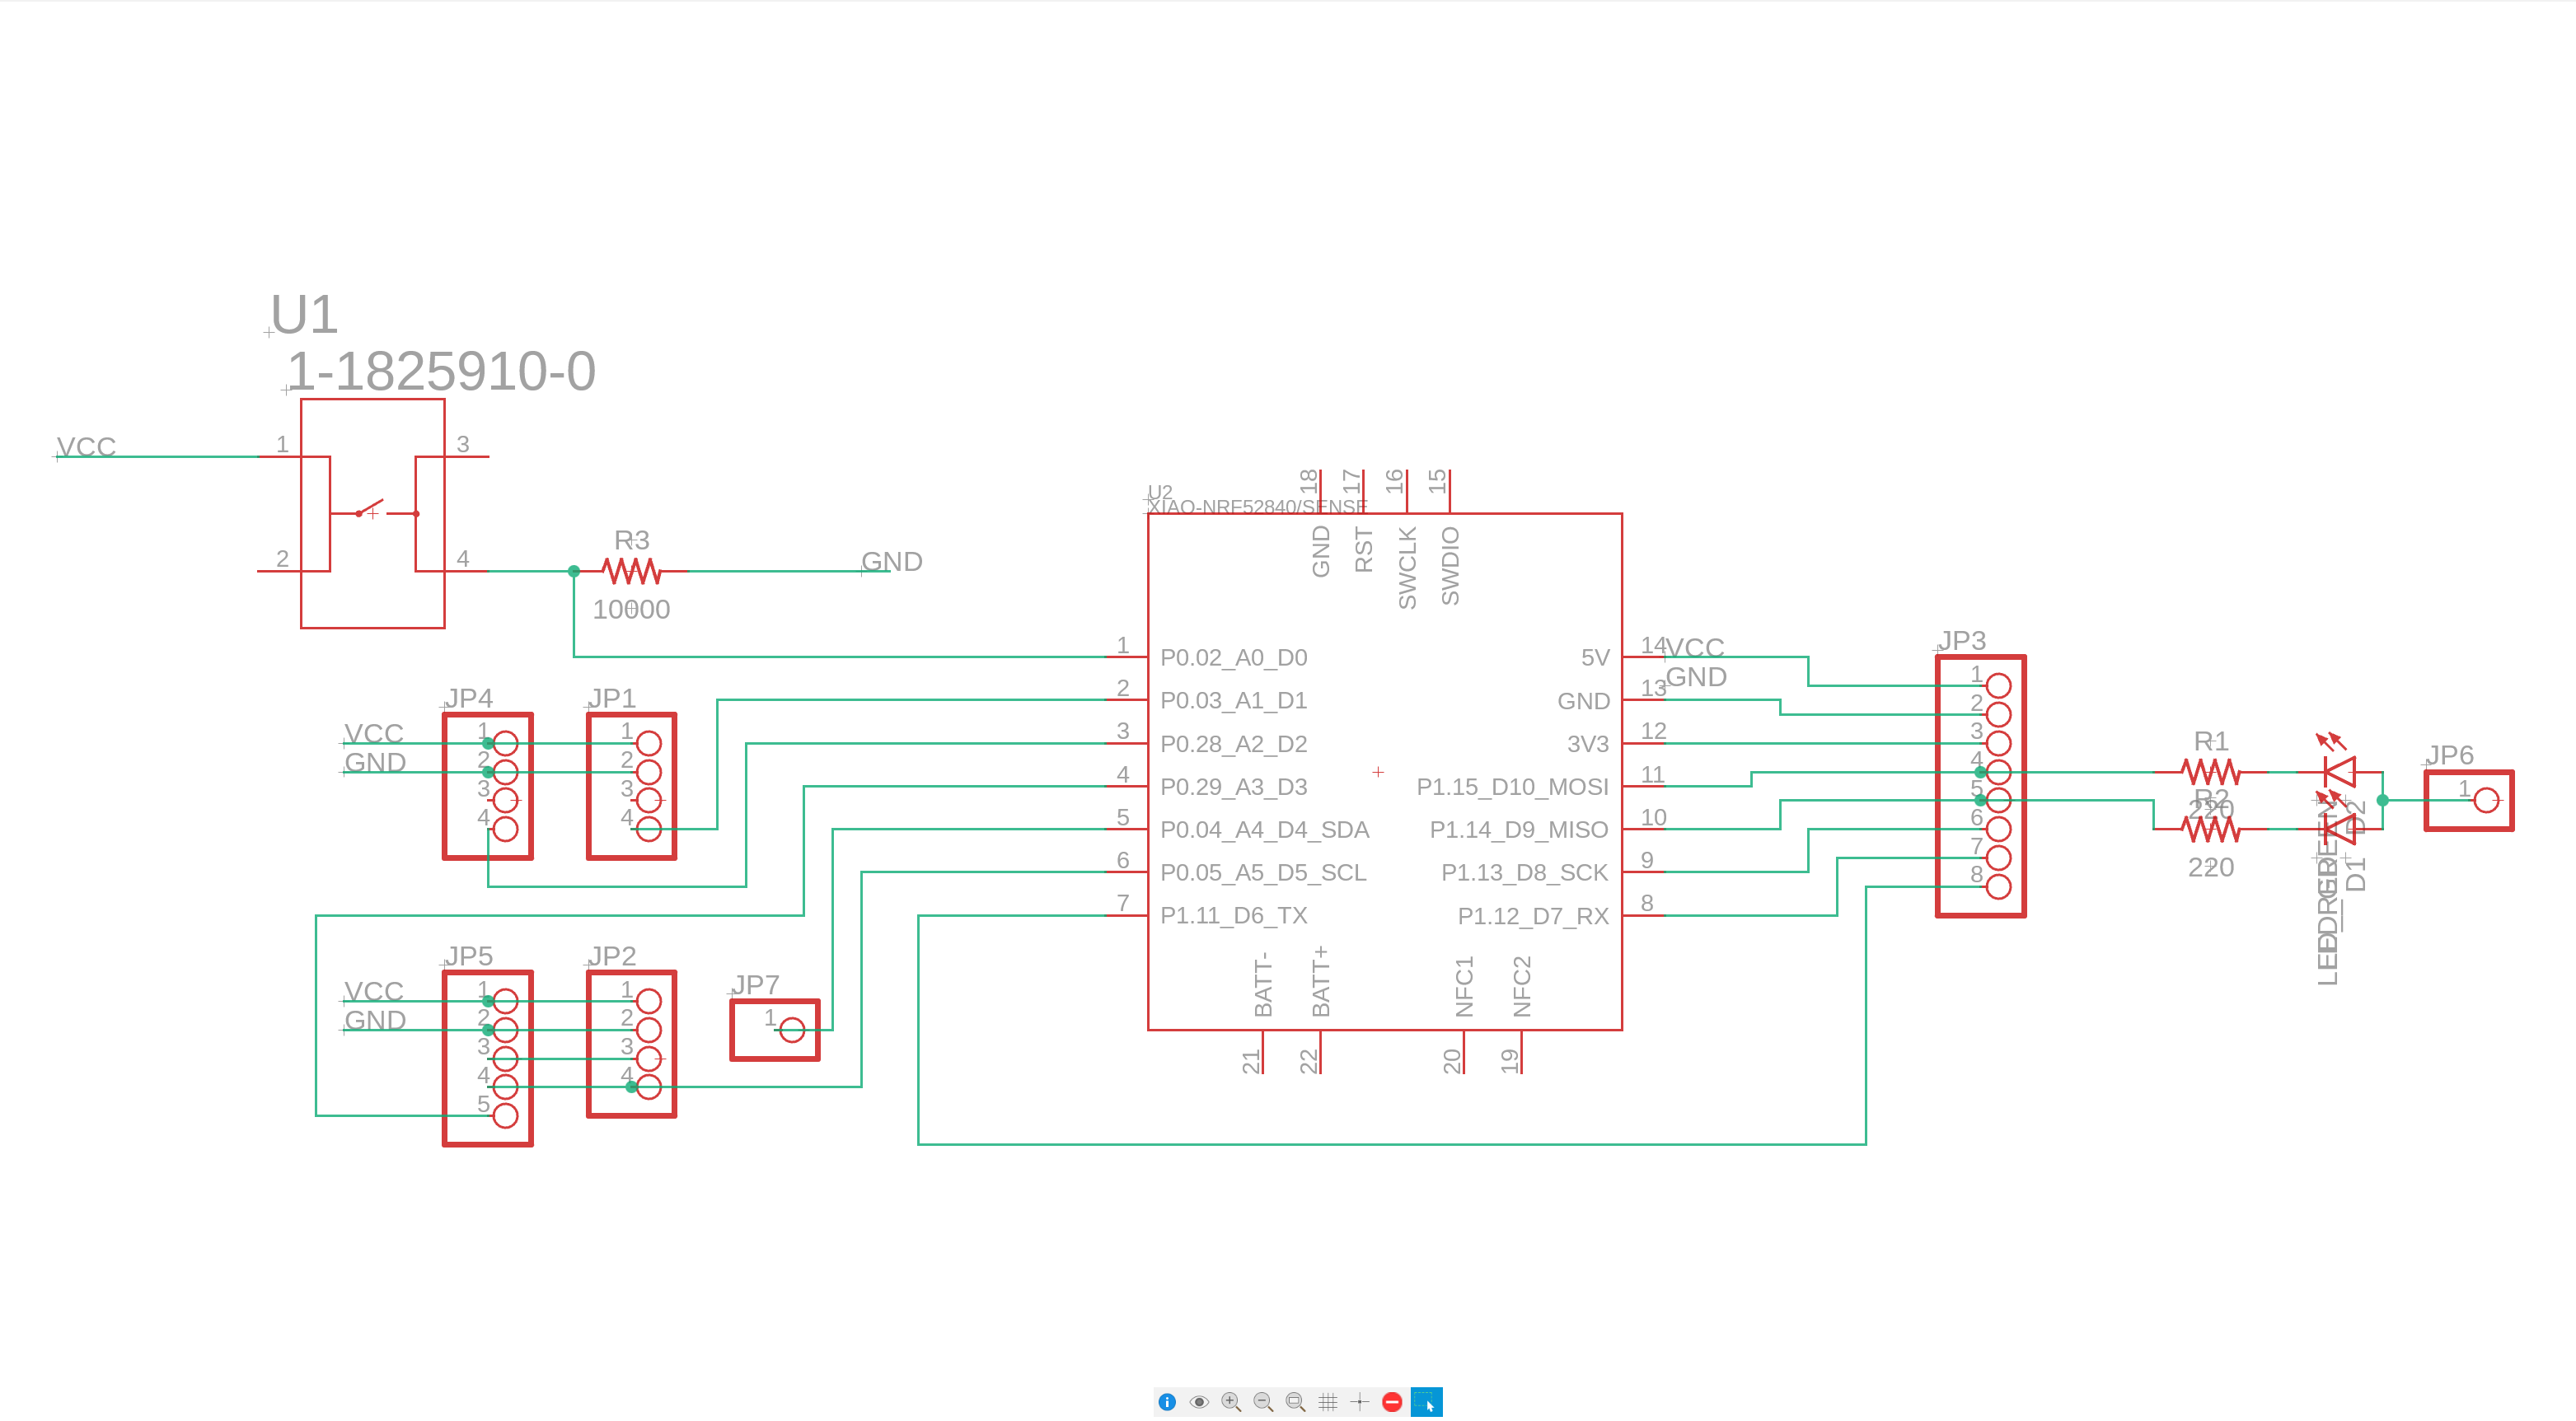
Electronic Design & Production
Design the PCB for detection module with Fusion 360.
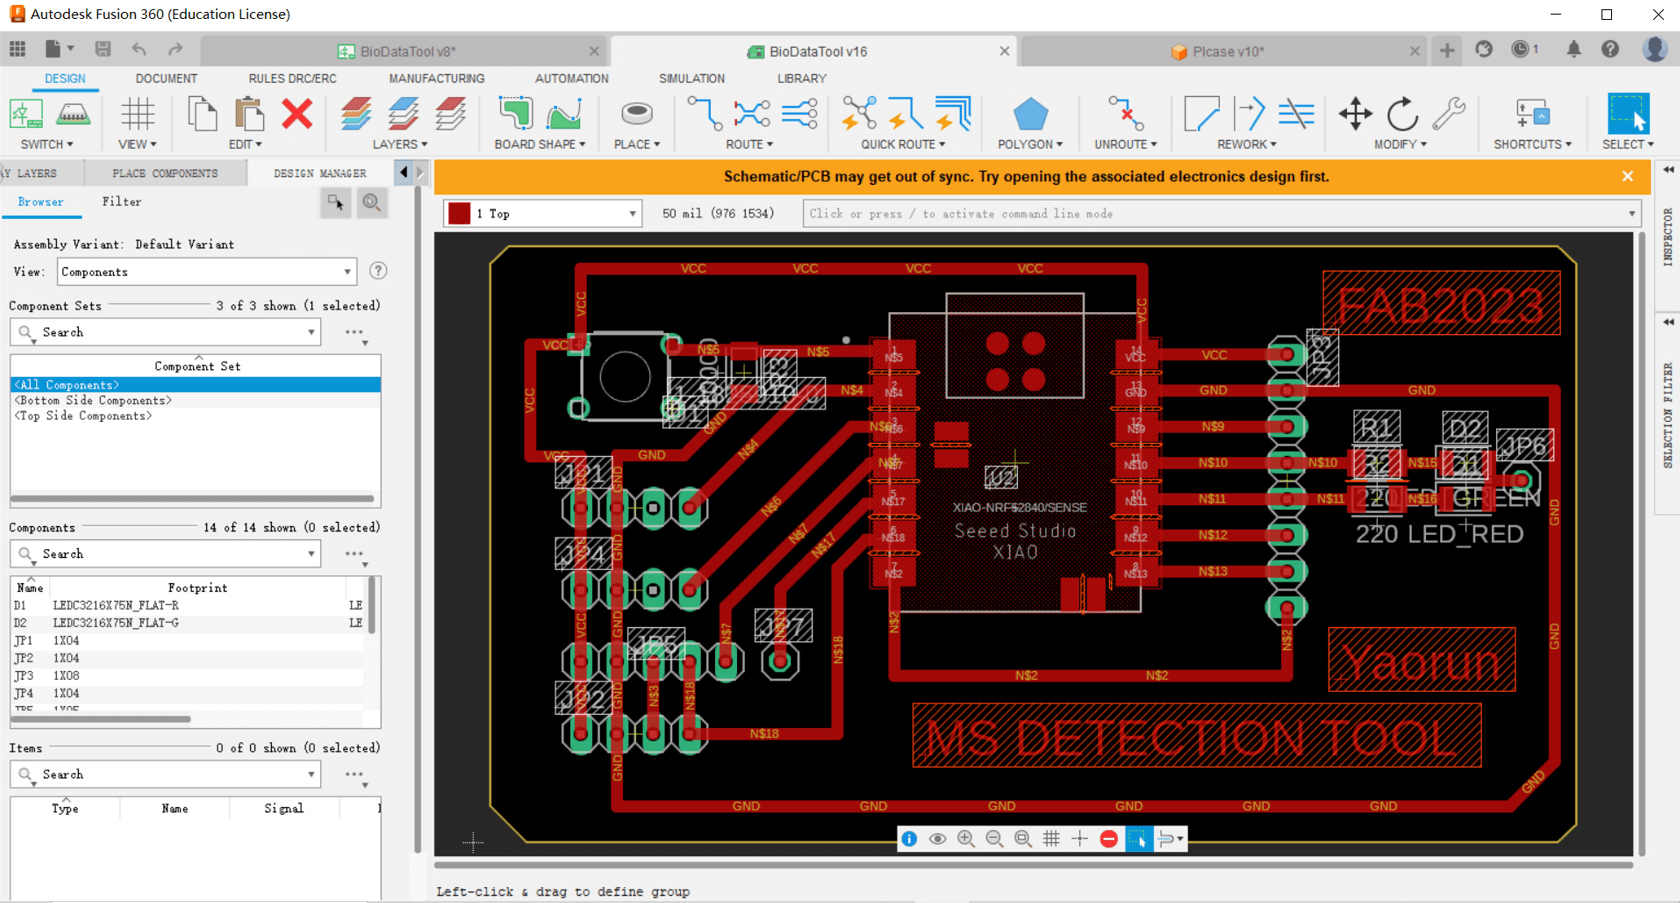
Manufacture the PCB with Roland and soldering it.
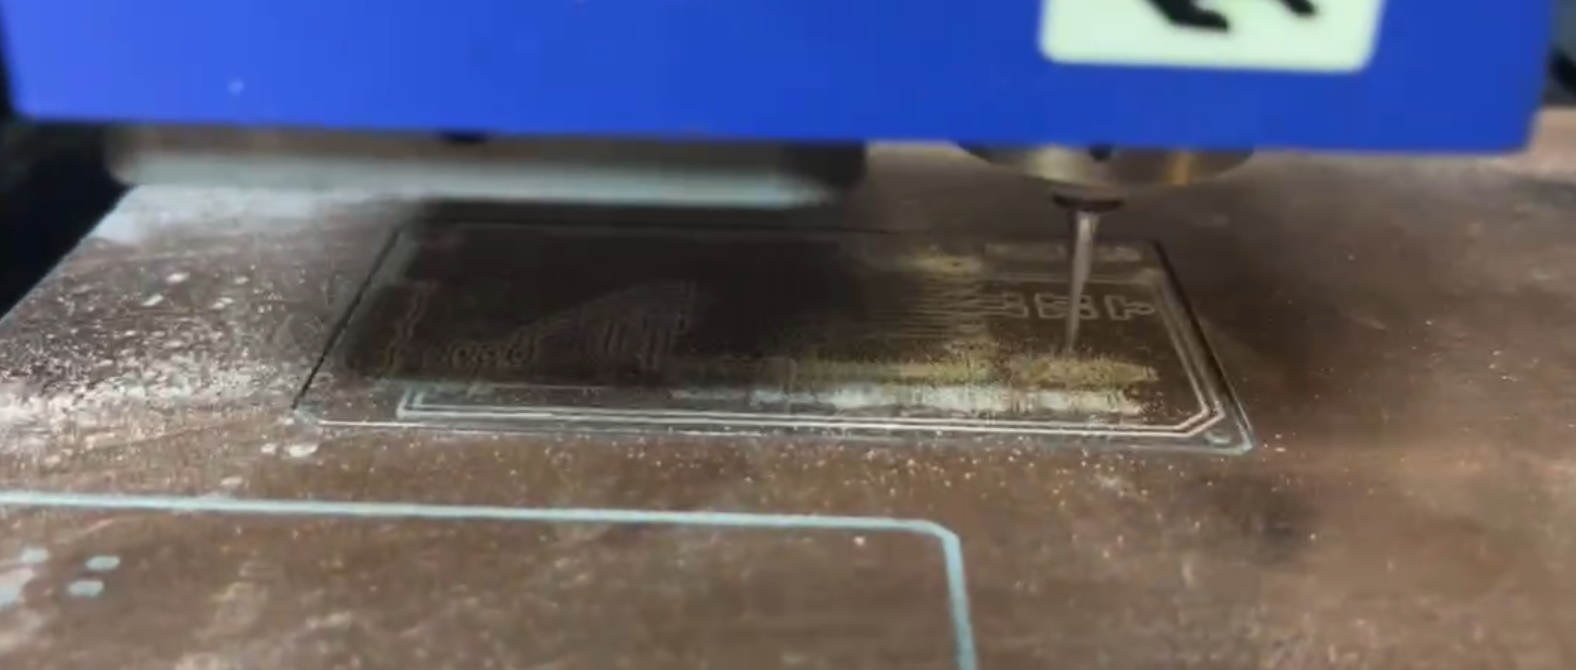
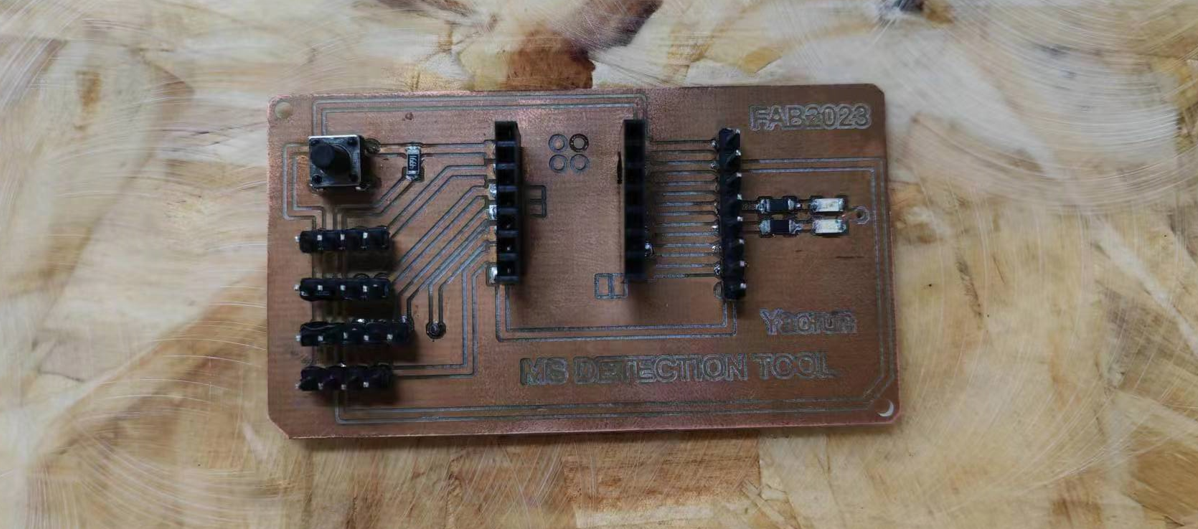
The video below shown the PCB design and manufacture process.
You can download my PCB design by link below:
- https://a360.co/4fv4euf The design flies are also uploaded to my repo: https://gitlab.fabcloud.org/academany/fabacademy/2023/labs/ningbo/students/yaorun-zhang/-/tree/main/docs/assignments/week18/designfiles?ref_type=heads
Embedded Programming for sensors and network communication
Programming and testing the bio-signal detection module, setting up wifi communication between the Raspberry Pi and bio-signal detection module. In the following code the wire was connected as below:
- MAX30205 (Temperature Sensor): VCC to 3.3V, GND to Ground, SCL to D5, SDA to D4
- Pulse Sensor: Signal to A1, VCC to 5V, GND to Ground
- GSR Sensor: Signal to A2, VCC to 5V, GND to Ground
#include <WiFi.h>
#include <Wire.h>
#include <Protocentral_MAX30205.h>
#include <PulseSensorPlayground.h>

// Wi-Fi Server setup
WiFiServer server(1122);

// MAX30205 (Temperature Sensor) and Pulse Sensor setup
MAX30205 tempSensor;
const int PulseWire = A1; // Purple wire connected to GPIO2
const int GSR = A2;       // GSR sensor pin
PulseSensorPlayground pulseSensor;

// Variables for sensor data
float temperature = 0.0;
int gsrValue = 0;
int bpmRaw = 0;

// Wi-Fi initialization
void Wifi_TCP_Init() {
  WiFi.softAP("ESP32-Sensors"); // Access Point name
  server.begin();               // Start server
  Serial.begin(115200);         // Initialize serial communication
  Serial.println("WiFi server started!");
}

// Read sensor data
void readSensorData() {
  // Temperature from MAX30205
  temperature = tempSensor.getTemperature();

  // GSR sensor average value
  long sum = 0;
  for (int i = 0; i < 10; i++) { // Average 10 measurements to remove glitches
    sum += analogRead(GSR);
    delay(10);
  }
  gsrValue = sum / 10;

  // Pulse sensor raw signal
  bpmRaw = analogRead(PulseWire);
}

// Send sensor data to connected clients
void Wifi_TCP_Send() {
  WiFiClient client = server.available(); // Check if a client is connected
  if (client) {
    Serial.println("Client connected!");

    while (client.connected()) { // Keep sending data while the client is connected
      readSensorData(); // Read the latest sensor data

      // Format and send the sensor data
      client.print("temp:");
      client.print(temperature, 2); // Send temperature with 2 decimal places
      client.print(",gsr:");
      client.print(gsrValue);
      client.print(",bpmraw:");
      client.print(bpmRaw);
      client.print("\n"); // Add newline for easy parsing

      // Debug output for the Serial Monitor
      Serial.println("Data sent to client:");
      Serial.print("Temperature: "); Serial.println(temperature, 2);
      Serial.print("GSR Value: "); Serial.println(gsrValue);
      Serial.print("Pulse Sensor Raw: "); Serial.println(bpmRaw);

      delay(10); // Send time
    }

    Serial.println("Client disconnected.");
    client.stop(); // Stop the client when it disconnects
  }
}

void setup() {
  Wire.begin();             // Initialize I2C communication
  tempSensor.begin();       // Initialize the temperature sensor
  pulseSensor.analogInput(PulseWire); // Initialize the pulse sensor
  Wifi_TCP_Init();          // Initialize Wi-Fi and server
}

void loop() {
  Wifi_TCP_Send();          // Continuously send sensor data over Wi-Fi
}
Interface and application programming
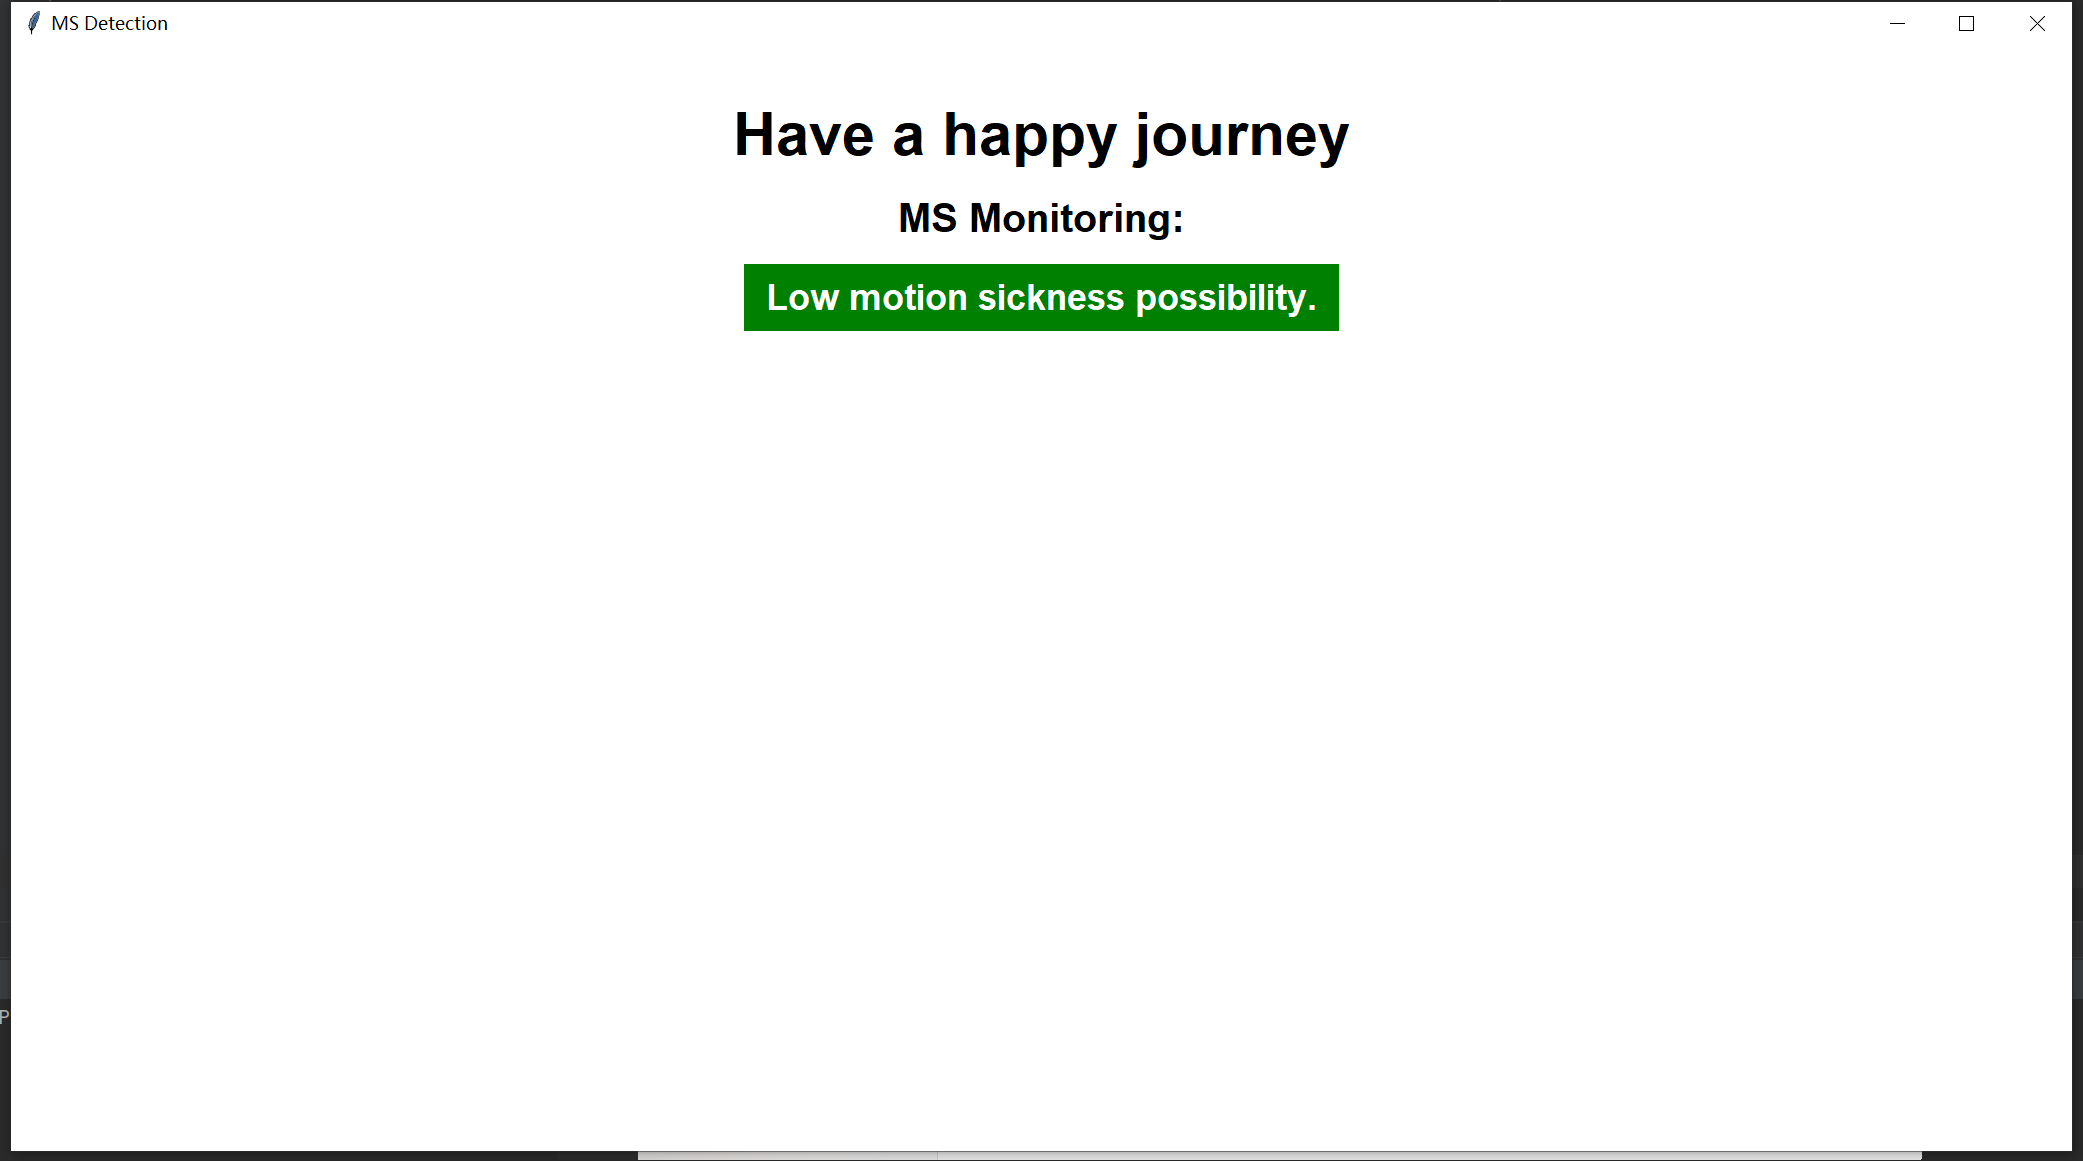
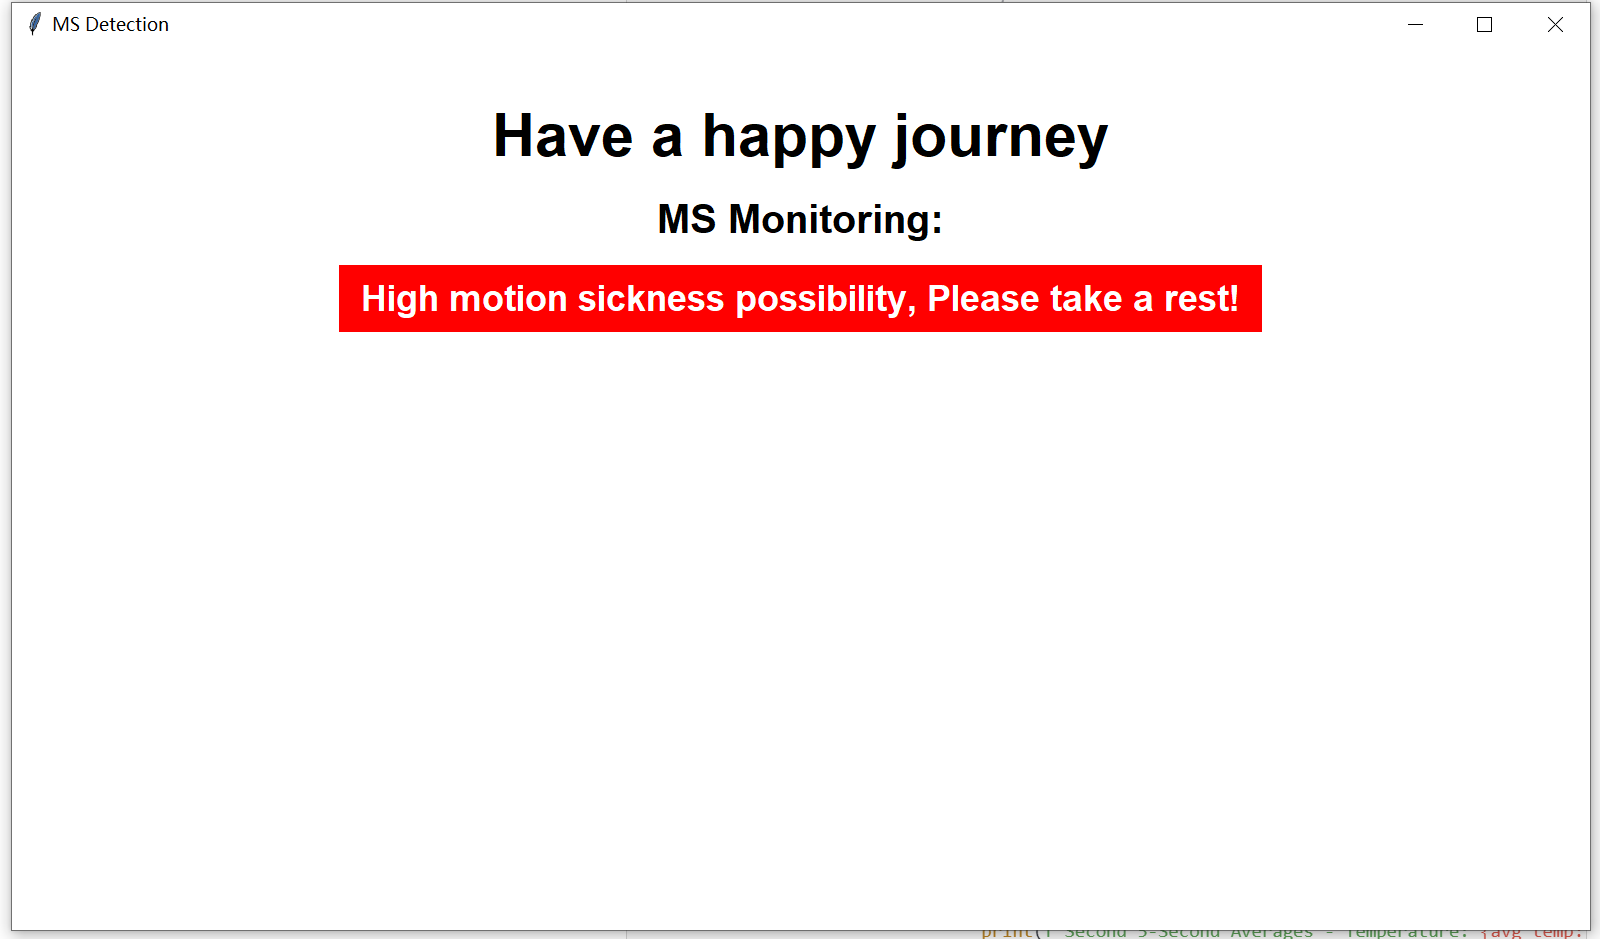
Developing the data processing program and deploy it on the Raspberry Pi. Then build a user interface to display analyzed bio-signal data, making results accessible for end users. The interfaces looks like figures below:
import tkinter as tk
import socket
import threading
import time

# Initialize GUI application
root = tk.Tk()
root.title("Motion Sickness Prediction")
root.geometry("800x480")
root.configure(bg="white")

# Add title labels
title_label = tk.Label(
    root,
    text="Have A Happy Journey",
    font=("Arial", 24, "bold"),
    bg="white",
    fg="black"
)
title_label.pack(pady=(20, 5))

subtitle_label = tk.Label(
    root,
    text="Motion Sickness Monitoring",
    font=("Arial", 16),
    bg="white",
    fg="black"
)
subtitle_label.pack(pady=(0, 20))

# Add alert label
alert_label = tk.Label(
    root,
    text="Low motion sickness possibility.",
    font=("Arial", 18, "bold"),
    bg="green",
    fg="white",
    padx=20,
    pady=10
)
alert_label.pack(pady=(50, 20))

# Function to update alert based on conditions
def update_alert(delta_temp, delta_gsr, delta_bpmraw):
    if delta_temp < 0 and delta_gsr > 0 and delta_bpmraw > 0:
        alert_label.config(
            text="High motion sickness possibility, Please take a rest!",
            bg="red",
            fg="white"
        )
    else:
        alert_label.config(
            text="Low motion sickness possibility.",
            bg="green",
            fg="white"
        )

# Function to handle data receiving and processing
def receive_data():
    tcp_client_socket = socket.socket(socket.AF_INET, socket.SOCK_STREAM)
    tcp_client_socket.connect(("192.168.4.1", 1122))

    buffer = ""
    temp_values = []
    gsr_values = []
    bpmraw_values = []

    first_interval = True
    averages_first = {"temp": 0, "gsr": 0, "bpmraw": 0}
    start_time = time.time()

    try:
        while True:
            recv_data = tcp_client_socket.recv(1024).decode("utf-8")
            buffer += recv_data

            while '\n' in buffer:
                message_end = buffer.index('\n')
                message = buffer[:message_end]
                buffer = buffer[message_end + 1:]

                try:
                    if "temp:" in message and "gsr:" in message and "bpmraw:" in message:
                        temp_start = message.index("temp:") + 5
                        temp_end = message.index(",gsr:")
                        temperature = float(message[temp_start:temp_end].strip())

                        gsr_start = message.index("gsr:") + 4
                        gsr_end = message.index(",bpmraw:")
                        gsr = int(message[gsr_start:gsr_end].strip())

                        bpmraw_start = message.index("bpmraw:") + 7
                        bpmraw = int(message[bpmraw_start:].strip())

                        temp_values.append(temperature)
                        gsr_values.append(gsr)
                        bpmraw_values.append(bpmraw)

                        if time.time() - start_time >= 5:
                            avg_temp = sum(temp_values) / len(temp_values) if temp_values else 0
                            avg_gsr = sum(gsr_values) / len(gsr_values) if gsr_values else 0
                            avg_bpmraw = sum(bpmraw_values) / len(bpmraw_values) if bpmraw_values else 0

                            if first_interval:
                                averages_first["temp"] = avg_temp
                                averages_first["gsr"] = avg_gsr
                                averages_first["bpmraw"] = avg_bpmraw
                                first_interval = False
                            else:
                                delta_temp = avg_temp - averages_first["temp"]
                                delta_gsr = avg_gsr - averages_first["gsr"]
                                delta_bpmraw = avg_bpmraw - averages_first["bpmraw"]

                                update_alert(delta_temp, delta_gsr, delta_bpmraw)

                                first_interval = True

                            temp_values.clear()
                            gsr_values.clear()
                            bpmraw_values.clear()
                            start_time = time.time()
                except Exception as e:
                    print(f"Parsing Error: {e}")
    except KeyboardInterrupt:
        print("Exiting...")
    finally:
        tcp_client_socket.close()

# Start the data receiving thread
threading.Thread(target=receive_data, daemon=True).start()

# Run the Tkinter event loop
root.mainloop()
The motion sickness prediction logic is very simple and it is based on the research: "Koohestani, A., Nahavandi, D., Asadi, H., Kebria, P. M., Khosravi, A., Alizadehsani, R., & Nahavandi, S. (2019). A knowledge discovery in motion sickness: a comprehensive literature review. IEEE access, 7, 85755-85770."
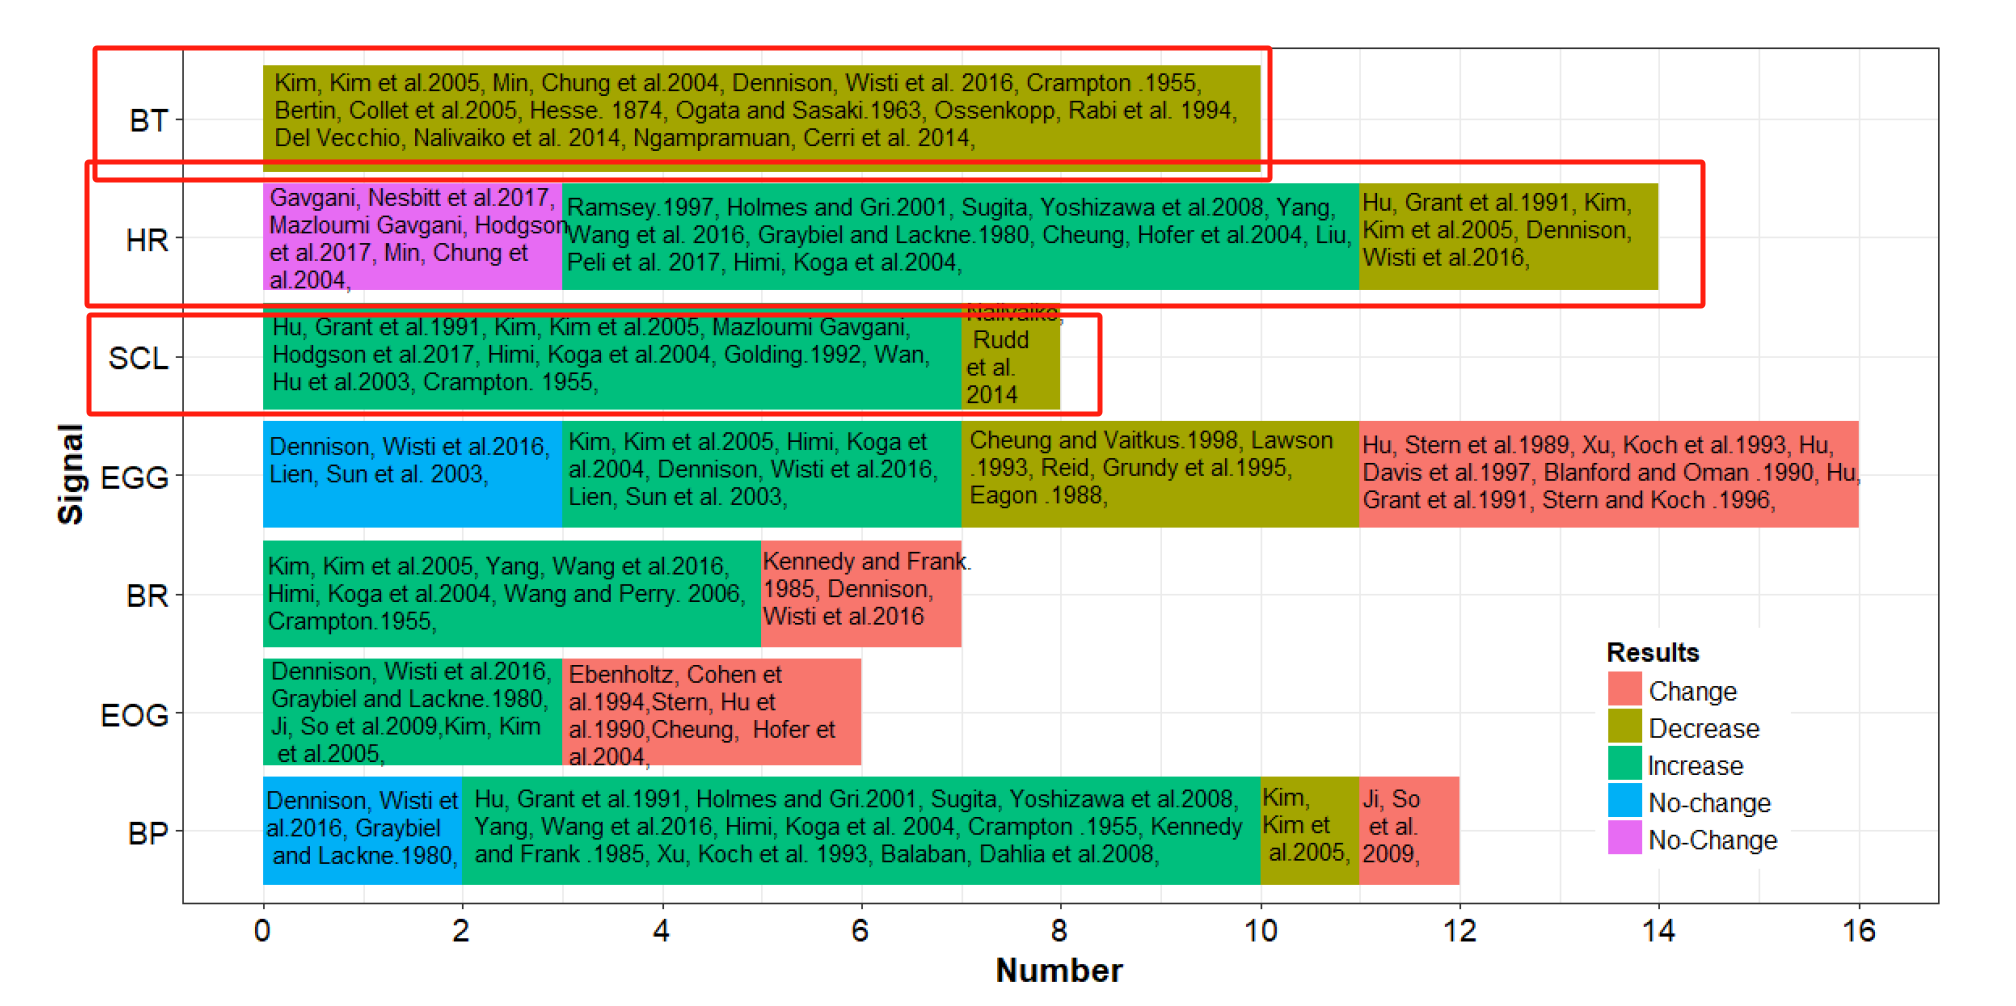
The motion sickness prediction algorithm in this code evaluates changes in three physiological parameters: temperature, GSR, and pulse. If the temperature decreases (delta_temp < 0) while both GSR and pulse increase (delta_gsr > 0 and delta_bpmraw > 0), the system flags a high risk of motion sickness with a red alert: "High motion sickness possibility, Please take a rest!". In all other cases, it displays a green alert: "Low motion sickness possibility."
Generate a standalone executable .exe file
To convert your Python script into a standalone .exe file, follow these steps:
- Install PyInstaller First, install PyInstaller using pip. Open your terminal or command prompt and run the following command:
pip install pyinstallerPrepare the Script Make sure your Python script (e.g., RealtimeMSpredict.py) is working properly.
Create the Executable Navigate to the folder containing your Python script using the terminal or command prompt. Then, run the following command:
pyinstaller --onefile --windowed RealtimeMSpredict.py- --onefile: This option bundles everything into a single executable file.
- --windowed: This prevents a terminal window from appearing when you run the application (useful for GUI apps).
- Find & Test the Executable After PyInstaller finishes building the executable, you can find it in the
dist/folder inside your project directory. Navigate to thedist/folder and run the.exefile.
Note for Distributing the PyInstaller Executable
When need to copy .exe file generated by PyInstaller, consider the following:
dist/Folder- This folder contains the final
.exefile. - What to copy: Only the
.exefile from this folder. - Why: This is the standalone executable that can be run on another machine without needing Python installed.
- This folder contains the final
build/Folder- This folder contains intermediate files used during the build process.
- What to copy: Nothing from this folder is needed for distribution.
- Why: It is not necessary to distribute this folder to the end user.
<YourScriptName>.specFile- This is a configuration file created by PyInstaller.
- What to copy: This file is not required for distribution.
- Why: It's used for rebuilding the executable, not needed for running the app.
Additional Files or Folders
- If your application uses external files (like images, configuration files, etc.), ensure these are included.
- What to copy: External files such as images, configuration files, etc., if they are used by your app.
- Why: These files are necessary for the app to function properly, but they are not bundled automatically unless you specify them with the
--add-dataoption.
DLL or Dependency Files (in some cases)
- PyInstaller bundles most dependencies, but sometimes external DLLs or libraries are needed (especially for non-Python dependencies).
- What to copy: Any additional DLLs or dependencies that are missing when running the
.exeon another machine. - Why: These files may be required if PyInstaller missed bundling them automatically.
Assemble & test.
See assemble and test result.
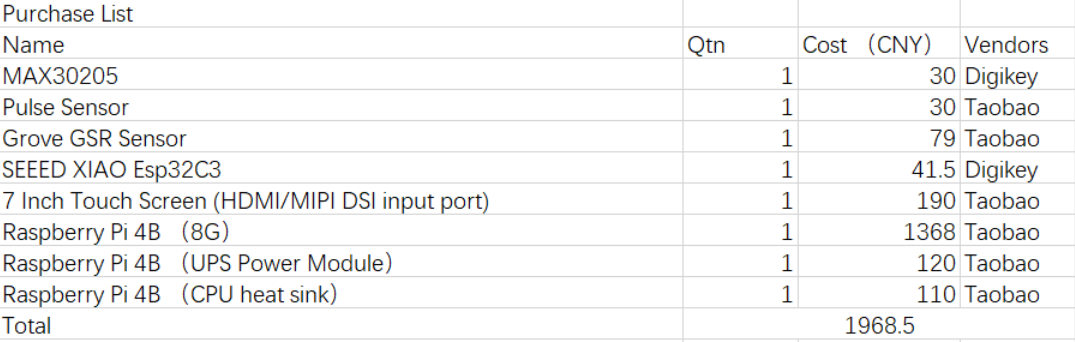
Material BOM List
The purchase list involved in this project is shown as table below.