Appearance
Application and Implications
This is one of the last weeks for FabAcademy and I'm using this assignment for structuring the final project.
Motivation
Motion sickness has long been recognized as an important factor affecting a person's car riding experience. In this project, I would like to develop a bio-signal data collection and analyzation tool kit that can be further developed for predict the occurrence of motion sickness based on human physiological signals. This device will be used in a car riding environment, anyone who is likely to encounter car-sickness will be a potential user.
Idea Sketch
The figure below has shown the original idea design of this tool set.
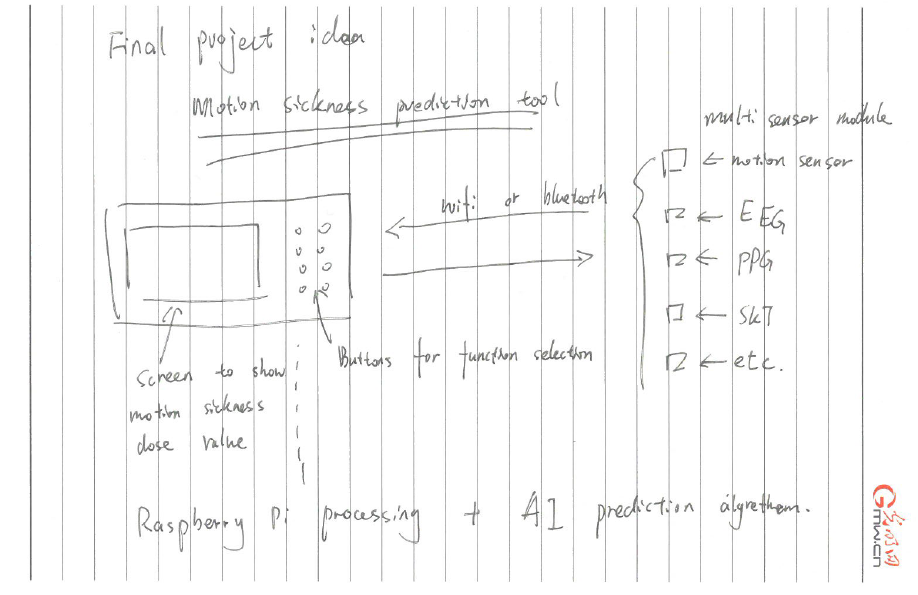
This detection tool consists of 5 parts:
- A set of sensors for collecting human physiological signals includes PPG, SKT etc.
- A data processor module based on Raspberry Pi with Wifi connection.
- An algorithm (possibly with AI powered) for data processing which can be deployed on Raspberry Pi.
- A screen to show motion sickness dose value.
- A control panel for function selection.
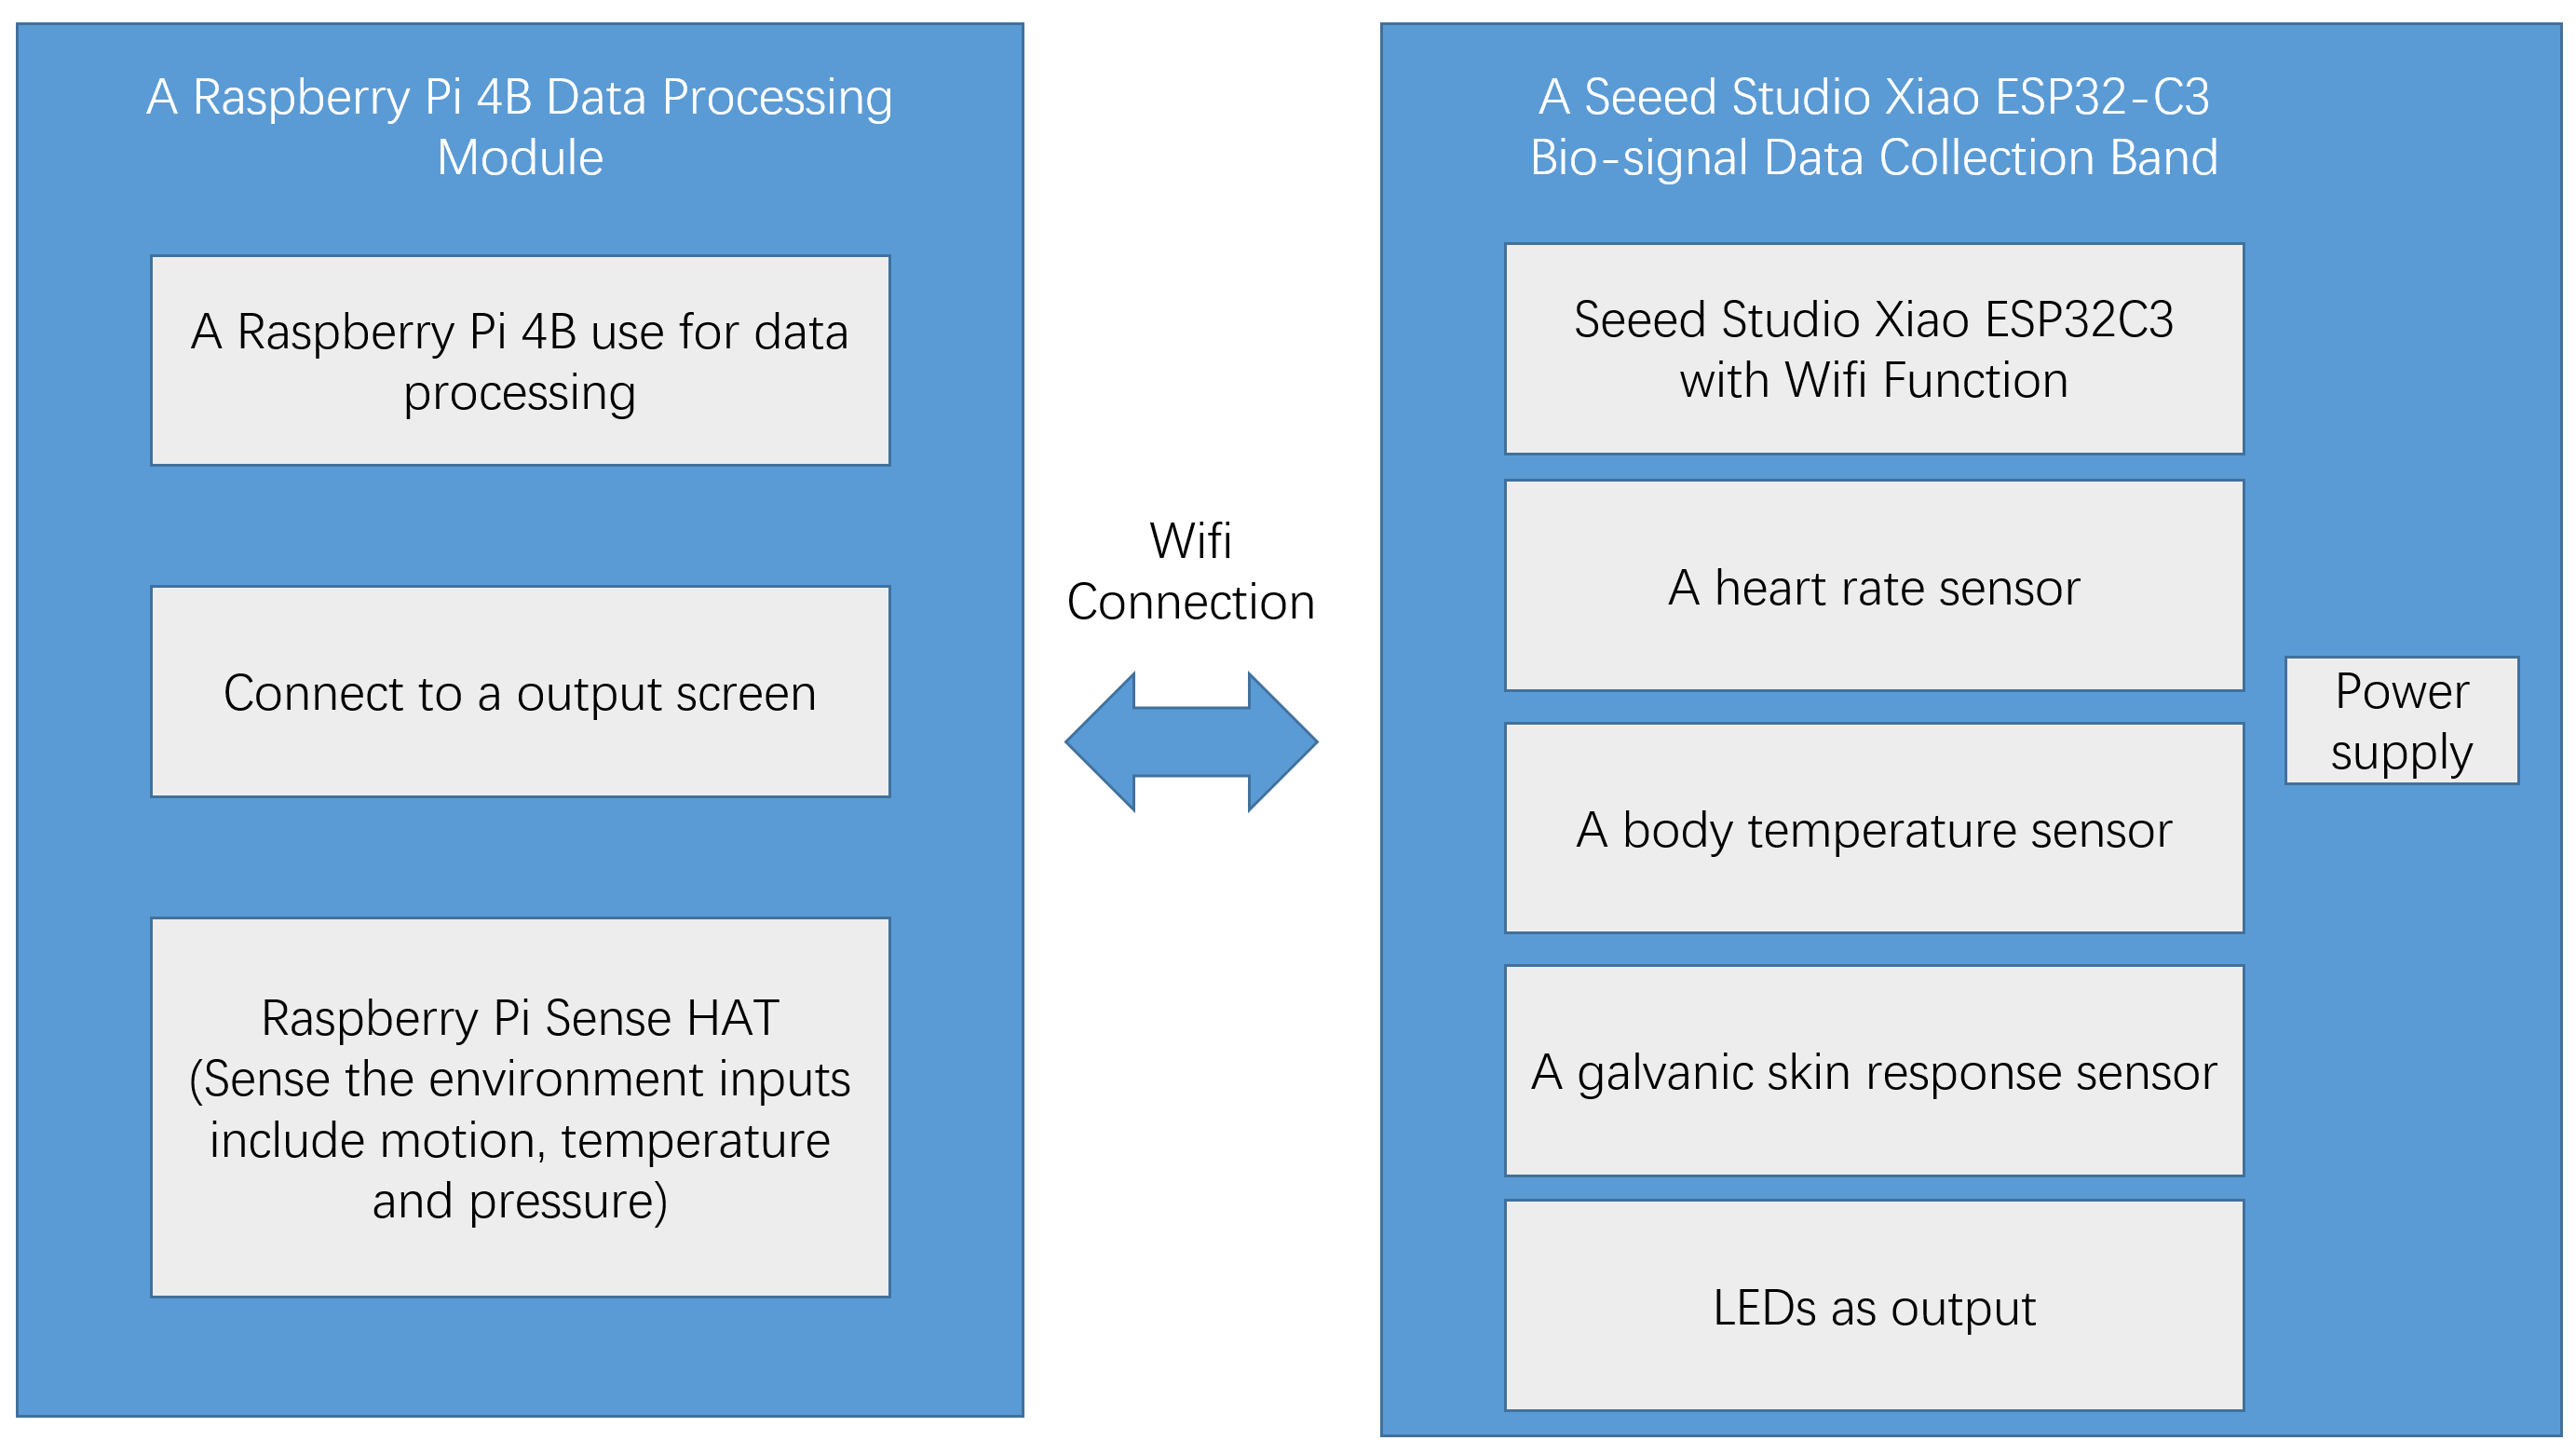
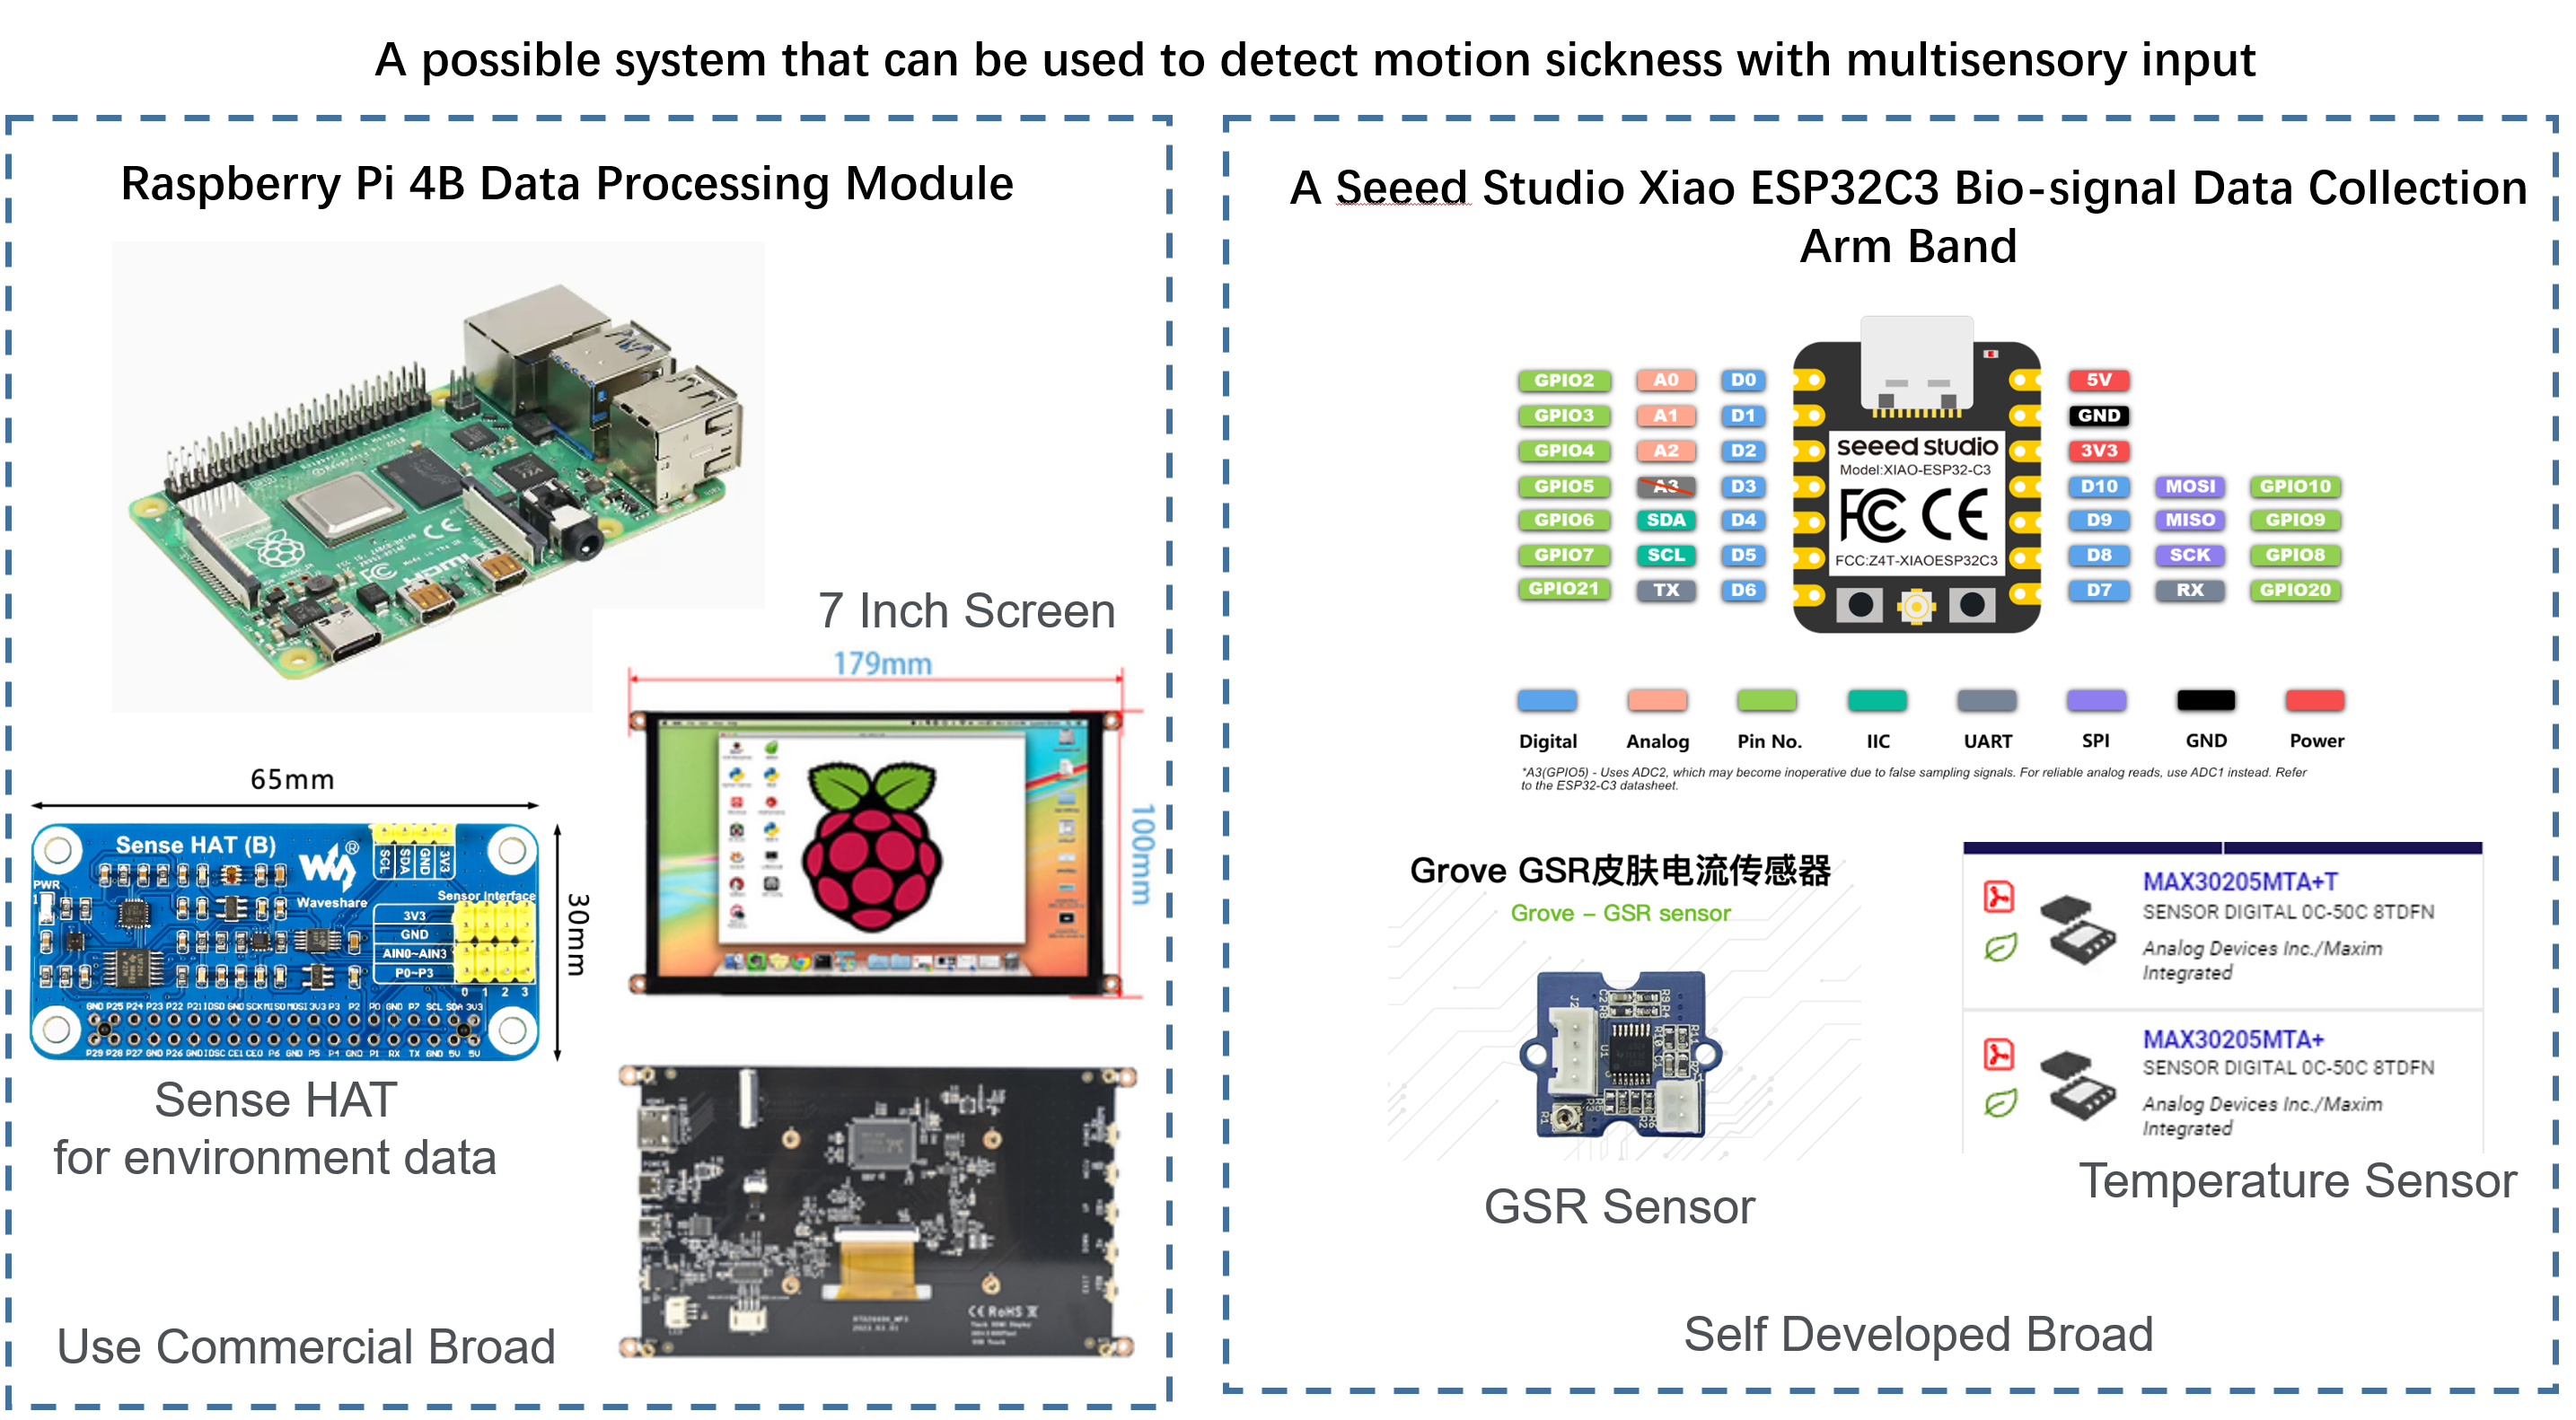
After weeks of learning I have adjusted my final project design and the idea is demonstrated as below. In this new design the Tool kit is divided into two parts: A Raspberry Pi 4B Data Processing Module and A Seeed Studio ESP32C3 Bio-signal Data Collection Module.
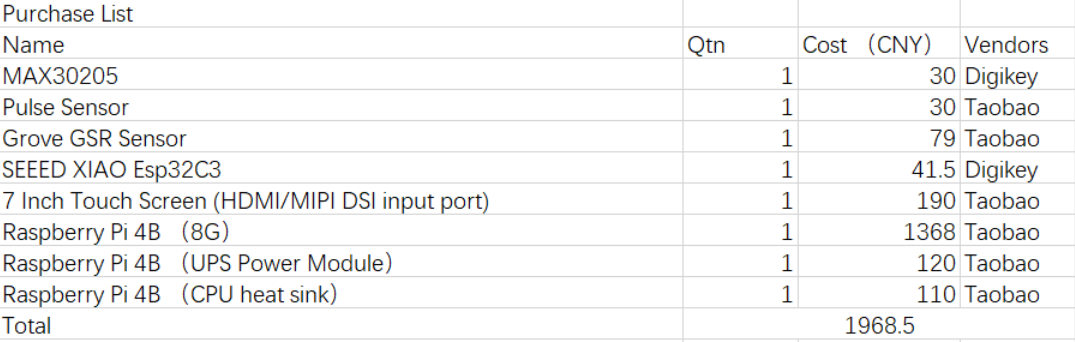
The purchase list involved in this project is shown as table below, with a total cost of 1968.5 CNY.
Overall Techniques Applied in this Project
- Computer Aided Design - the Bio-signal Detection Module Housing
- Computer Controlled Cutting - the LOGO Sticker
- Embedded Programming - the Bio-Signal Detection Module Program and the Data Processing Program
- 3D Printing - the Housing of Bio-signal Detection Module
- Input device - Multi-biosensors
- Output device - Screen
- Electronic Design - Design Biosensor Connections to MCU
- Electronic Production - Production of PDB
- Networking and Communications - Wifi Connection between Raspberry Pi and Bio-signal Detection Module
- Interface and application programming - Demonstration of the Detected and the Analyzed Bio-signal, Using it to predict the motion sickness possibility
Project tracking
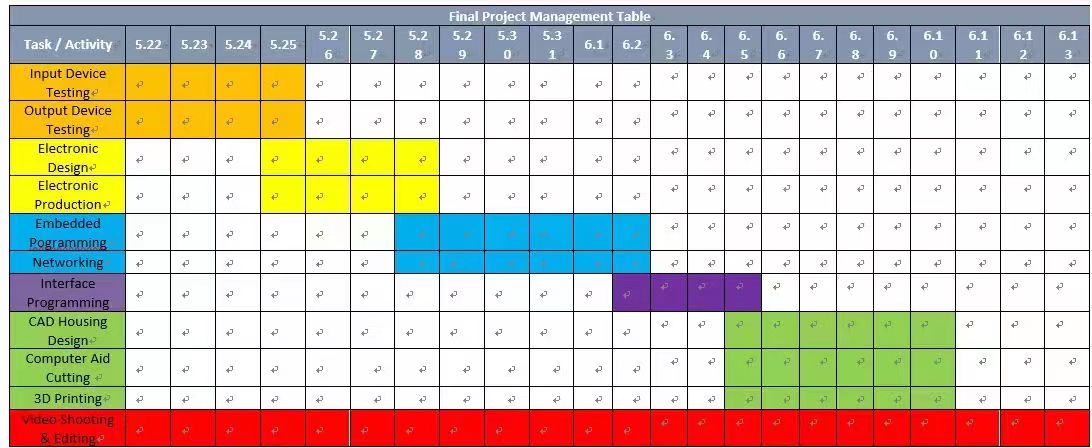
Project Tasks and Timeline Overview:
Input Device Testing (5.22 - 5.26) Testing various biosensors (e.g., motion, PPG, SKT) to ensure accurate signal collection from physiological inputs. Highlighted in yellow.
Output Device Testing (5.24 - 5.26) Verifying the functionality of the screen display to show motion sickness values accurately. Also highlighted in yellow.
Electronic Design (5.25 - 5.26) Designing the connection setup for biosensors to interface with the micro-controller unit (MCU). This task ensures proper sensor integration and data flow, shown in yellow.
Electronic Production (5.28) Producing the Printed Circuit Board (PCB) for sensor connections, highlighted in yellow, marking a key step in finalizing the hardware.
Embedded Programming (5.28 - 5.31) Developing and testing the bio-signal detection and data processing programs, deployable on the Raspberry Pi, and involving wifi data transmission. Shown in blue.
Networking (6.1 - 6.3) Setting up wifi communication between the Raspberry Pi and bio-signal detection module, allowing real-time data transfer. Highlighted in purple.
Interface Programming (6.2 - 6.4) Developing a user interface to display analyzed bio-signal data, making results accessible for end users. Shown in purple.
CAD Housing Design (6.3 - 6.6) Creating the housing design for the detection module using CAD, with a focus on ergonomics and durability. Highlighted in green.
Computer-Aided Cutting (6.5 - 6.8) Cutting the logo sticker for device branding, enhancing visual appeal and project identity. Also highlighted in green.
3D Printing (6.6 - 6.9) Producing the physical housing for the bio-signal detection module using 3D printing, creating a secure casing for the components. Shown in green.
Video Shooting & Editing (5.22 - 6.13) Documenting the project process, including demonstration videos for the final toolkit. This task spans the entire timeline, highlighted in red.
This timeline ensures all critical components—from hardware assembly to software deployment and final documentation—are addressed sequentially, facilitating smooth project development and alignment with the project’s objectives.