Objective
Write an application that interfaces a user with an input &/or output device that you made.
Introduction
In this week were introduced to applications and how to interface or create our own app which is appealing to the user like a UI.
An interactive User Interface is an important part of an application since majority of times a user is going to use the UI to interact with the backend electronics.
Alot of software services also give importance to UI/UX design.
There are multiple aspects to designing an effective UI. Take for the different OS used on aur smartphone some might have an Android device some might have an IOS device and any other device that contain an OS.
The point over here is how people get attracted to there devices while they use an application.
Majority of times it come down to simplicity. The usage of icons or mind boggling font styles.
For this assignment we are going to design an interface where the user can interact with the project and I would say its an important aspect if you trying to do something usefull.
UI and UX
An application is a program that is divided into two parts
1. UI – User Interface
2. UX – User Experience.
UI
Each of these elements have a distinct meaning for which how they work.
An user interface could be defined as something that provides the user with inputs to perform a task on the application.
Eg:- A button
A help button is one of the more common features of a User interface.
An interface could be anything that has some purpose. It could be buttons, lists etc.
UX
A user experience is something that is designed by someone (developers/teams) for the user to provide with a relevent and meaningfull experiences.
It could be tasks like shopping on an e-commerce website like Amazon or Flipkart.
Different options to create an applications
Application could be anything thats usefull they are a pieces of software that run on our mobile devices or full-fledged computrer applications.
I would like to make a web-app for my project because I would like to show my data on a webpage so that the user could see whats happening inside the dome dryer.
Before all this I need a platform where I can send my data too so I chose thingspeak. Its a platform maintained by mathworks for IOT applications.
Thingspeak has something called channels where you can export data to and then be ploted as graphs.
An image of the same is shown below.
To access thingspeak we need a mathworks account it works on a freemium model there are two tiers.
One a free tier with basic features and another a premium tier with advanced features.
Thingspeak and its features
Since our project fits well inside the free tier usage we would utilize this and keep our costs to a minimum.
You see Thingspeak has something called fields these are used to import data and plot the given data on to a graph.
These graphs are then showed in a channel which could be a separate project.
In general thingspeak hold a total of 8 fileds but for free tier user the effective number of graphs that can be supported by thingspeak is only 4.
This limitation puts a bar on the amount of data that we can show on our app to get rid of these limitions I would recommend you to buy a premium version of thingspeak for a shorter duration.
MIT Appinventor
Well another way to do this assignment is using mit appinventor its a platform that allows us to create a mobile app with ease.
Its designed for beginners even if you don't have any prior experience to coding you can still use the platform to make wonderfull UIs for android devices. I guess it also work for IOS devices.
The interface of the platform is shown below.
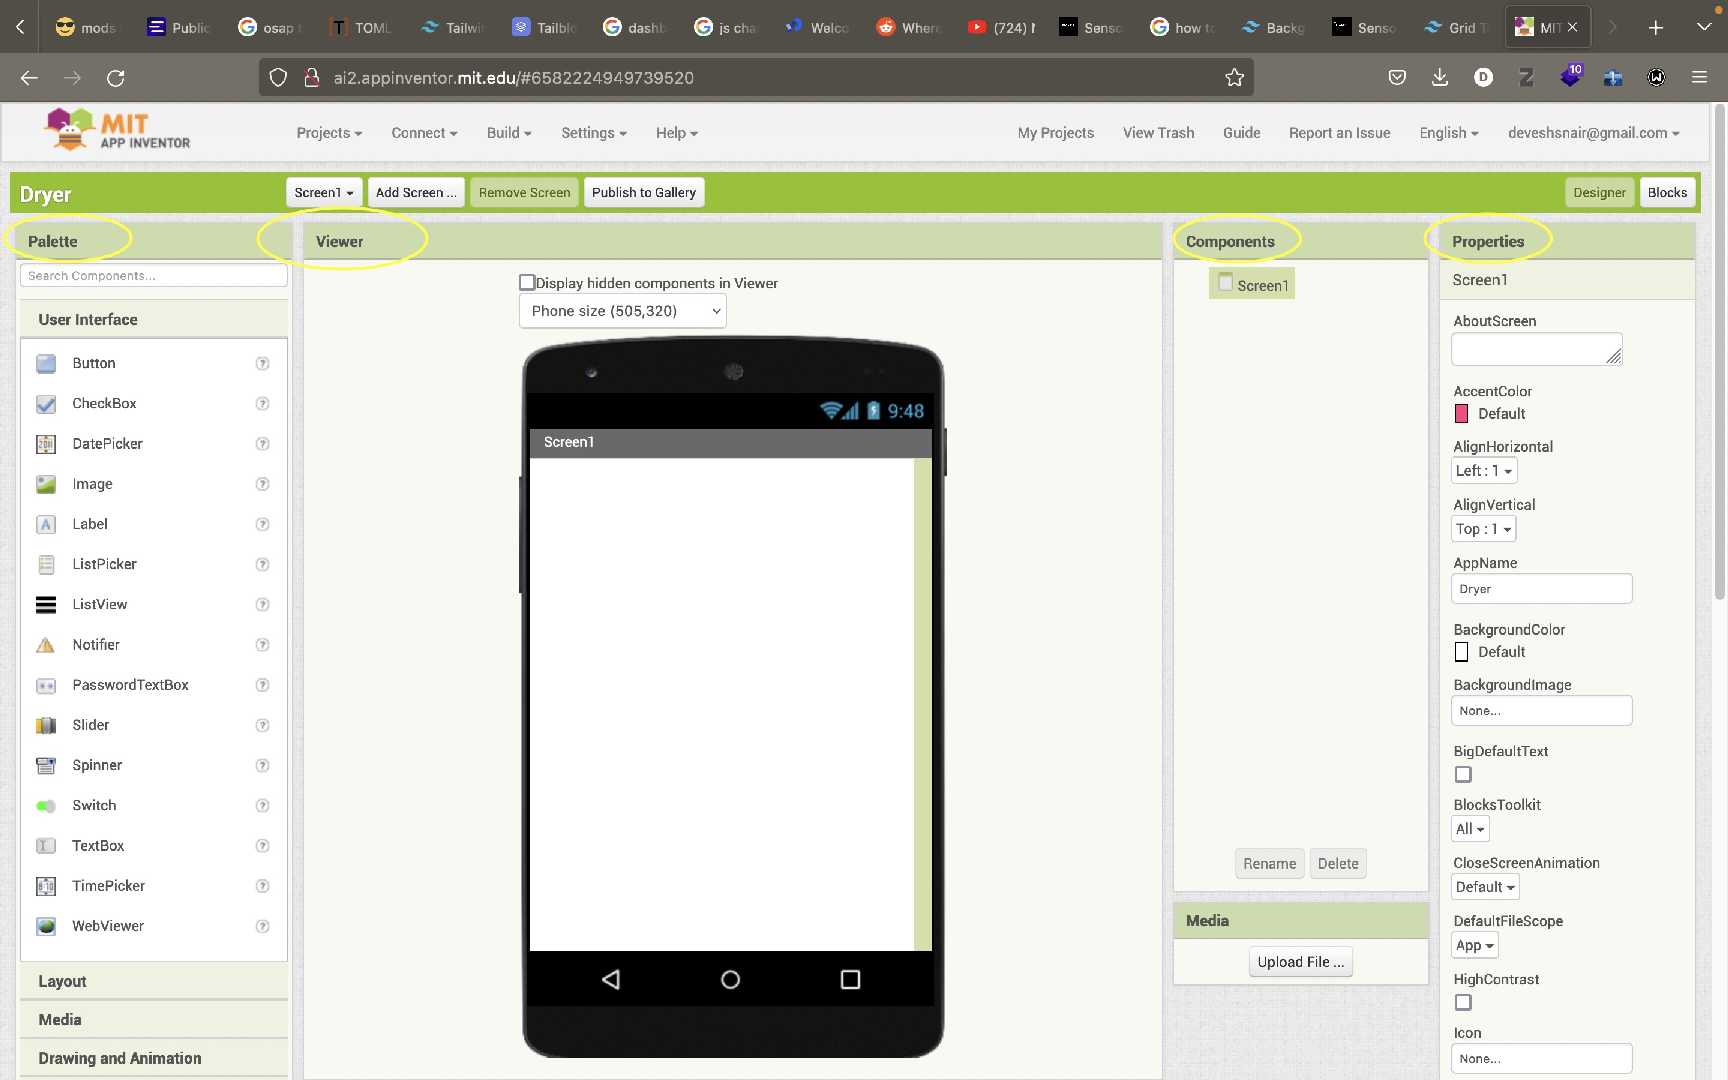
There are different type of tabs that serve different purposes they are:-
Palette tab
Viewer tab
Components tab and
Properties tab
Palette tab
A Palette tab is a collections of components that can be used to build a mobile app. It host all the components available in the appinventor.
Viewer tab
Its used for viewing the coponents in realtime. It shows a simulation of the app that you are building.
Its maily used to place the components from the palette tab.
It gives an overview aout the user interface.
Components tab
Its used to list out all the components that are being used in the project thats in development.
It displays components in a tree like structure for a better understanding.
Properties tab
Its used to list out the properties of a particular component at a given time.
To check the properties of the component just select that particular component and go to the properties tab.
We can see all the properties of that particular component. We can change the size and colour of the component and place them whereever we want.
Creating an interface
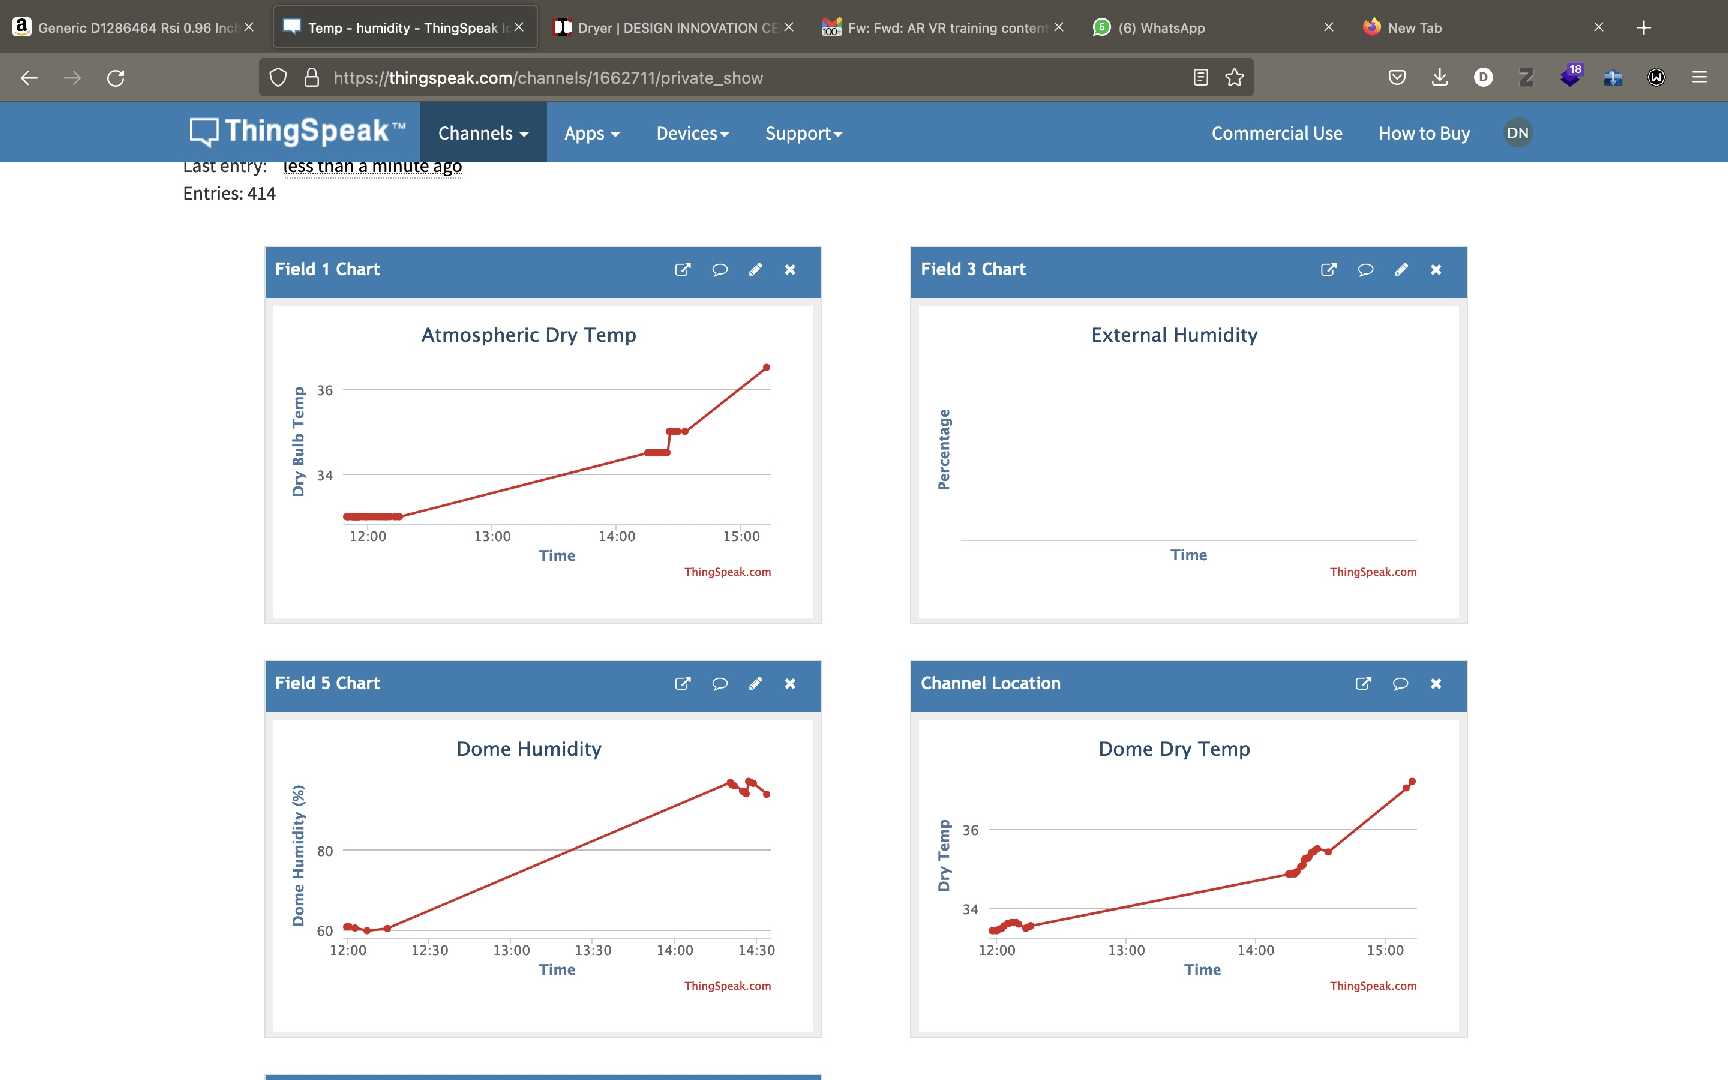
In my case I would like to display graphs on to my website so I would embed some graphs on to my html page.
This let me monitor my project in real-time from my website itself.
This will acr as a UI and will provide important information about the dome dryer.
Below is an image of my final project page where I showed some graphs so that I can see the data in real-time.
Creating a thingspeak channel
A thingspeak channel is essential for this project here are the details for a how to of a thingspeak channel.
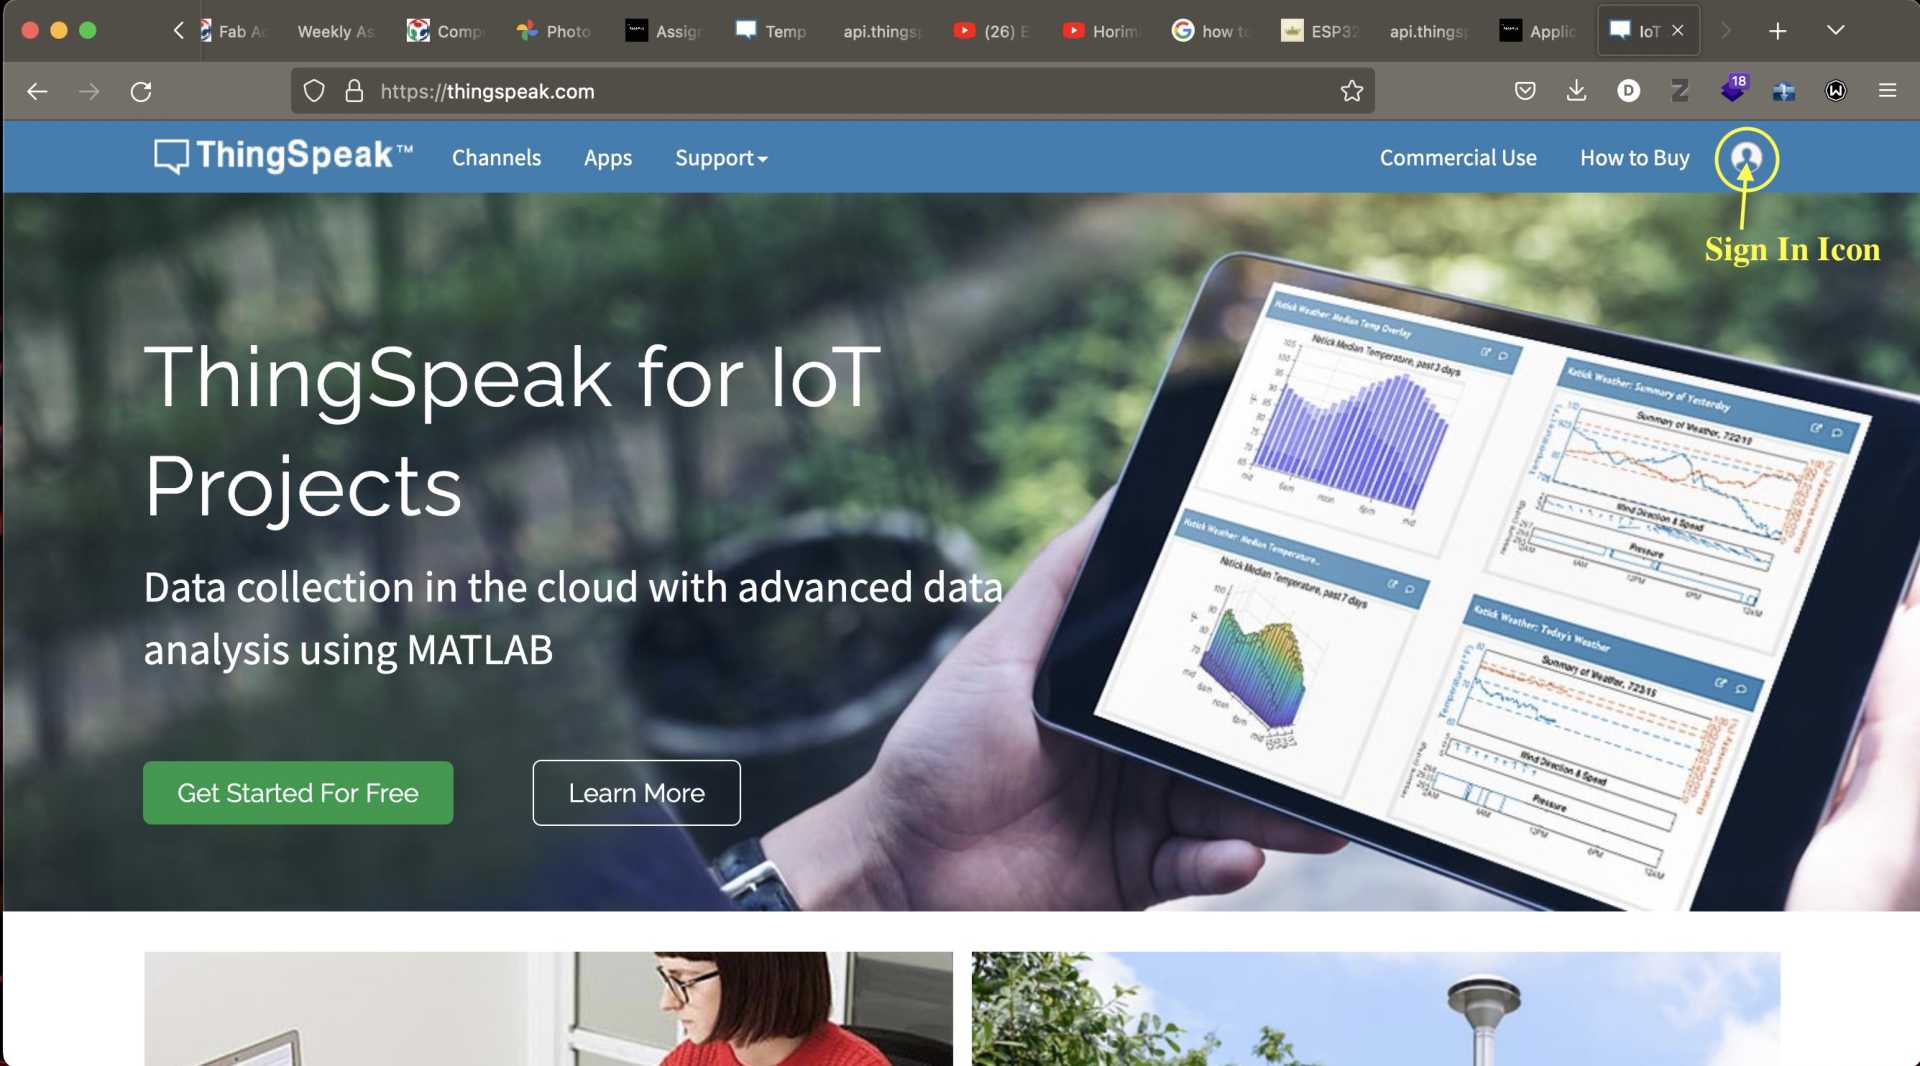
First step is to visit thingspeak.com
Then click on the sign in button
The create a mathworks account or login to the existing one.
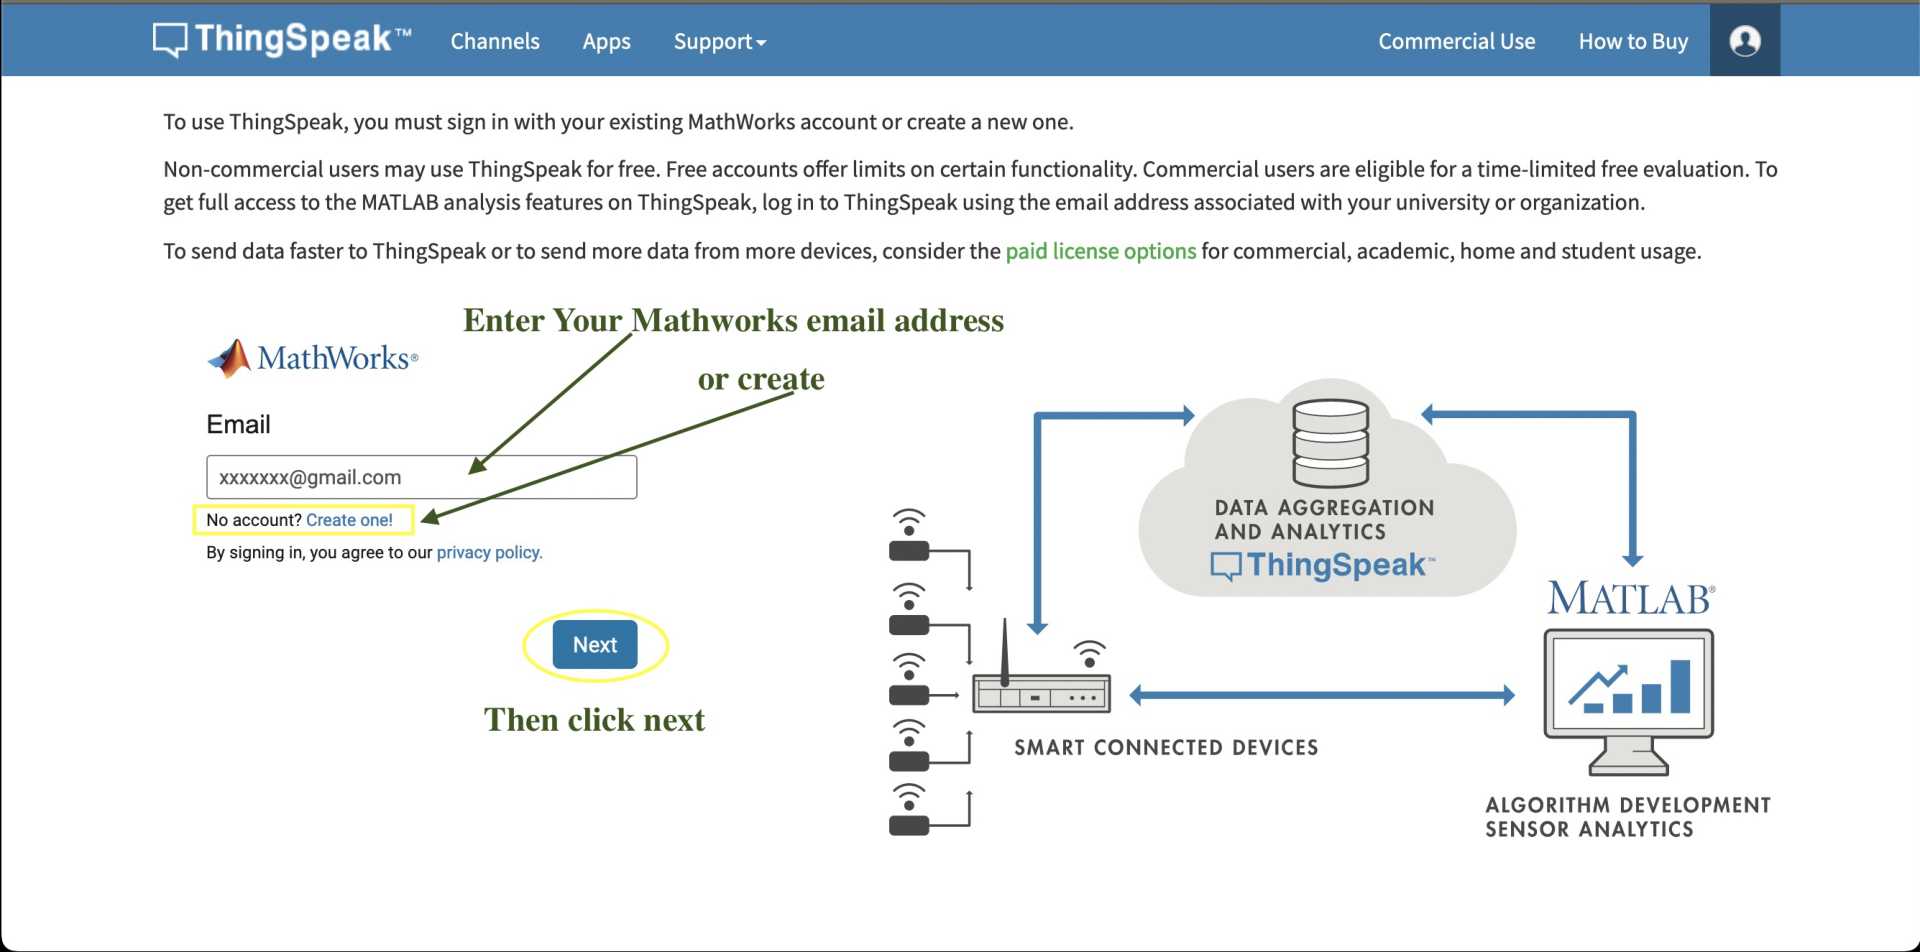
I'm assuming that we have an existing account and we have logged in.
Then a page will apear on your screen as shown below.
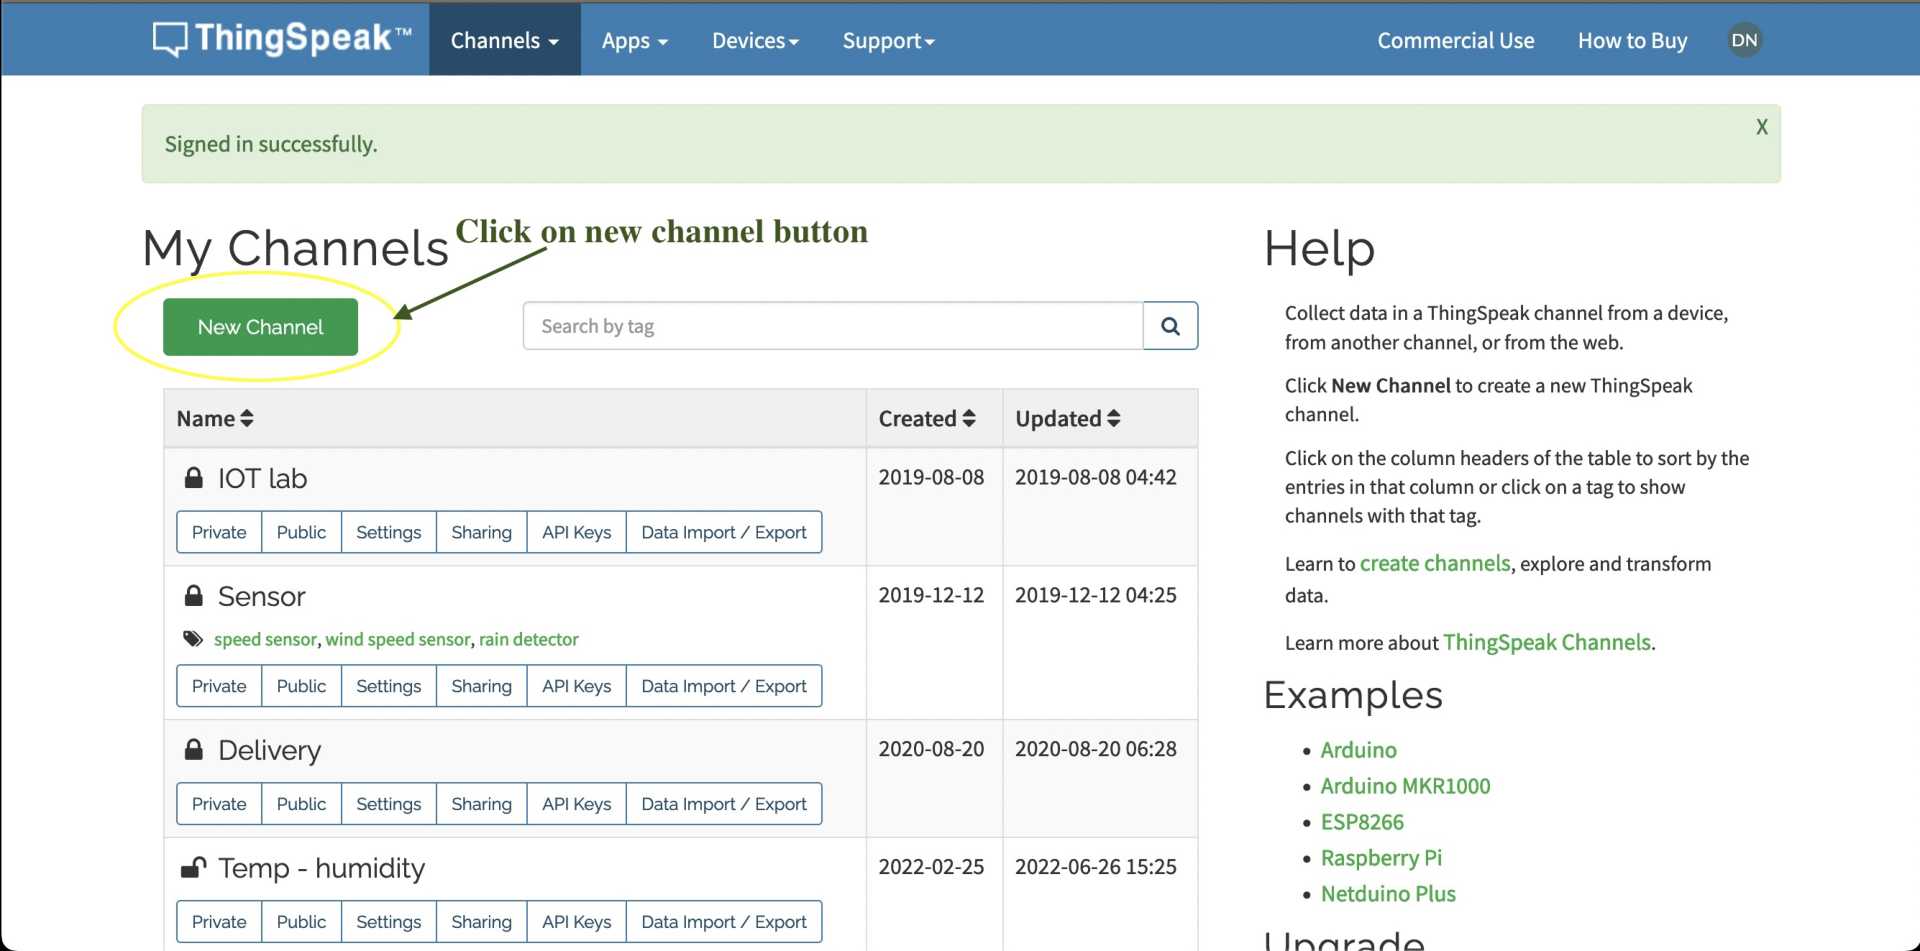
Click on "New Channel" button
Then another page will appear as shown below.
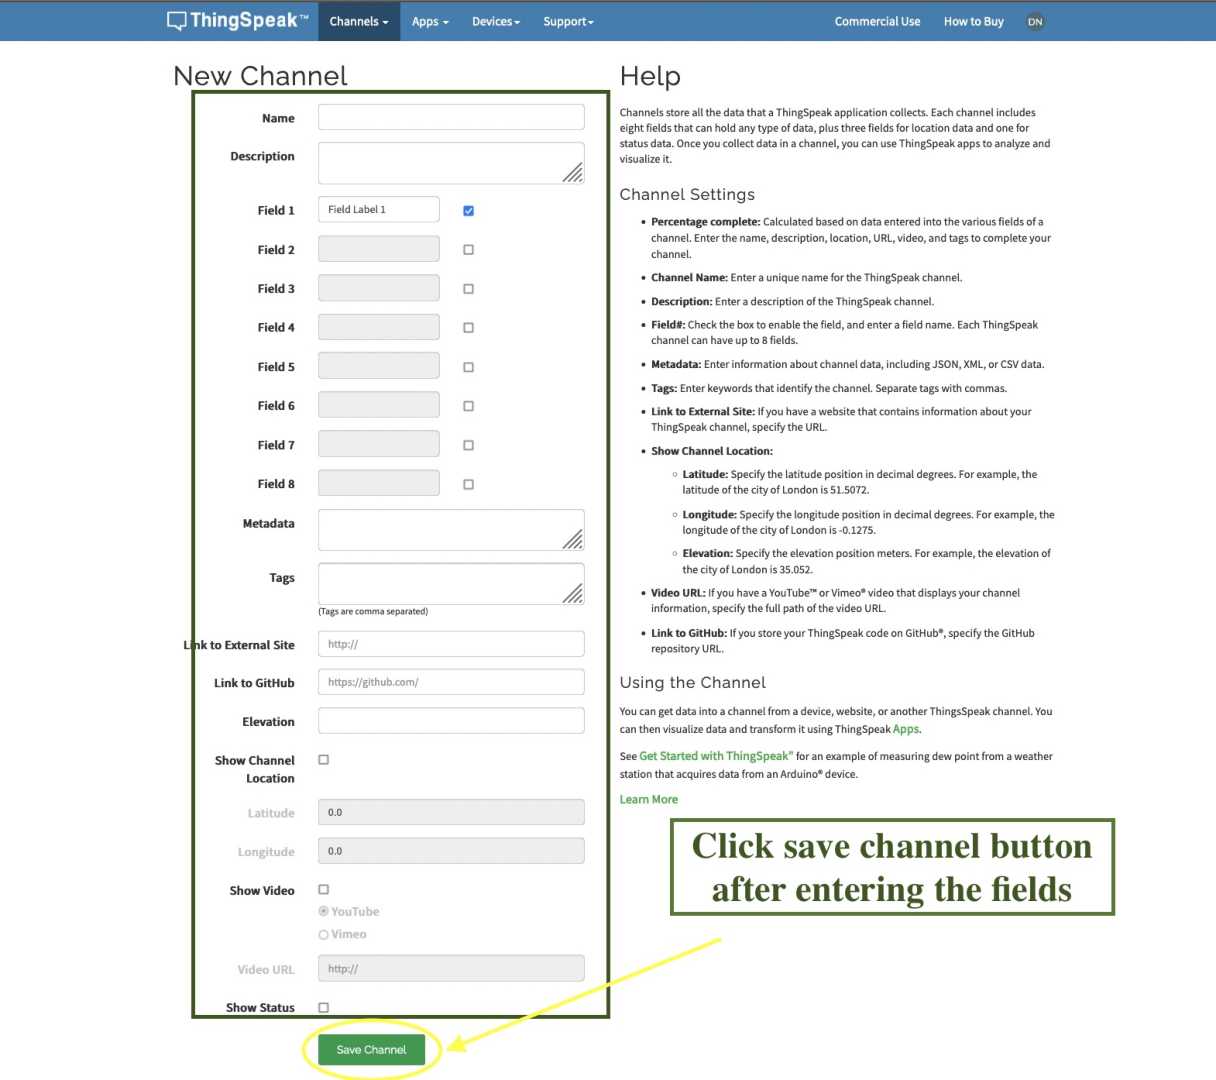
Enter the channel names and other details like descriptions, active fields needed etc.
After that Click the "Save" button
Our channel is created and it will look something like the image given below.
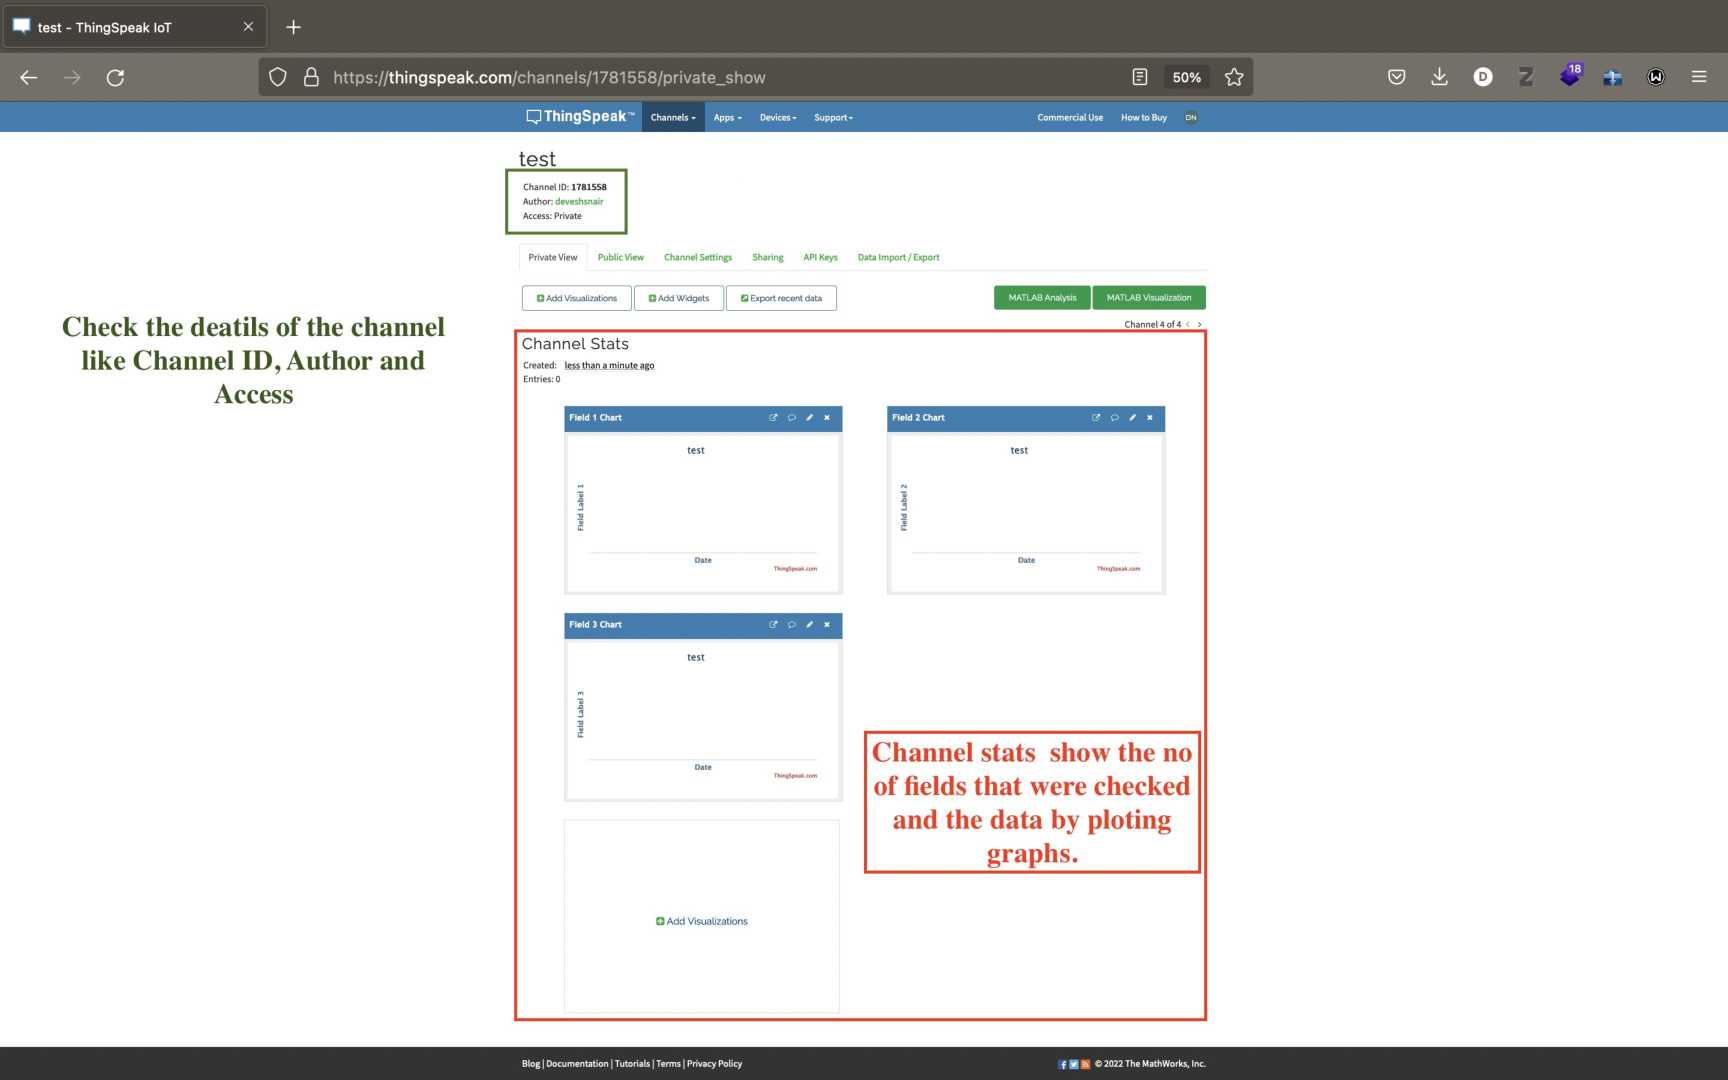
This is the channel dashboard from here you can customize your channel according to your needs.
This is the data shown in realtime on thingspeak.
Problems that I faced and some solutions.
The major problems that I faced was with interfacing my project to thingspeak
You see Thingspeak platform is easy to use but in some cases its difficult to setup. Once its setup and running we wouldn't have any problems.
First problem is an unstable internet connection. Please make sure that you have a stable internet connection for the smooth setup of thingspeak.
Then Entering the correct fields in the code.
Thingspeak can recieve data only when the IOT device has the correct credentials to its channels and fields. Make sure credentials are correct.
Delay in data transmitted and recieved. This happens after the setup of thingspeak channels and fields. Just switch to another stable internet connect.
All the fields are active but data isn't being recieved. This problem majorly is due to the account type,see thingspeak has a free tier and a premium tier the free tier supports on upto 4 fields of data i.e we can only show 4 graphs in our channel and
The premium tier support upto 8 fields of data that means upto 8 graphs can be displayed.
Therefore I would recommend you to check the account type you are using.
Video
Video of testing the components with the code.
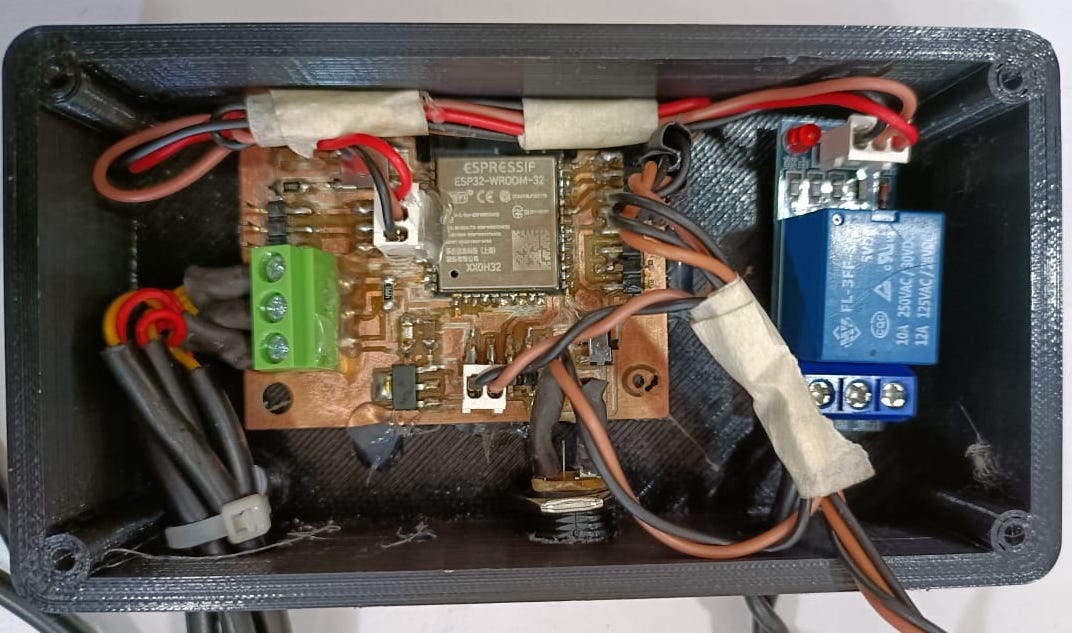
The board was in this packaging as shown below.
Do note that the internet speed was low at our area but the project was working.
Another video of me showing the change in temperature of the exteral sensor.
Original Design Files
I'm linking the code used for this project here
Group Assignment
For the group assignment we had to compare different methods of app building like MIT Appinventor, Processing etc. Detailed infromation is updated to our group page do check it out.
I will be leaving a link to the page over here.

Fabspace by Devesh S Nair is licensed under a Creative Commons Attribution-NonCommercial 4.0 International License.