General objective (group assignment):
- Probe an input device(s)'s analog and digital signals
- Document your work to the group work page and reflect on your individual page what you learned
Machine used
Tektronix TBS 1052B-EDU Digital Oscilloscope
Development
For this assignment we measured the signals from three input devices: a button, a Hall effect sensor and a potentiometer to be able to analyze both analog and digital signals. We connected the oscilloscope terminals to the input devices cables using a breadboard and used an Atmega328p board as a controller.
BUTTON
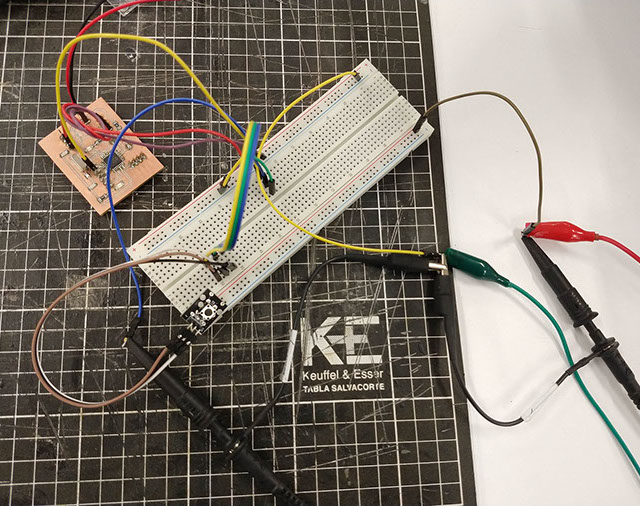
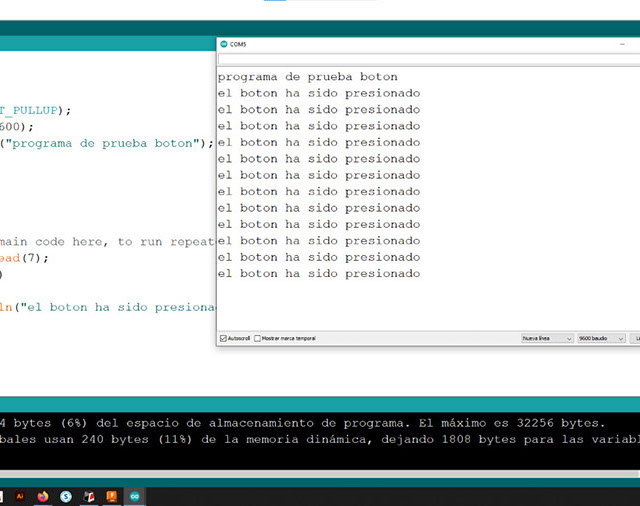
For the first test we use a code that prints a legend on the serial monitor each time the button is pressed.
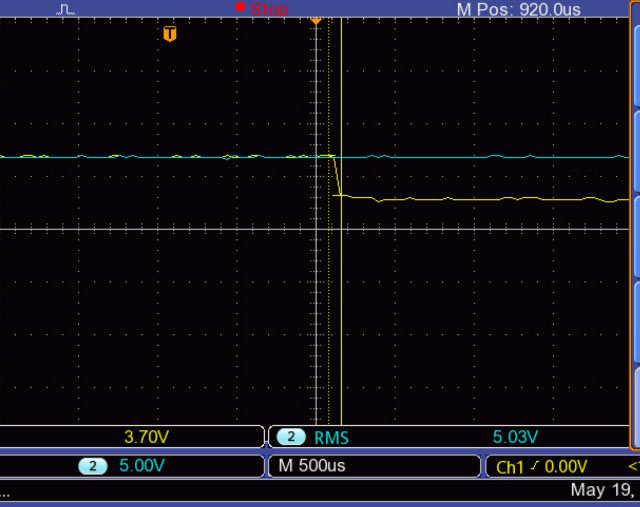
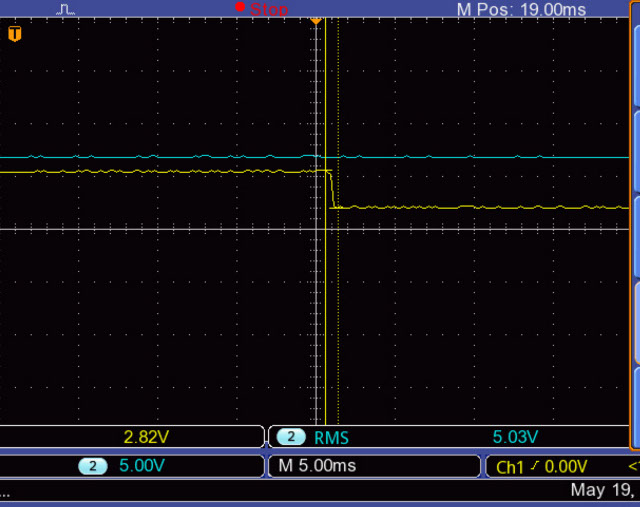
On the oscilloscope the graph shows a voltage drop from 5v to 3.7v when the button is pressed. The vertical lines represent specific points on the timeline, cursor 1 is on the left and cursor 2 is on the right, it takes 100 microseconds for a button to go from boolean state 1 (On) to state 0 ( Off)
HALF EFFECT SENSOR
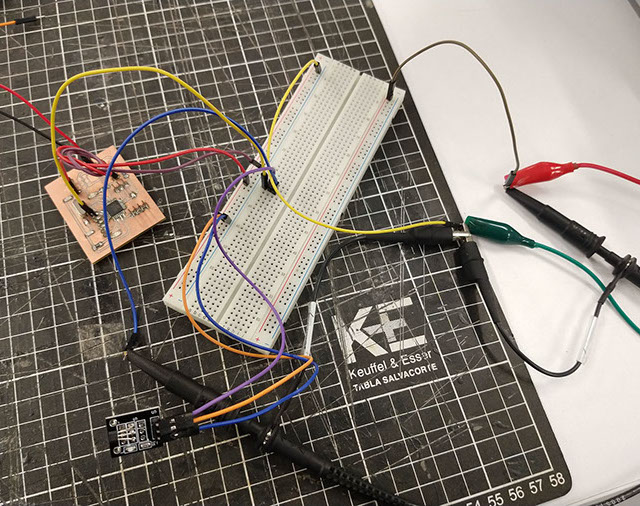
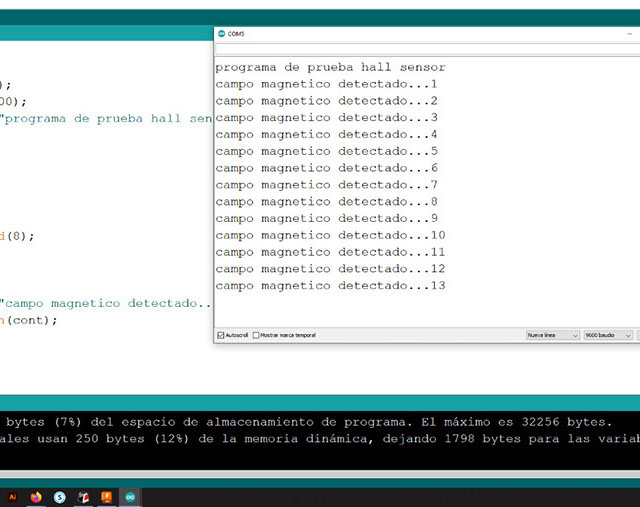
The Hall effect sensor oscilloscope graph shows a response time of 800 microseconds and makes a voltage drop of 3.6v between the state 1 and the state 2.
On the oscilloscope the graph shows a voltage drop from 5v to 3.7v when the button is pressed. The vertical lines represent specific points on the timeline, cursor 1 is on the left and cursor 2 is on the right, it takes 100 microseconds for a button to go from boolean state 1 (On) to state 0 ( Off)
POTENTIOMETER
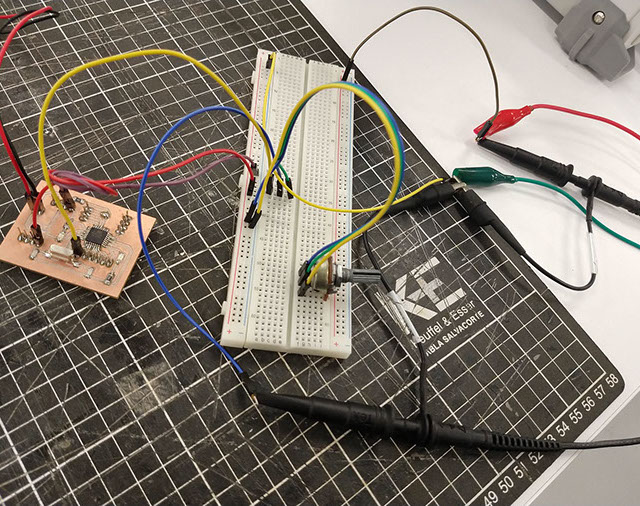
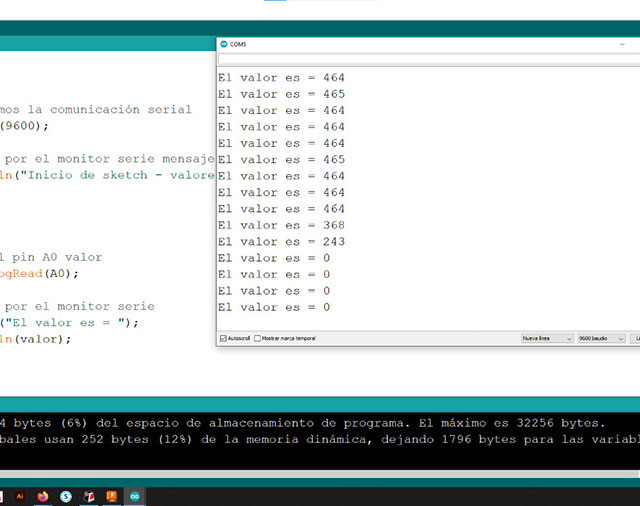
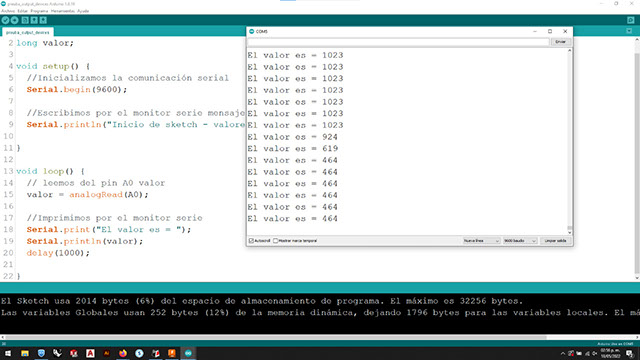
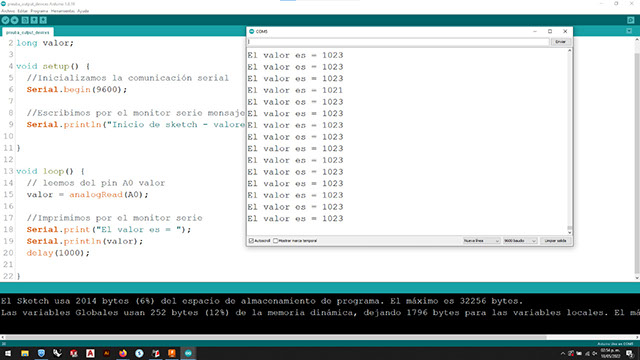
The last test was using a potentiometer, with this code the controller takes the value of the analog input A0, stores it in the variable Val and then prints it on the serial monitor. It is interesting what happens here since the analog input establishes a range of values from 0 to 1023 (the complete turn of the knob is divided by 1024 positions).
In the oscilloscope, the graph starts at 25.2 mV (initial position of the potentiometer, value 0 in the serial monitor) and gradually increases until it reaches 5.22 V, so we could say that each position in this potentiometer is worth 5 mV (5.2 V / 1024).
