Input Devices Week #11
Introduction
This week we have two main assignments:
- Measure something: add a sensor to a microcontroller board that you have designed and read it
- group assignment: probe an input device's analog levels and digital signals
Intput Device: Phototransistor
- I decided to work with the phototransistor as an input device for this week's assignment, as I'm considering to calibrate it and use it as a color sensor in my final project.
- A phototransistor is a device that converts light energy into current flowing between its emitter and collector. The varying levels of light shinning on the sensor alters the current flowing.
- For the purpose of this assignment, I intended to use a phototransistor that operates within the visible light spectrum, however, the available phototransistor in the inventory operates in the infrared range.
- I used the Everlight PT15-21B /TR8 phototransistor. It operates in the infrared range of the electromagnetic spercturm, between a wavelength of 730 up to 1100 nm.
- To use the phototransistor as a color sensor, I needed to add an LED to my board to shine light on the desired object, the reflected light over that object hits the phototransistor, with varying wavelengths based on the color of the object.
-
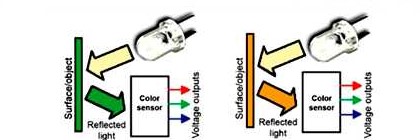
- So, I combined the hello light board from the input week, and the hello RGB board from the output devices week, in one board.
- I used an RGB LED in this board, which I described fully in the output devices week.
- I used Eagle to design my board using Attiny 45 as an MCU. I added all the components from the fab eagle library, including the phototransistor and the RGB LED
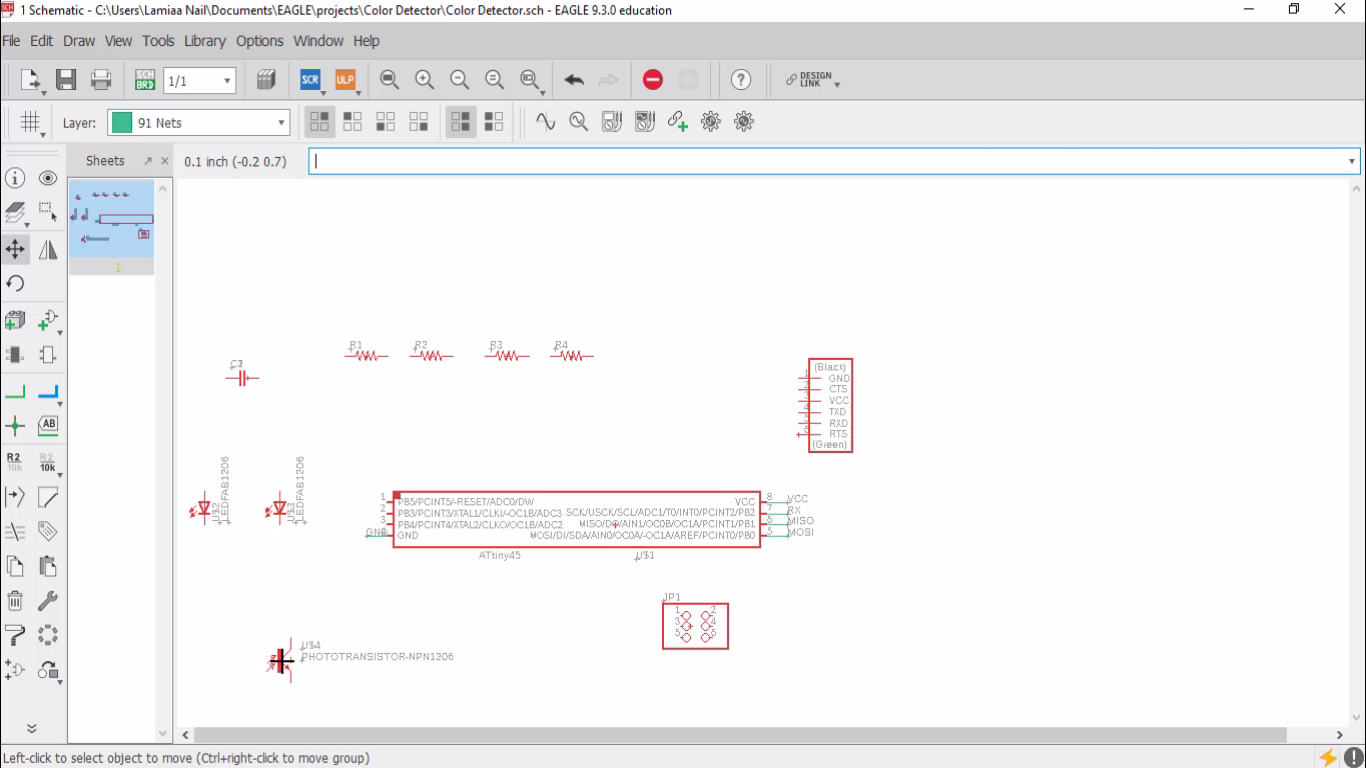
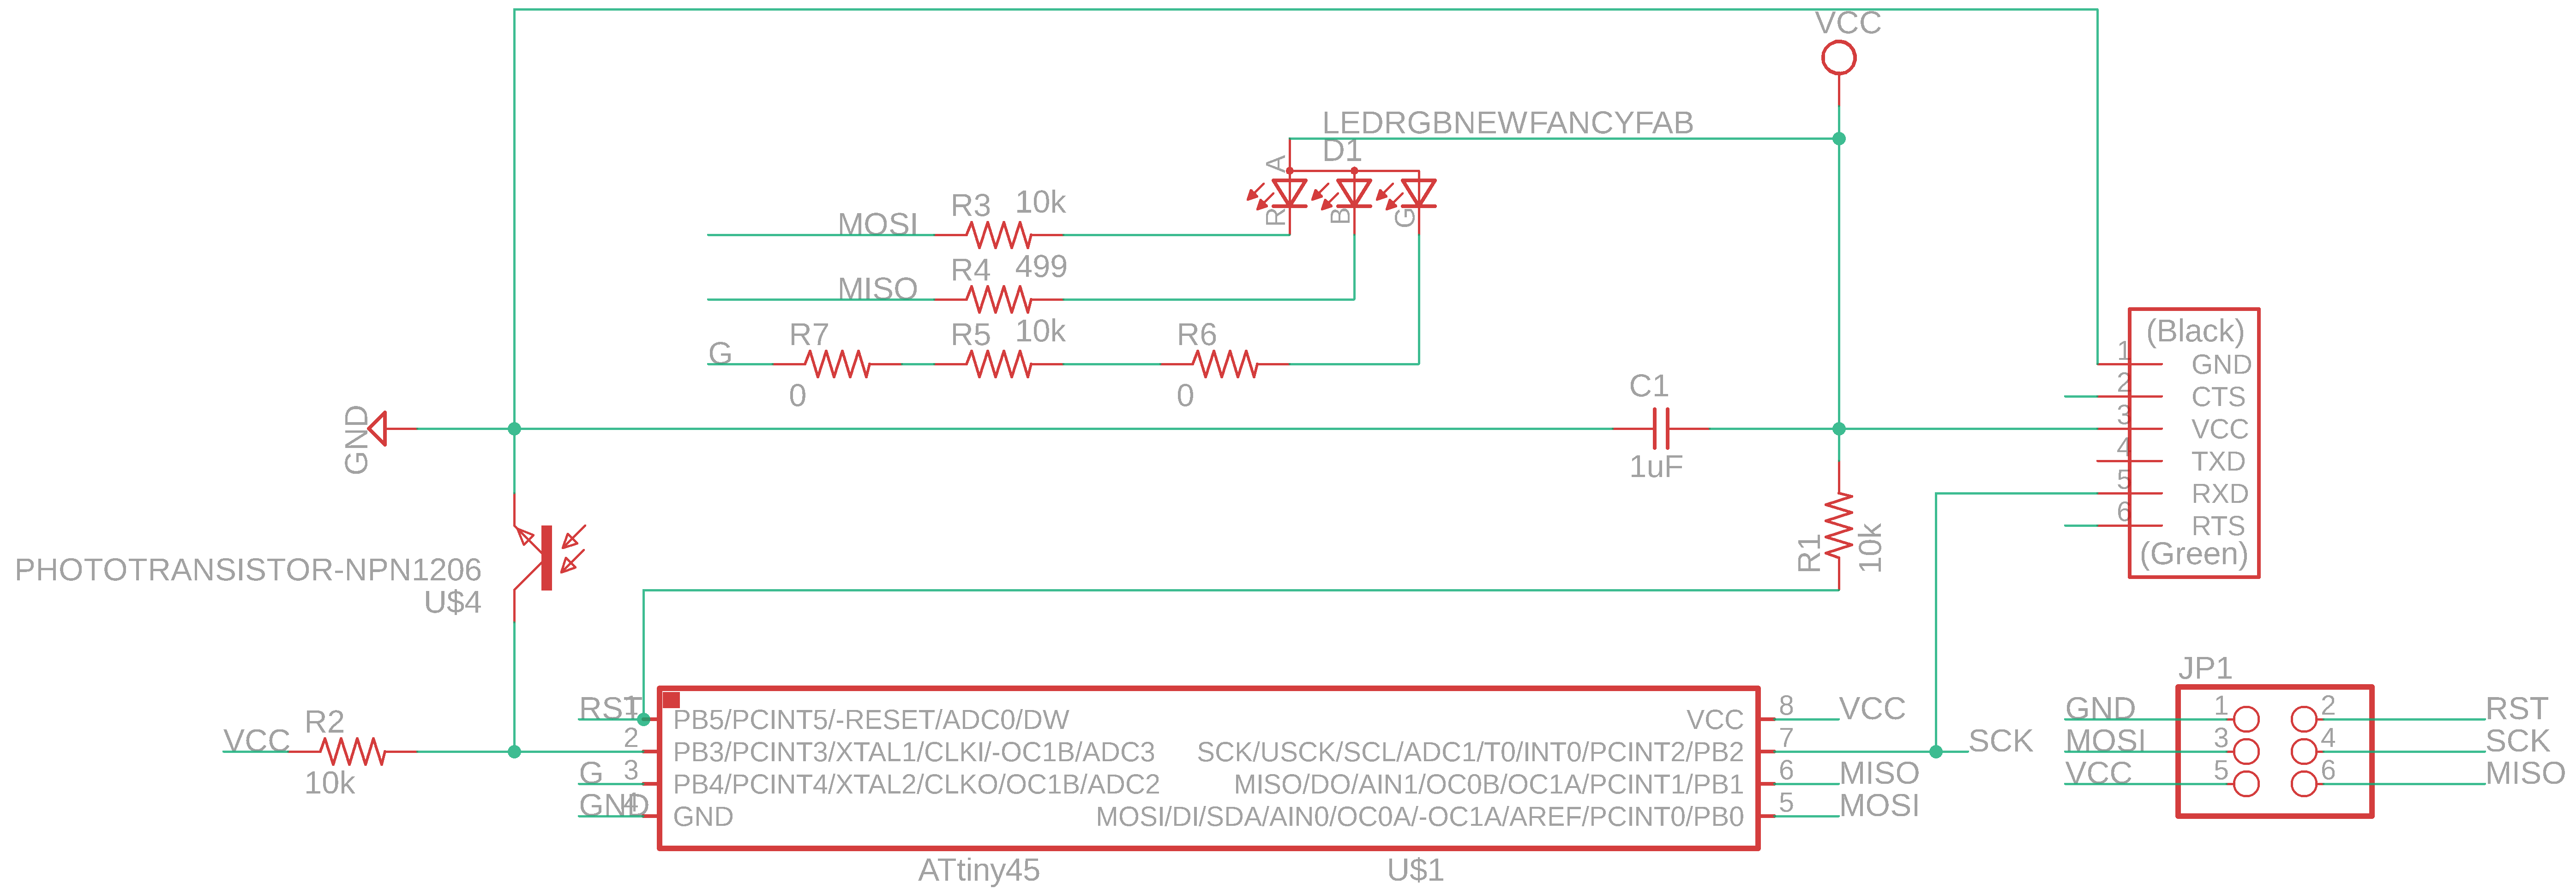
- Connected all the components and produced the final schematic
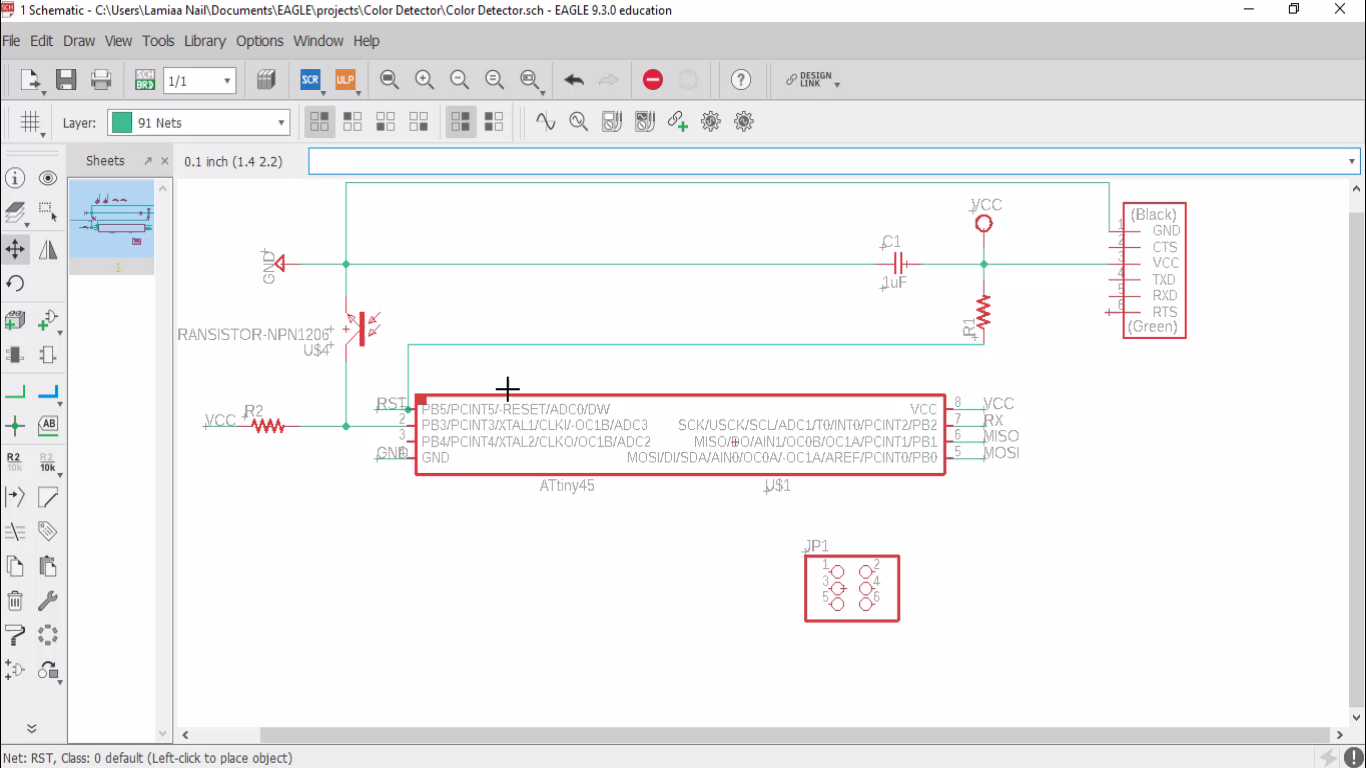
- Then, I switched to the board view and started to put all the components in their position on the board.
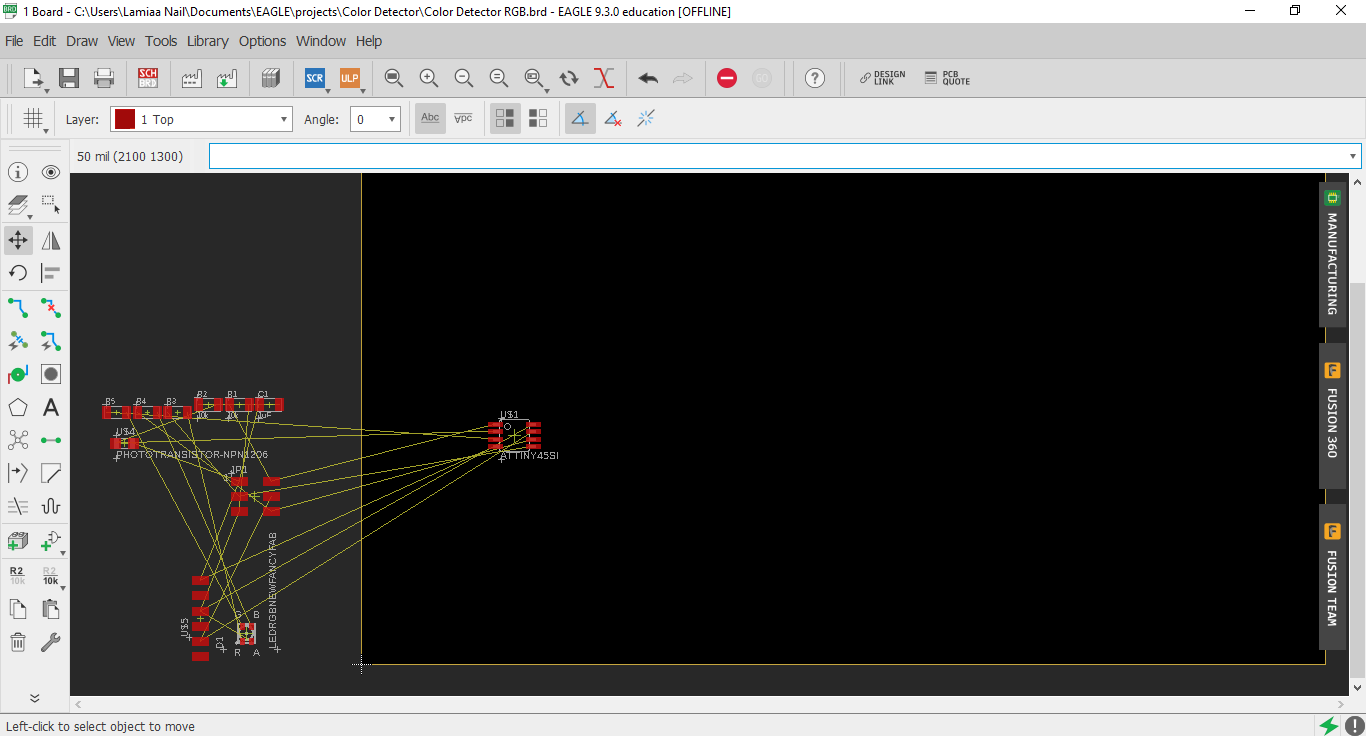
- I routed all the components, and produced the final board. I exported two images for my board the traces and the frame (linked below), the detailed process for exporting is explained in detail in the electronics design week.
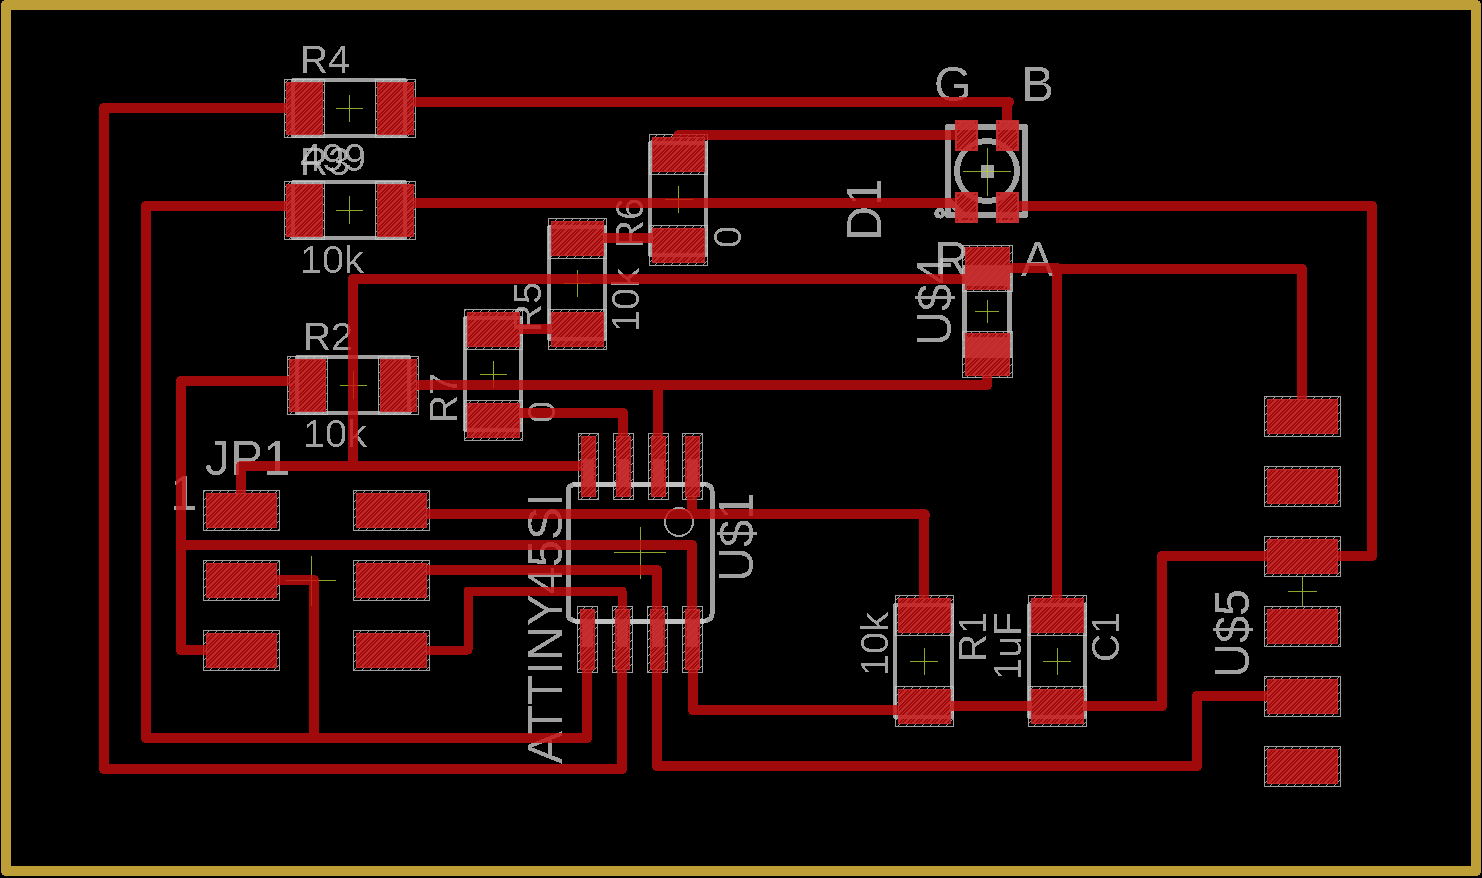
- Now the board is ready for production!
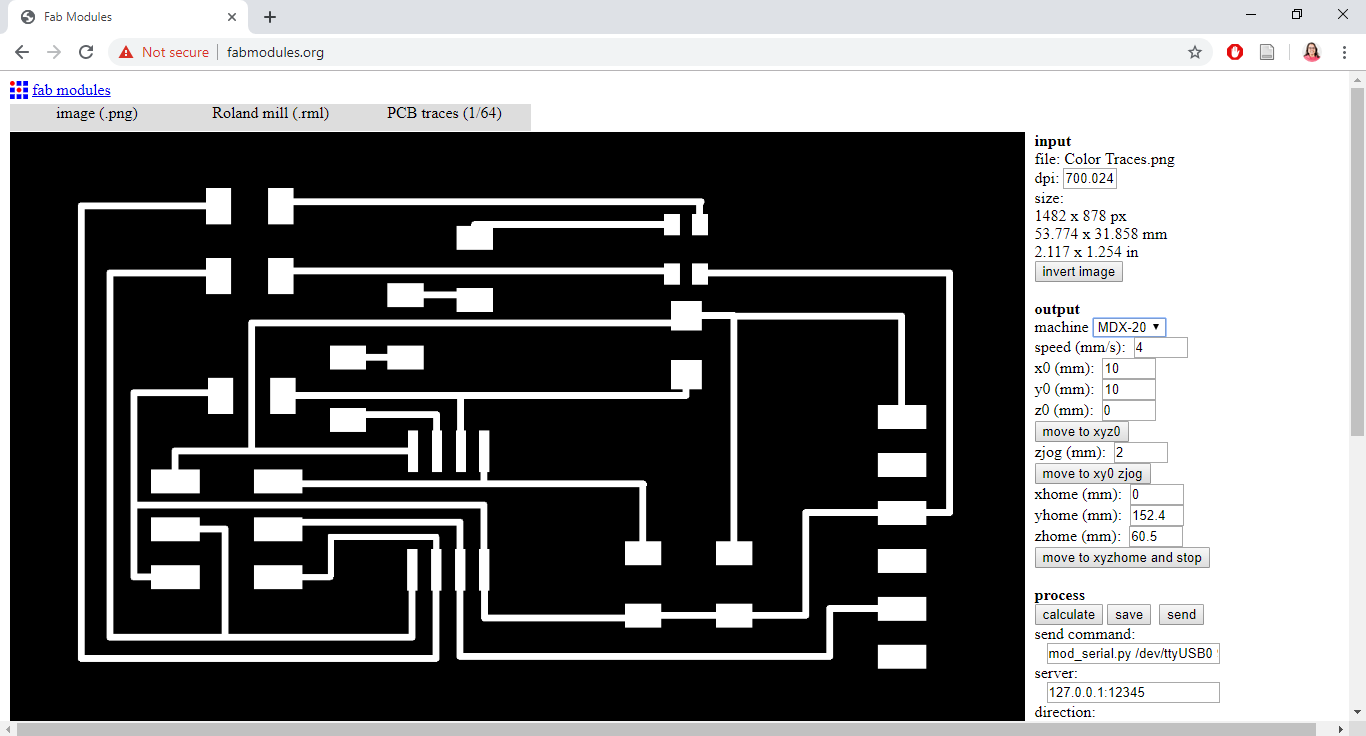
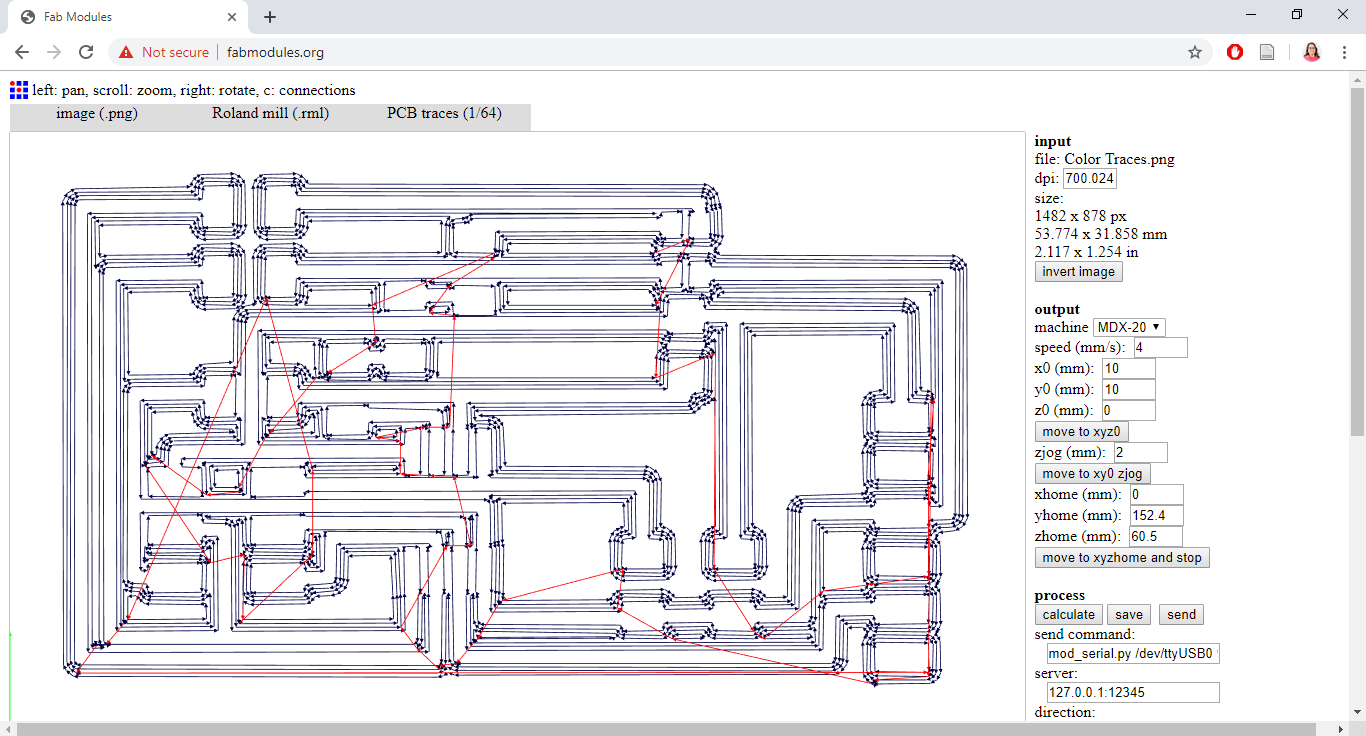
- First I imported the traces image to fab modules, chose the machine and chose the process of "traces" using the tool bit with size (1/64)
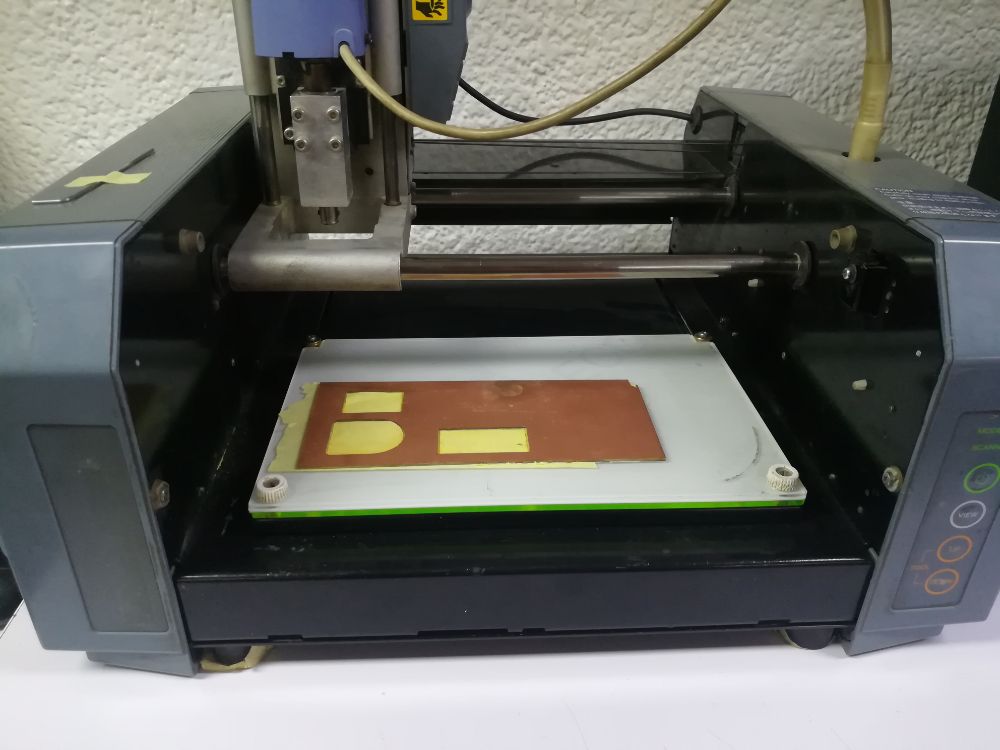
- Then, calculated the tool path and sent it to the Modela to excute it.
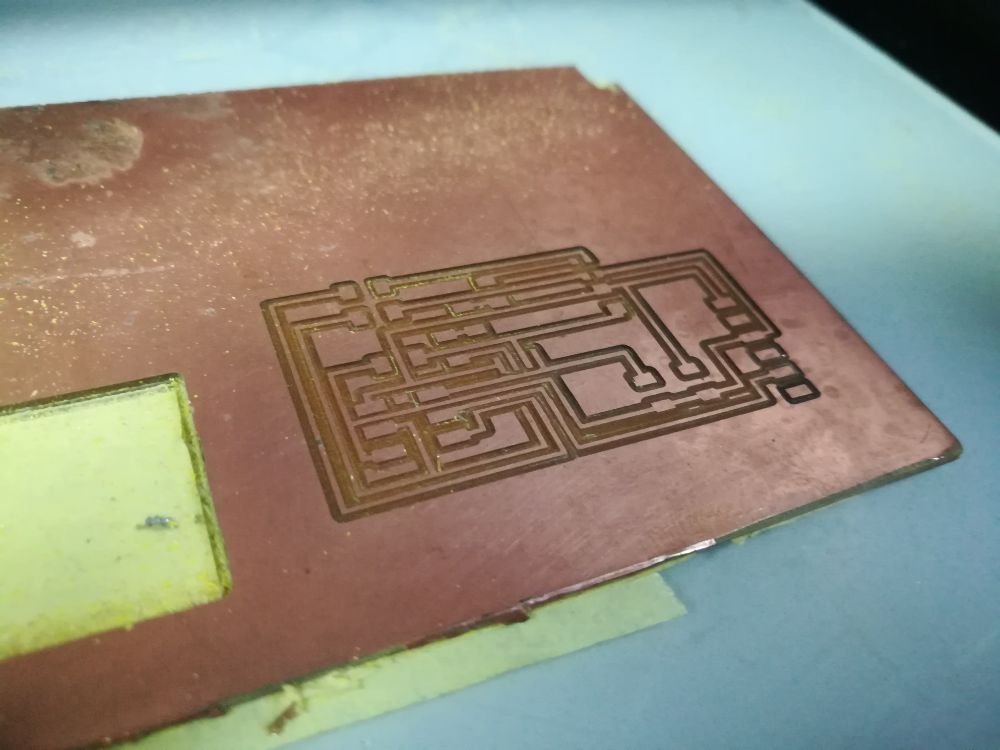
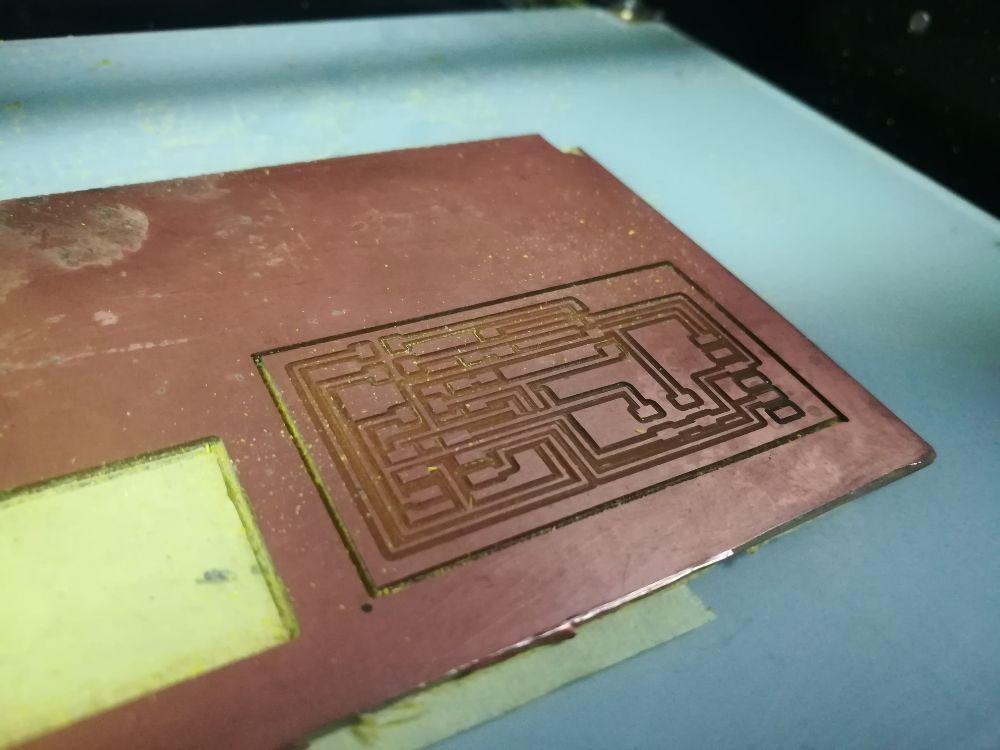
- The end result:
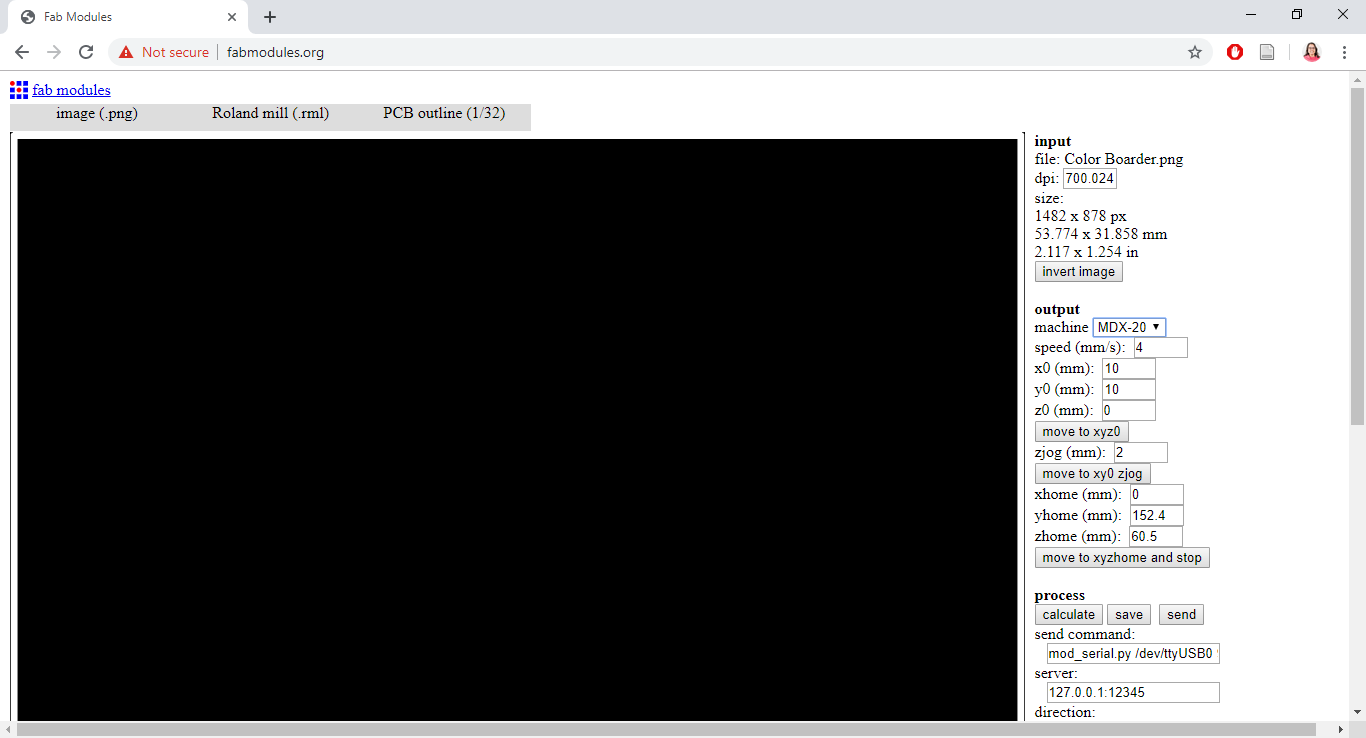
- Afterwards, I imported the frame image to cut the board from copper plate, chose the machine and chose the process as outline with a bit with the size of (1/32).
- Afterwards, I calculated the tool path and sent it to the machine to cut the board.
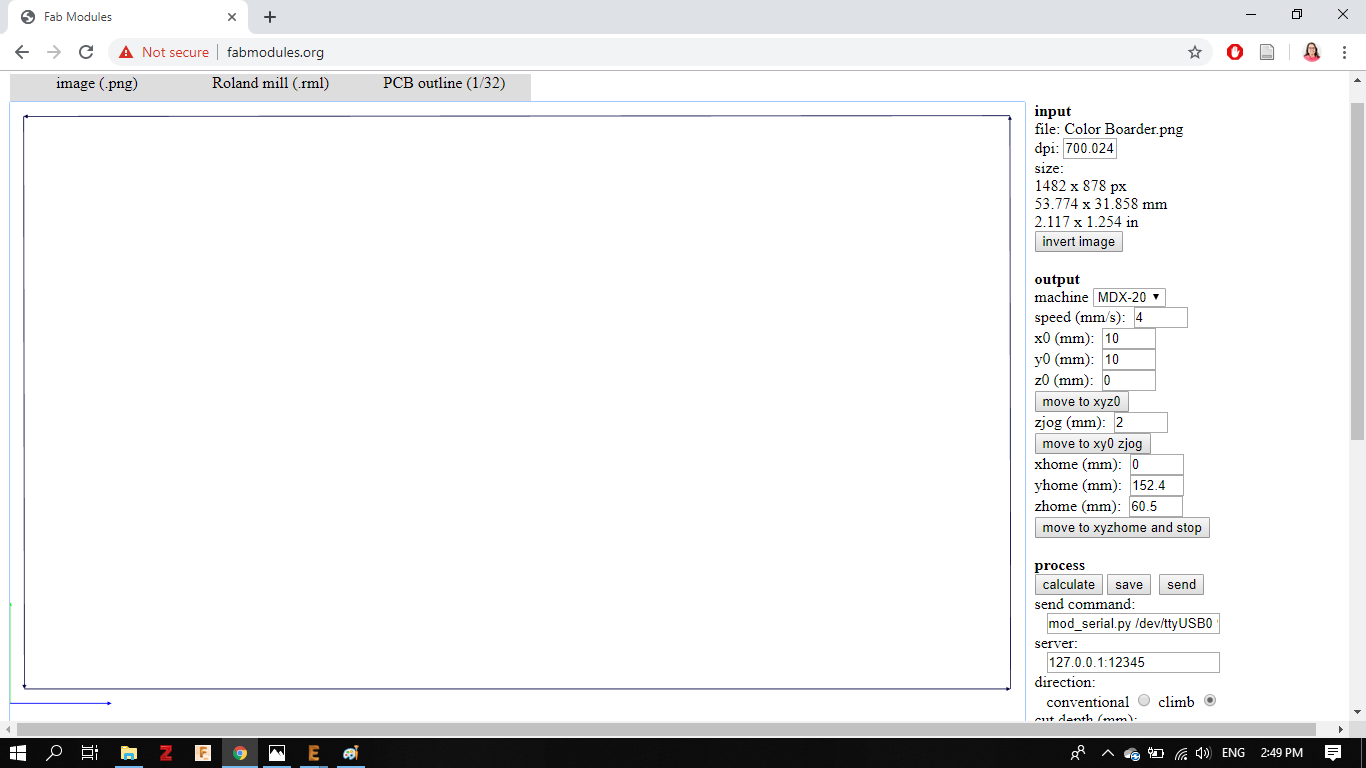
- The end result:
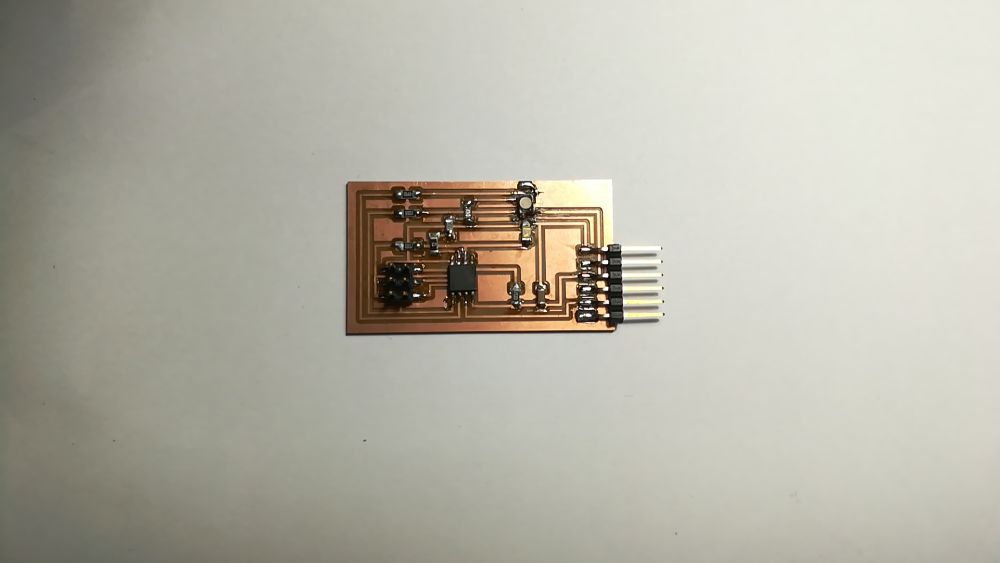
- I collected the needed components from the fab inventory and soldered the board.
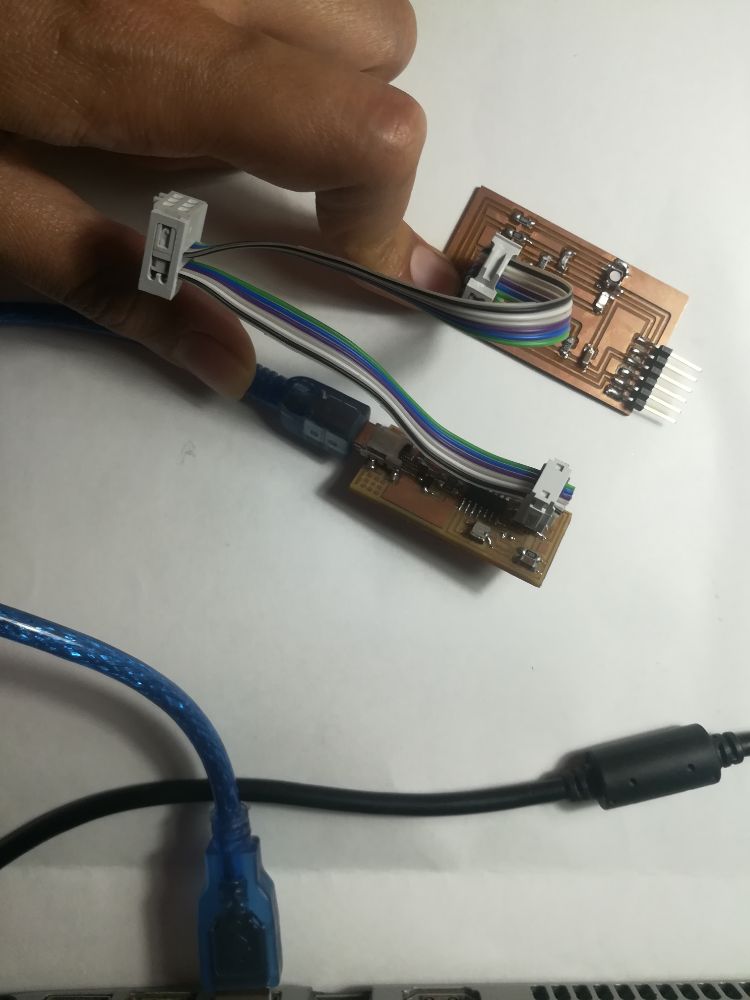
- Now the board is ready to be programmed. I connected the board with the FABISP and hooked it to my computer.
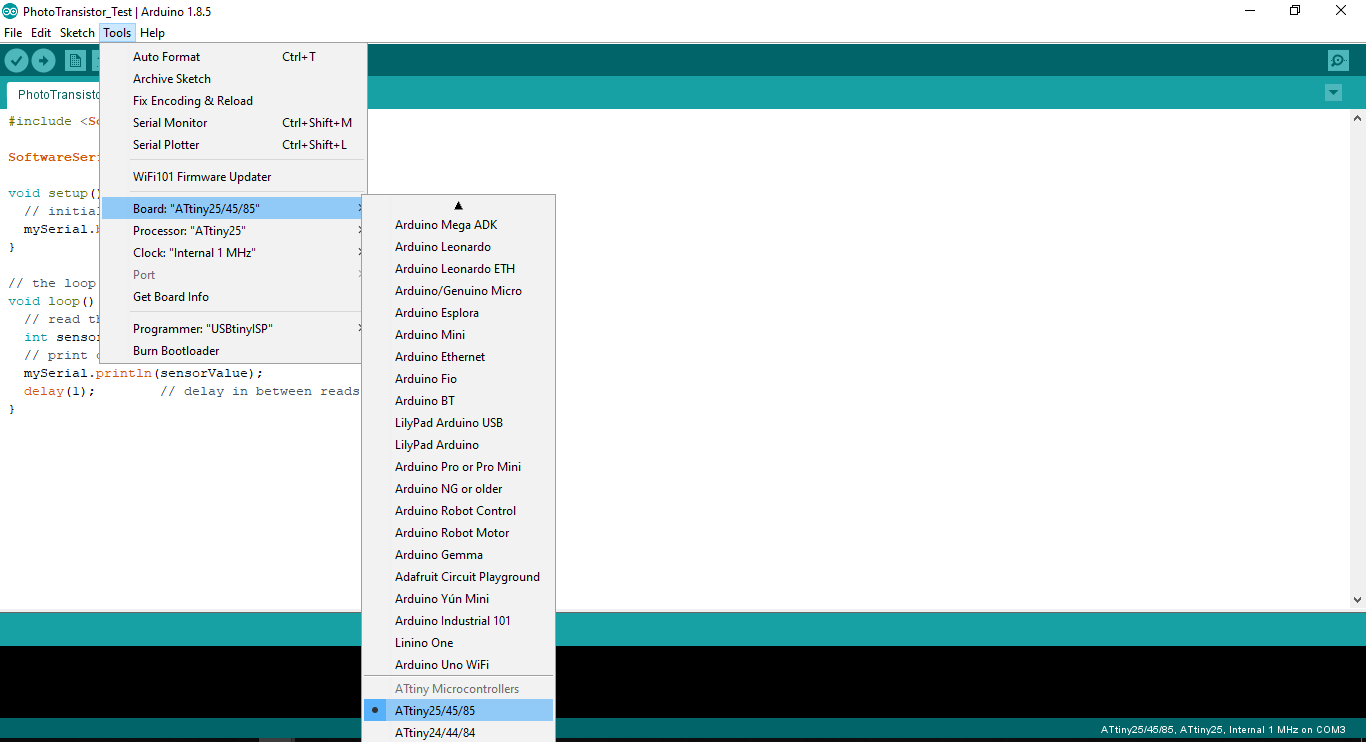
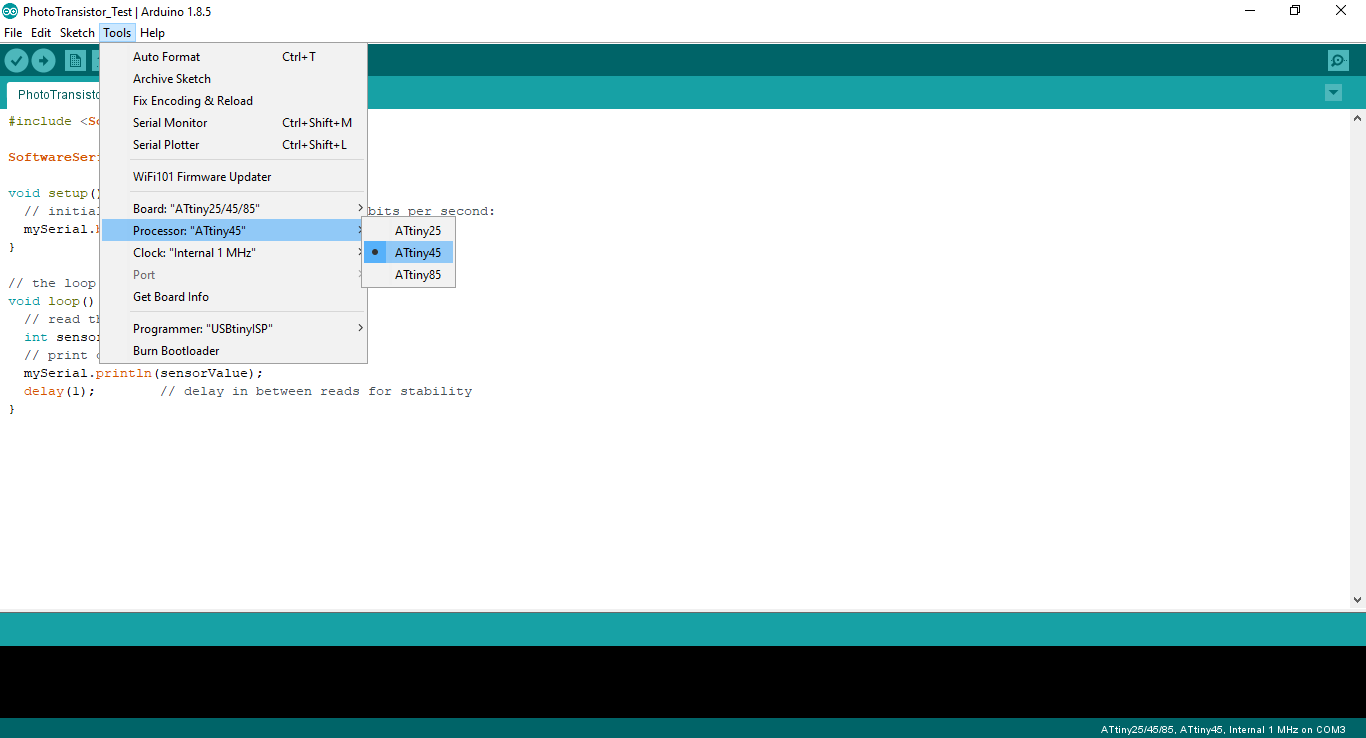
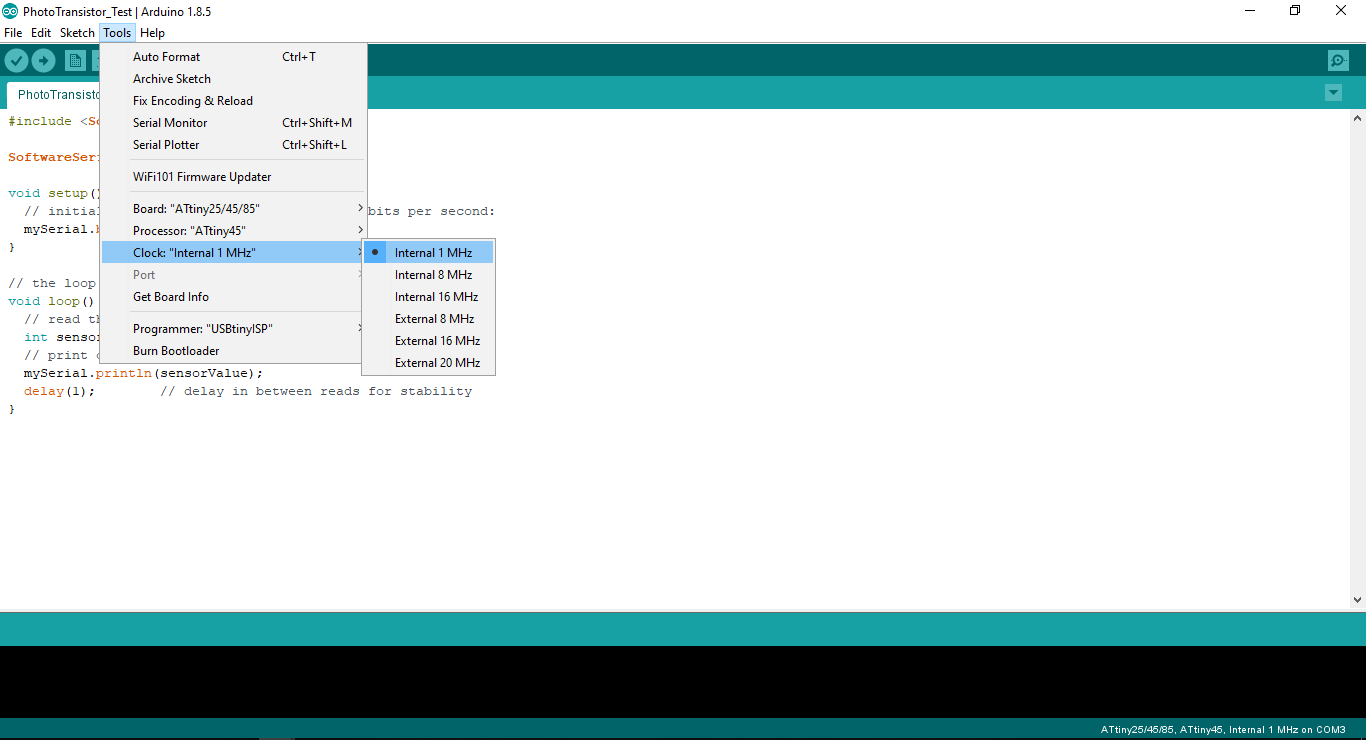
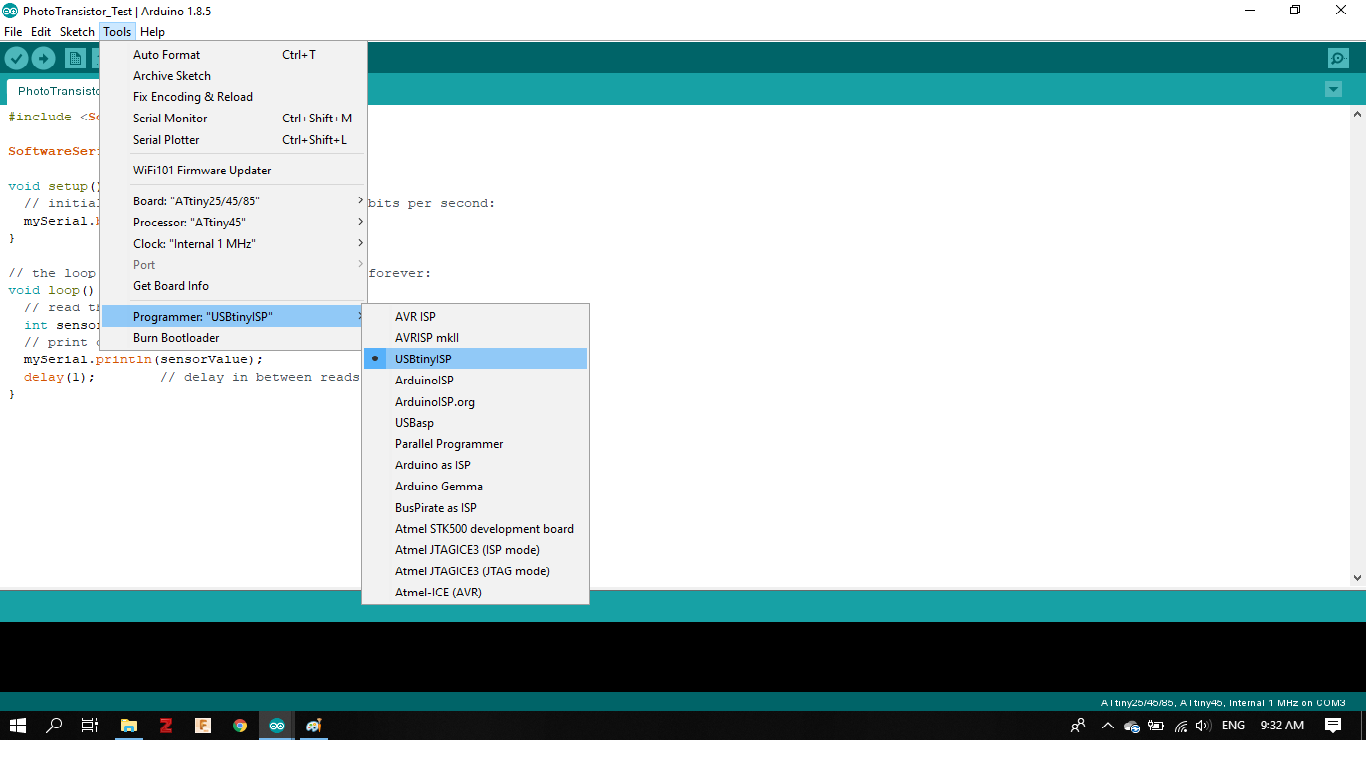
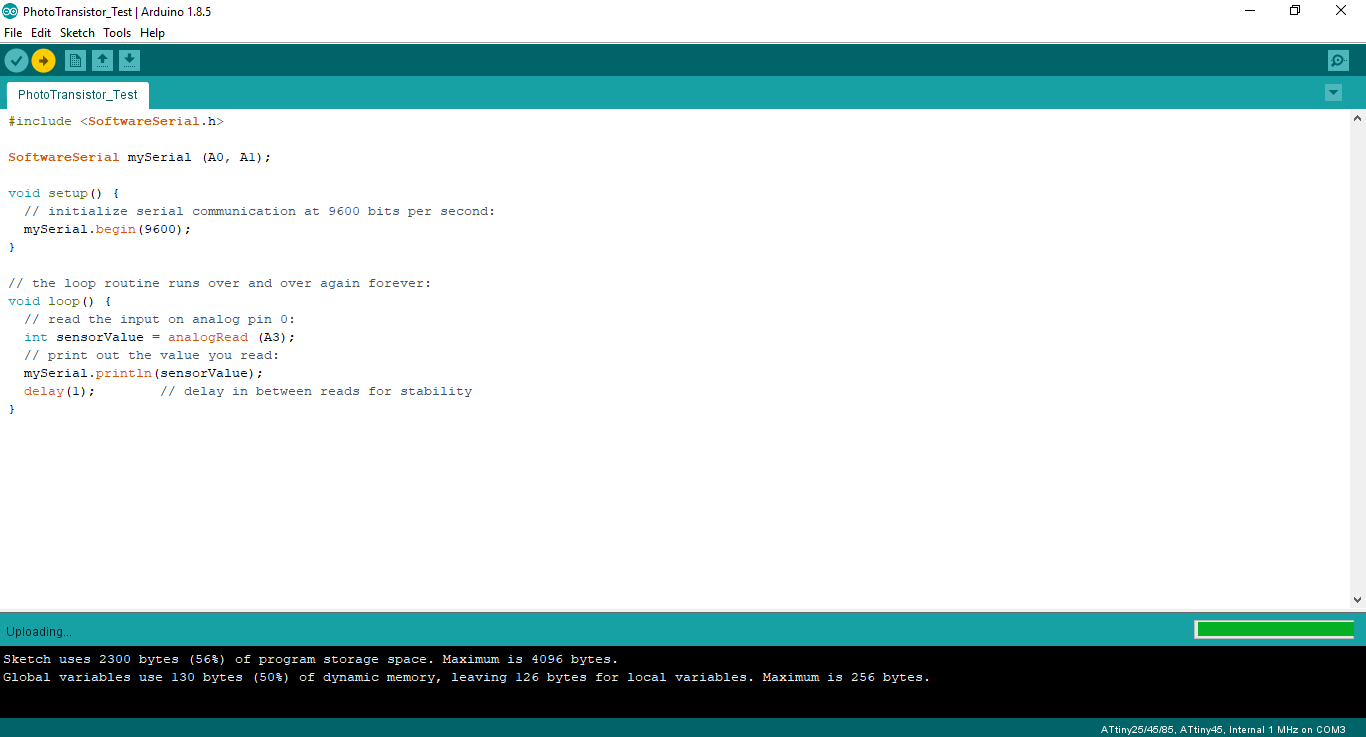
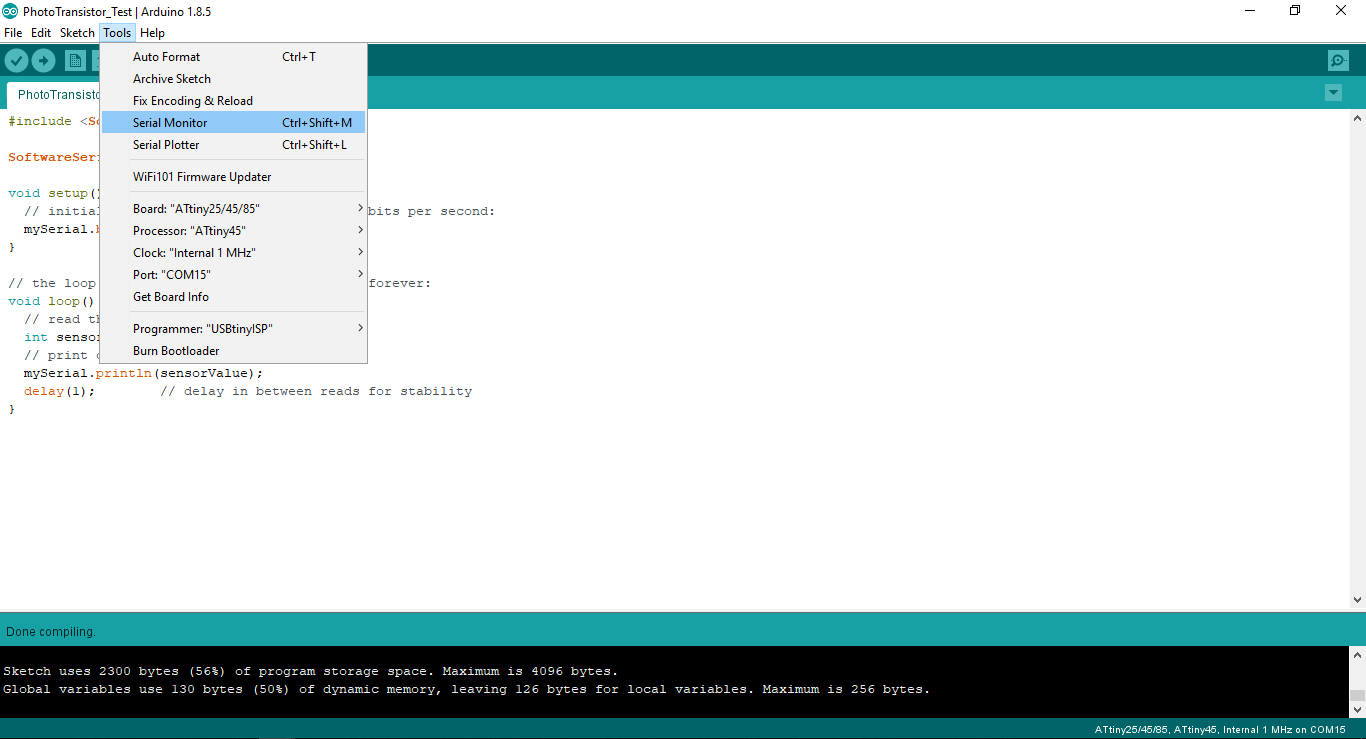
- In the Arduino IDE, I needed to choose the board and the processor as Attiny 45, and change the clock to the internal one at 1 MHz, and finally choose the programmer as USBtiny ISP.
Experiment 1: Phototransistor
Experiment 2: Color Sensor
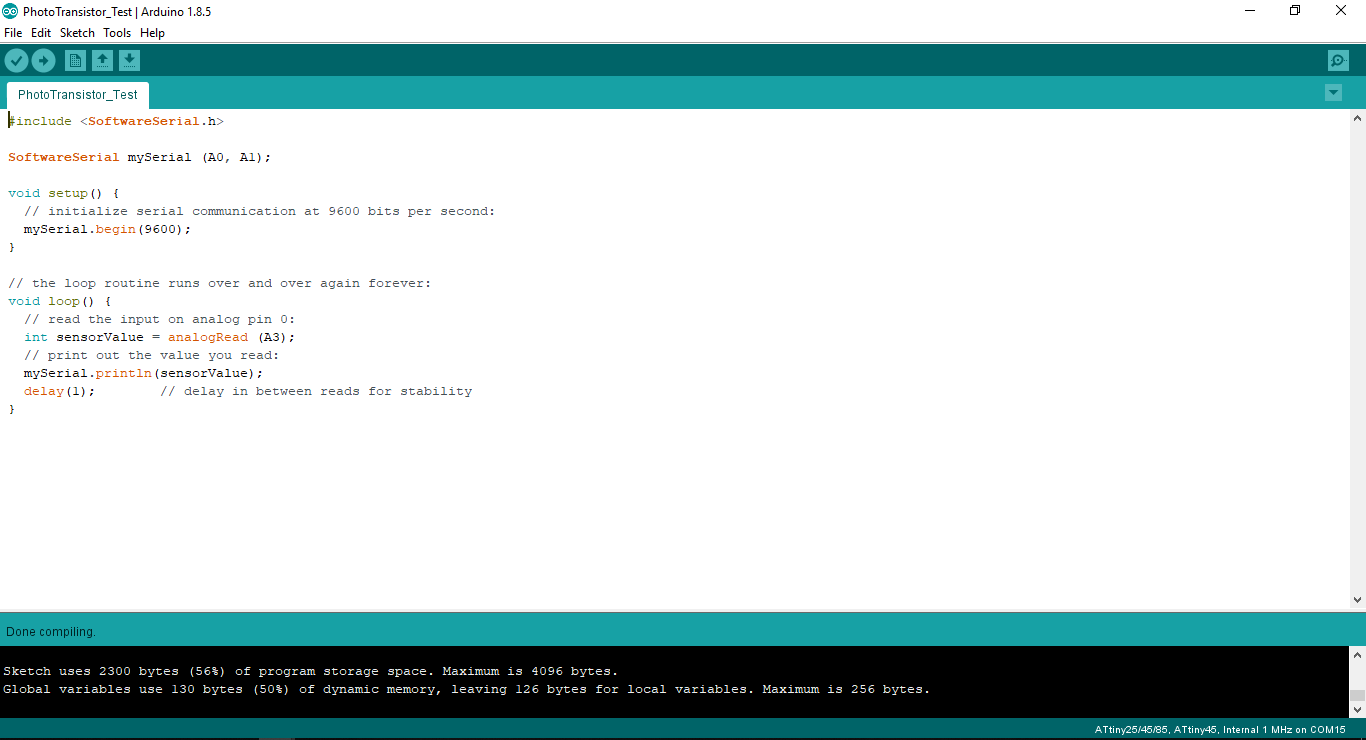
- Now, I needed to light the RGB LED, to shine white light on cards with different colors and output the readings on the serial plotter
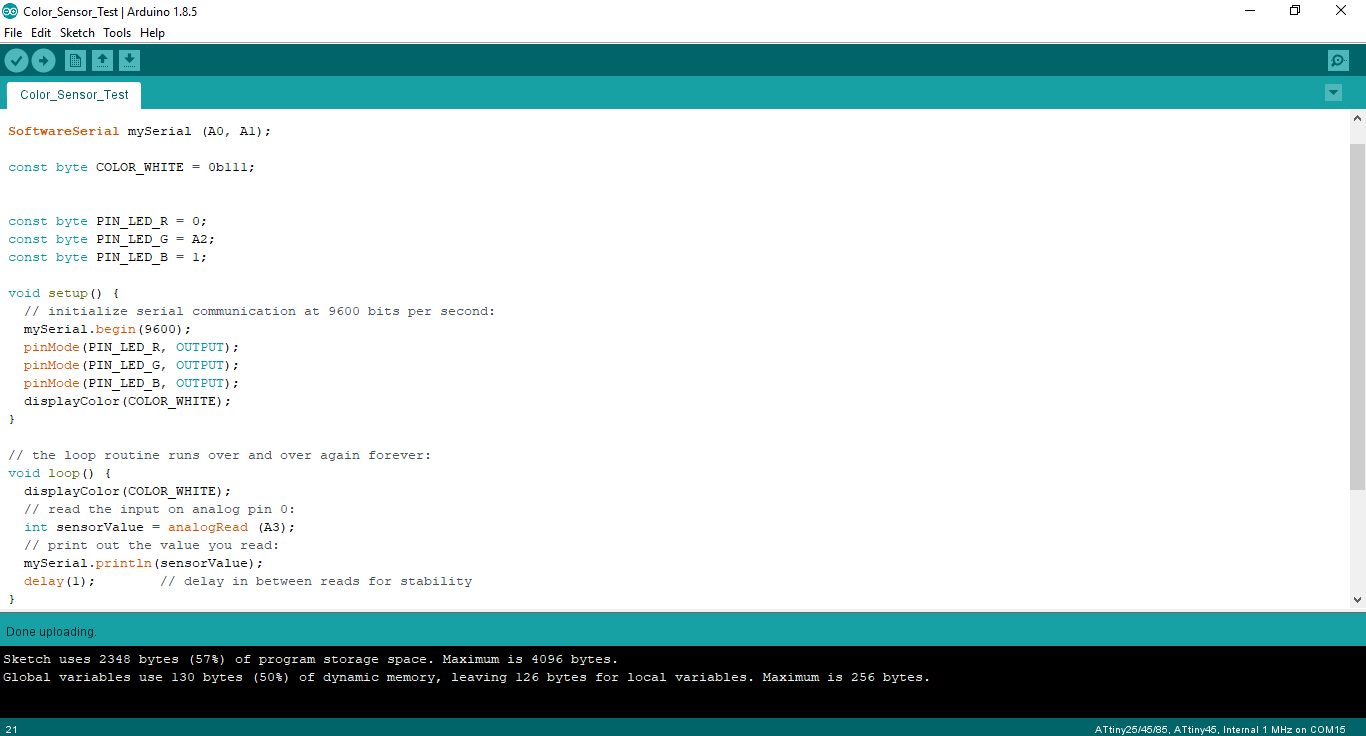
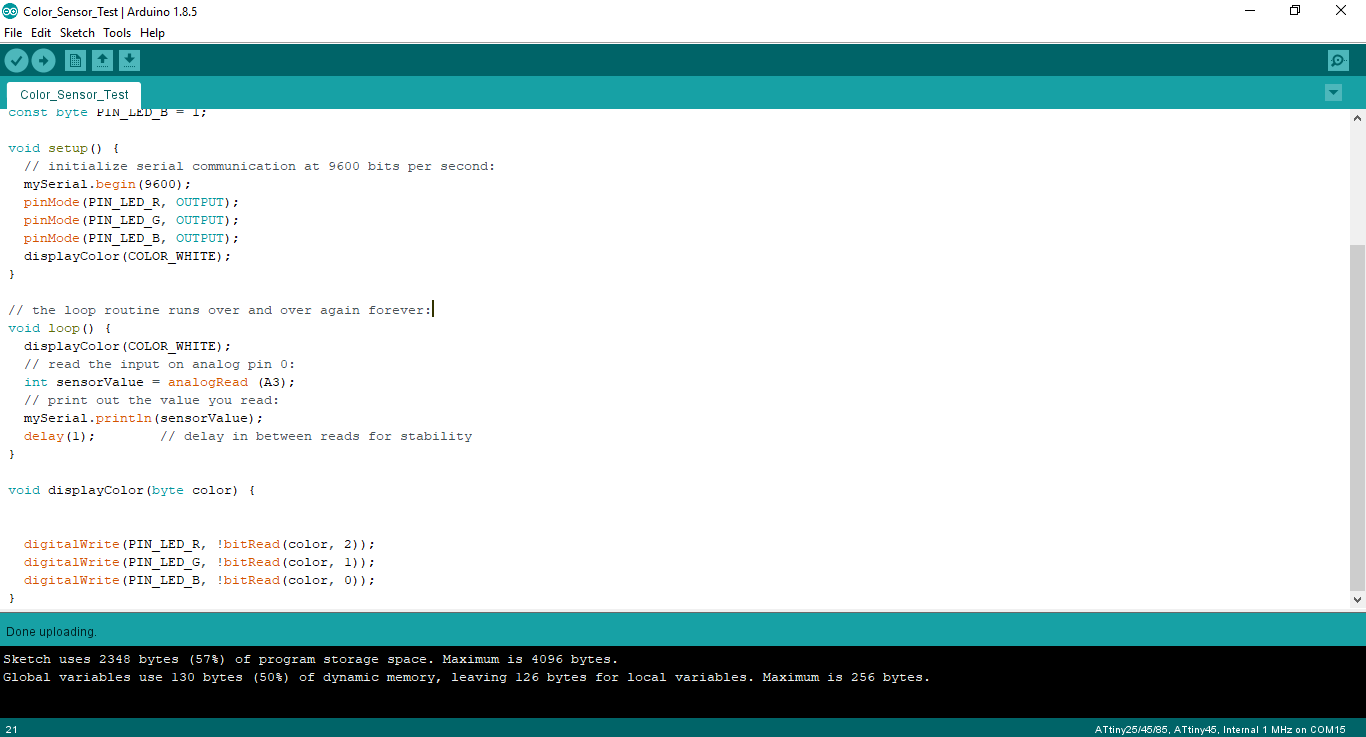
- I uploaded the code to the board and once I did the RGB LED turned on with white color
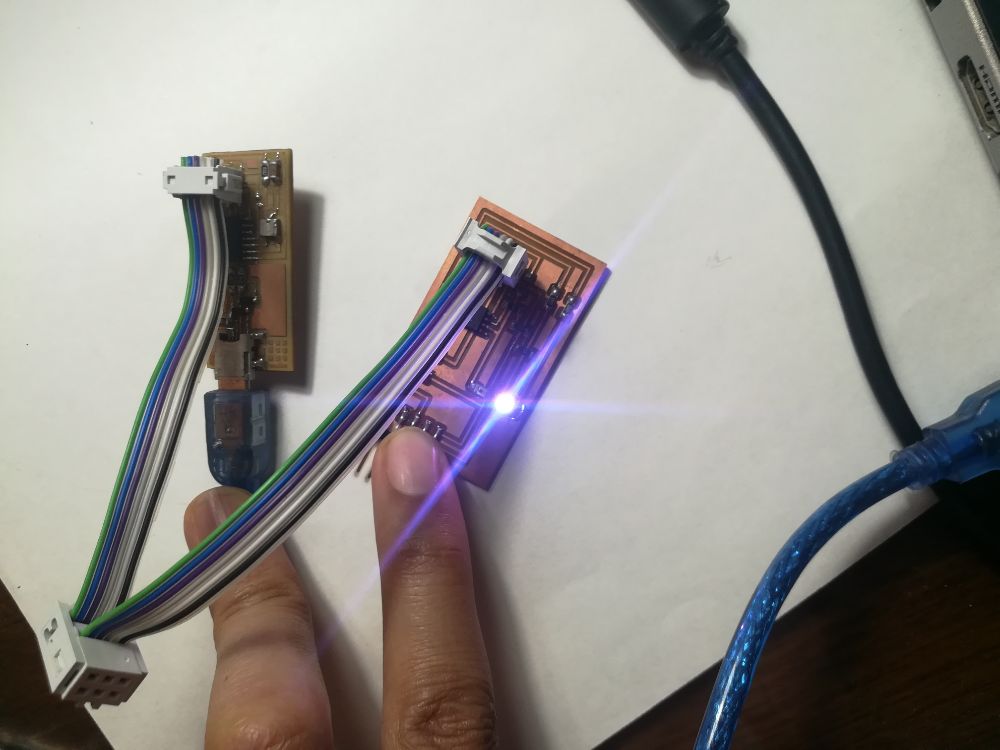
- I disconnected the programmer and hooked the board to an FTDI module and cable to read the output on the serial monitor.
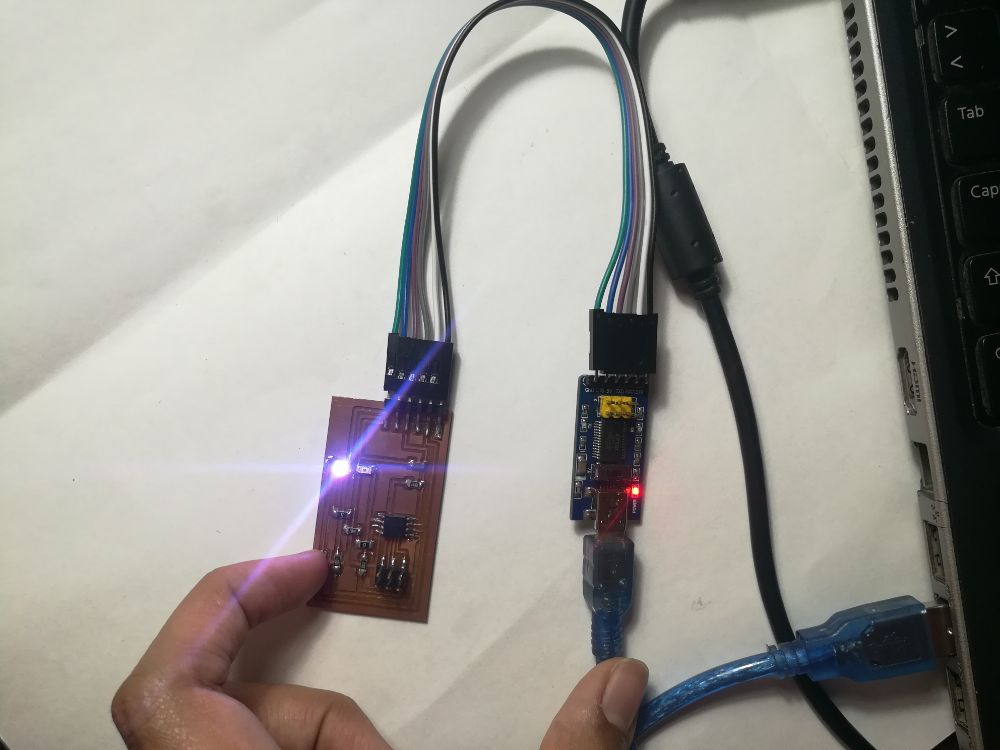
- I prepared paper cards with 4 different colors, white, red, yellow and blue.
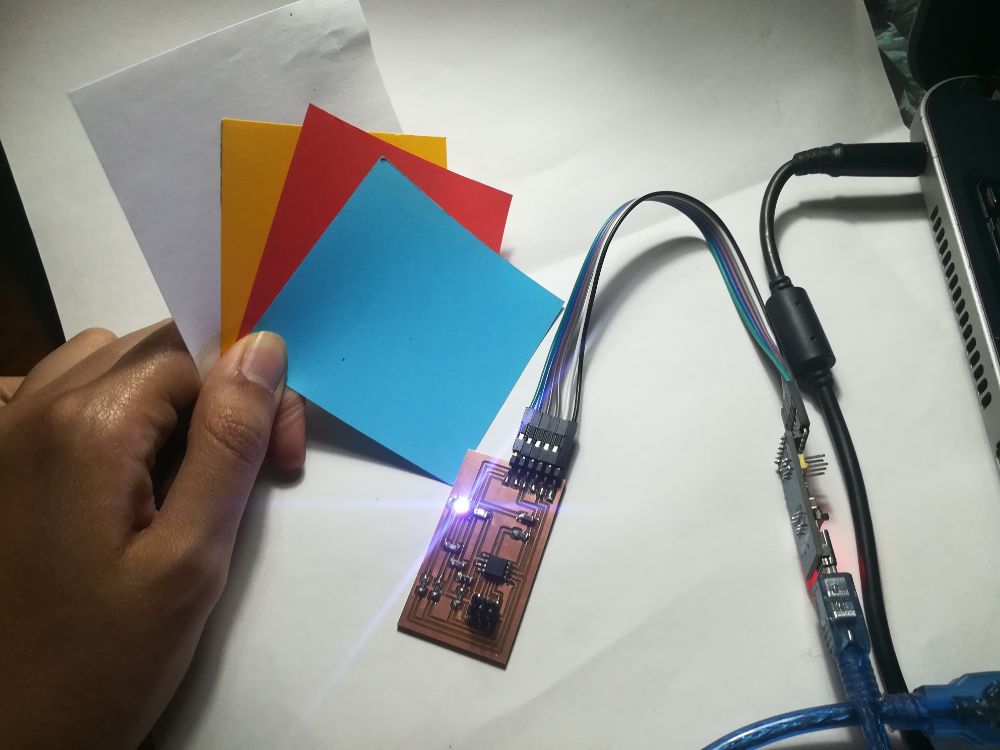
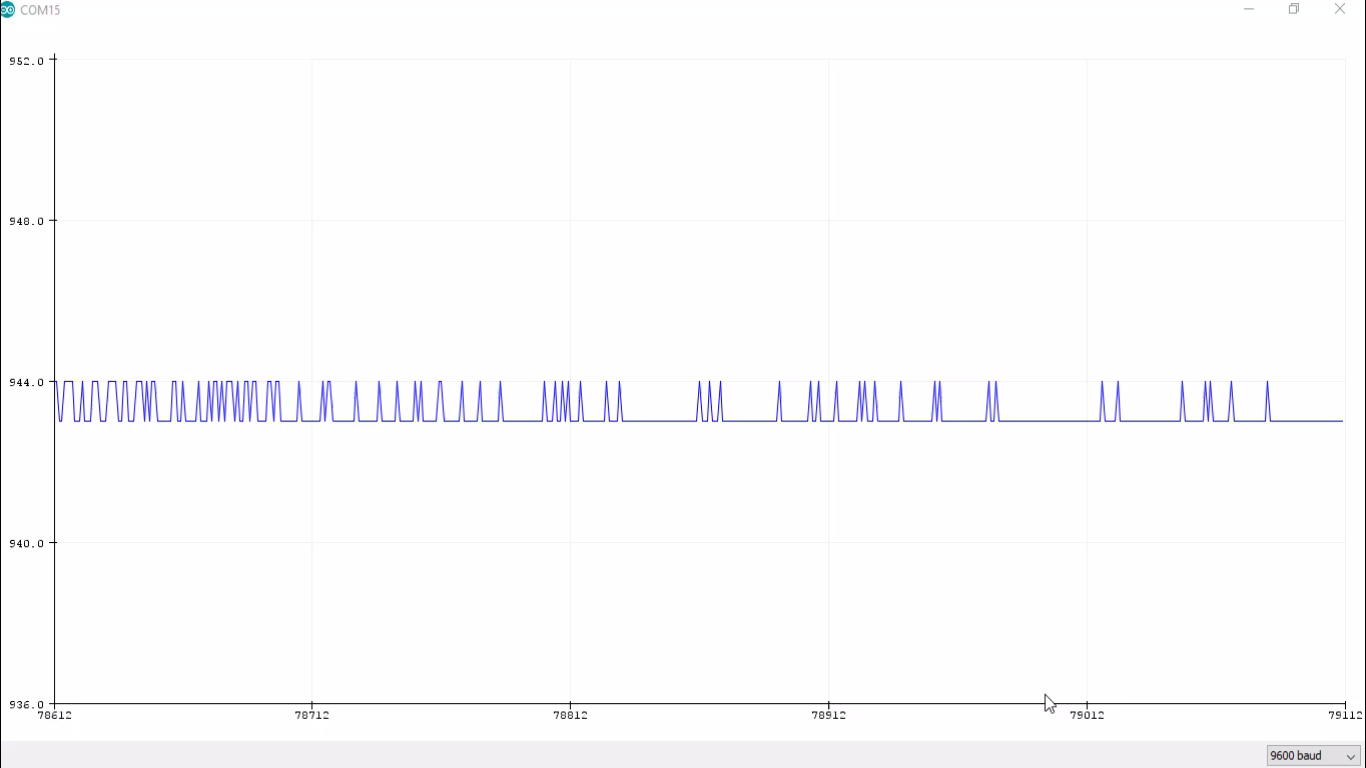
- I started with the reading of the color sensor with no card in front of the sensor. The sensor value was between 943 and 944
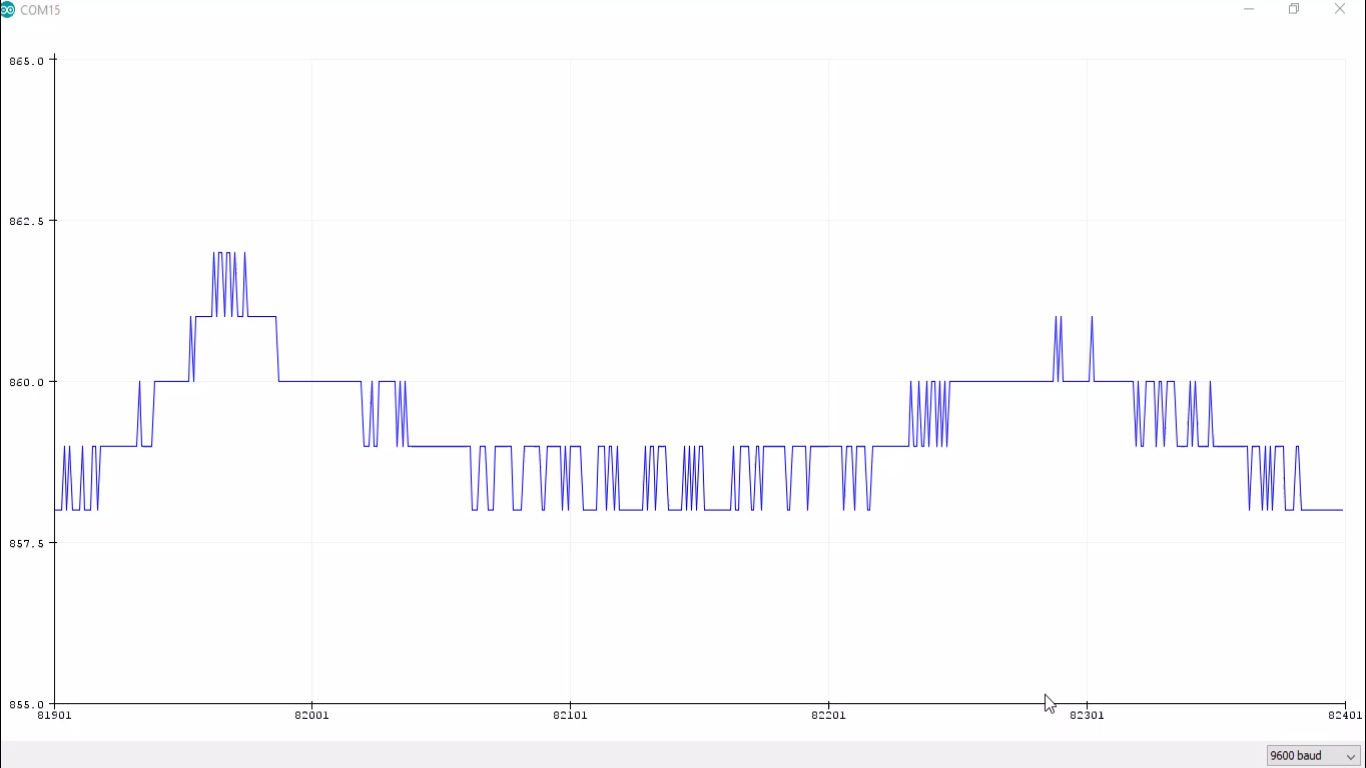
- Then, I started to expose the sensor to the white card, and the sensor value was a round 858 and 860
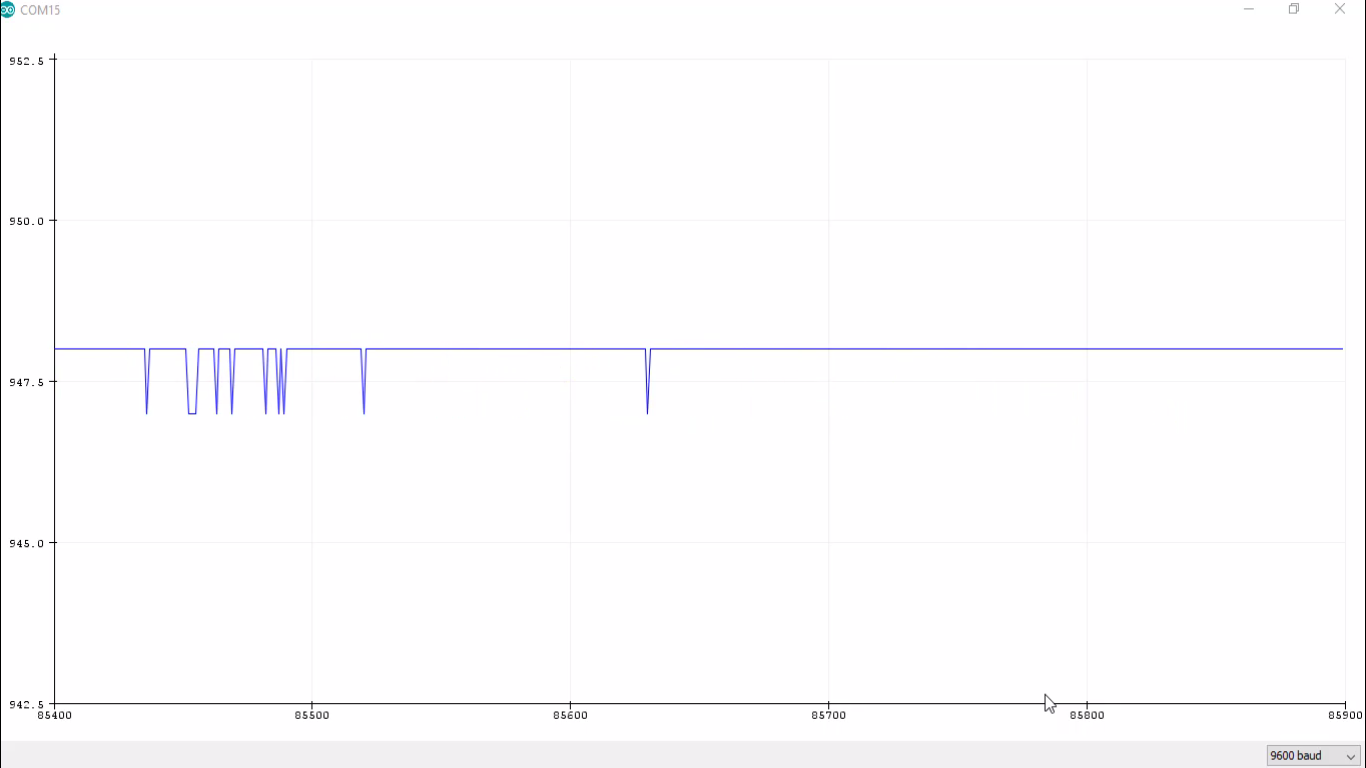
- Then, I exposed the sensor to the red card, and the sensor value was a round 947 - 918
- Then, I exposed the sensor to the yellow card, and the sensor value was a round 913 - 915
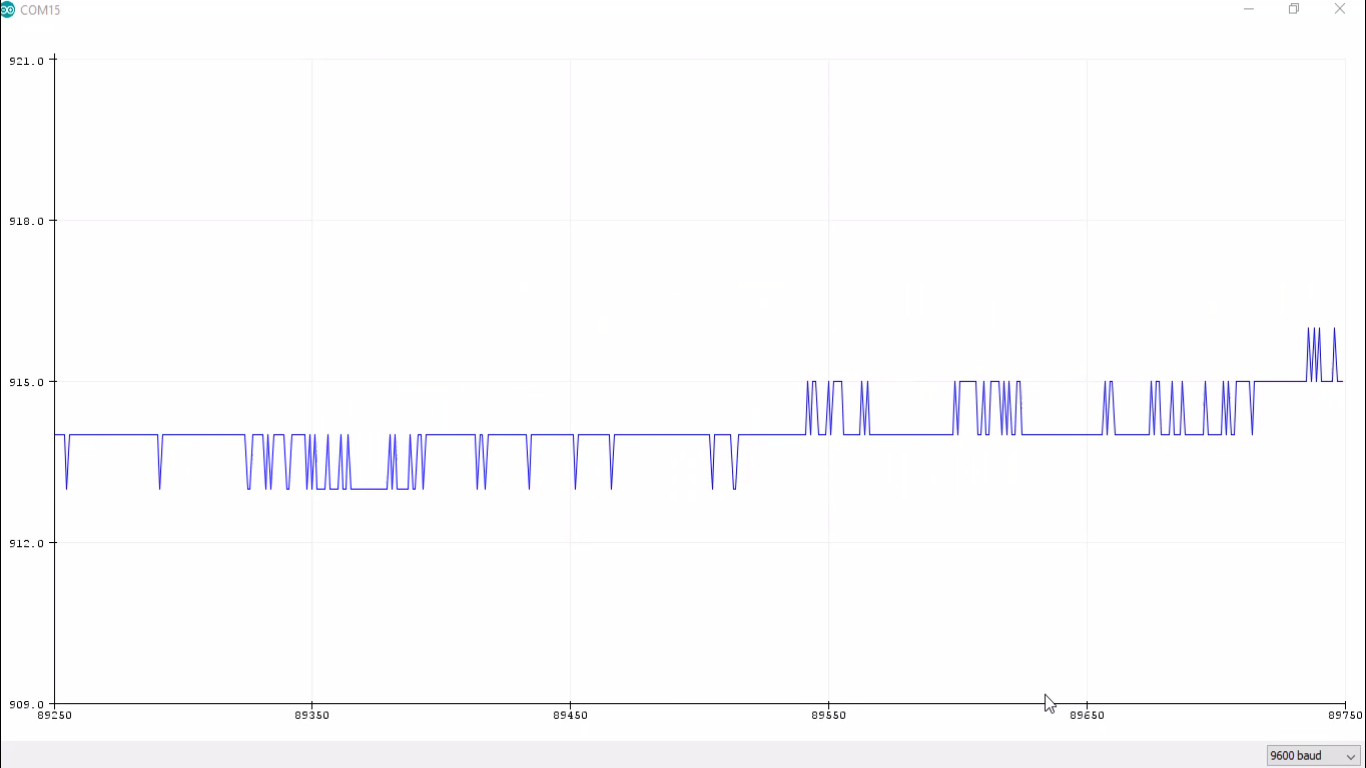
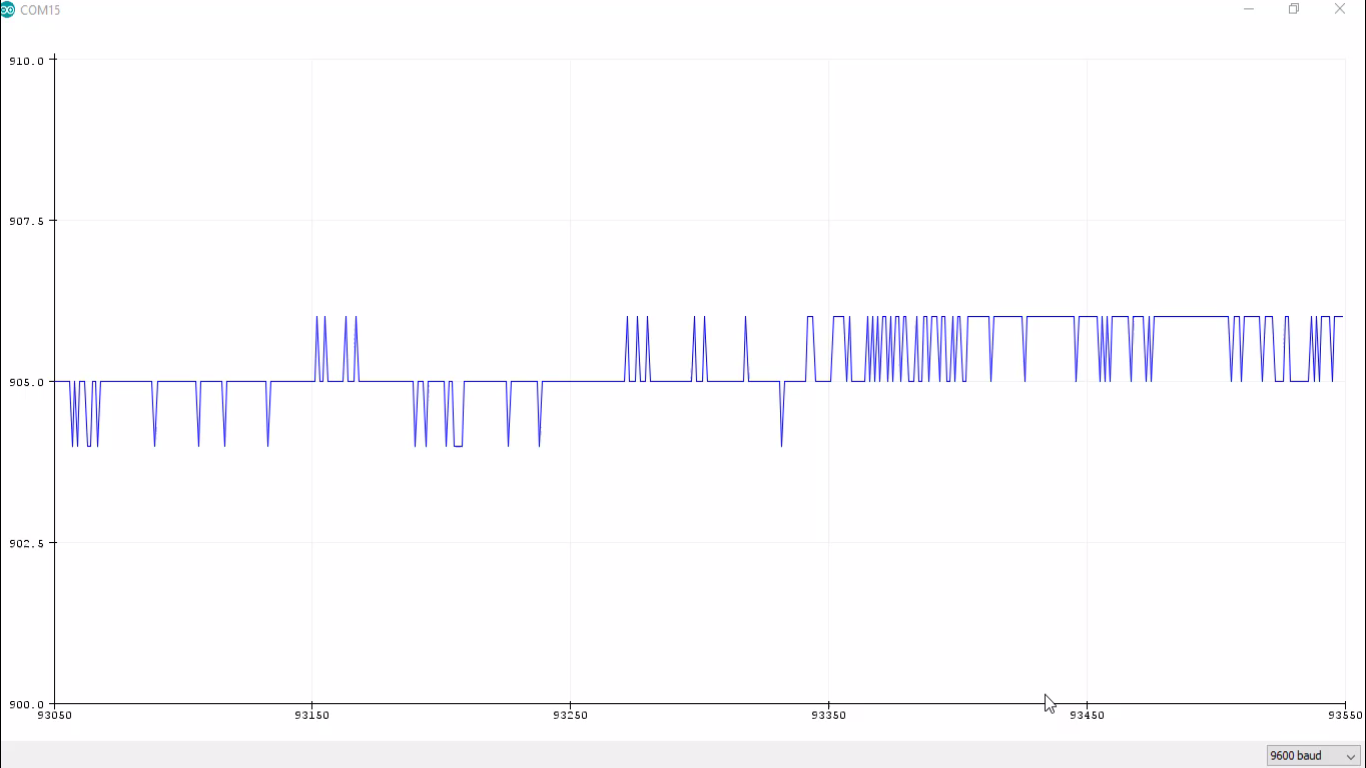
- Finally, I exposed the sensor to the blue card, and the sensor value was a round 905
- Here is a video for the experiment:
- As observed from this experiment, each color has a unique sesnor value, which I can use later to trigger a certain output device.
Design Files