Interface and Application Programming
Table of contents
Introduction
The hardware and firmware developed for my Input Devices assignment used a bridge connected NTC thermistor to feed a temperature dependent voltage difference to two ADC pins of an ATtiny44. This difference was converted into digital values and sent over an RS232 serial link to a computer where it could be monitored. I decided to base this assignment on the Input Devices hardware and to modify the firmware so that the thermistor ADC measurement was sent over RS232 to a PC where the ADC counts could be converted into temperature values and plotted. First up, I decided to experiment with the serial interface using an Arduino and the Python scripting language. Following this Scilab was used to read in the Input Devices board and to plot the temperature.
Python Serial
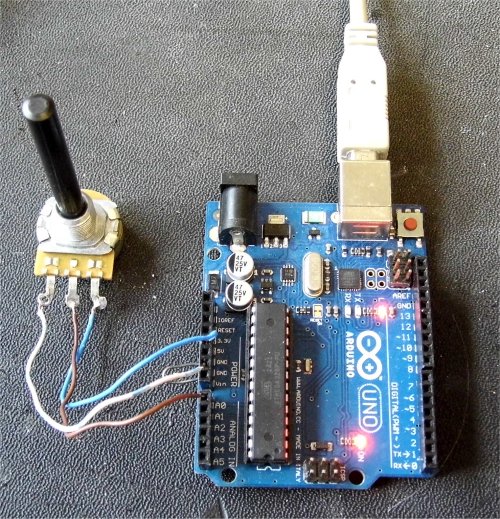
An Arduino sketch reads in a potentiometer voltage on pin A0 and sends this over RS232 to a PC running a Python script. The Python script allows the user to set the sample rate and the number of samples recorded and also stores the recorded values in csv format that can be opened by spreadsheets. I have developed a Python tutorial that provides further detials about using this programming language to communicate over the RS232 link.
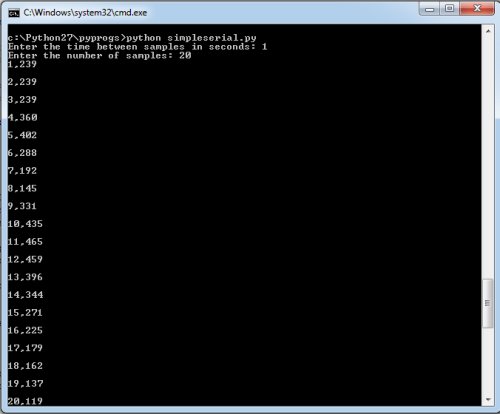
When the Python script called simpleserial.py is first run the user is prompted to enter the time between samples and the number of samples to record. When complete the samples values and times are stored in a comma delimited text file called data.txt
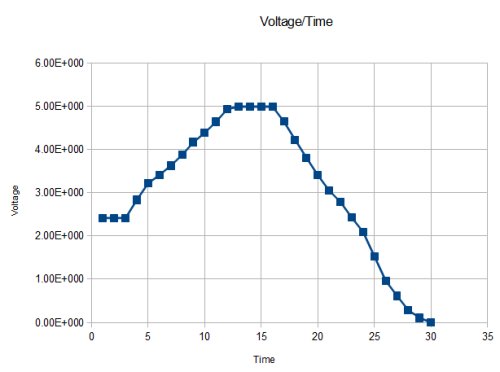
AS the data was being transmitted from the Arduino to the PC the potentiometer position was varied. The csv file was loaded into OPenOffic.Calc and the potentiometer voltage value calculated and then plotted against time.
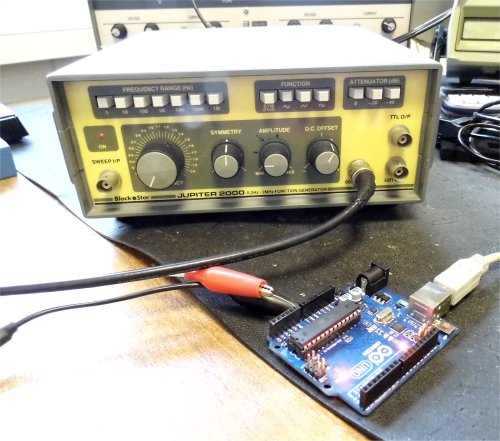
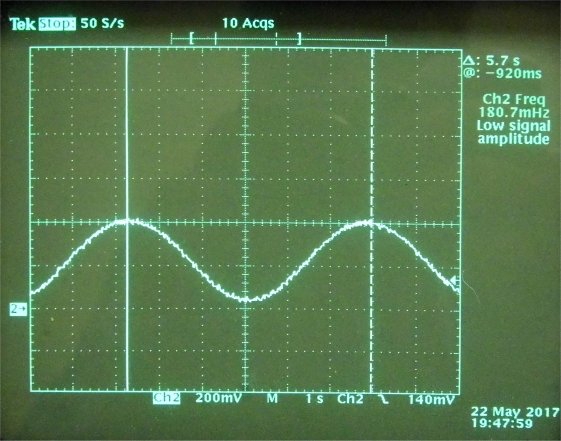
Next a signal generator, configured for 2V PK-PK and approx. 0.2Hz was connected to the Arduino A0 pin. The Python script was run again with the voltages at the A0 pin saved to a csv file and then opened in the OpenOffice spreadsheet and the data plotted.

Scilab
From the
Scilab will be used to read the serial data from the input devices board but before doing this the Scilab serial toolbox needs to be installed. Run up Scilab and in the console window type:
atomsInstall('serial')
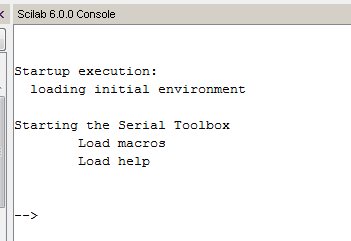
Once installed close Scilab and then reopen it. The following message should appear in the console window showing the serial toolbox has installed.
In the console windows type help openserial to get details on how to use the serial toolbox.
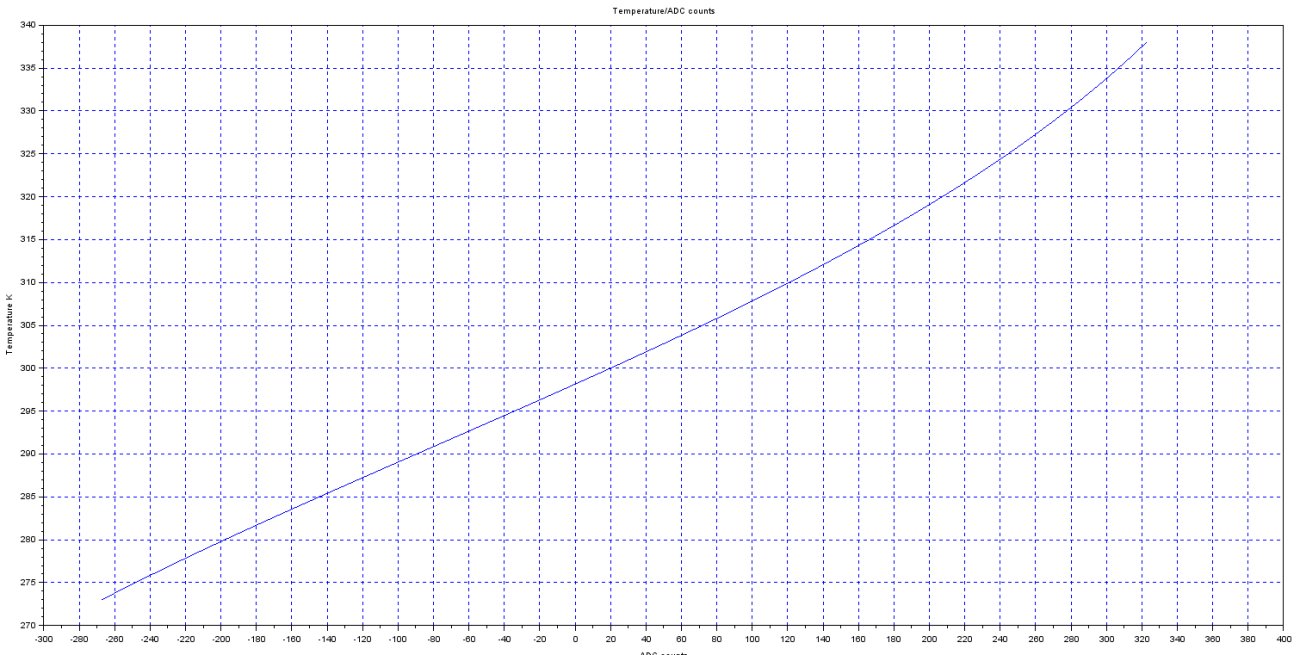
Using Scilab I created a script to read in the serial data from my input devices board which as previously mentioned used a thermistor as part of a bridge circuit to measure temperature. The ATtiny44 uses two ADCs to measure the temperature bridge voltage difference and then transmits the difference as ADC counts over RS232 to the PC. The Scilab application would read in this value and calculate the measured temperature based on it. Looking at a simulated plot showing the relationship between thermistor temperature and the ADC counts it seemed that a simple linear relationship of the form
y=mx+c would suffice as a function to convert ADC counts to temperature. The simulation is shown below and from this the linear relation was calculated as follows:
temperature =0.103*(ADC count)+298
The script include this function to convert the temperature, display the temperature value in the console window and also plots out the temperature versus time.
Testing
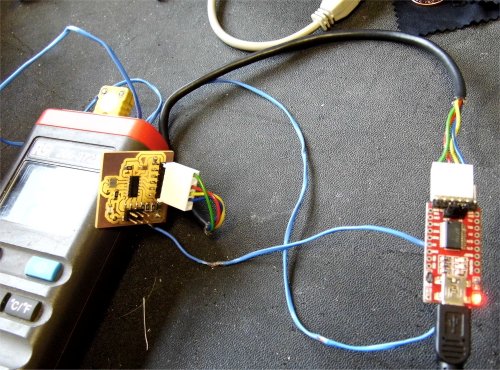
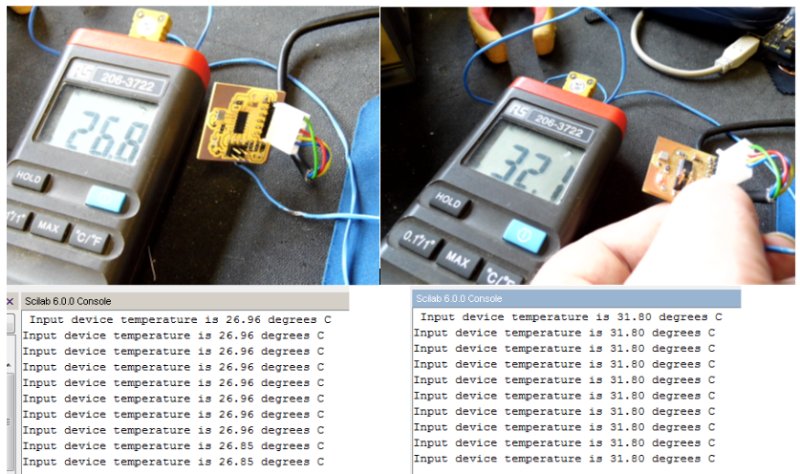
The test setup attached the input devices board to the FTDI RS232 board and then connected this to a PC. A thermocouple was attached to the input device board near the thermistor and the Scilab script temp_log.sce executed.
The script was run twice - once to establish the board temperature and the second time to record the temperature with me holding the thermistor. The thermistor measured temperature was very close at about +/-0.3C. Admittedly this is over a very small range - still good.
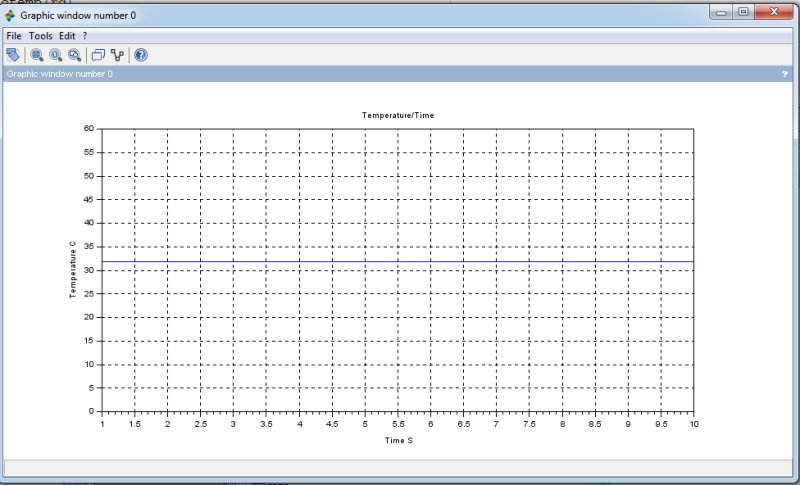
A plot of the temperature when heating the thermistor to finger temp is shown below.
Downloads
- Arduino sketch for Python serial test.
- Python script to read in serial data.
- Arduino sketch that runs with Scilab serial script.
- ATtiny44 Input devices sketch that runs with Scilab serial script.
- Scilab script to plot temperature from input devices board.