Discovering Interface and Application Programming
According to Wikipidia, "In computer programming, an application programming interface (API) is a set of subroutine definitions, protocols, and tools for building application software. In general terms, it is a set of clearly defined methods of communication between various software components. A good API makes it easier to develop a computer program by providing all the building blocks, which are then put together by the programmer. An API may be for a web-based system, operating system, database system, computer hardware or software library. An API specification can take many forms, but often includes specifications for routines, data structures, object classes, variables or remote calls. POSIX, Windows API and ASPI are examples of different forms of APIs. Documentation for the API is usually provided to facilitate usage and reimplementation." There are many laguages that could be used to build applications that interface with Input and Output devices. Out of which are C++, JAVA, Python, Arduino, and Processing.
In this section, we will learn on how to collect data from sensors through a microcontroller, and how to use coding to Simulate and Visualize the measurements in Graphical representations.
Assignment
We had a Group Assignment and an Individual Assignment this week.- Group Assignment Compare as many tool options as possible.
- Individual Assignment The individual assignment was mainly to write an application that interfaces with an input &/or output device that I made.
- Blynk was used to extract and enhance the image of the PCB design.
- Processing was the main online platform used to produce the g-code used by the CNC machine.
- PyCharm was the IDE used to write code using Python.
- Arduino IDE was used to write the code and upload the code the the produce Hello Board.
You can check the Group Assignment on the following link: Group Assignment
Software Used
The following software were used in this week's assignment:1- Group Assignment - Compare as many tool options as possible

So our idea was to compare the various options we can use to interface with out inputs and otputs.
Test 1 - Testing Processing
Processing is a Java based platform that allows you, by the help of some libraries, to make some drawings and simulations. You can take advantage of the design process, which is based on X, Y and Z coordinate system, to simulate and visualize data that you are collecting from a certain sensor.
To achieve that, you can simply replace the value of a certain coordinate with the value recieved from the sensor.
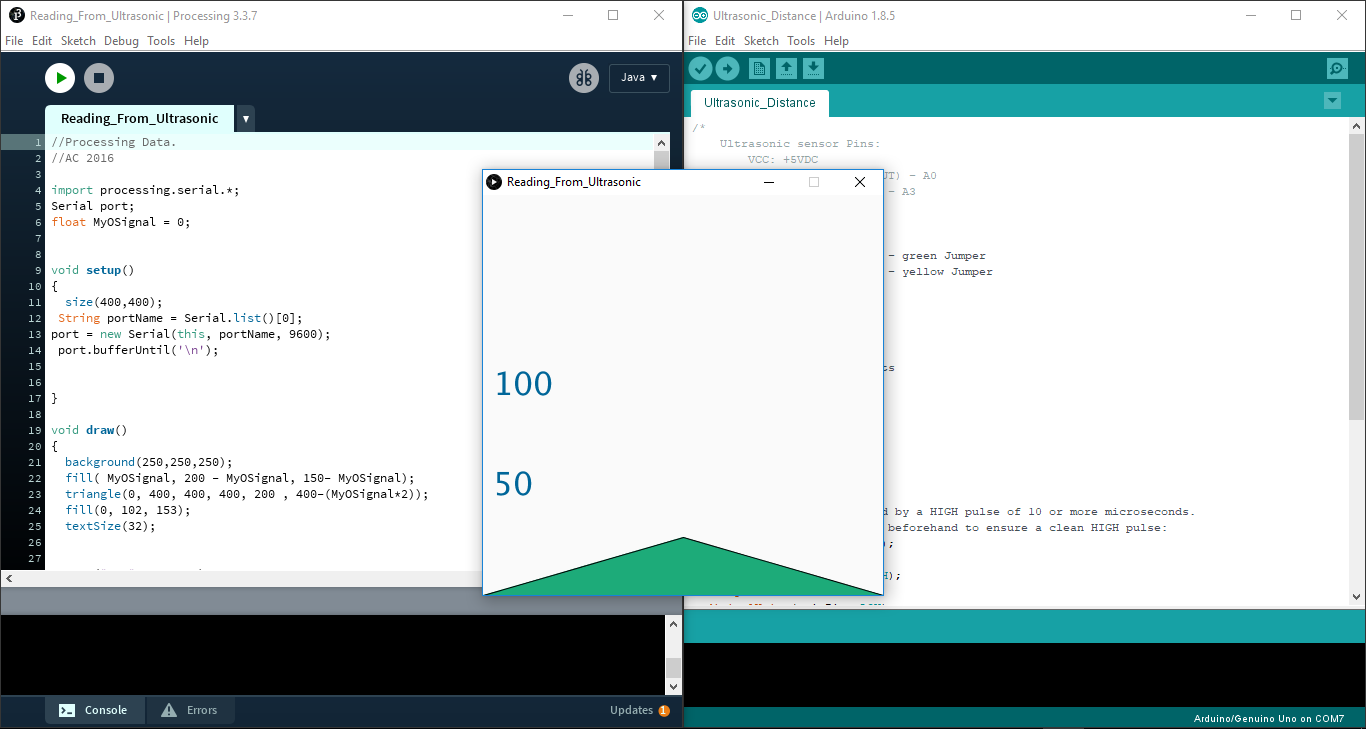
An example of what you can do with processing will be described bellow. What we did is mainly measure the distance using an Ultra-Sonic sensor, and converting the collected data into a graphical representation.
We first drew a traingle using 3 coordinate points. Next we changed one of the coordinates value into the value read from the Arduino Serial Monitor, where the measured distance is printed. Next we added a reference text to the left, to work as a legend, and make the visualisation easier.
The code that we used mainly reads the value from the serial monitor and replaces the value with the value of the coordinates system, thus giving a visualization of the collected data.
You can download the Processing code used using the following Link
You can download the Arduino code used using the following Link
So the process goes as the following:
- Download the Arduino code on your board. In my case, i used the board i produced in the previous week.
- Next open the Processing code and launch the code by pressing the play button. A pop-up box will open and start visualizing the measured distance values
Test 2 - Testing Python
Python is another coding language that could also be used to build and application that could send and receive data to a micro-controller, and thus control a system.
To be able to use python on my computer, i first downloaded PyCharm, and then i started testing it.
As a step one, i first tested some things you can do using Python, such as writing a Hello World code that prints "Hello World". Next I edited the code to be able to write some words based on an If condition. Also i tried counting from 1 to 100 and then back from 100 to 0, to make sure I learn most of the capabilities of Python.
You can download the used Python code using the following link
Next i wanted to test how to communicate with my board, mainly sending or recieving data from the board. To do that, i usd a simple code that would open a small window that has a button saying "Read" on it. Once this button is pressed, the code starts collecting data from the serial monitor of my board. The video represents how this code works.
You can download the used Python code using the following link
Test 3 - Testing BLYNK
Out of curiousity, i wanted to test an interface that could connect to a microcontroller wirelessly. The simplest one that was easy to operate was the BLYNK app. I downloaded the app on an IOS operating system (iPhone) and i used it to controll a Micro-controller board that has an on board WIFI ESP 8266 module on board. I used the NodeMCU
To control the board wirelessly, the following procedure was followed:
- Download the BLYNK app on the phone.
- After that Press on click on New Project and you will get a screen
- Enter the name of your project, I have given it as LED
- Then Select the Board as ESP8266 then you will see below the authentication token no. Send it to your email
- press create and your set with the blynk app
- Add a button to the platform and set it to control the D13 pin
- Now According to the Pin mapping diagram of Esp8266 board, D7 pin is the 13th pin. So we would program the pin as 13 in the arduino code which we will shortly upload to the board.
- Finish the connections. It is pretty simple just connect the Led to D7 pin via 330/220Ohm resistor .
- On the Arduino IDE, download the blynk library.
- generate the code on the following link and fill in the token number and the wifi details into the code
- upload the code the the board after choosing NodeMCU as the baord used
- Next press the play button the app and enjoy controlling an LED wirelessly
2- Individual Assignment - Write an Application

In the individual assignment, we had to write an application that interfaces with an input &/or output device that I made. I used the board that was contructed during the Inputs/Outputs weeks. All details could be found on the following link
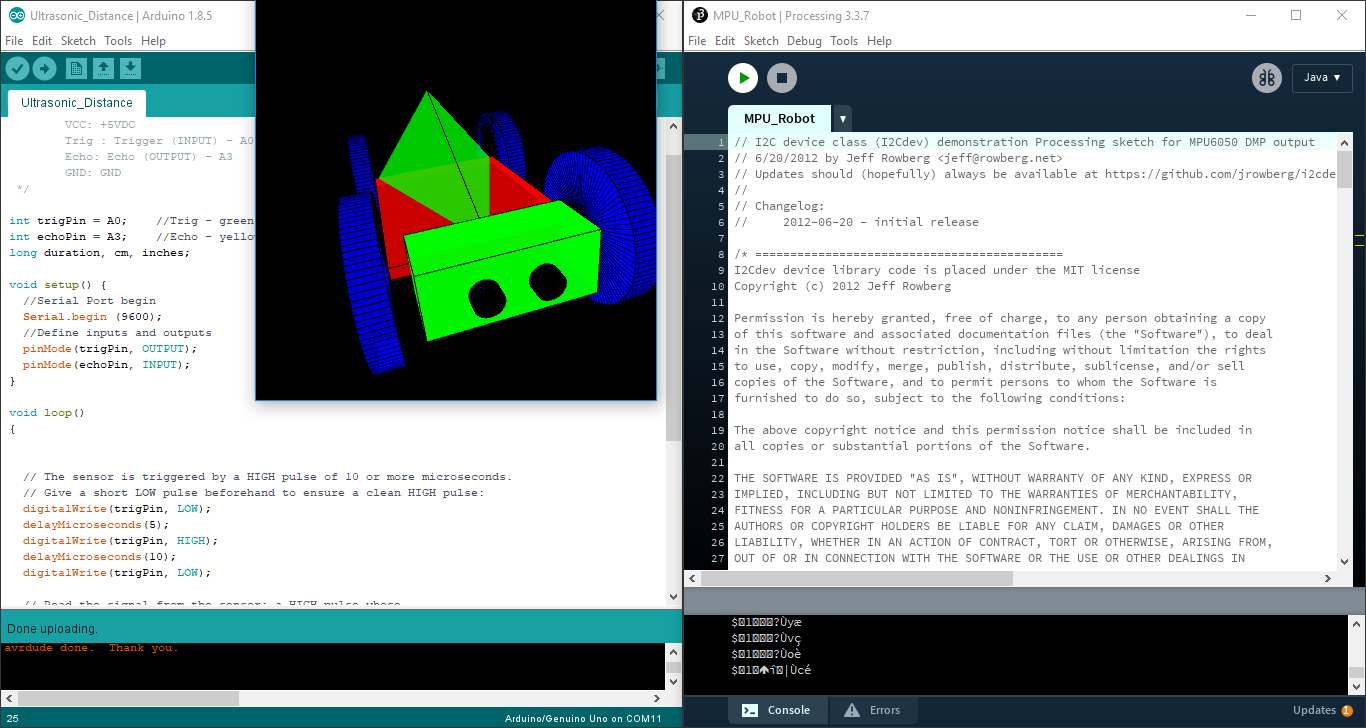
And because the main gathered information I want using my robot is the Angular location and the Acceleration, i wanted to visualise the data gathered from the MPU-6050.
I performed some research online, and reached a point were i found a Processing code,on the following link, that converts the data collected from the sensor into visual data.
i performed some edits to the code, changing mainly the shape that represents the Robot I had in Mind.
The results are shown below.
Reading Data from the Sensor
To read the data from the MPU-6050, first i downloaded the MPU-6050 library from the following
link.
Next find the example code "MPU6050_DMP6" that will read the data from your board.
This code has two different options that we can use. The first option is collecting readable Yaw Pitch Roll data. This is represented in the video. To do that, we have comment the line //#define OUTPUT_TEAPOT and uncomment out the line #define OUTPUT_READABLE_YAWPITCHROLL
The other option is reading the Teapot data by commenting out the line #define OUTPUT_READABLE_YAWPITCHROLL and uncommenting the line //#define OUTPUT_TEAPOT.
Using this code, the data gathered is not readable data, which reduces the memory needed to transfer data to other software. The gathered data can only be understood and interpreted by the help of software.
Visualising the Collected Data using Processing
Next what i did is opened the Processing code I got from the link and then I changed the code used to fit the application of my robot.
Note that some edits were made on the code downloaded, mainly the visual looks of the body used. The main code is a bit complicated, so i did not change the basic lines that convert the read data into visual representation.
