Week_9 - Input Devices
Assigment
- group assignment:
- probe an input device's analog levels and digital signals
- individual assignment:
- measure something: add a sensor to a microcontroller board that you have designed and read it
Group Assigment
We used the Rigol DS1054Z oscilloscope below to measure some information about it from the distributor:
The Rigol DS1054Z is a very high quality four channel digital storage oscilloscope. It features a real-time sample rate of up to 1 GSa/s and a bandwidth of 50 MHz.
The Rigol oscilloscopes are equipped with well designed and easy to use control panels offering comprehensive ease-of-use functions for all measuring tasks. The menu navigation is intuitive and available in several languages.
This high performance standard not only ensures capturing real-time instantaneous signals, but also observes details of repeated signals. The DS1054Z has a refresh rate of up to 30.000 wfms/s, enabling users to capture instantaneous signals, as well as abnormal signals more quicky. It also helps to enhance the waveform capturing ability and to expedite a circuit debug course. The quality of the Rigol oscilloscopes is comparable to Agilent and Tektronix oscilloscopes.
The particularly large TFT color displays are very easy to read. Thanks to an intelligent system for displaying or masking information, the largest possible area is always available for displaying signals. The signal curves, the FFT display, and other functions can be shown simultaneously on the display.
Of course, before we started to use this equipment, we went through a short manual and watched some tutorials on the Internet:
SparkFun How does an oscilloscope work?
Rigol Basics of oscilloscope
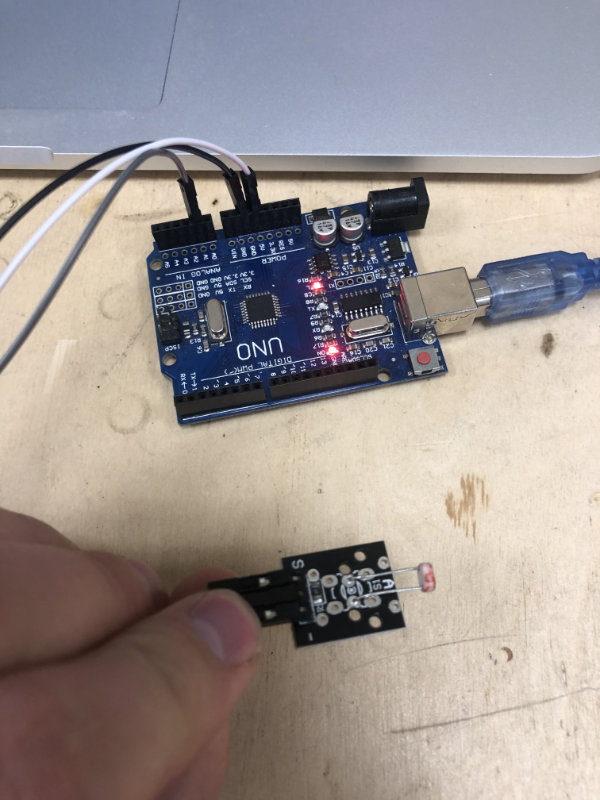
The task we set ourselves was to lose the operation of the phototransistor connected to Arduino. (under Arduino because unfortunately we are now in the middle of a pandemic and it was difficult to work on projects with limited access to Fablabu)
We used it to create a circuit this elements:
In order to be able to perform the test with an oscilloscope, we have created a simple code to provide data from Analog input in the Arduino IDE activity monitor.
							int photo = A1;

							void setup() {
							  Serial.begin(9600);
							}

							void loop() {
							  photo = analogRead(A1);
							  Serial.println(photo);

							  delay(200);
							}
Connection to the oscilloscope:
Remembering to change the multiplier to 10x for a test, we connected Ground to GND on the photoresistor and Probe signal to A1 (the second leg of the photoresistor). Just like in the picture.
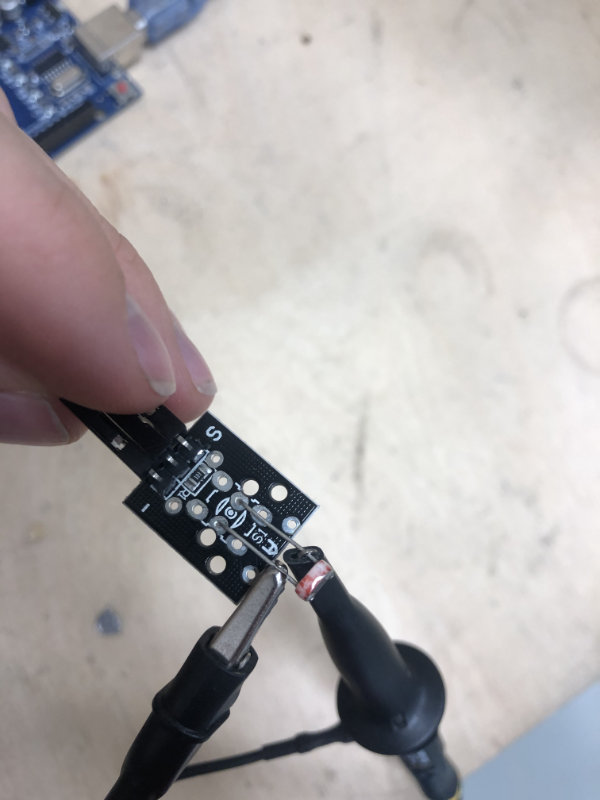
The oscilloscope was switched on during the connection on standby mode. For the test we chose the previously tested CH1 (channel 1).
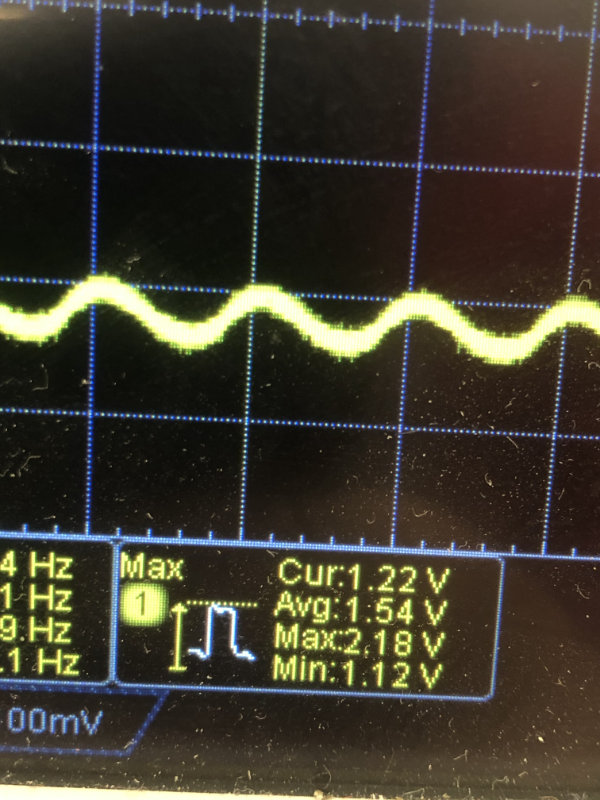
After checking everything we turned on the frequency drop. It turned out that we had to adjust the horizontal sensitivity of Hz and vertical sensitivity of V a bit. Eventually, we left an 500mV and 100 Hz.
On the video you can see changes in resistance when the amount of light falls on the sensor.
Individual assignment
The task for this week was to attach the sensor to the microcontroller and read the data it indicates. Looking at my arduino set I thought it would be nice to combine this week's project with next week's project, that is to make a weather station with a screen. This week I will write a code and create a layout for the weather station next week I will add screen.
What I will need:
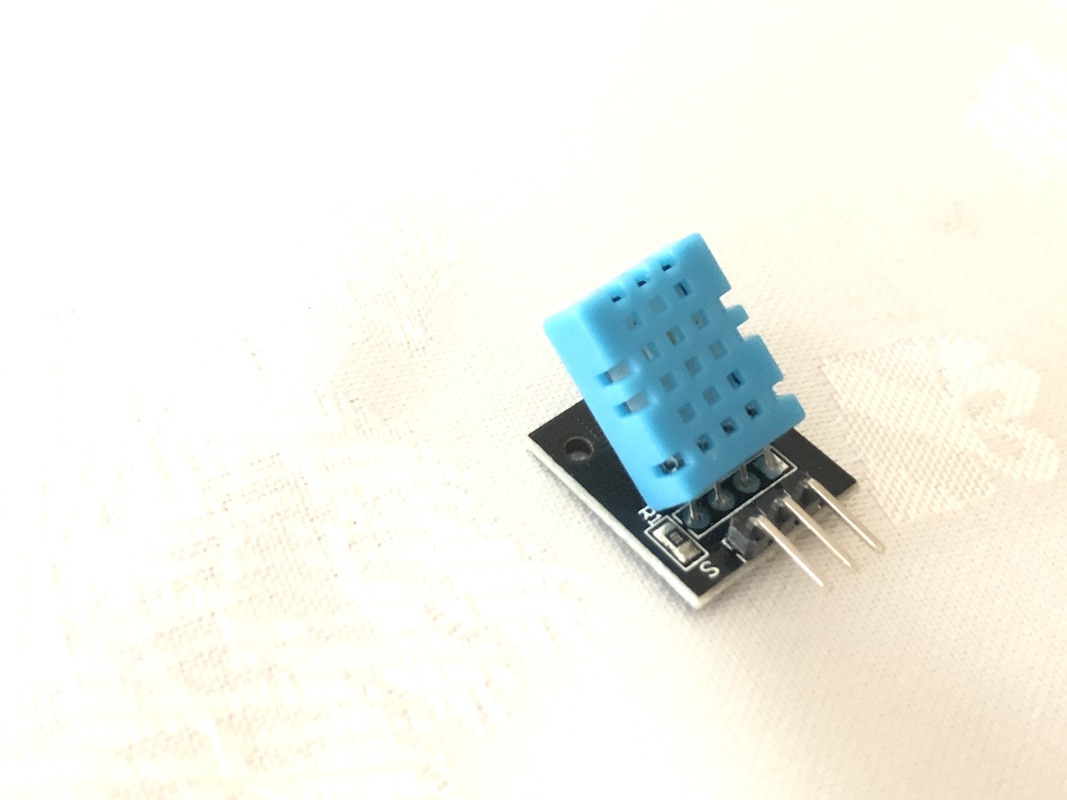
DHT11 accuracy:
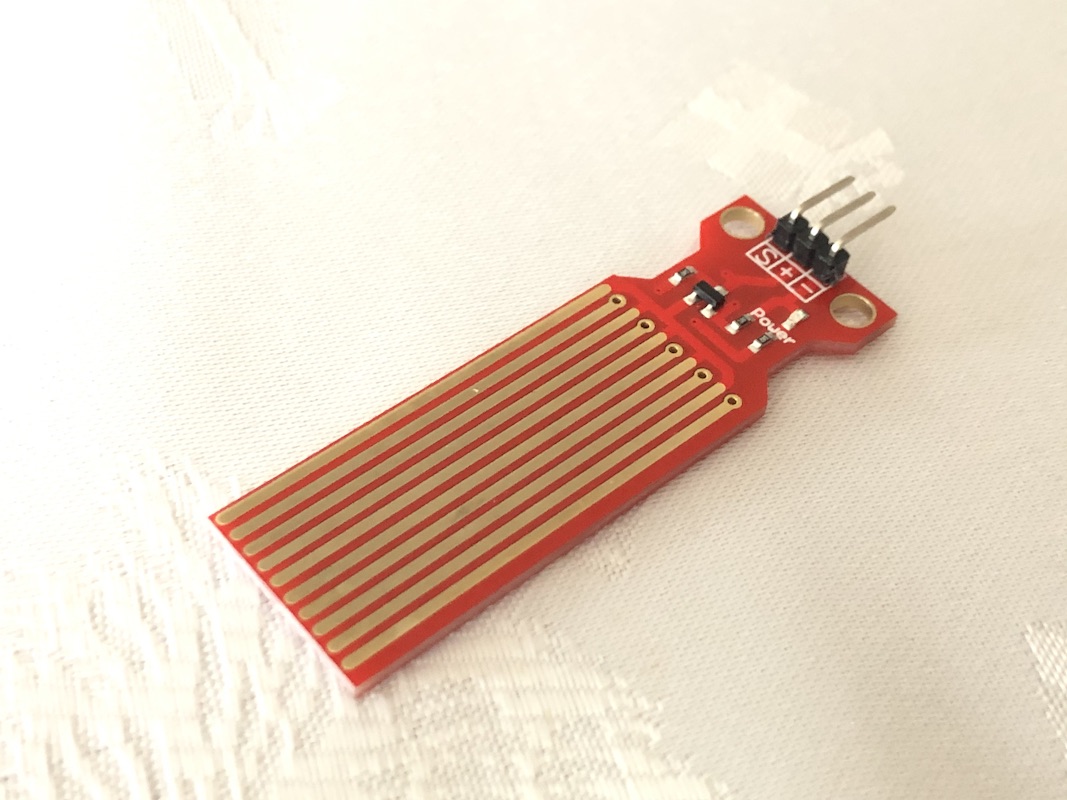
first of all I checked what libraries will be needed and how to connect components with each other. I added libraries to the code and installed the missing ones. ( Sketch add Libraries ). DHT sensor library. I downloaded the code to read data from DHT from github, and the Water sensor worked to read from analog so there was no need to use any additional libraries. I connected the sensor to arduino using breadboard and cables, using schemes available on the Internet. Below is the code with comments that I prepared for the program checking temperature and amount of rain.
// Water sensor and DHT 11 code modify by Maciek Naskret
// Include the libraries:

#include <Adafruit_Sensor.h>
#include <DHT.h>
#include <DHT_U.h>

// Set DHT pin:

#define DHTPIN 3

// Set DHT type, uncomment whatever type you're using!

#define DHTTYPE DHT11   // DHT 11
//#define DHTTYPE DHT22   // DHT 22  (AM2302)
//#define DHTTYPE DHT21   // DHT 21 (AM2301)

// Initialize DHT sensor for normal 16mhz Arduino:

DHT dht = DHT(DHTPIN, DHTTYPE);
void setup() {

  // Begin serial communication at a baud rate of 9600:

  Serial.begin(9600);

  // Setup sensor:

  dht.begin();
}
void loop() {
  // Wait a few seconds between measurements:
  delay(4000);

  int sensor=analogRead(A1); // Incoming analog signal read and appointed sensor
 Serial.print("Water Level: ");
Serial.println(sensor);   //Wrote serial port

  // Reading temperature or humidity takes about 250 milliseconds!
  // Sensor readings may also be up to 2 seconds 'old' (its a very slow sensor)
  // Read the humidity in %:
  float h = dht.readHumidity();
  // Read the temperature as Celsius:
  float t = dht.readTemperature();
  // Read the temperature as Fahrenheit:
  float f = dht.readTemperature(true);
  // Check if any reads failed and exit early (to try again):
  if (isnan(h) || isnan(t) || isnan(f)) {
    Serial.println("Failed to read from DHT sensor!");
    return;
  }
  // Compute heat index in Fahrenheit (default):
  float hif = dht.computeHeatIndex(f, h);
  // Compute heat index in Celsius:
  float hic = dht.computeHeatIndex(t, h, false);
  Serial.print("Humidity: ");
  Serial.print(h);
  Serial.print(" % ");
  Serial.print("Temperature: ");
  Serial.print(t);
  Serial.print(" \xC2\xB0");
  Serial.print("C | ");
  Serial.print(f);
  Serial.print(" \xC2\xB0");
  Serial.print("F ");
  Serial.print("Heat index: ");
  Serial.print(hic);
  Serial.print(" \xC2\xB0");
  Serial.print("C | ");
  Serial.print(hif);
  Serial.print(" \xC2\xB0");
  Serial.println("F");
}
Below is a video of working circut and measurement
with Arduino IDE monitor.
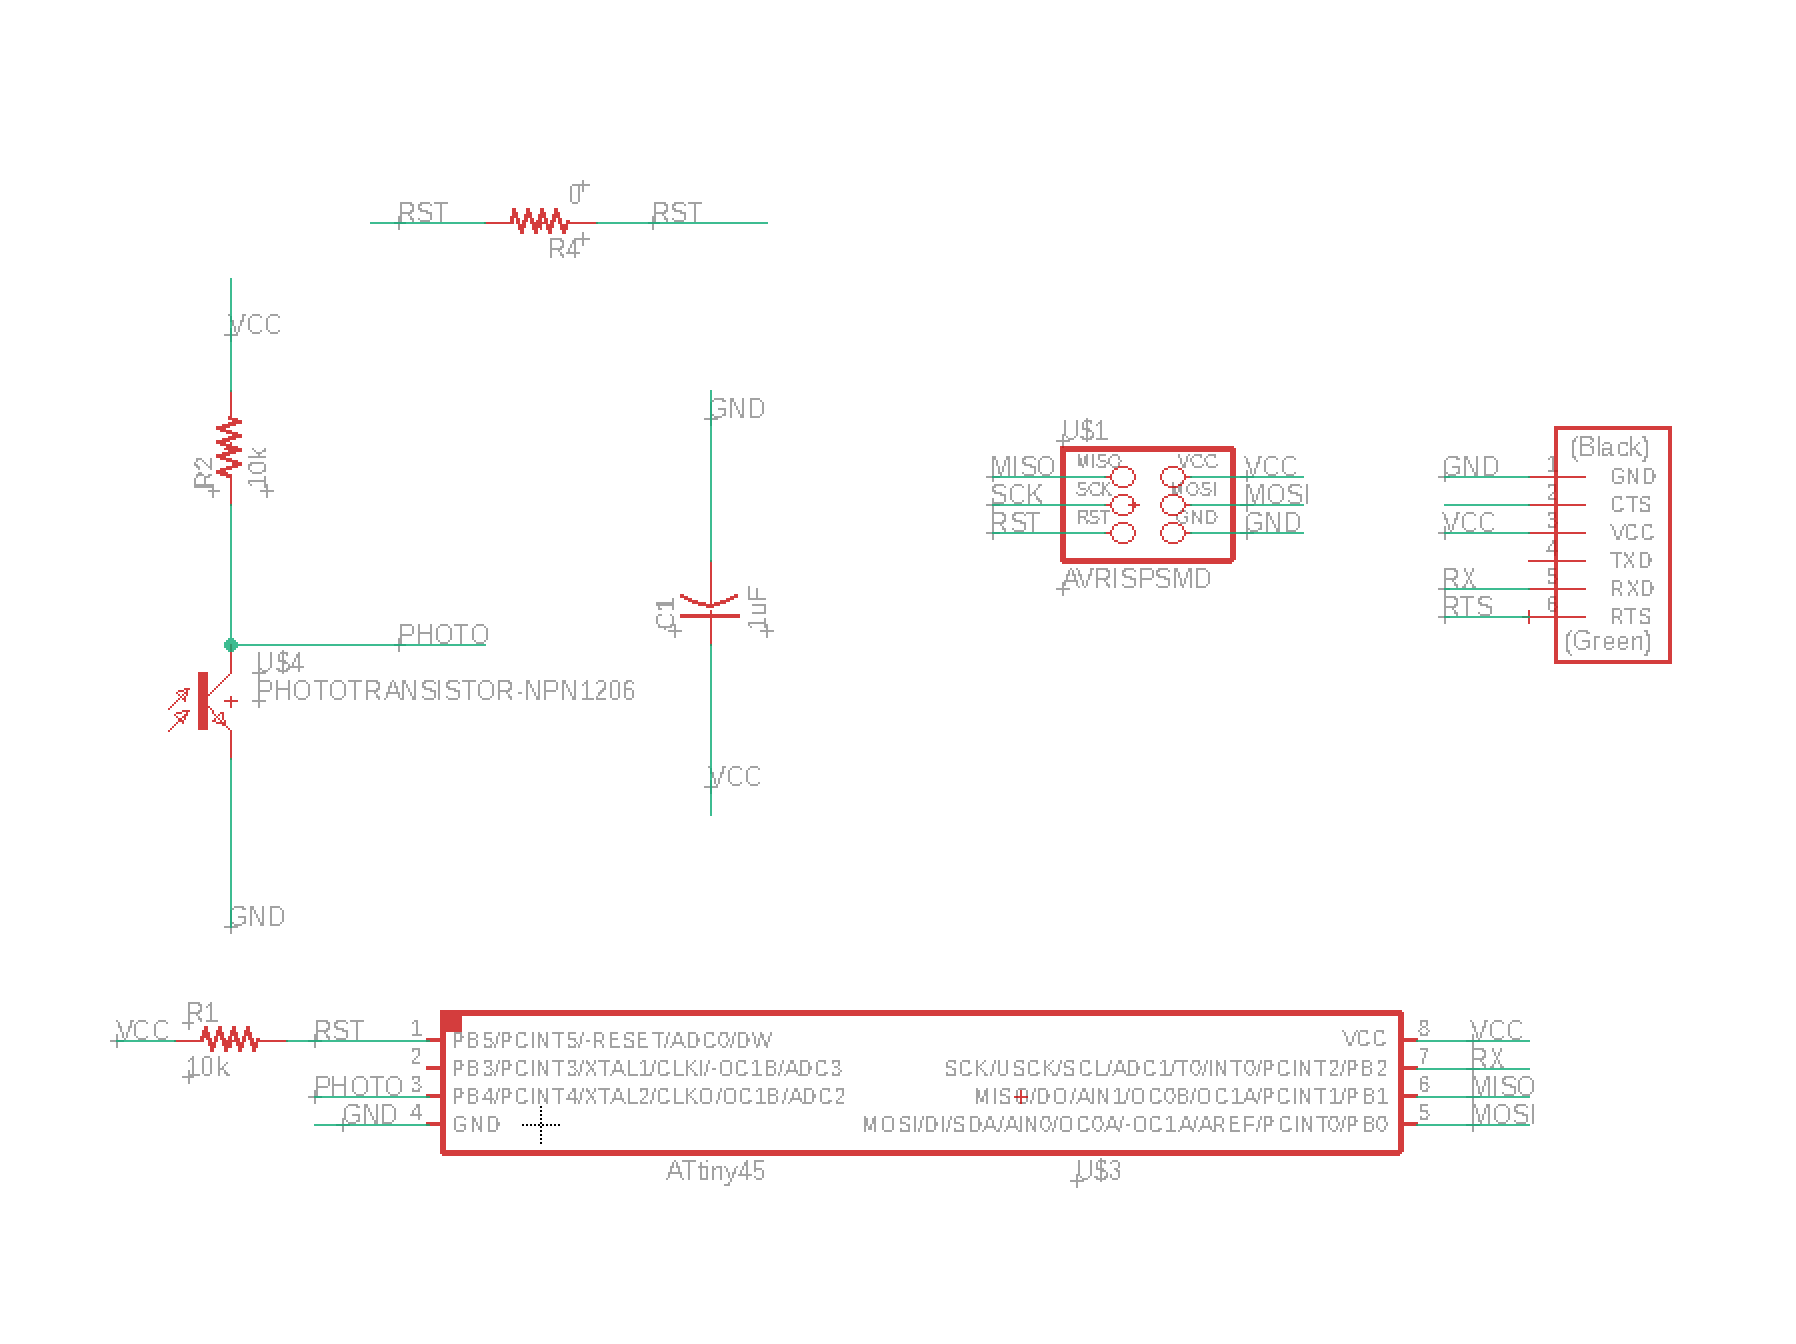
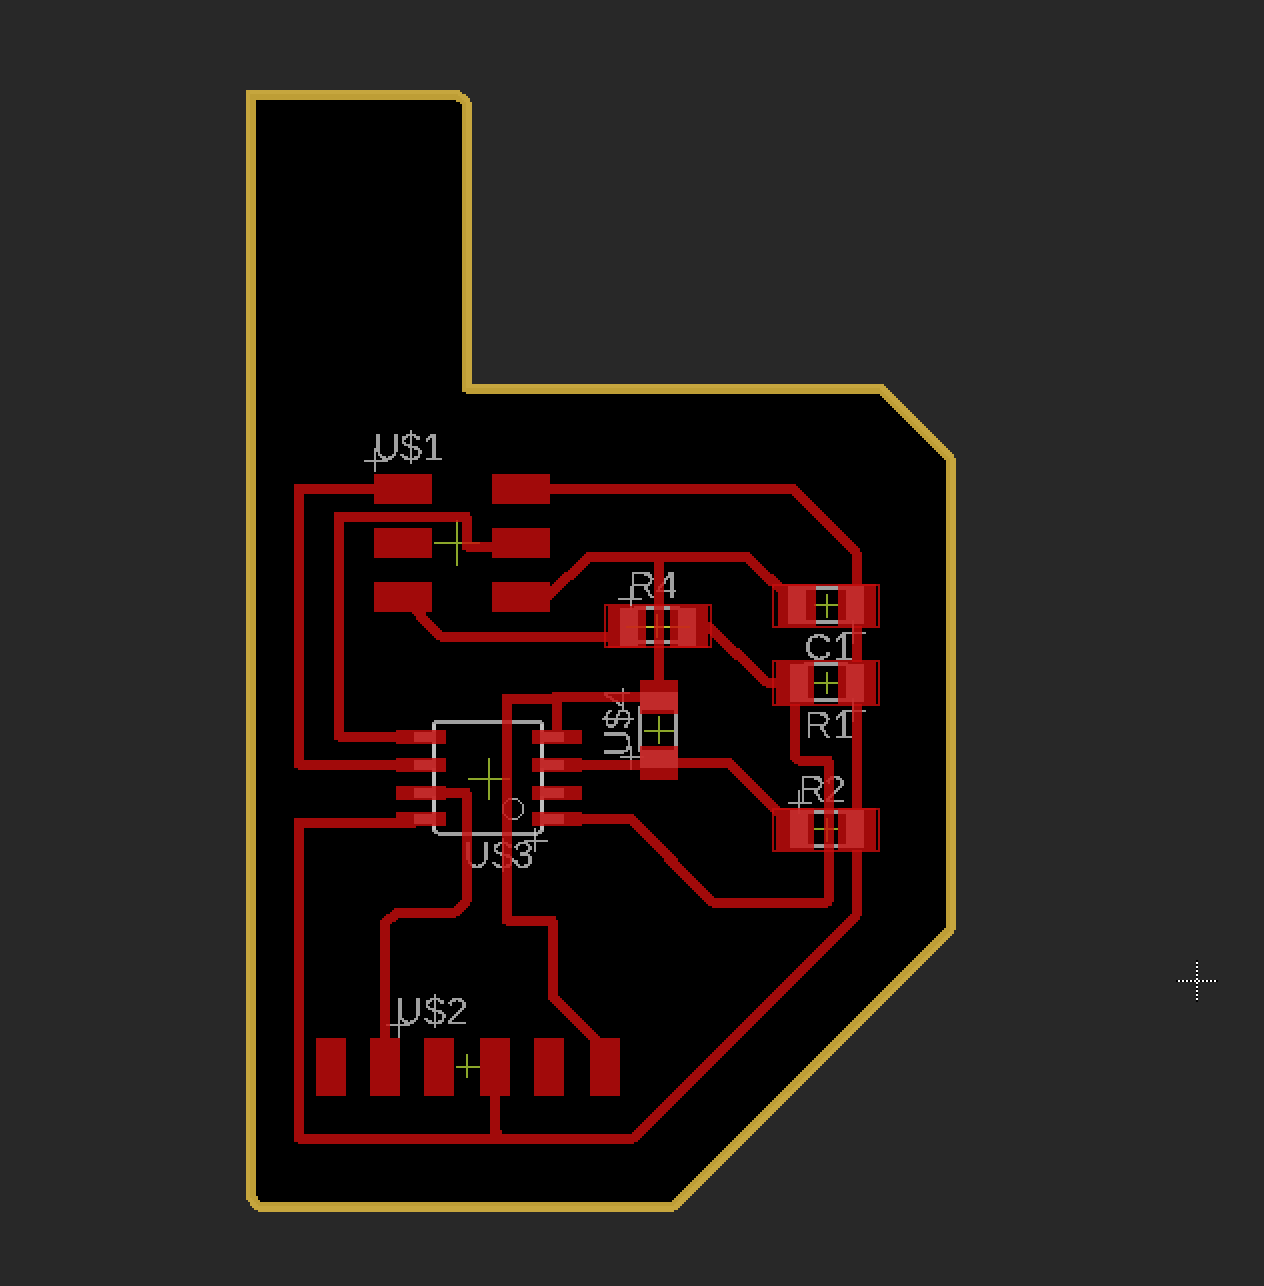
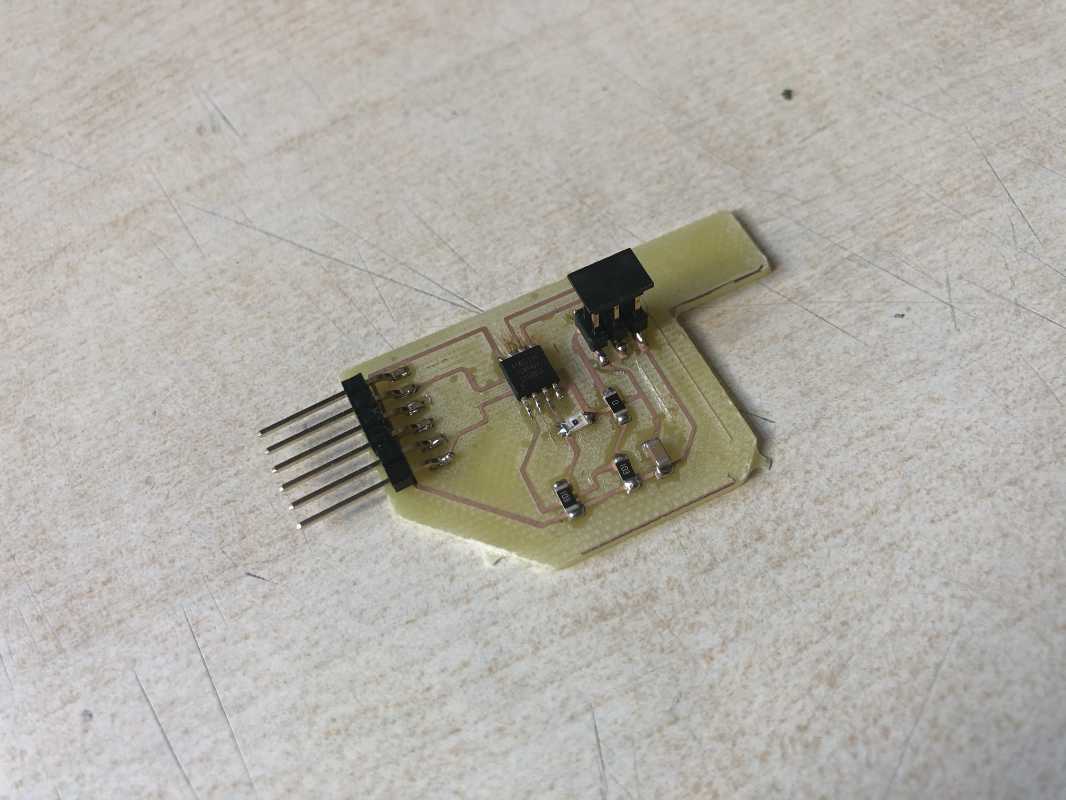
Individual Assigment part 2 creating a board
I chose a resistance sensor with a photoresistor as the task of designing the board.Photoresistor
A photoresistor is a passive electronic element, whose resistance depends on the intensity of light. When it is activated, it behaves like a standard resistor, i.e. it complies with Ohm's law and passes the current equally in both directions. The resistance of the photoresistor decreases with increasing light intensity.
Components: