
9.
Input Devices
Assignments
group assignment
probe an input device's analog levels and digital signals
individual assignment
measure something: add a sensor to a microcontroller board
that you have designed and read it
Download the files
This week the only thing to download is the source code of the examples below.
Download source code + Kicad filesTable of contents
-
Playing around with a photoresistor
-
Photoresistor + LED = proximity sensing
-
Using a lemon as a capacitive sensor
-
Making the circuit work and plotting on serial
- The circuit schematic
- Touching the lemon
- Theory: I add charge to the circuit, rather than taking some
-
Switching an LED on
-
Let’s make this graph smooooth
-
Designing a chip with a sensor
-
Eeschema, picking the components
- Using some random mounting holes and potentiometer
- Wiring up the components
- Generating our Netlist
- Oops, missing the footprints
- Linking any symbol to any footprint
-
PCBeditor, placing the components
-
Milling… just kidding, we can’t (whoop, COVID-19)
-
Detecting when I’m drawing with a pencil?
-
Have you?
Playing around with a photoresistor
These things are… irresistable.
Voltage divider
Like Victor said in the class, you need a voltage divider for the ADC (Analog to Digital Converter) input to be able to read any input.
If there is no resistance, the current will go straight to the ground, resulting in the Voltage Output to be 0V , and therefore a flat line in the Serial Plotter .
If you put a resistor between the photoresistor (a.k.a. LDR for Light Dependent/Decreasing Resistor) and the GND, then the current going to GND will be limited, and more will be diverted towards the ADC input. As we will see in the next few paragraphs, the higher the resistance , less current goes to GND, and therefore more goes to the INPUT.
If the resistor is too low (or like we said before non-existent), then not enough current reaches the pin, for the reading to be accurate enough.
If it is too high then too much voltage arrives at the ADC pin, and the reading maxes out.

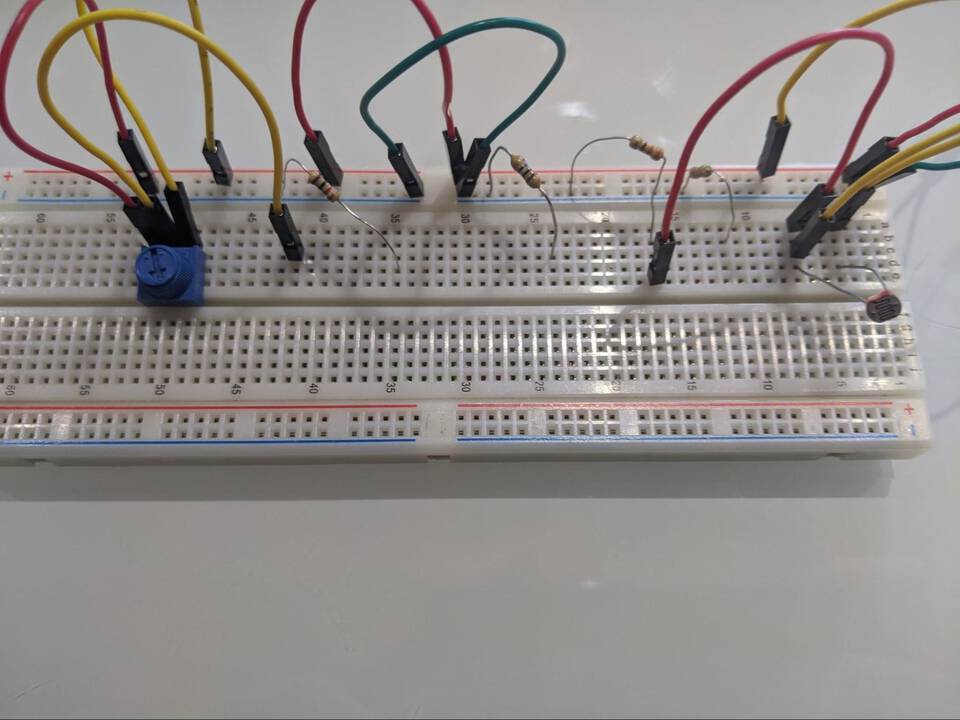
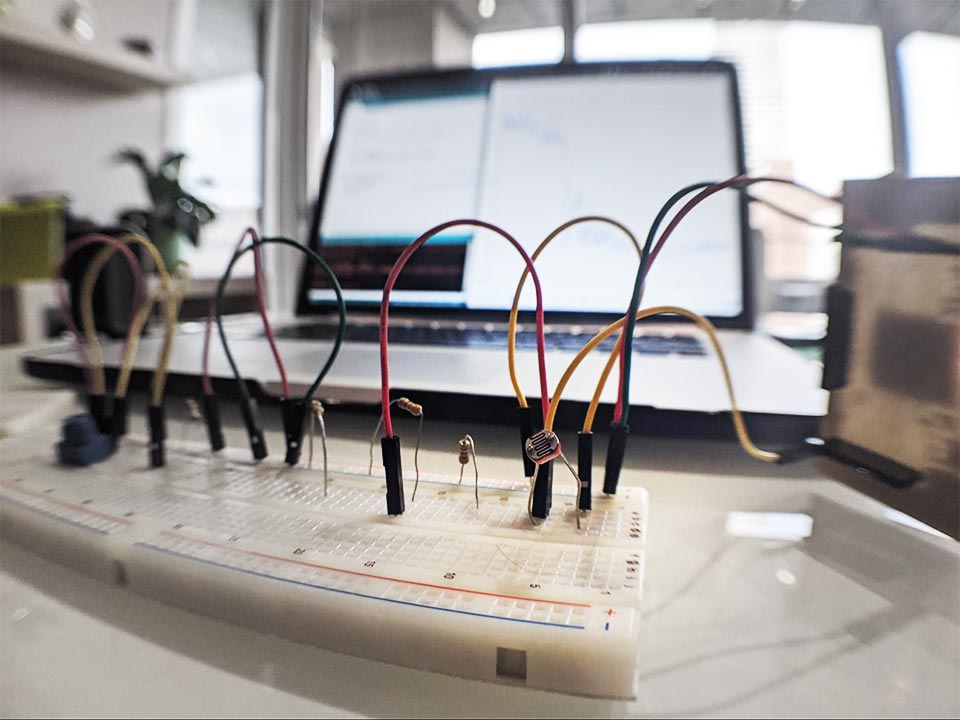
Using 220Ω and other resistors
I wired a circuit which included different resistors to see how it would affect the ADC reading of the photoresistor. You can see in the final graph the different values, and as expected, higher resistance means higher voltage reading.
Using a potentiometer
I also opted to try with a potentiometer, to be able to easily change the resistance and see which resistor would be optimum for reading values.
If we look at the actual resistors in the left part of the graphic, we can see, on the graph above, that the final resistance that allows for a light source to literally touch the LDR but doesn’t max out at the ADC input is roughly around 1kΩ.

Calculating the resistance of the photoresistor
The formula to calculate the value of the photoresistor, the one in the circuit we showed in the first chapter of this beautiful documentation, is:

Let’s use the graph above where we use the 10kΩ resistor as R2. We can roughly read that the photoresistor oscillated around 2900. The values given by the ESP32 are in 12-bit , therefore the highest value in the Serial Plotter is 4095. Therefore we can say that Vout is roughly 3.3 * 2 900 / 4 095 = 2.34
-
We know these values:
- Vin = 3.3 V (VCC provided by ESP32)
- Vout = 2.34 V
- R2 = 10 000 Ω
If we plug in the values:
R1 = 10 000 * ( 3.3 / 2.34 - 1) ≈ 4 102.56 Ω.
The photoresistor has a resistance of about 4.1kΩ in the ambient light.
If you cover the photoresistor, the resistance becomes higher and the Vout drops.
On the contrary if you flash a light onto it, its resistance reduces and the Vout peaks.
Photoresistor + LED = proximity sensing
The concept
The concept is to have an LED and a photoresistor next to each other, so that the photoresistor can “sense” the amount of light bouncing off an object. The closer you are to an object, the more light from the LED bounces back to the photoresistor and the closer you are.
Schematics compared to the photoresistor alone
The schematic here is slightly different to the one we used before, because the resistor that is paired with the photoresistor is wired BEFORE the Vout reading, rather than after. It results in different readings. Inverted readings really.
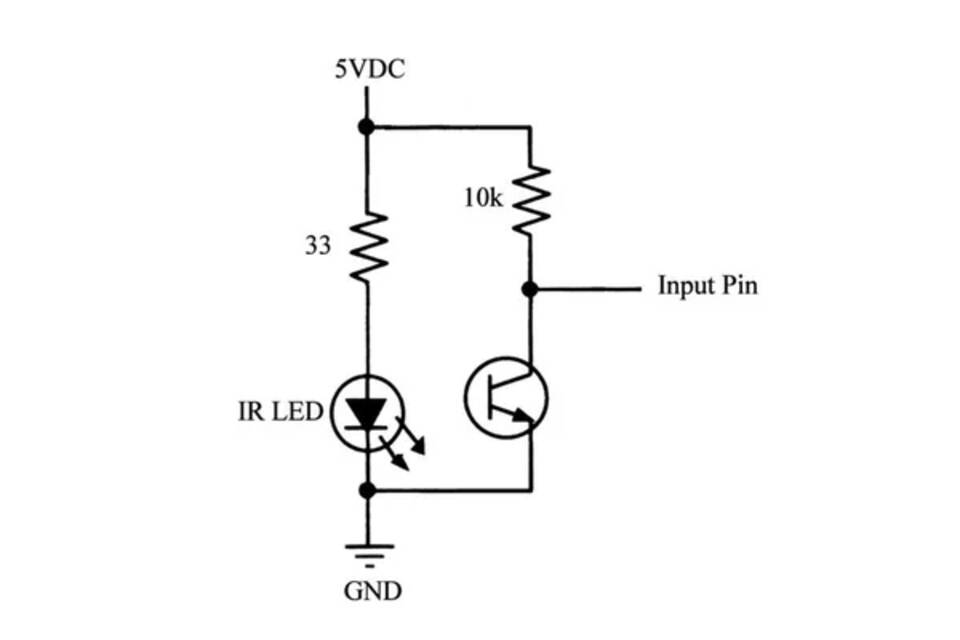
In the previous chapter, when you blocked light from the photoresistor, the Vout dropped, because the resistance of the photoresistor was higher, therefore “stopping” more current from entering the circuit and going to the ADC pin.
In this case the opposite happens. A certain amount of current enters the circuit, goes through the 10k resistor, and if the photoresistor is shaded, then there is more resistance for the current to go to GND, and which results in more current going to the ADC, and therefore the Vout to be higher, as we can see in the Serial Plotter.

When I switched the lights off to be in the dark, the Vout maxed out and therefore the readings couldn’t be done. I was using a 1kΩ so I’ll change to a 10kΩ.
Using a 10kΩ resistor for better read out and going in the dark
The 10kΩ is still not enough resistance, as it maxes out!

I tried with 2 x 20K resistors, and it still maxes out in the dark… damn son.

Only just though, as you can see from this video:
The next resistor I have is a 10MΩ which is probably too much, but let’s try it out. Worst case I’ll go with my potentiometer trick.
… I tried it out and as expected it didn’t work. No need for a screenshot of a flat line. Let’s play with the potentiometer.
Using the potentiometer
This was pretty interesting. In screenshot no. 1 below, you can see I calibrated the potentiometer so that when the lights are off, the line is the highest possible.
When I bring the paper closer, you see the Vout drop as the light bouncing off the paper is becoming more intense and the photoresistor senses that difference. It drops roughly 0.3V.
What’s even more interesting is what happens when you change the resistance of the potentiometer.
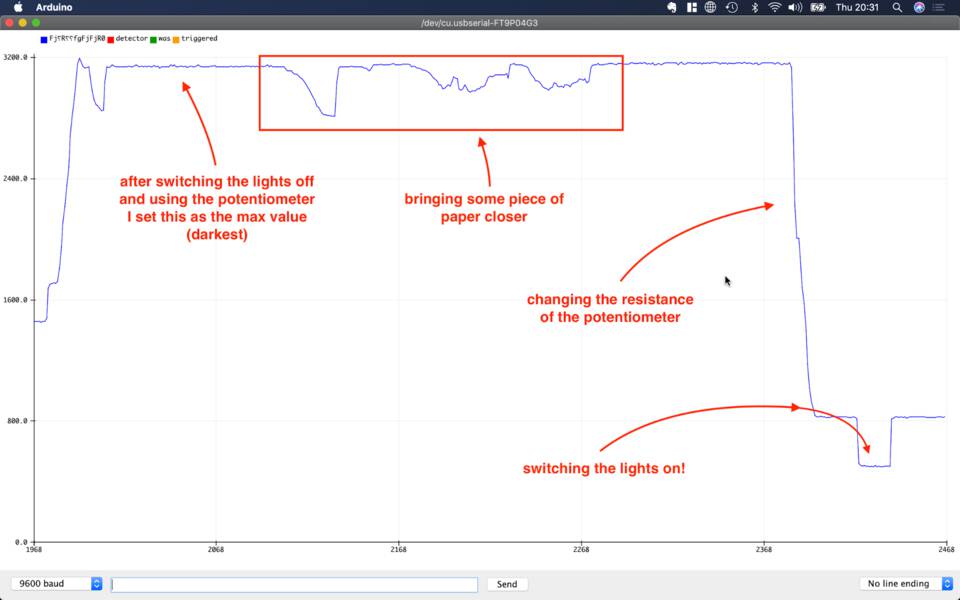
Here I bring the resistance of the potentiometer higher, so that less current goes through to the ADC pin. The first inverse-bump you see is when I switch the lights of the room on… which is waaaay more than just light bouncing off paper, but the recorded Voltage change is roughly the same as in the previous case: 0.3V…
Furthermore, you can see that when I bring the paper closer to bounce light off it, there’s barely a detectable change.

Using the map() function in Arduino IDE
Instead of doing conversion to calculate what was Vout I decided to use the map() function, it goes like this:
map(val, 0, 4095, 0, 33);
where val is what is being read at the input, 0 is minimum value the chip reads, 4095 is the max value the chip reads (remember, it’s 12-bit), and then it tells to map the mininum read value to 0, and its max to 33 (10 x 3.3v).

You notice that the lines are really flat… it seems that by using the map() function you actually lose definition (resolution?). I decided to remap 4095 to 3333, then you can have a very precise reading out Vout.
Conclusion
It is definitely very important to pick the right resistor to get the most accurate data from your sensor. As we showed with different resistors and the potentiometer, the results are very different!
The voltage difference that happens when you bounce off light from a piece of paper can be as drastic as the switching on the lights of the room you are in… it’s all down to what resistor you use with the photoresistor.
I’m feeling hungry now… let’s eat some fruit.
Using a lemon as a capacitive sensor
Alright, maybe a lemon isn’t the best snack to have as a fruit, but I have one that is rotten, and why not give it a “useful” life.
Making the circuit work and plotting on serial
The circuit schematic
Based on the previous examples, I thought I could design this on my own without having to look at a tutorial.

It’s pretty similar to the previous example, where the lemon is the photoresistor, it let’s the current through but acts a bit as a resistor. After the lemon is a cable that goes to the ADC input, and then there’s a resistor between the lemon and ground.
This means that the current goes through the lemon, then prefers to go to the ADC input as there’s a resistor in the way to GND.
When I touch the lemon, some electricity should go through me, therefore lowering the current that goes through the lemon, and lowering the Vout at the ADC pin. Let’s see.
Touching the lemon
Mmh… the voltage is going UP rather than DOWN.
I don’t understand, I thought the Voltage would drop because some electricity goes through me…

Edit: but maybe it’s the opposite… maybe I add electricity to the circuit?
Theory: I add charge to the circuit, rather than taking some
The electric current in my body finds an easier way out through the circuit than going through my body to the ground.
Maybe if I touched the table (or the ground or my laptop) with the same hand that’s touching the lemon the Vout would go down? As there’s less body matter to go through, and therefore less resistance.
Switching an LED on
It’s all nice and easy, but pretty useless. Let’s use the lemon as a switch for an LED.
Threshold
This is not the perfect example as the change in voltage when touching the lemon is drastic enough that we can say: “Ok, when above 1320, switch the LED on. The value is going to be 1380 (+/- 20) so it’s fine”. Drastic enough if we press it hard enough.
In Arduino we can say
if (val > 1320) {
    digitalWrite(ledPin, HIGH);
} else {
    digitalWrite(ledPin, LOW);
}
Actually not it’s not good, because when you press it goes over 1320 and switches the LED on… but then it takes a while for the current to come back down and switch off the LED.

Hysteresis: max value to switch on, min value to switch off
Hysteresis means “a lagging of one of two related phenomenon behind the other”... basically what we’re trying to say is: “don’t switch on and off everytime you go over or under 1320, rather switch on when you go over 1400, and switch off when you go under 1300”. That’d be an hysteresis of 100. Fifty over and fifty under.
Thinking about it… actually it doesn’t make sense in this case. We want it to switch on and off instantly, so we want it to be pretty fast. Let’s code it anyway:
const int threshold = 1320;
const int hysteresis = 100;

if (val >= 1320 + hysteresis/2) {
    digitalWrite(ledPin, HIGH);
} else if (val <= 1320 - hysteresis/2) {
    digitalWrite(ledPin, LOW);
}
This concept is interesting for other things, like controlling the heater or aircon in your flat depending on the temperature.
Using gradient so that we don't have to set a fixed threshold
This one is more useful… it uses the slope of the curve to do actions… which is more useful in our case. If the curve peaks up, it means we’ve touched the lemon and we want to switch the LED on.
If it peaks down, the opposite, the voltage is dropping, we are not touching the lemon anymore, we want to switch the LED off.

I think Oscar’s code is wrong, or at least is too specific to the example given, which is for a threshold of 20 and a hysteresis of 2. His code says:
reading = analogRead(inputPin);
int gradient = reading - previousReading;

if (gradient >= threshold + hysteresis/2) {
    digitalWrite(LED, HIGH);
} else if (gradient <= threshold - hysteresis/2) {
    digitalWrite(LED, LOW);
}
Basically, if reading - previous reading >= threshold + hysteresis/2 then do something.
In my case it wouldn’t work, as one reading is 1220, the next one is 1400, then the difference between both is 180, which is far from being greater or equal than my threshold, 1320.
What I did is set a new variable called amplitude, let’s say 100, and when the difference between two readings is greater than this amplitude, so if the voltage rises quickly, then switch the LED on.
Same the other way, if the difference between the two readings is less than - amplitude ( -100), then the voltage is falling quickly, so let’s switch the LED off.
Note //
Oscar later pointed out to me that basically what I did, is the same equation as his, except that I have a threshold of 0 and a hysteresis of 100. I was the one who was wrong.

It does work, it lights up when there’s a sudden spike in the analog reading, and it stays on until there’s a sudden drop in the reading. Nice.
Let’s make this graph smooooth
Filtering
I was thinking of using a photoresistor but from the previous graph it isn’t veeeerrryyyyyy noisy, not as much as the lemon was. It is for this reason I’ve chosen: a potato.
Hopefully it will be noisier than light.

Daaaaaamn son, this is noisy. Not sure if it’s not broken or something.
Hard-coded, stupid code
I used Oscar’s quick-and-easy solution here, called smoothing.
Here’s the signal after filtering, damn son.

Changing the delay to something faster.

Mmmh… weird. I tried different settings, it smoothed it out, for example numReading = 20 and delay(20).

At some point it starts oscillating between roughly 757 and 770, which are very close. I guess it is because it so zoomed into the values, that it can't be smoothed further. It's either 764.0 or 765.0 but it can't be 764.5.

Nice, clever convolution
I haven’t played much with convolution, but I still copy and pasted Oscar’s code in Arduino and set it up, but it seemed to still be very noisy.
Ooooh… I was using the wrong pin…
In the code, I mean.
All along I was measuring what I thought was the input… but it actually wasn’t. I unplugged it and the Serial Plotter continued plotting away happily.
Then I saw the code… oooooh it says analogRead(ledPin)... rather than the adcPin! The ledPin in the Barduino is also an ADC pin, so it wasn’t a problem,
it was just floating up and down, mildly affected by the LED and potato.

Let’s plug it back in, change that little mistake.
Working better now
Well, I mean, we were trying to smooth out noise, so it didn’t matter if the input was any good or not. In any case, it taught us the basic thing: check your code (before you wreck your code).

Before and after smoothing
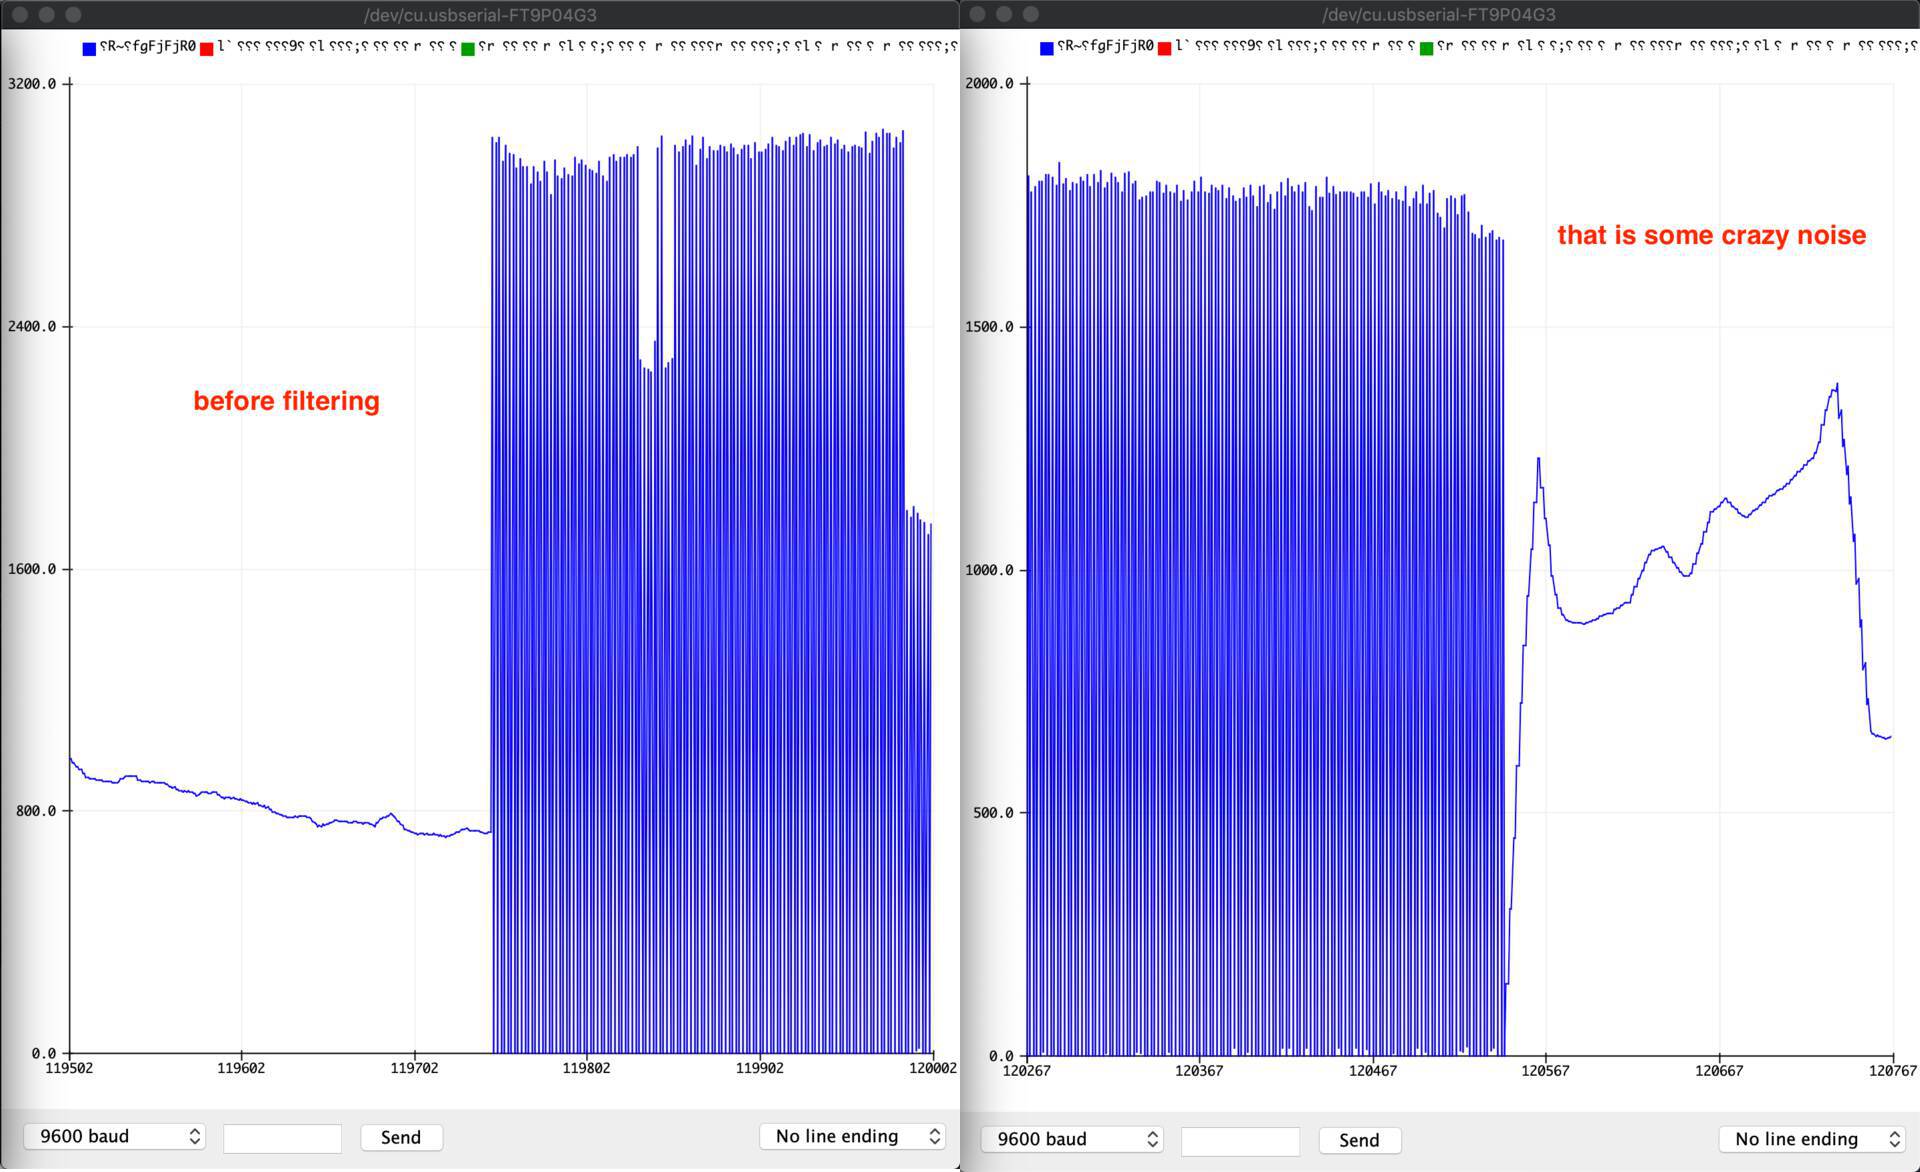
That's pretty impressive... I'm surprised actually... is there something wrong with my board? haha
Designing a chip with a sensor
Before anything, make sure to download the fab_2020 libraries for Kicad. They are also included in the download link of this week.
Eeschema, picking the components
Using some random mounting holes and potentiometer
There weren't any potentiometer or mounting hole pads in the Fab Library, so I picked some random ones in the Kicad library. I’m not actually going to make the board, so it doesn’t matter which one I pick.

Wiring up the components
Okkk, it’s a pretty simple circuit, we just place the FTDI, ISP, ATtiny45 down, link everything that needs to go to VCC

Generating our Netlist
Cool, everything is good. Let’s Generate the Netlist and then open in PCBeditor.
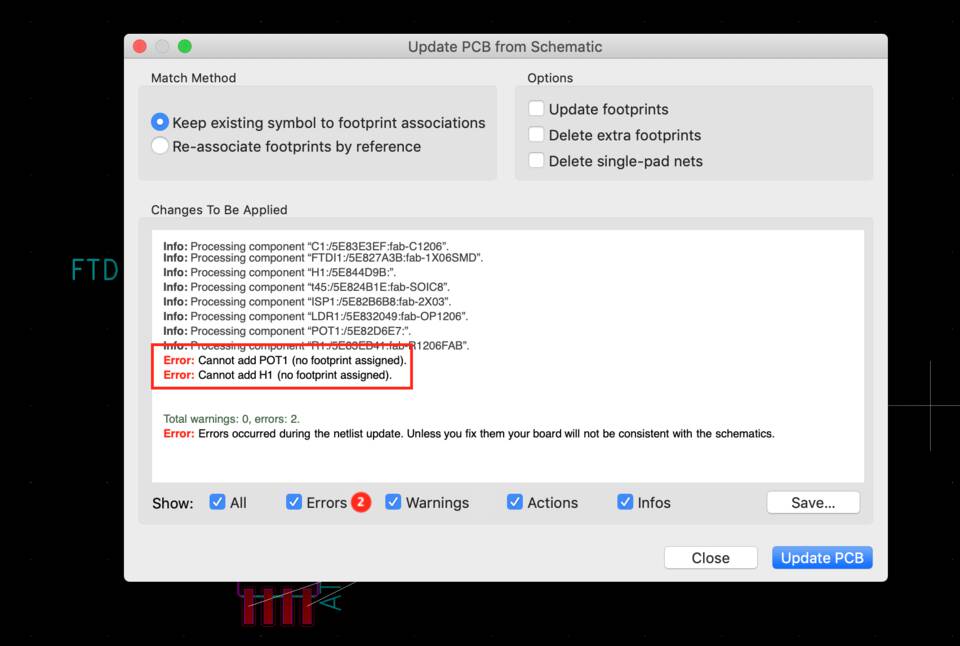
Ah… PCBeditor says “we don’t have the footprints, nooo!!! We can’t show you your beautiful components.” (something like that). That’s annoying, it means we can’t wire things up and print our circuit. We need to find a solution.
Oops, missing the footprints
Of course, because Kicad makes no sense, the imported libraries by default don’t have footprints. Maybe it does make sense, I just don’t know how it works.
If I open the Footprint library I find loads of mounting pads and potentiometer footprints, but none of them are linked to symbols (or I don’t know to which ones they are).

The footprint and the symbol do exist, it’s just a matter of linking them together.
Linking any symbol to any footprint
I did some good ol’ Googling around, and found this (excellent) video - An Intro to KiCad – Part 5: Associate Footprints and Generate Netlist | DigiKey. In 5 mins I learned loads, I should watch all the others.
Useful tip: I learned that when you add resistors, capacitors, or any components, leave the ? in the reference in place (i.e. don’t rename R? to R1), but do edit its value, for example 220Ω. When you finished with your circuit you simply click here

Now, what we actually come to this video for, was to link a symbol with a footprint. In my case I used a Potentiometer from the Device library, and a MountingHole_Pad from the Mechanical library.
In this magic top bar of Eeschema, if you hover on the button on the right of the ladybug, it should say “Assign PCB footprints to schematic symbols”, which seems to pretty much do exactly what we want to do. Let’s click it.

You can now:
- Choose your symbol from the middle panel,
- Go the library you interested in the left panel,
- Choose your footprint from the right panel (yeah, the order of the panels don’t really make sense)
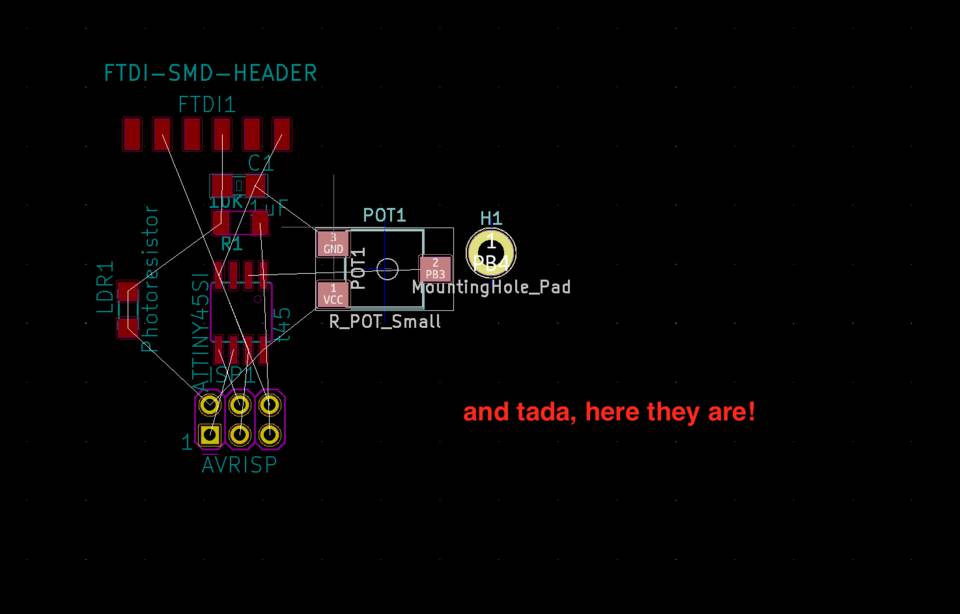
Tada! That was easy.
PCBeditor, placing the components
Nothing out of the ordinary here
Just repeating what we did in Week 6. Electronics Design, except this time it’s even easier.
One little hiccup was that I picked the wrong ISP header in the Eeschema, and so the pins were very close to each other and made it impossible to design the board.

When I noticed I changed it and it was much better. Loads of space to trace between the pins.

Finished the design, export the files
Placing the components and wiring everything is finished.
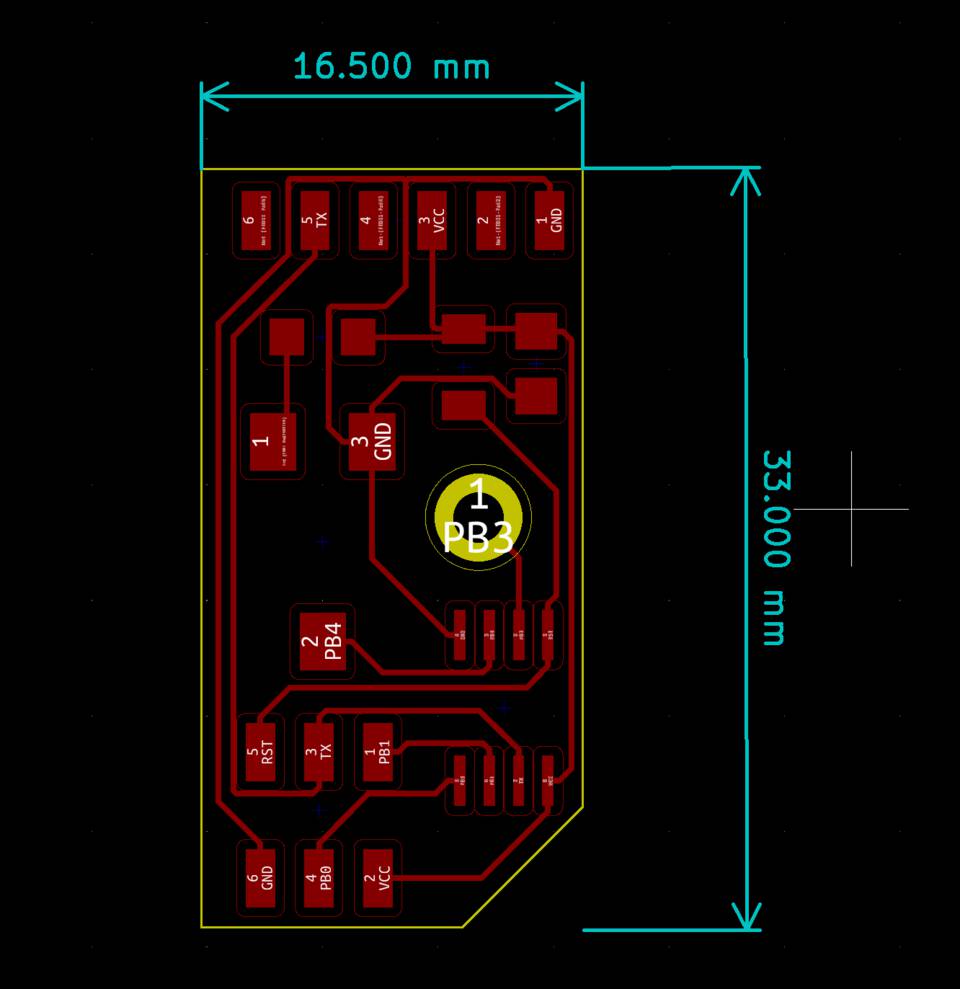
Ready to export. Same settings as in Week 6, except this time I made sure to draw the outline of my board in the Edge.Cuts layer on the right.

Let’s send it to mill...
POST-CONFINEMENT UPDATE
WAIT A MINUTE…
We are now in October and I’m finishing my documentation. I hadn’t the chance to produce for some reason you might not be aware of.
I’ve changed the board a tiiiiiiny bit. I replaced the potentiometer with a resistor, and then because it saved some space I moved the ISP up a bit which made the board a bit smaller. I also added two extra connections to VCC and GND, in case we want to power something and read a signal with the extra free pin.
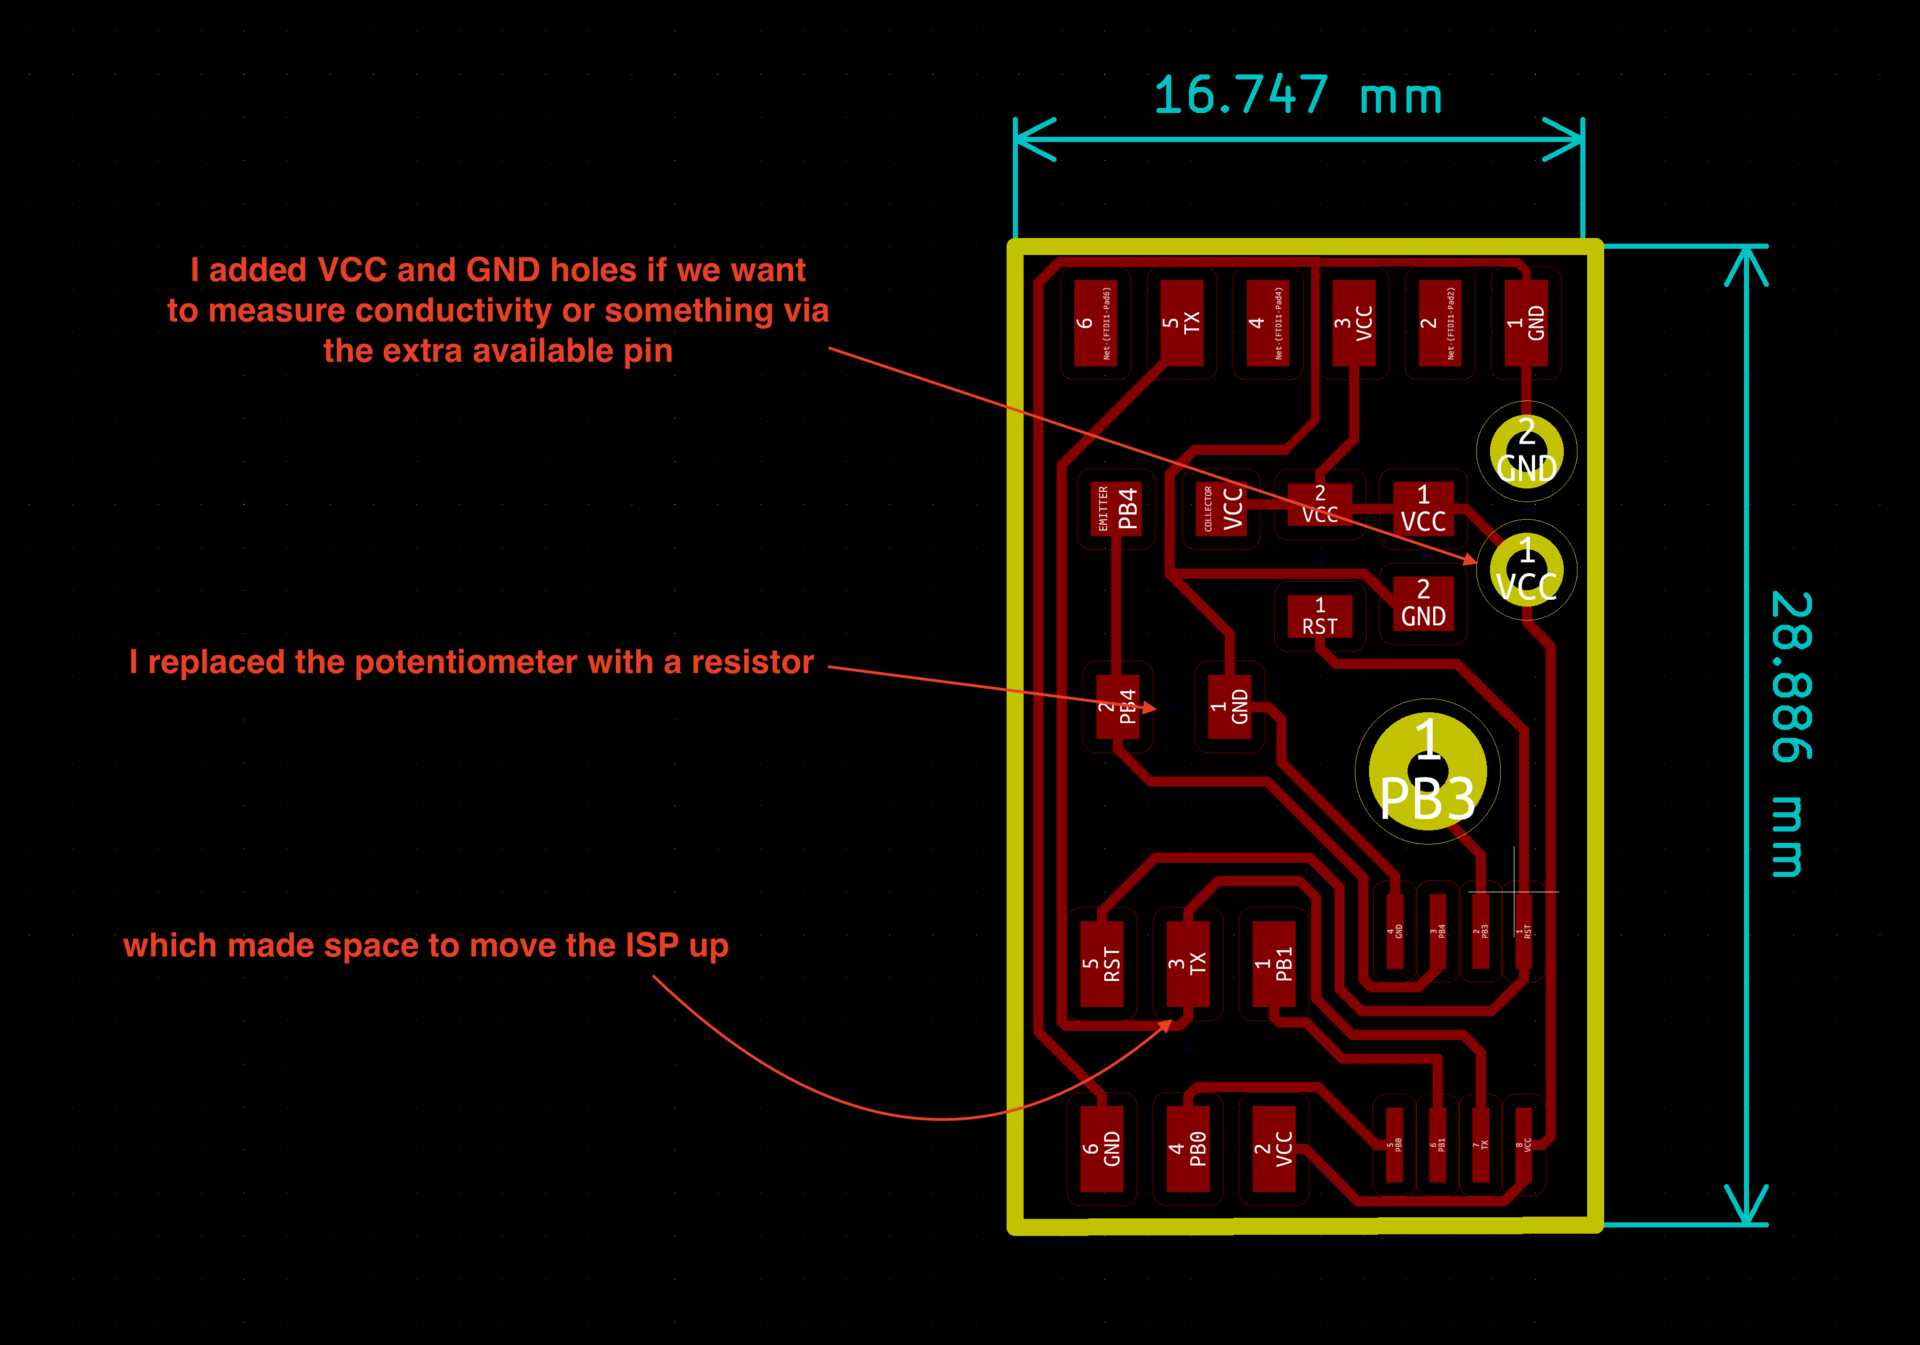
Exporting for mods
Once again, export to mods. I used Oscar's excellent script here to do everything nicely. It’s very nicely documented, so no need to go through it step by step. I do have a note or two.
By running the first script Fablab Exports you create SVGs of the board’s different layers. All good here.
The second script exports those SVGs into PNGs that can then be used in mods.
Oscar simplified what you need to write in the command line by creating symlinks and commands.
In step 1. of Inkscape in command line you create a symlink (short for Symbolic link). Basically you say “when I call this file, run the file it is linking to that is located in this folder”.
In step 2. you do something kind of similar, you say “ok, if I type in this command, replace it with this command”. It just helps cleaning up the command line.
Now if you type inkexp * it’d be the equivalent to type /usr/local/bin/inkscape --export-area-drawing --export-type png --export-dpi 999 -y 255 *
If it’s too complicated for you, or you are not planning to use those few lines of code often, you can jump all the shortcuts and write:
/Applications/Inkscape.app/Contents/MacOS/inkscape --export-area-drawing --export-type png --export-dpi 999 -y 255 *Boom! Now we have our PNGs for mods, we can create the files.
Note //
Actually, they are almost ready. For some reason FILENAME-Edge_Cuts.png includes the outline of the board. It isn’t a big problem in itself, but it will take longer to mill, as mods will think they are traces. I like to open the PNG with any image editor and cover the border with white.
Generating the G-code files in mods
You have to generate the G-code files for the traces and the outlines. They are very similar steps, except for the size of the tools and the depth of the cut.
For the traces
- Open mods.
- Right-click programs > open server program > Roland SRM-20 > PCB png
- select png file, and select the png file
- The script will mill out everything that shows in black. In our case we see the traces in black, which is not what we want. Click invert to invert the colors.
- In the next module, set PCB defaults, select mill traces (1/64) - that’ll will automatically fill the right values in the next module
- You shouldn’t need to change anything in mill raster 2D
- In the Roland SRM20 milling machine module there’s a few things to change
- Set all x, y and z origins to 0
- Set the jog height to 5mm (it’s safer)
- Delete the WebSocket device module
- Add the save file module by right-clicking modules > open server module > file > save
- Connect the Roland SRM20 milling machine and save file modules by clicking on the outputs of the first, and then click on the input of save file.
- Finally click on calculate of the mill raster 2D module - that'll calculate and save the file. It should also automatically open a tab showing the path. If not, you can click view.
For the outlines and holes (drills)
- Open mods.
- Right-click programs > open server program > Roland SRM-20 > PCB png
- select png file, and select the png file
- In the next module, set PCB defaults, select mill outline (1/32) - that’ll will automatically fill the right values in the next module
- You shouldn’t need to change anything in mill raster 2D
- In the Roland SRM20 milling machine module there’s a few things to change
- Set all x, y and z origins to 0
- Set the jog height to 5mm (it’s safer)
- Delete the WebSocket device module
- Add the save file module by right-clicking modules > open server module > file > save
- Connect the Roland SRM20 milling machine and save file modules by clicking on the outputs of the first, and then click on the input of save file.
- Finally click on calculate of the mill raster 2D module - that'll calculate and save the file. It should also automatically open a tab showing the path. If not, you can click view.
And voilà! You have your .rml files ready to send to the milling machine.
Milling the board
As always, open the software, set the X/Y and Z origins, etc.
The traces and holes were fine but then I ran into an error when milling the outlines.
When I created the RML files in the previous step I added some margin on the outline png so that mods could detect the edges better... but I didn't add that same margin to the other PNGs which means that the origin for the OUTLINE G-code was different to the TRACES and HOLES files.
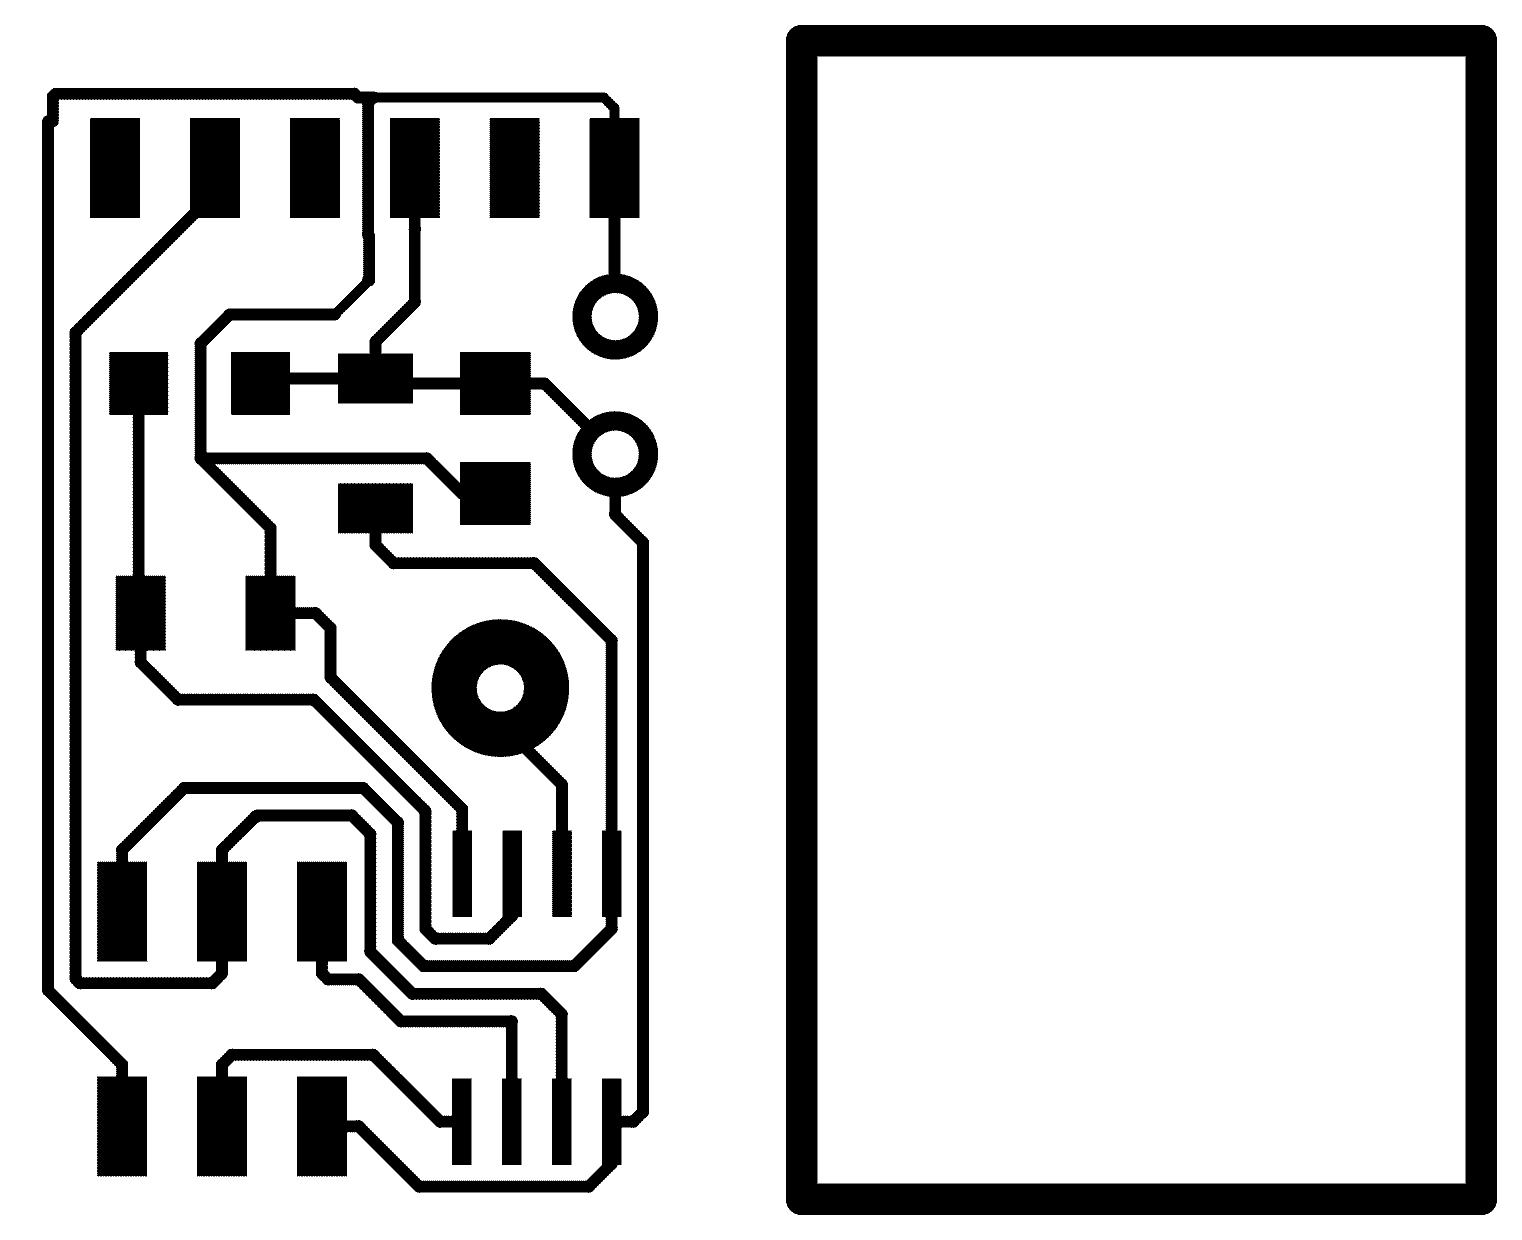
As you can see on the left the outline is overlapping with the traces and on the right it’s quite far.
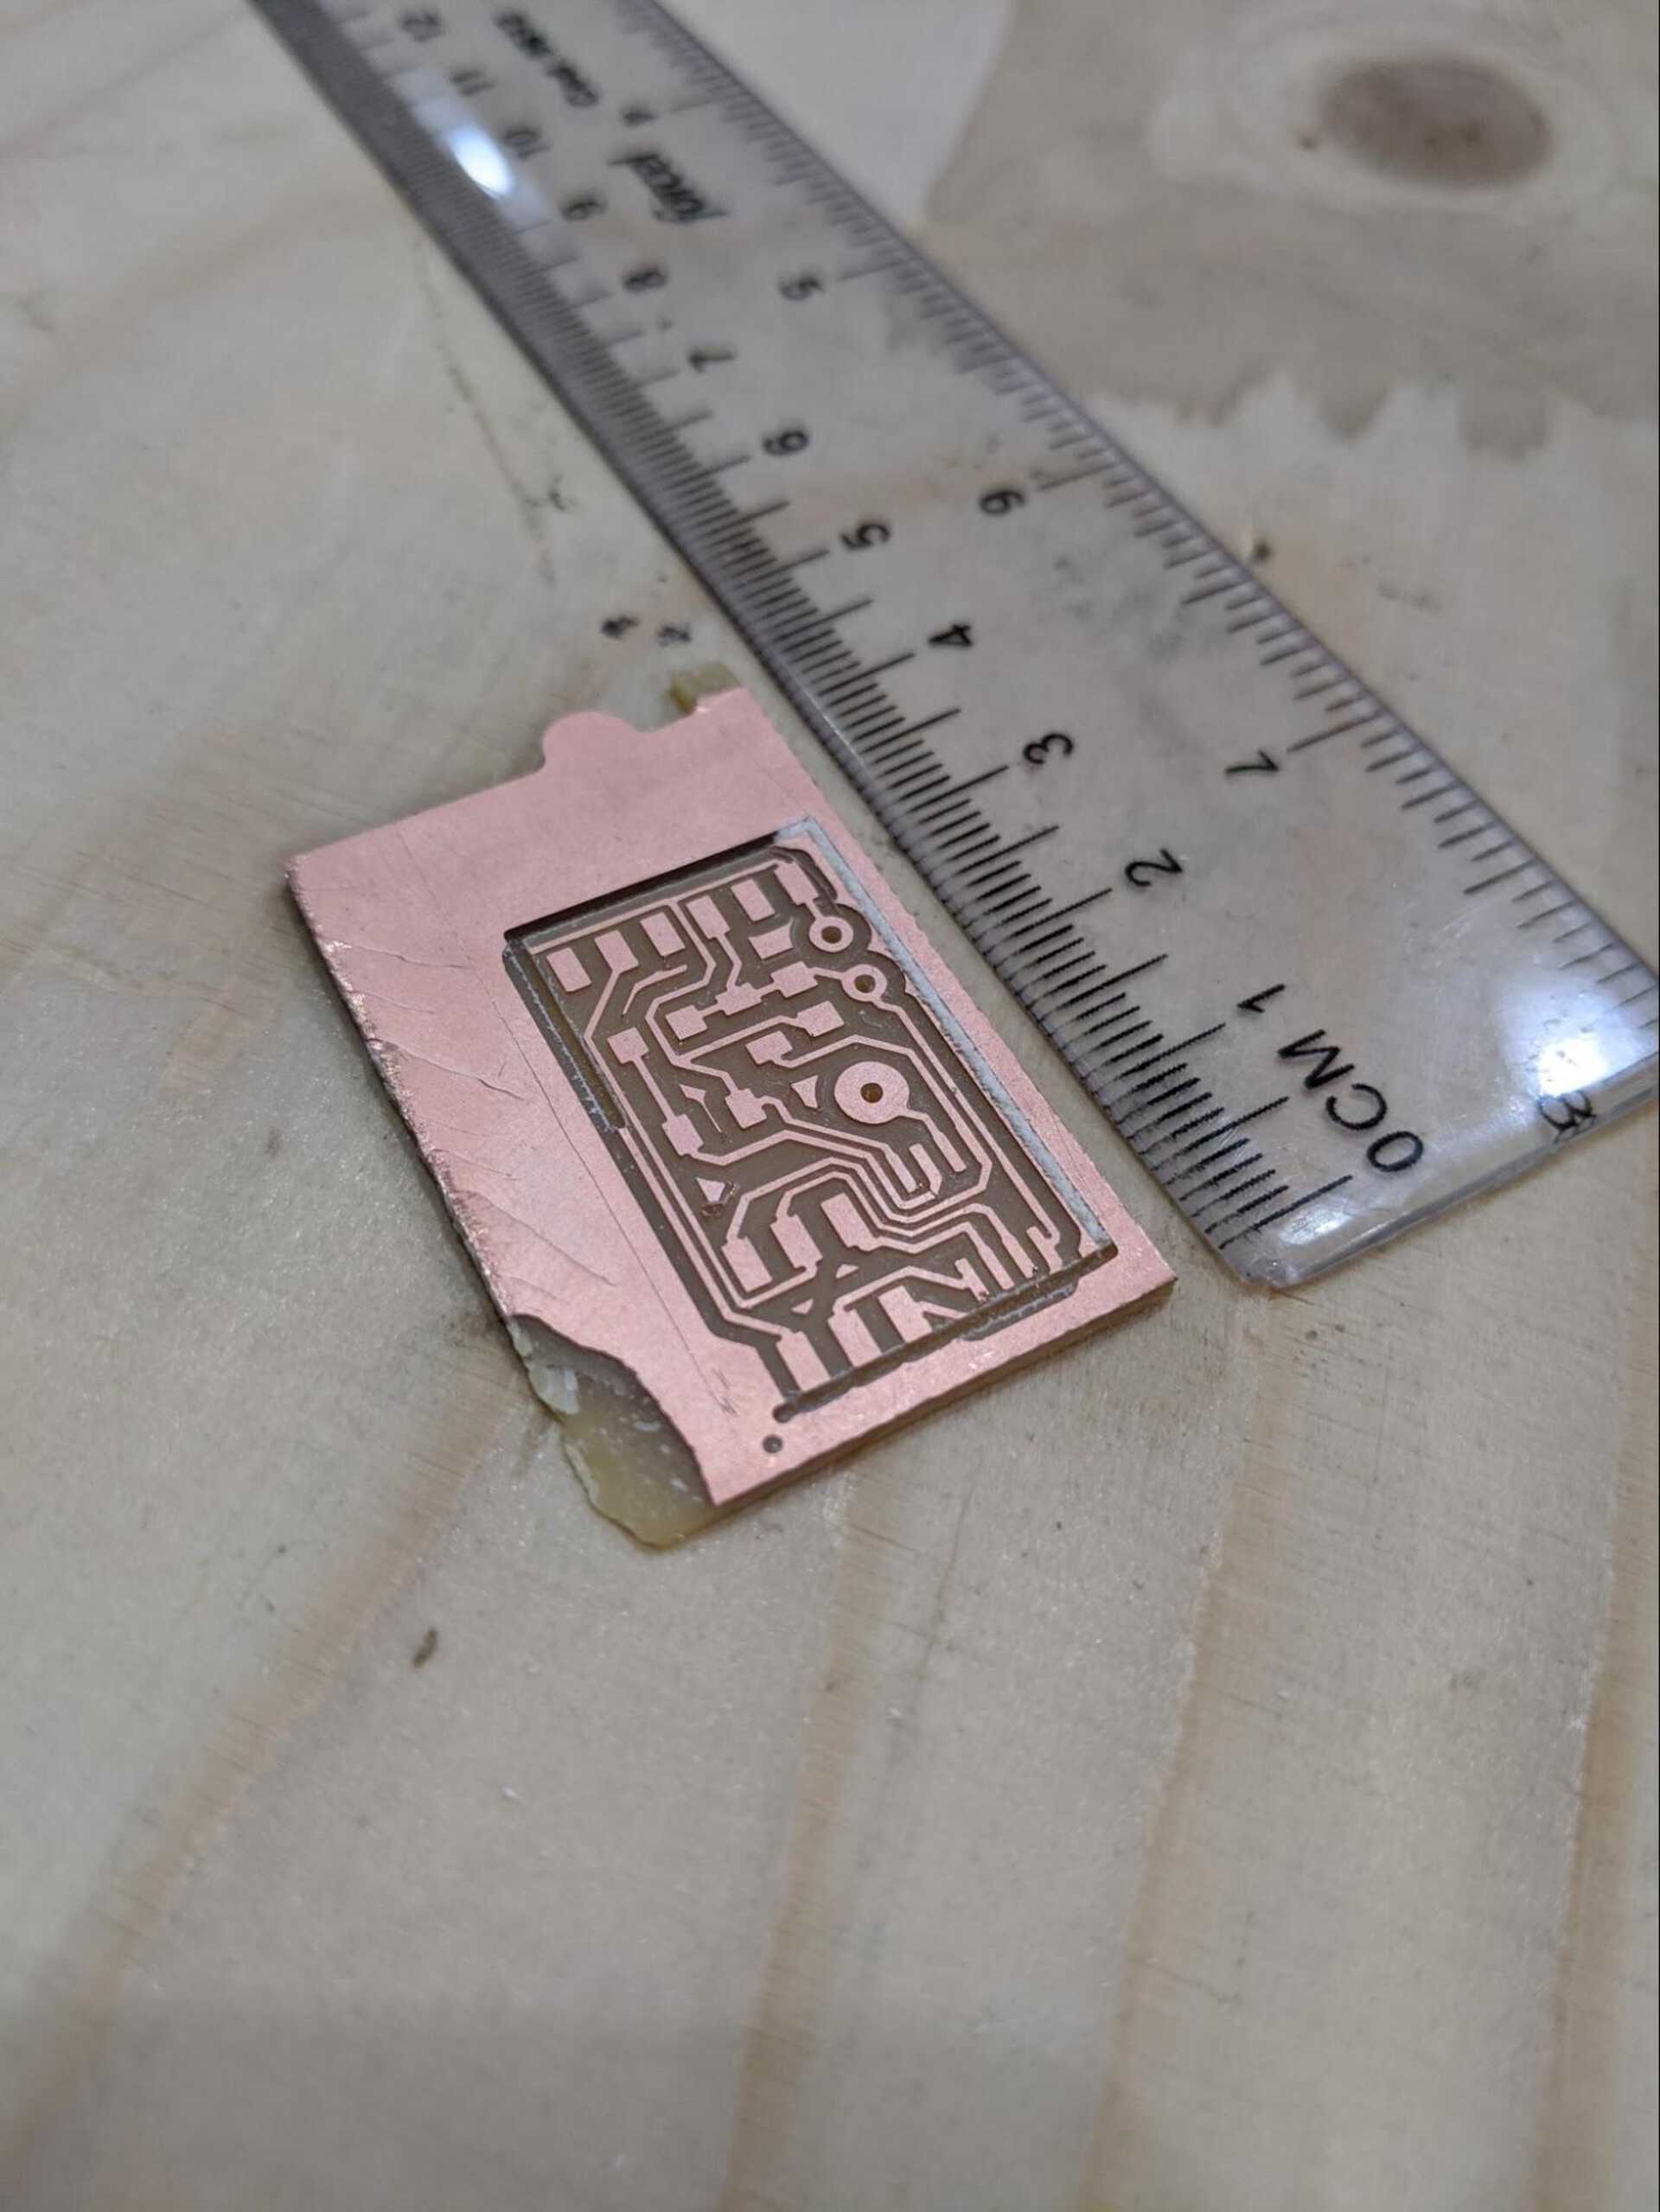
You can see it in the final result. The trace was being deleted by the outline. I cancelled the mill, had to bin the board and remade the files without adding a border.
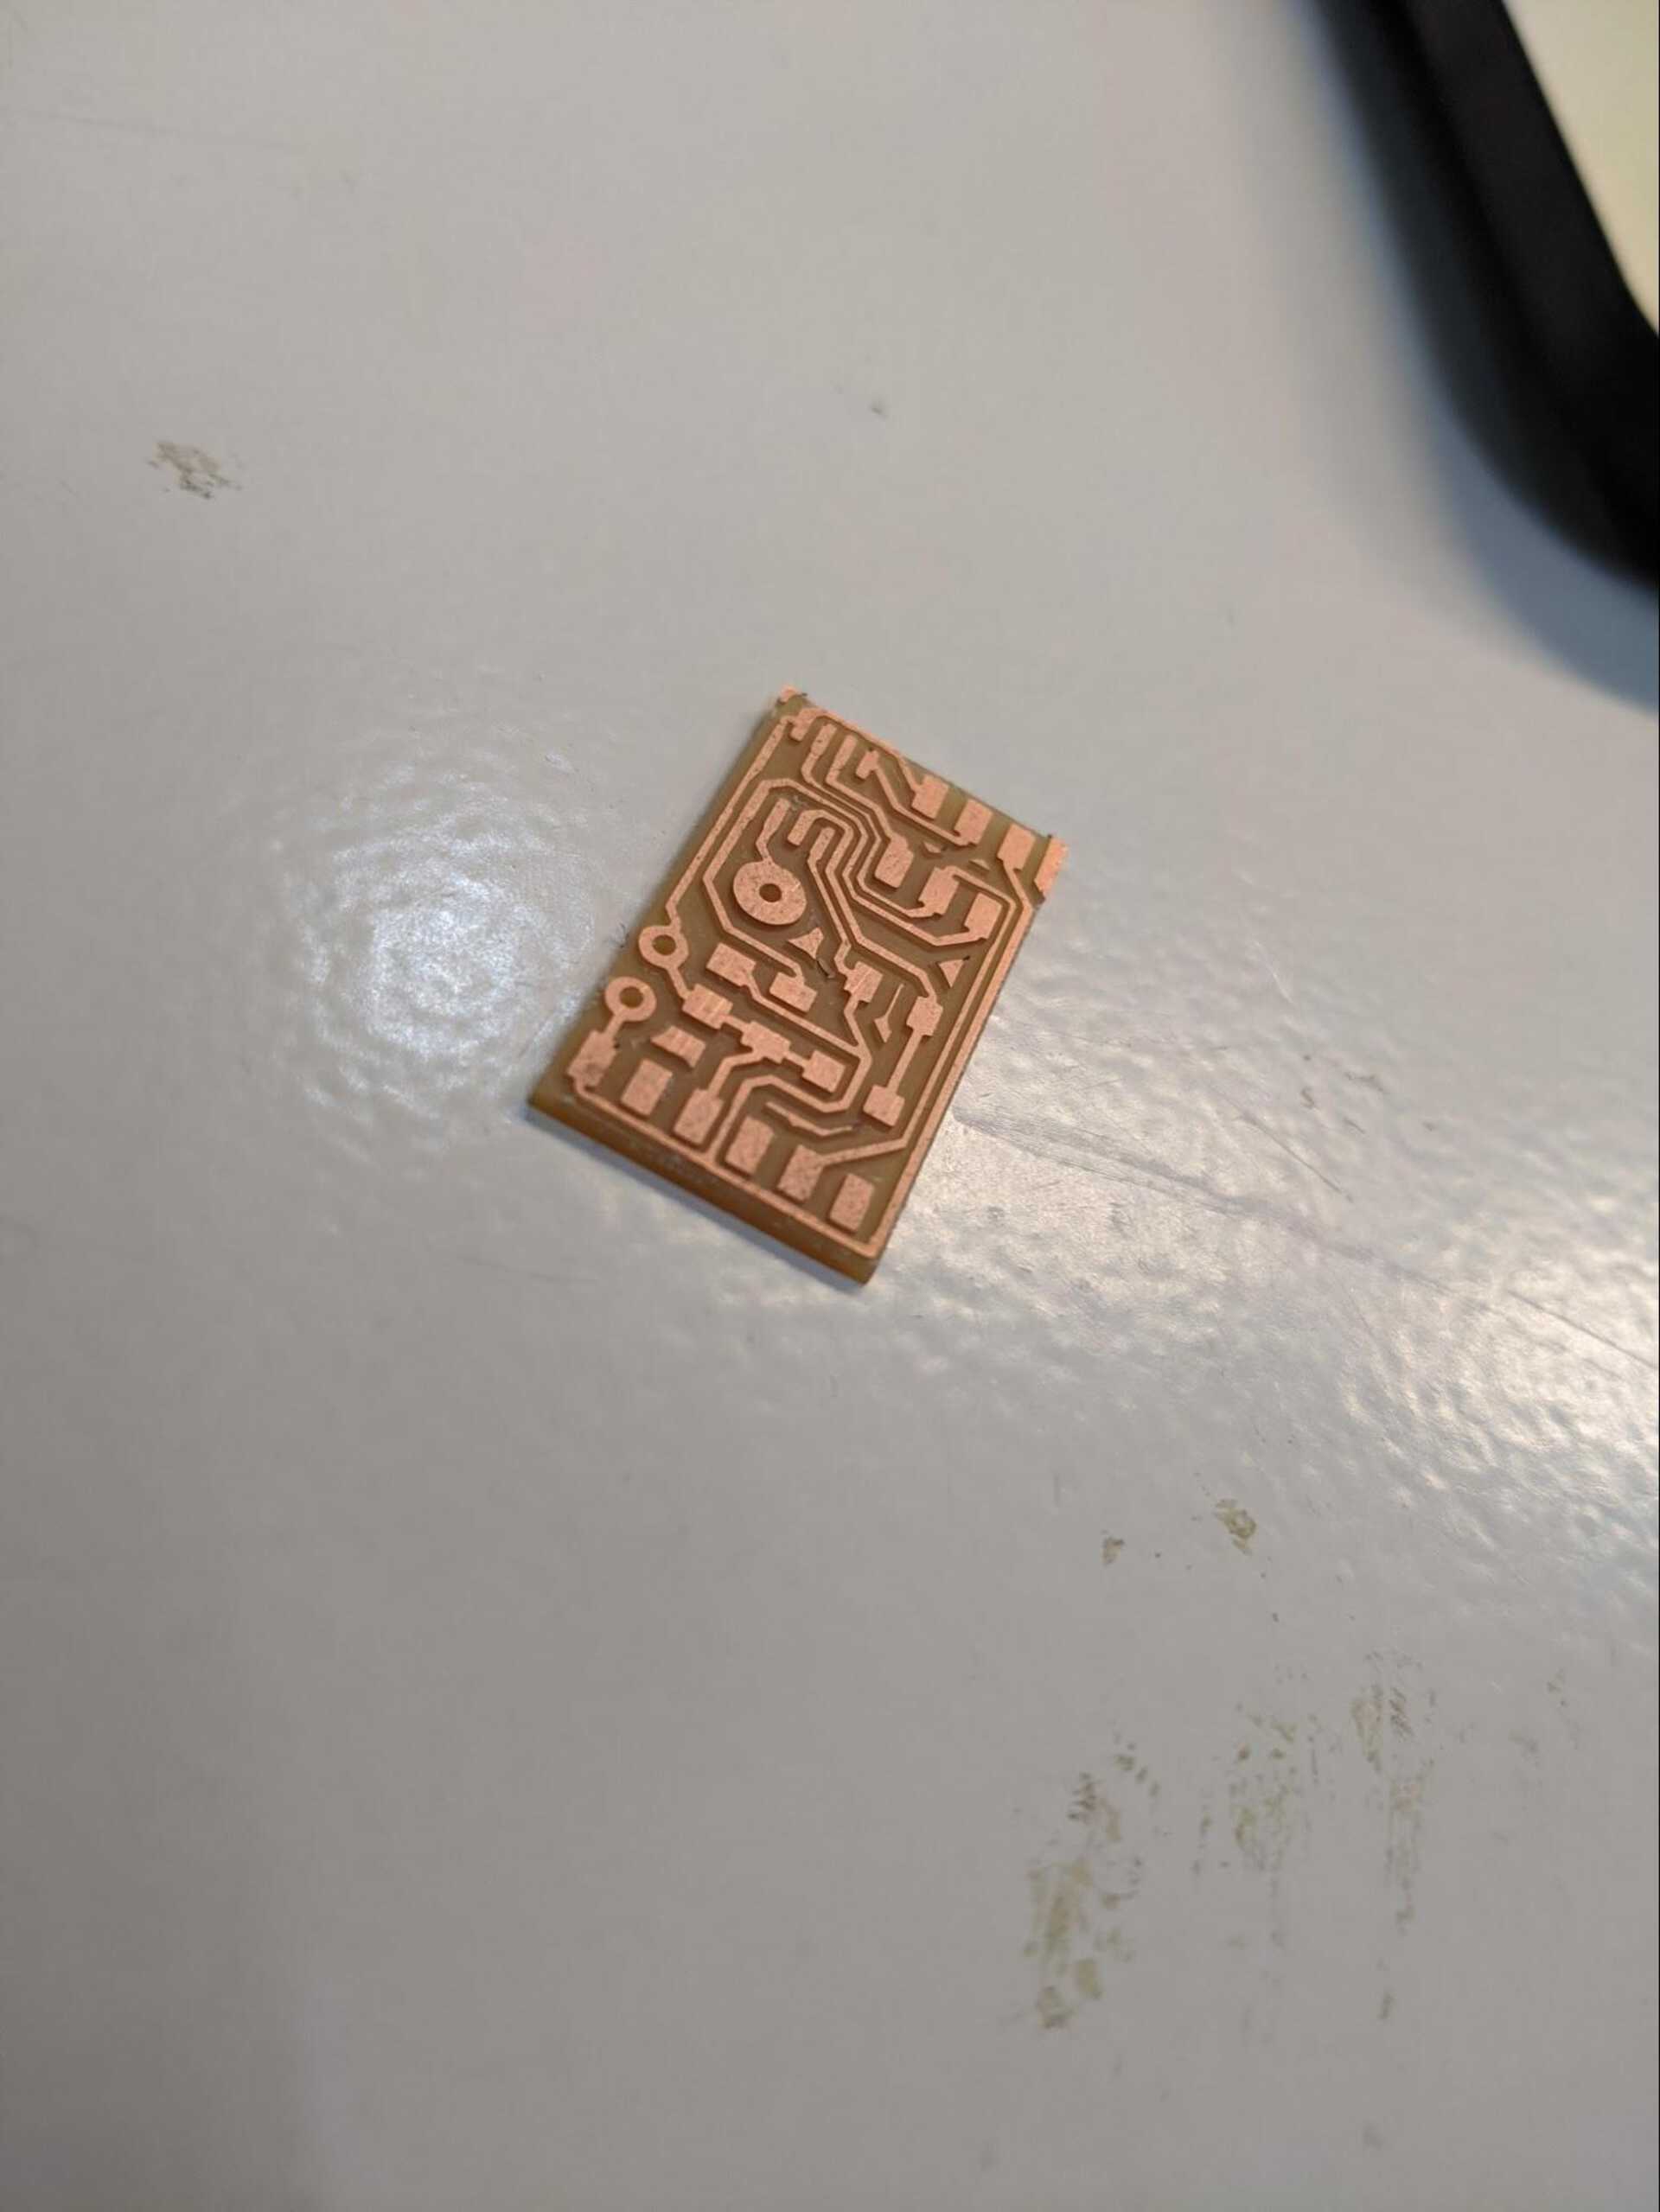
… and it worked fine! The outline is still quite close to the traces, in the future I should draw the outlines of the board a bit further away. It’s on the limit.
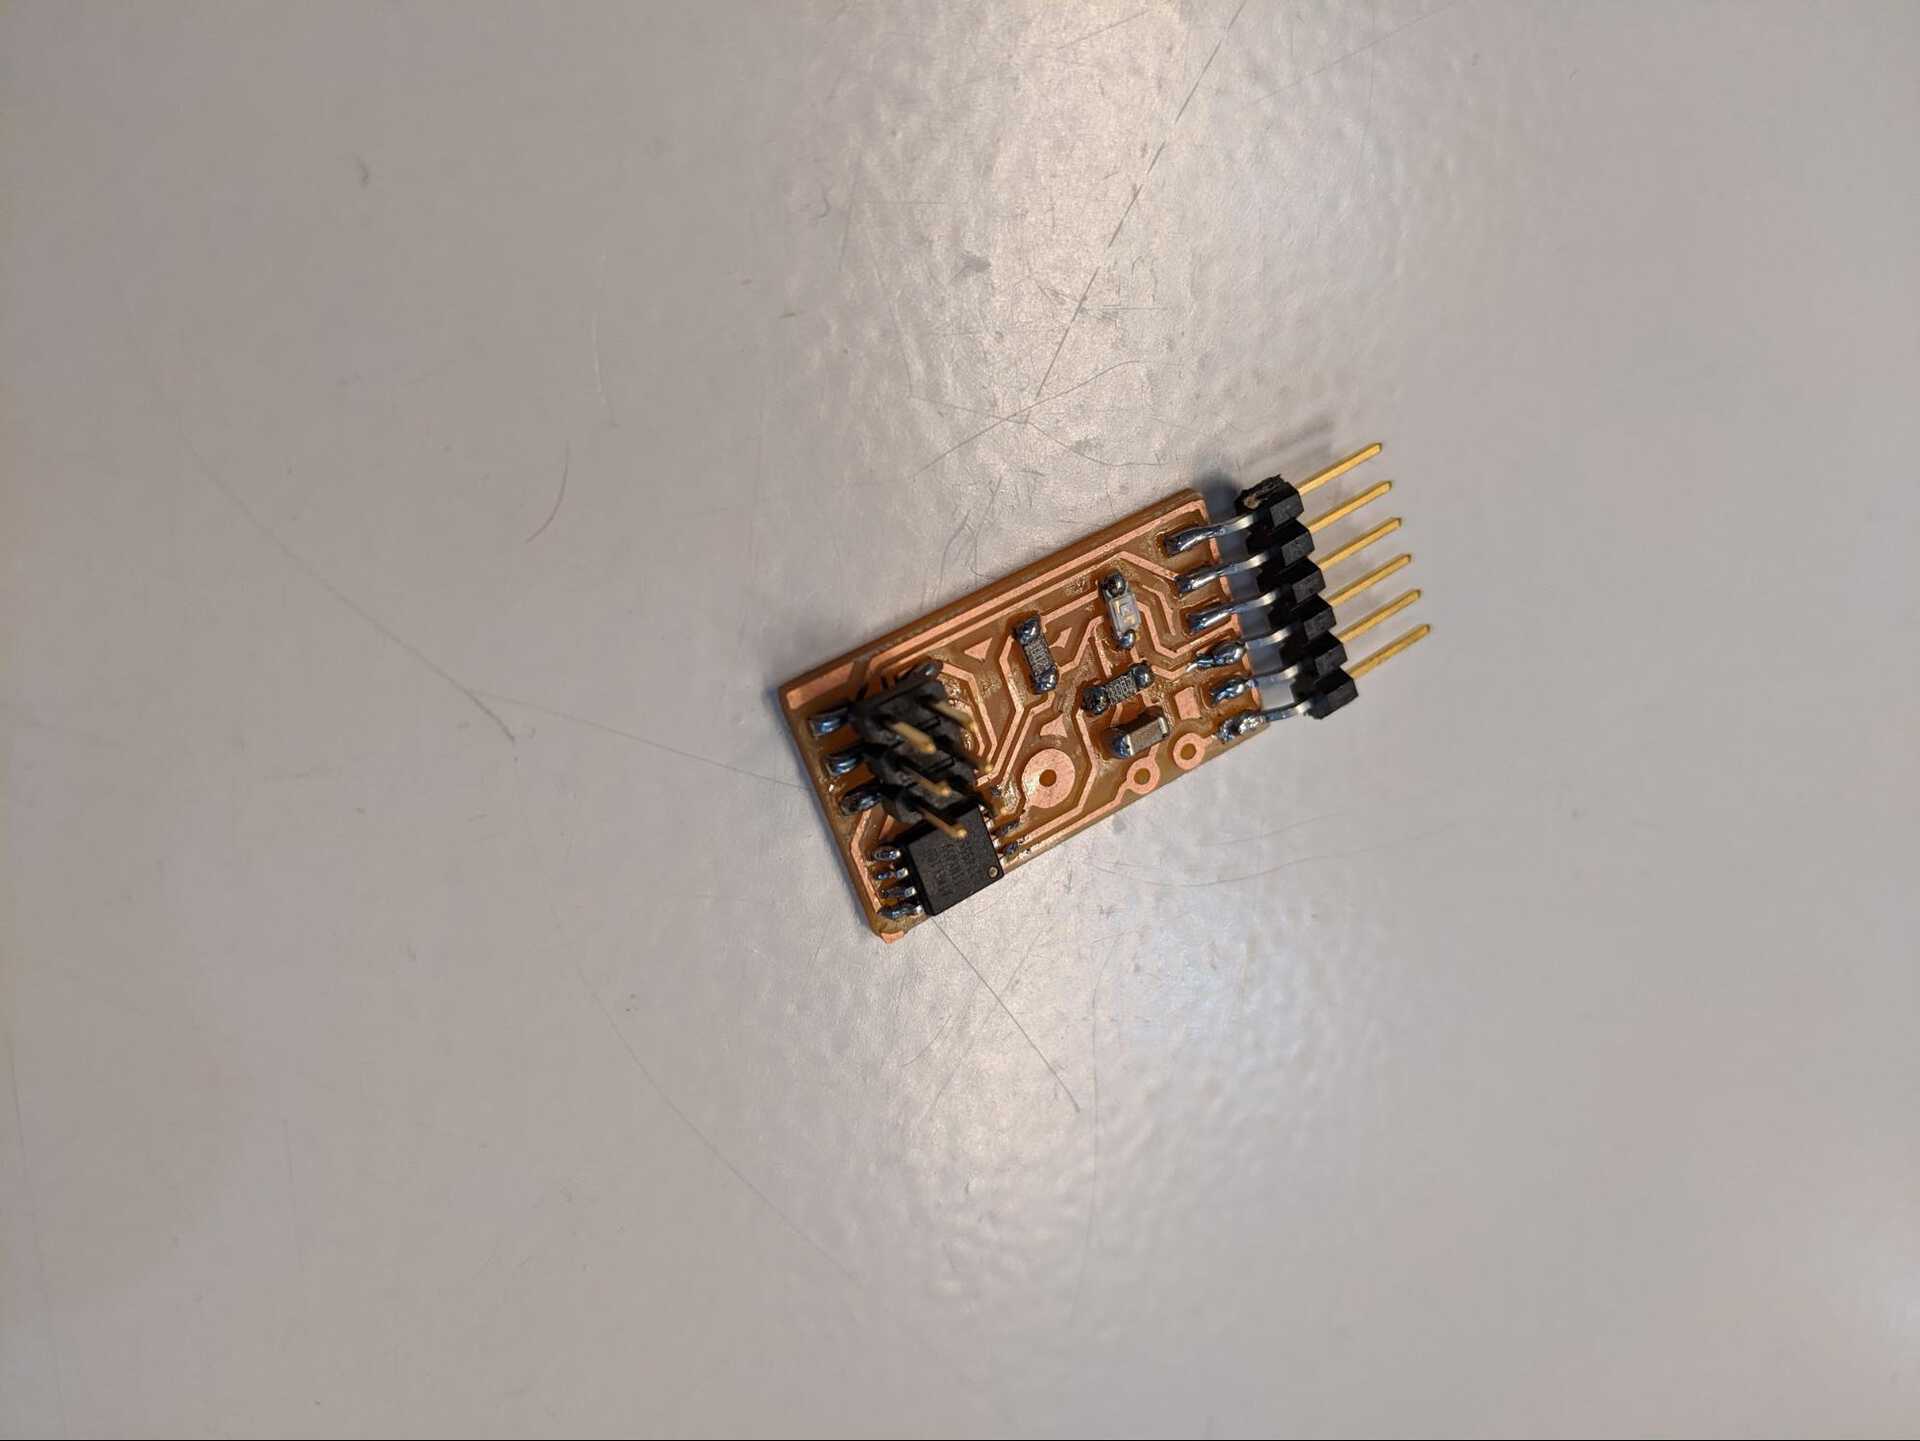
Here’s the final board after being soldered. I used the datasheet of the ATtiny45 to make sure to solder the right way. Time to program it.
Programming the board
I think I could use the same as I did in Electronics Design and use an Arduino to program the ATtiny with UPDI, but I’m not sure if that allows for reading the serial through the FTDI / UPDI.
When I designed this board back then, during confinement, I used the ISP 6 pin-header thing (apparently it stands for in-system programmer) because that’s what was being used in the example Neil gave. That means I have to use the AVRdudeISP mkII machine thing to program the chip.
Making it blink
FYI, I’m following this tutorial: High-Low Tech – Programming an ATtiny w/ Arduino 1.6 (or 1.0)
It’s pretty simple.
All you have to do is:
- Add the ATtiny boards to the Additional Boards Manager URL in Preferences: https://raw.githubusercontent.com/damellis/attiny/ide-1.6.x-boards-manager/package_damellis_attiny_index.json
- Head to Tools > Boards > Boards manager and install the ATtiny boards
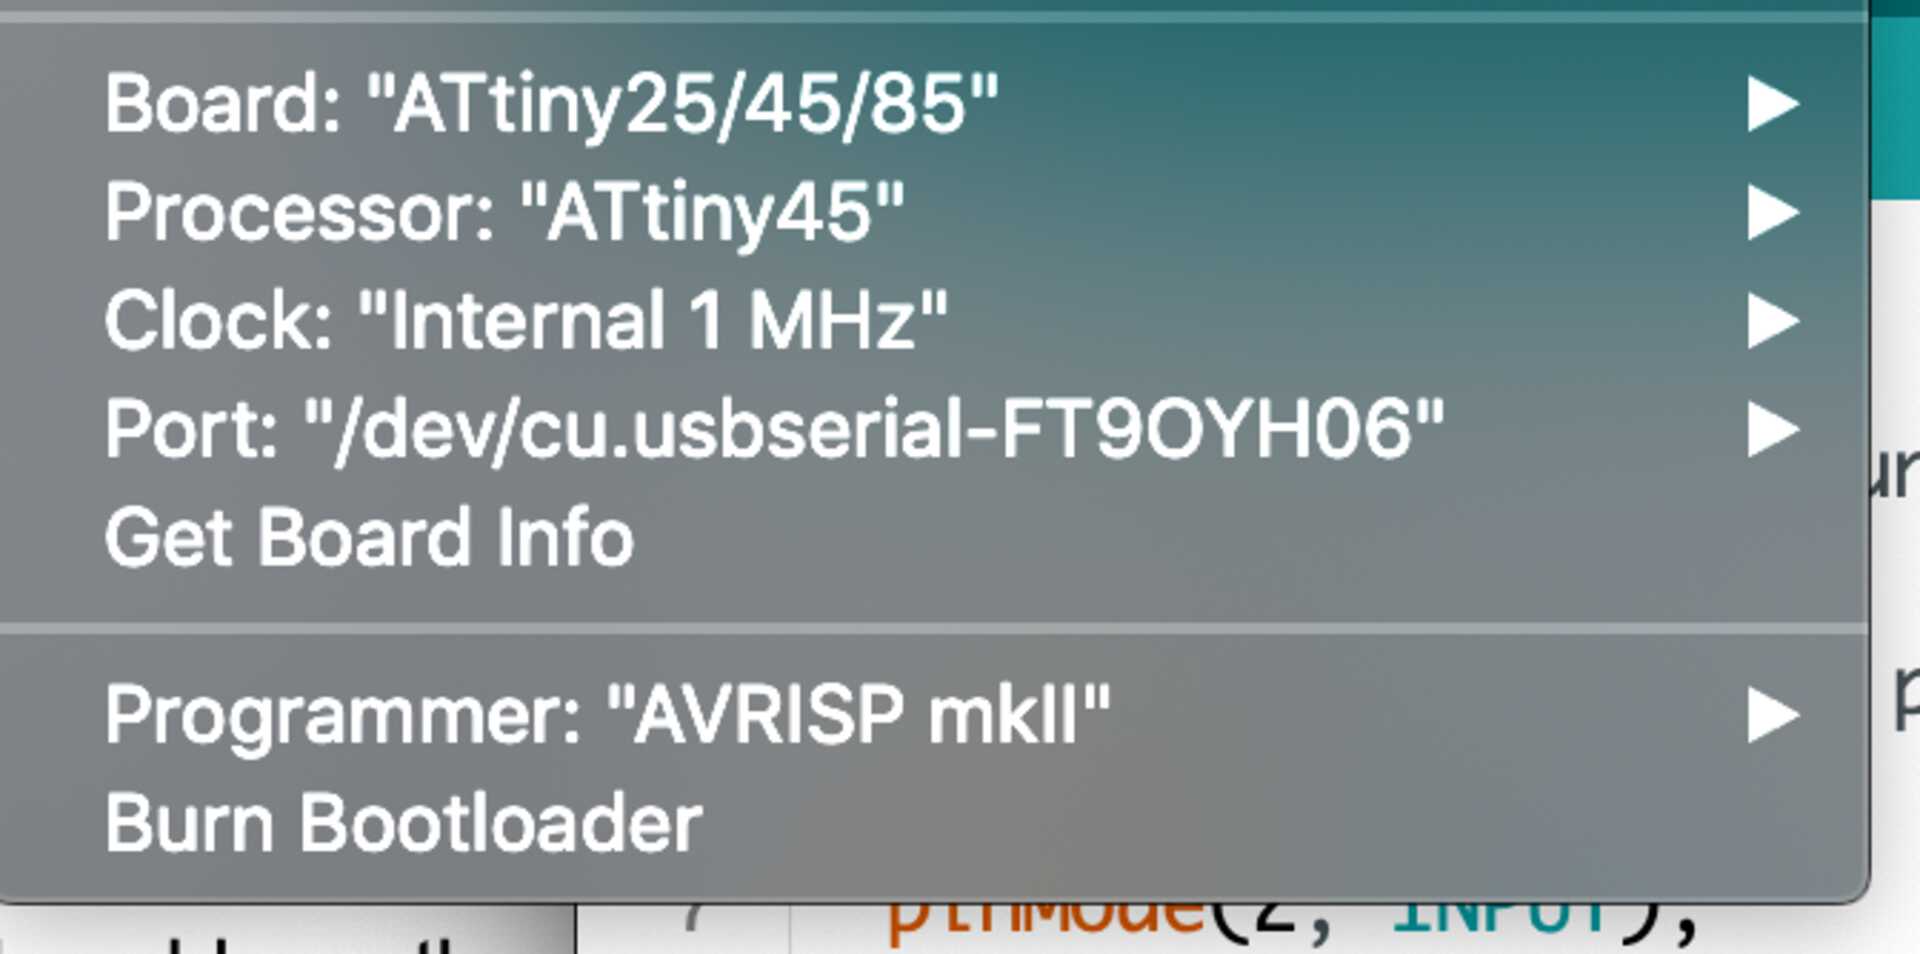
- Open a Blink example and select these settings in Tools:
- Board: ATtiny25/45/85
- Processor: ATtiny45
- Internal 1 MHz (I had selected 8MHz and 1 seconds becomes 8 seconds)
- Port: weirdly here I chose the FTDI cable, the AVRISP mkII didn’t show in the list
- Programmer: AVRISP mkII
- Upload the program. It should just work.
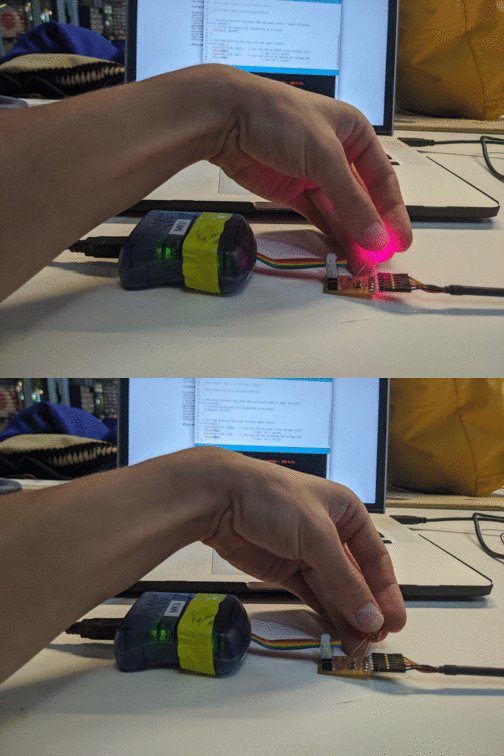
I managed to make an LED blink with the spare pin, so we know it’s been programmed successfully (on top of the success message Arduino IDE gives you).
Reading the phototransistor data
Now, I added a phototransistor to the ATtiny45, and I want to read the value through Serial, but it seems when I try to upload the sketch it gives an error saying ‘Serial’ was not declared in this scope.... Maybe the Serial
library doesn’t work for ATtinies?
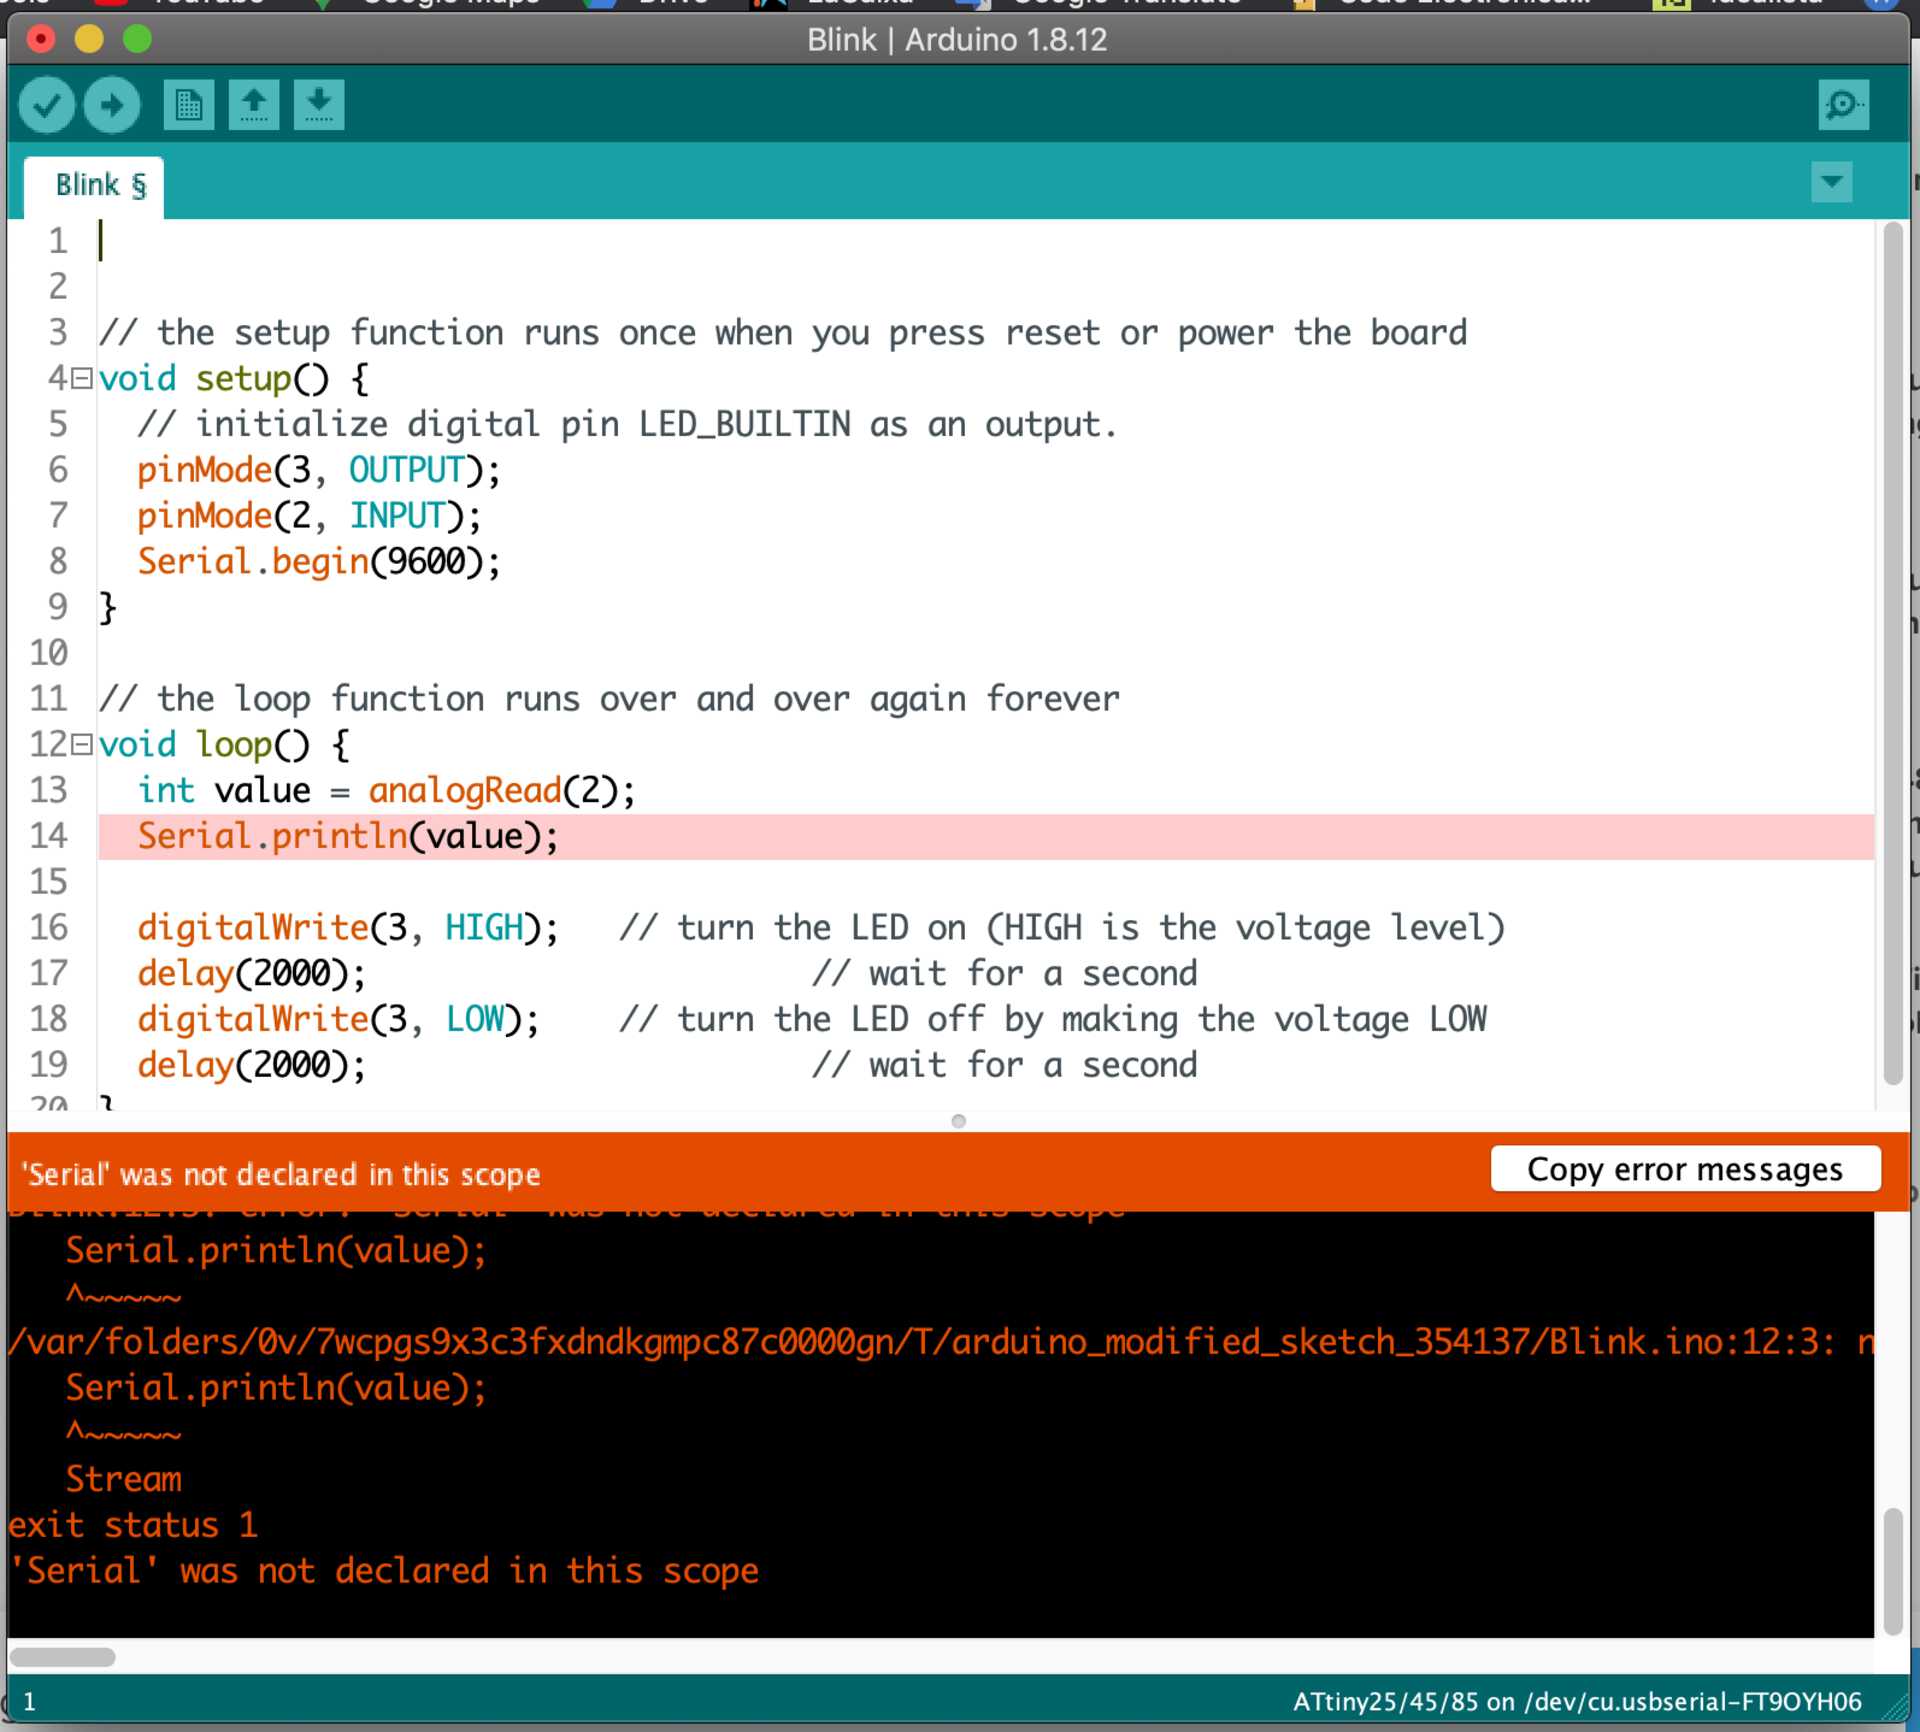
Ah, it seems that Serial does indeed not work for the ATtinies. Instead there's a library called SoftwareSerial which seems to do what we want.
It’s already installed in the Arduino IDE, so you just need to go to Sketch > Include Library > SoftwareSerial.
You have to define the RX and TX pins. It seems there’s no RX pins in the ATtiny45, only a TX one… so I’m not really sure what to do.
Actually, this is software serial, so you can choose whichever pin you want as the RX & TX pins… the thing is, I didn’t solder the TXD pin for the FTDI… I could use the spare PB3 that is not being used and solder it with a flying wire to the TXD pin… but is it necessary? I just want to read Serial, I’m not planning to send it data.
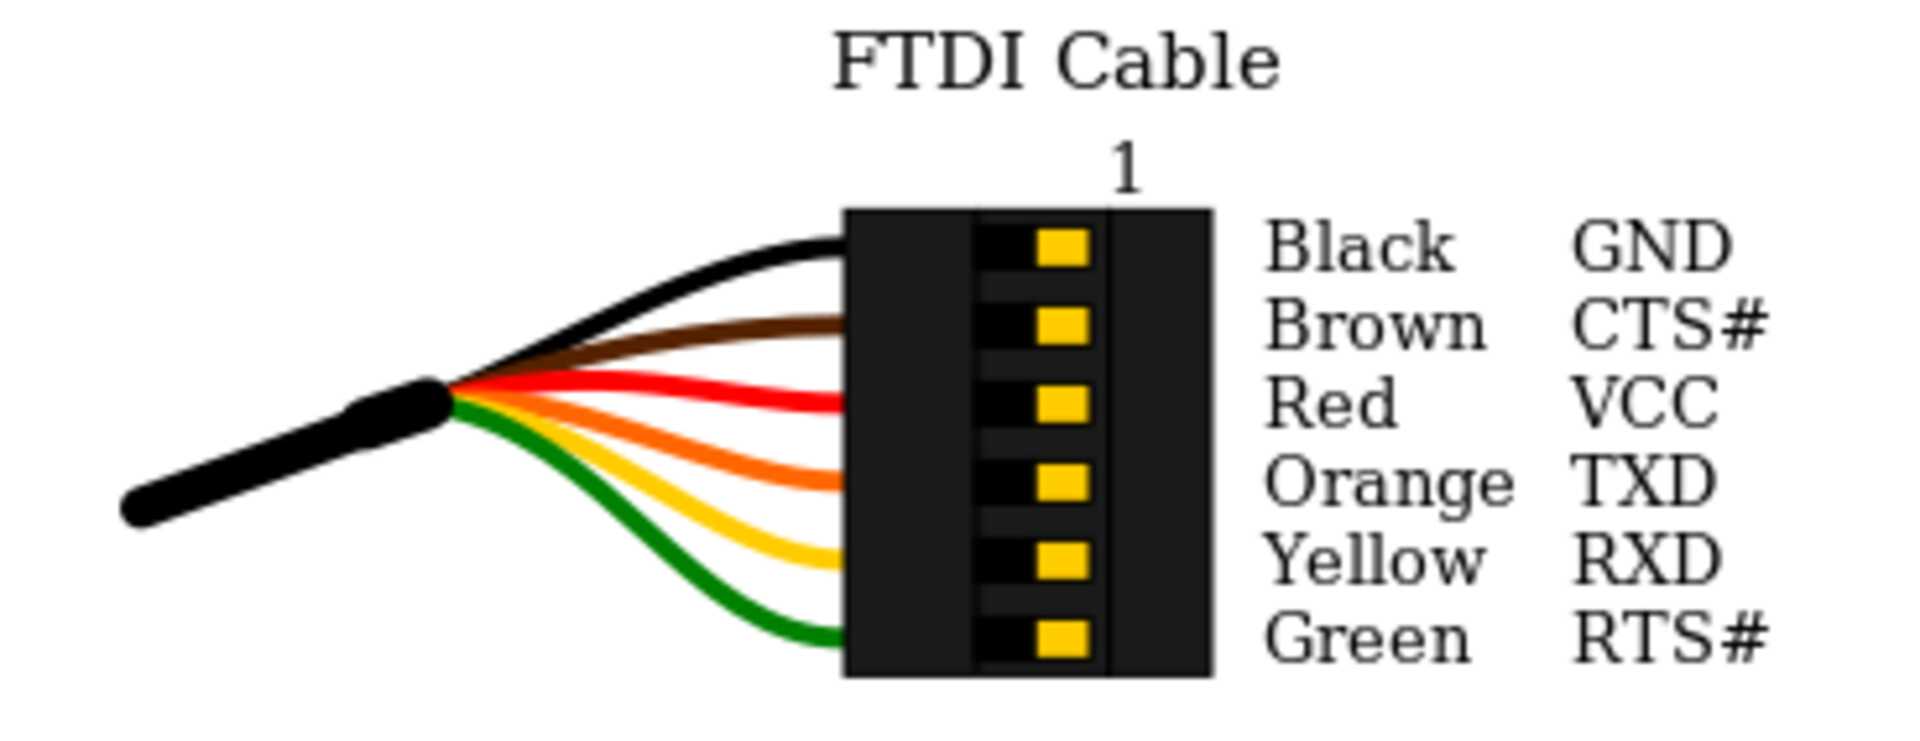
I included the library, defined PB3 as the RX pin and PB2 as the TX pin, and declared an instance of SoftwareSerial called Serial.
#include <SoftwareSerial.h>

#define TX PB2
#define RX PB3

SoftwareSerial Serial(RX, TX);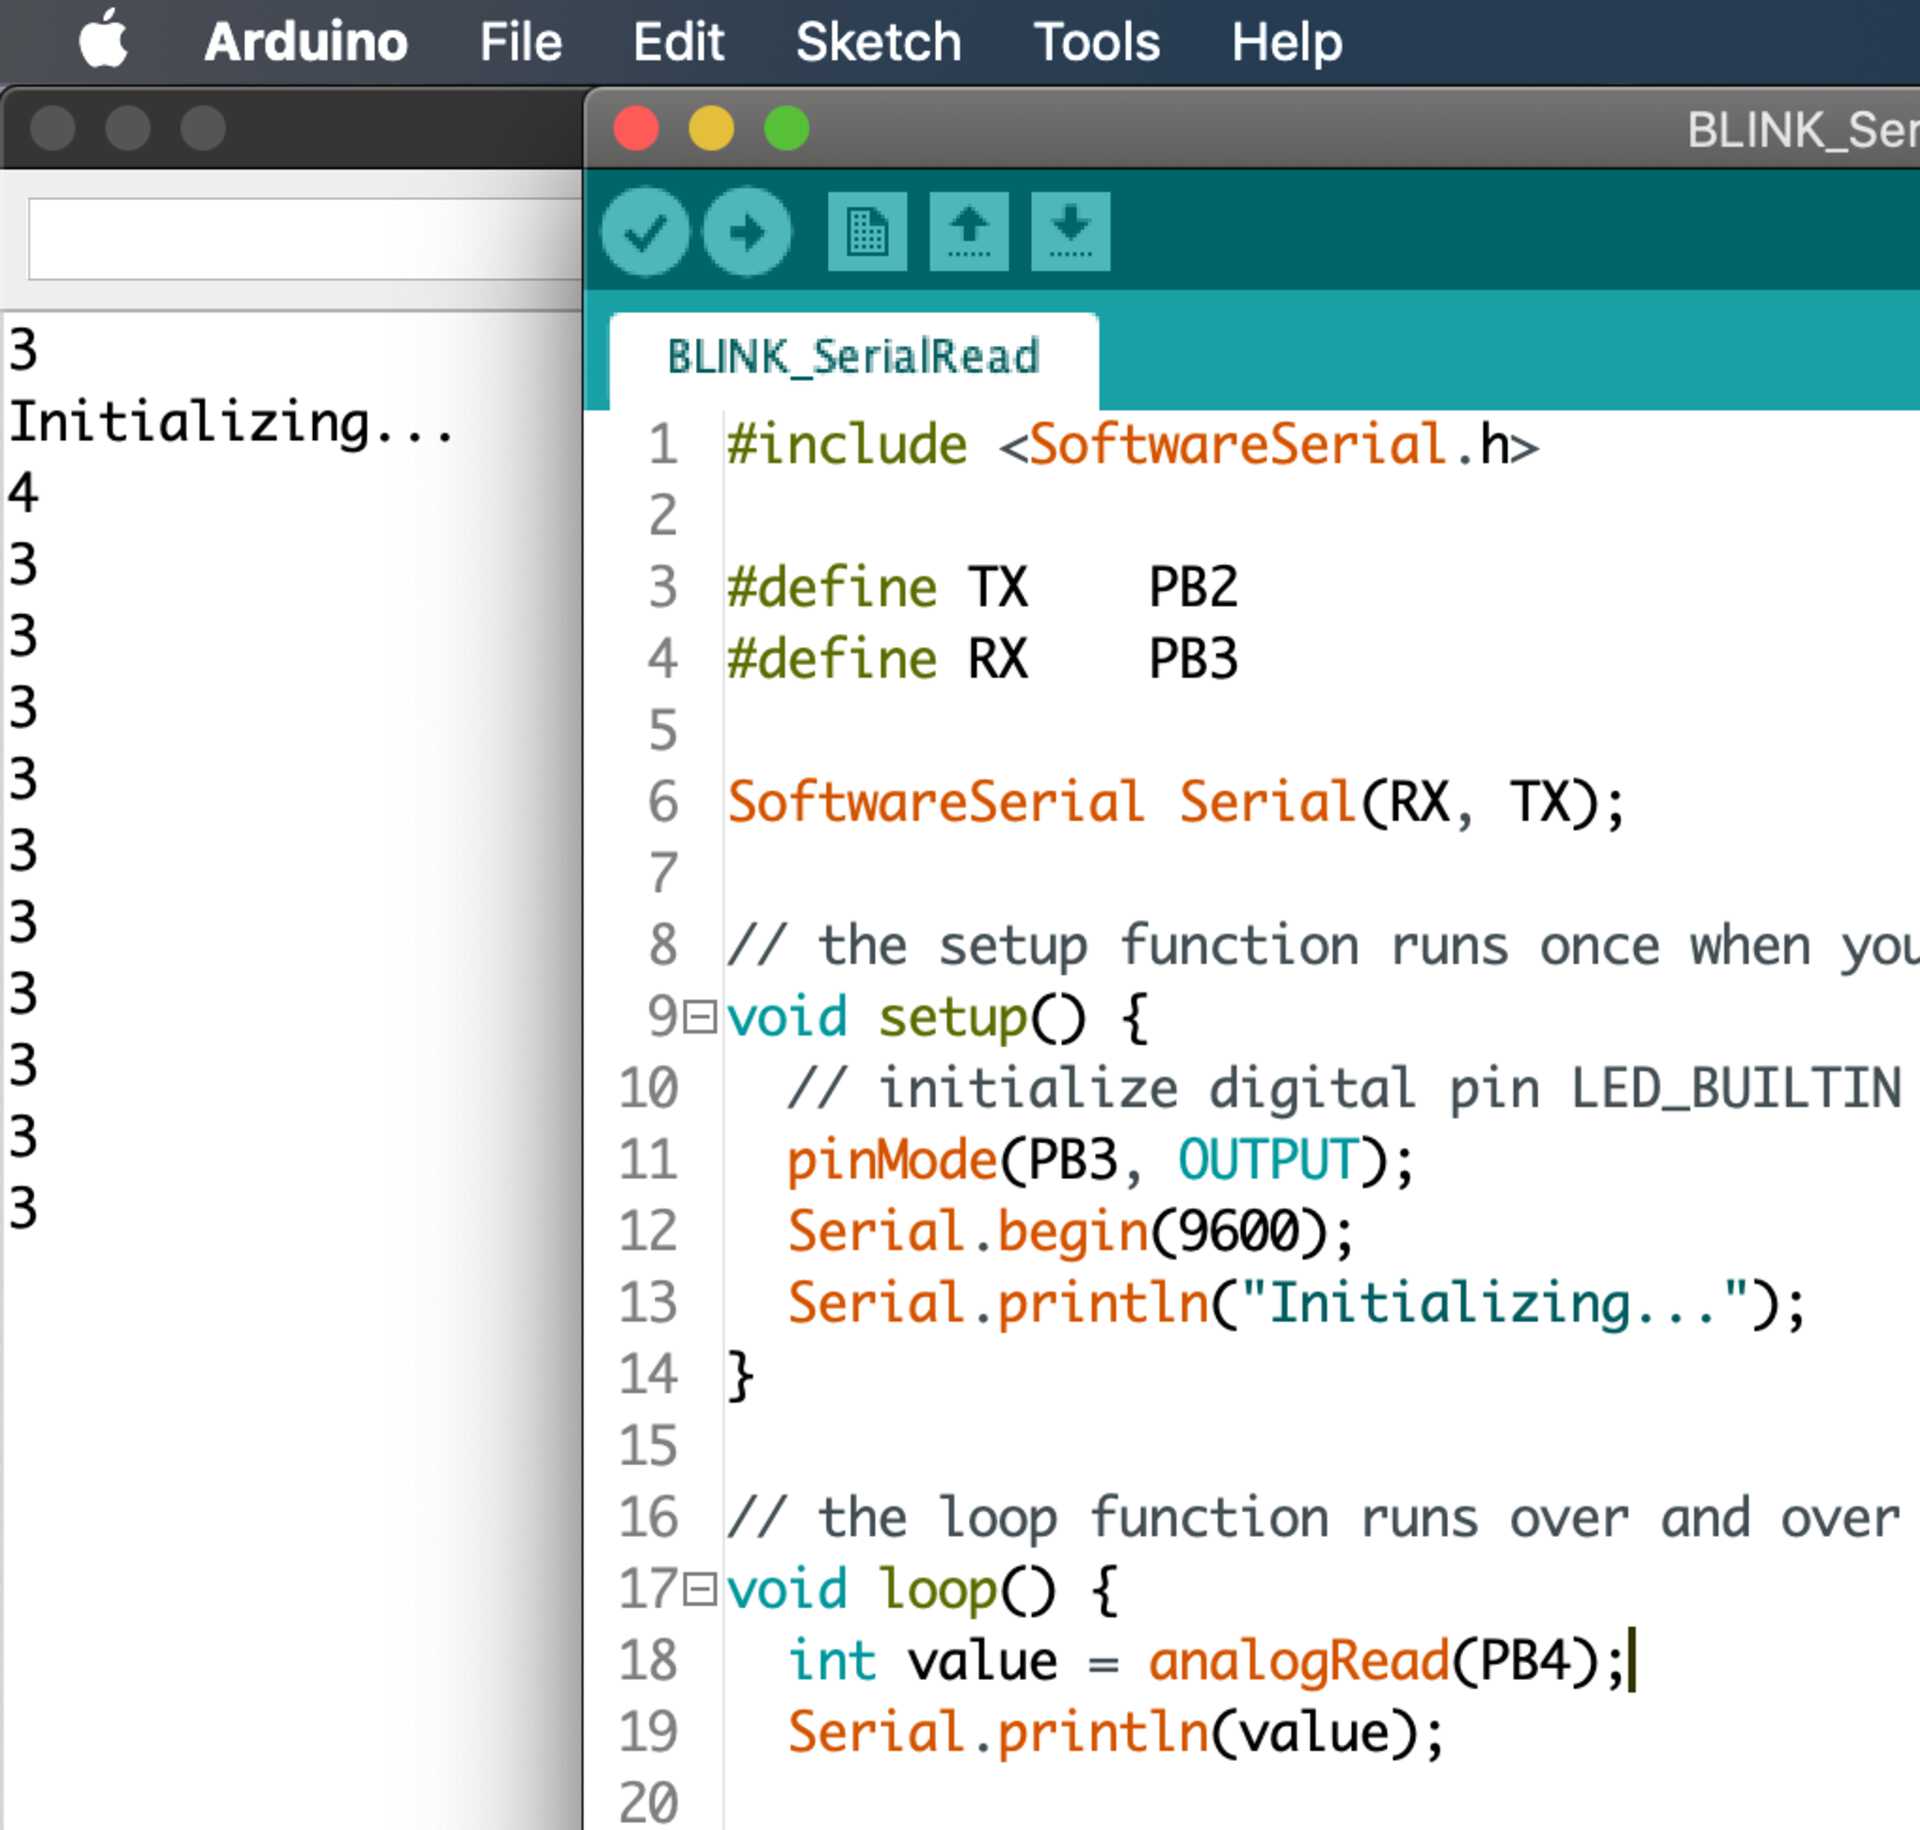
It works! You can see on the left the Initializing… message, and then some numbers (not sure why they are so small).
Download the project files
This week I’m not forgetting to putting up my project files! Whoop.
 Download source code + Kicad files