WEEK 12: INTERFACE AND APPLICATION PROGRAMMING
Objectives
Group assignment:Have I...?
The plan for this week is to create a simple application that could read water flow data sent from the Satshakit I made during Embedded Programming Week and translate them in graphics. I decide for the moment to use a Sasthakit because I can treat it as an Arduino Uno. During this week I can already start working on what will be my final project and for that reason I decided to focus my attention on JavaScript and on a Node.js framework suggested me by my instructor Matteo. I never programmed in JavaScript so I predict it will be hard and I have to start from the base!
Node.js is an open-source, cross-platform JavaScript run-time environment that executes JavaScript code server-side. ViaNode.js, however, can't be used alone: it needs other stuffs to work with other hardware components. For this reason integrate Johnny Five and PubNub to Node.
Johnny-Five is the JavaScript Robotics & IoT Platform. ViaThe "chain" for this weekly assignment is infact somthing like that:
PubNub is a global Data Stream Network (DSN) and realtime infrastructure-as-a-service (IaaS) company based in San Francisco, California. The company makes products for software and hardware developers to build realtime web, mobile, and Internet of Things (IoT) applications. Via
Sensor --> My Board (with Firmata) --> Johnny Five --> PubNub --> EON (PubNub's framework for dynamic charts)
SETTING UP FRAMEWORKS AND SATSHAKIT
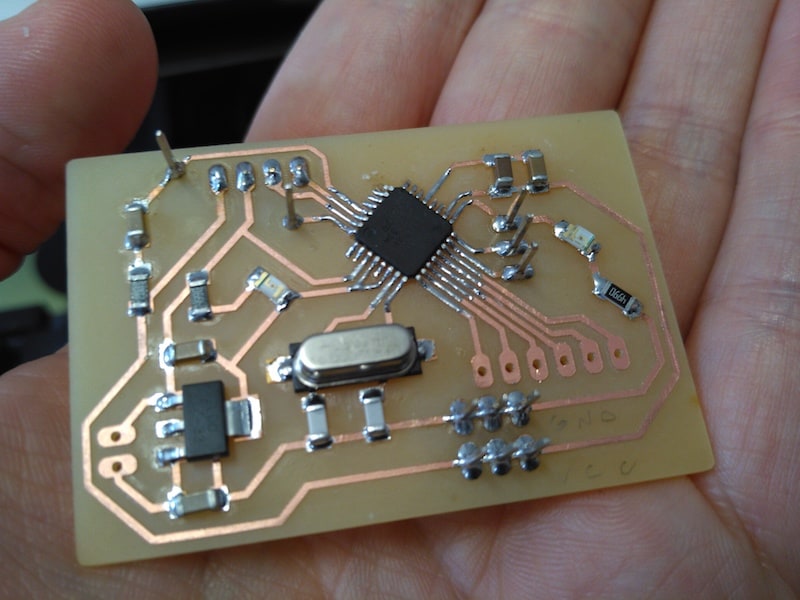
My instructor Matteo suggested me this interesting tutorial that explains how to interface an hardware with web in real-time. For this week I decided to use my satshakit I made during Embedded Programming Week because I can treat it as an Arduino Uno.Yes, I know, it's not a my own board. But this week I want to focus only on the app. I will create a new board next week for Networking and Communications and I will add here that board next time. For the moment I only create a simple support board with some traces in order to add some available VCC and GND pins.Infact, in order to interface with the app, I need to flash on satshakit the Firmata library from Arduino IDE. So I clicked on


File - Examples - Firmata - StandardFirmata and I uploaded the code to the satshakit with my programmator.
The Firmata library implements the Firmata protocol for communicating with software on the host computer. This allows you to write custom firmware without having to create your own protocol and objects for the programming environment that you are using. ViaNext, I installed all softwares I need. First of all I installed Node.js downloading installer package from the official website. Than other software from terminal commands:
sudo npm install johnny-five
sudo npm install pubnub
sudo npm install eon-chart --save
I also created a new PubNub account inside its official website.
A JS FILE TO READ SERIAL DATA FROM SATSHAKIT
As first thing I decided to create a JavaScript file that could read data from my Satshakit and print them in a terminal window. I decided to use JavaScript because using this language I could create a dynamic website that could be useful for my final project.I have take a look at example's page in Johnny Five site, searching a simple code already optimized for my water flow sensor but I didn't find anything. So I decided to treat it as a generic analog sensor and I found a comprehensive documentation at this page.
So I created a new
dario.js file containing the following code:
var five = require("johnny-five");
var board = new five.Board();

board.on("ready", function() {
  console.log('ready');
  var sensor = new five.Sensor("A0");

 sensor.on('data', function() {
    console.log(this.value);
  });
});
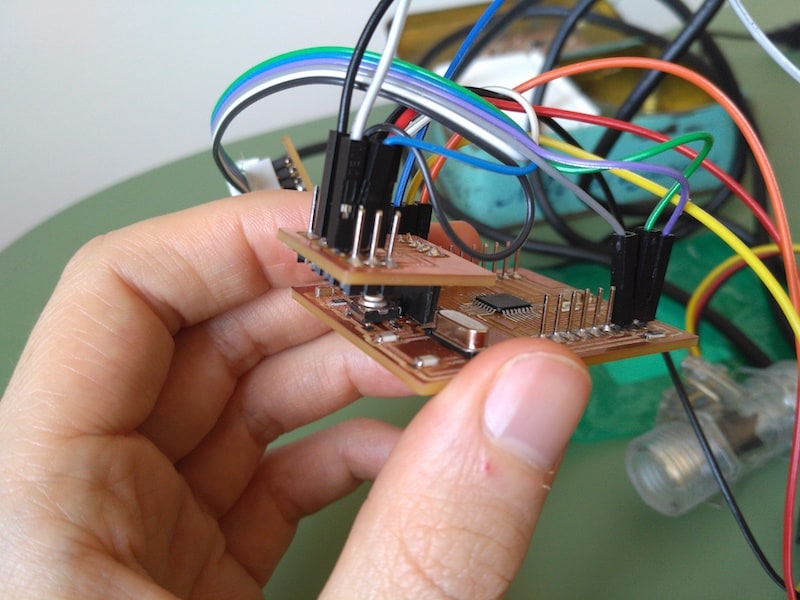
I also connected my sensor to the A0 pin and the FDTI cable to my Satshakit
dario.js file from terminal going to its folder and send
node dario.js.
The answer I had was this one:
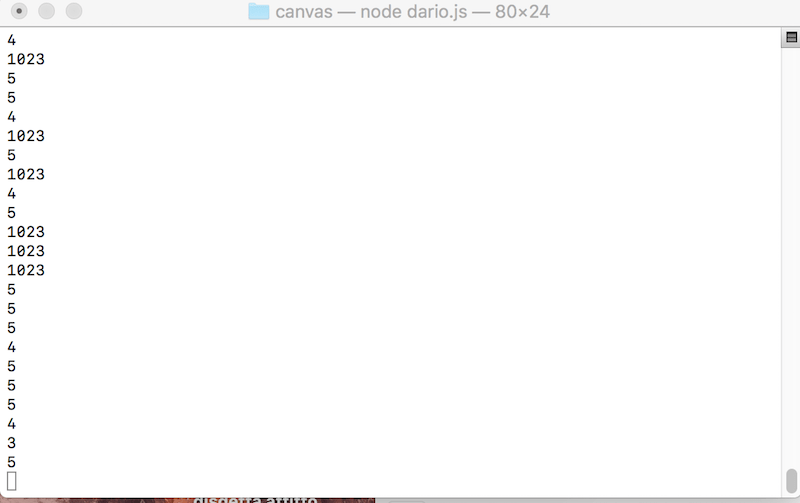
I say that my .js file could interface itself with my Satshakit.
INTEGRATE PUBNUB IN MY JS
After that I integrate PubNub in my .js file, following the tutorial I linked before (obviusly modifying sub and pub keys with mine own ones). After integrate code found there, terminal couldn't launch it as did before. This happened because I didn't initialize PubNub in my file usingPubNub = require('pubnub'); (as suggested by Simone referring to this tutorial). Correcting this missing, terminal could launch again my .js file and read data from serial port also with PubNub integration.
THE HTML PAGE WITH PUBNUB AND DYNAMIC EON CHART
So, as last part, I build an HTML page to traduce data recived from serial port in a dynamic chart using PubNub's EON. I decided to use the Realtime Spline Chart. But after some personalization for my code, the result is that the chart is always to 0, even if my serial print data properly.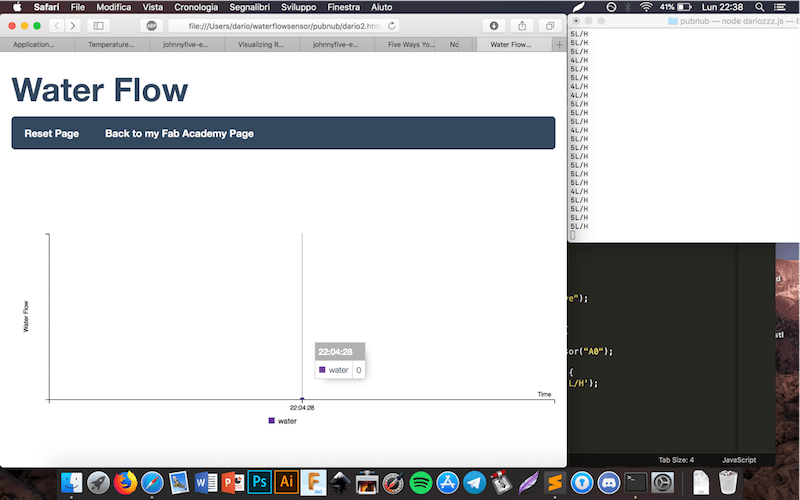
For the other graphic parts I added also Bootstrap and FlatUI.
I notice that I forgot to include
function publish() in my code, with setInterval(publish, 1000); that publish data every second. Adding these voices the result is that my chart update itself every second as I said but it continue read something different to data from serial port.

I also added time and date to the bottom of the page and I added
history: true, in my HTML to save previous data. After some review, I also notice that I didn't defined any variables to explain what I recive from serial port. I modified them and this is the result. At this point, my serial monitor read data (something) from the sensor and transmit them to the chart, but it isn't the value I want. Infact during previous week I used the attachInterrupt function, thing I should include in my JavaScript code to let my chart works as I want. Probably do I have to use Break and Continue function of JavaScript or something else like this one? I must do this integration. But for now I share my code, files and the last version of my water flow chart. You can have a preview clicking Here.
waterflow.js
waterflow.html
--> Download week12.zip (ZIP Archive, 134 KB)
The new board
As I said, for this weekly assingment I used a Sathsakit and not a my own board. So I tried again the same code with a new board created for Week 13. You can find download links and other information about this board (ready to read data from my water flow sensor and print them via serial communication) at Week 13 page.