About me
Final project -
development
Final project
Weekly projects
Wk 14 Interface and
Applications Programming (May 6)
Assignment:
• Write an
application that interfaces with an input &/or
output device
Background
This week provided an opportunity to bring the
electronics and programming to life. In terms of
my digital mala wearable, this is where,
potentailly, the user would be able to see their
mindfulness accomplishment communicated in a
simple graphic display on a computer screen.
I explored how I wanted to convey the data.
As mindfulness is connected with awareness,
spaciousness, presence and clarity, there is no
better metaphor than an open blue sky.
I decided to use a sky blue bakground, and to use
a timeline divided into a number of days. However
many times the button would be pressed in each
day, that data would be translated into a visual
representation of moments of mindfulness on
screen; whilst also showing the progress of one's
mind training.
This is a simple idea.
I thought I was not asking too much of myself.
However, as I read tutorials and tried to explore
how to do this with my tutors, only then did I
realise that this was quite a task for a beginner.
Over and over I got stuck. Fortunately I had my
tutor and mentor on hand and slowly the idea began
to take shape.
Initail sketch illustrating the concept:

The first thing
that had to
happen to
enable the
process was
to get my board
to talk
with my laptop
via serial
port. I used
the Hello
World board to
set this up.
Once this
was up an
running then
I had to look
at the detail
of what I
wanted
the application
to do and in
what order.
The key to
coding, I
had been
told was breaking
everything
down into
steps, and
getting each
step to
function before
moving on to next
stage.
This avoids
serious
time-wasting in
troubleshooting
later on.
Note:
I
would be using
the internal
clock on the
processor;
as I would
not need the
function
of a clock as
such, only a means
to recognise the
number of
state changes
(on a
button)
between 2
points in time
(this value
would
be called 1
x 'bucket').
Function of
test input
code:
•
create 5
'buckets to
collect input
data (to
represent 5
days, bucket
1, bucket 2,
etc);
•
each bucket,
for quick test
purpose, would
span
a time
interval of 10
seconds each;
•
from moment
serial port
is connected
(power
on),
whenever the
button on the
Hello board is
pressed
during the
subsequent 50
seconds (5 x
10s), the code
will count the
number
of presses
and record
which
bucket
interval it
occurred
within;
•
print the
value counted
for each
bucket and
print in the
console.


This code
arranged the input data
and printed it in the
console and serial
monitor in the following
configuration
(note,
its important to
pay attention to
baud rate, otherwise
character were not
readable)
:

So
the first part of the
challenge
was accomplished; I
had received true
data from a
real
input device communicated
through the
serial port.
'Processing'
It
was now time to try
and get
an understanding of
Processing, the
open
source software that
enabled data to be
converted into a
visual graphic for
screen dispaly
- an inteface
between data
gathered and
the user.
I
followed many examples
to try
to
understand the
basics.
Initial tests
were taken up
working
how to load an
image, and
position boxes
along along
the y axis
of the window,
which would
represent
time:

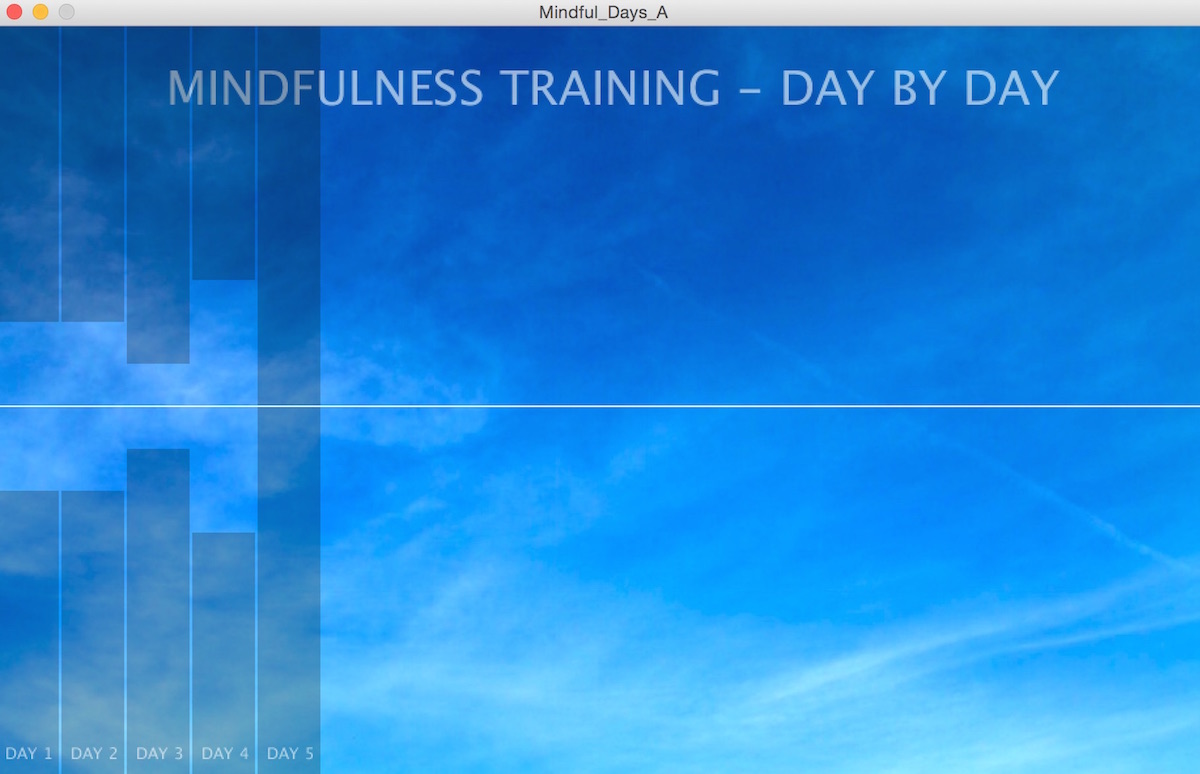
Aesthetically,
to use the sky
concept in the most
effective way, I
wanted
the mindfulness
aspect to be 100%
blue sky and
the
non-mindfulness
to be duller,
greyer, murkier,
reflecting
non-mindfulness.
Therefore, the
white-grey
boxes would be
100% blue sky
and the rest
of the sky
image would
be duller
in contrast.
I
was now
confronted
with requiring
a level of
coding
know-how that
for me was
very advanced;
I did not have
enough basis
to follow many
of the coding
concepts
through.
So, I needed a
lot of help
for the next
part, which I
gratefully
received from
my tutors. We
began to
change the
solidity
of the boxes (shown
on the right
below) with
the lightness
and saturation
of the sky
(shown below
on the left).

However,
as
you may have
noticed, the
contrast is
too subtle, so
I
went back to
the original
image and increased
the contrast
and saturation
of
the image
to make
'mindful
time' and
'non-mindful
time' more
impactful:

For those interested in the coding, a
formula was created for the mindfulness /
blue sky part. Two functions were created,
named 'window_height = 581' and
'y-mask'. This now enabled these two
aspects to be subtracted from the Buck1
values for each of the 5 days (first 5
vertical strips on left of image above).
I added a title image and added text to
describe the data relating to Day 1, Day
2, etc. Ultimately this data would be
animated and arise, day by day
equi-centrally from the centre white line.
That's for another day!


Button_count
test code
Click
here to download the Mindfulness
Days code (Processing)
Background
image for the app
