
Assignments
"write an application that interfaces with an input &/or output device".
What device and which language?
May 8 / Today I've ordered two ADXL335 accelerometers from Sparkfun, as well as two ATmega168 microcontrollers and two 8 MHz resonators to use in my final project, with two fabkits that I milled today. I'm planning to use the accelerometer data and the fabkits for the assignment of this week, so I can already get some feel for them. While I wait for the parts to arrive, I'm digging into the Python tutorials by Massimo Menichinelli. Although they are definitely well made, I'm getting stuck here and there and find myself tutorial-hopping - solving one problem or unclarity with a new tutorial and then continuing in that tutorial until I got stuck again. I particularly like Learn Python the Hard Way that also teaches you the programmer-way of thinking and doing things. Also it often says things like "find out how to make a directory in Terminal", instead of just showing you how to do that simple thing.
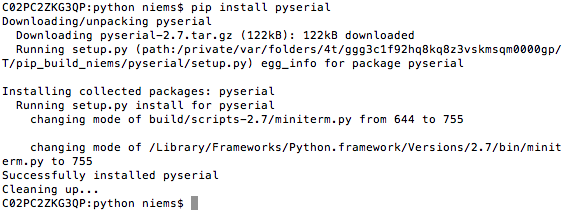
May 9 / I spent most of today reading up and installing / setting up Python 2 and modules that seemed handy for doing datavis, such as NodeBox, Kivy, PySerial, Matplotlib and Numpy, by typing pip install pydev in Terminal. Installing and running programs is very straightforward in Python I found. Go to the directory where Python is installed, save your program there and run it by typing python myprogram.py in Terminal.
At first I used the text editor Textwrangler to write and edit Python code, until I found out through Massimo's tut that the Java-IDE Eclipse has many added features and can be used in combination with PyDev to serve as a Python IDE. I made and ran several small programs through the 'hard way' tutorial, which made me quite happy.
..................................................................................................................................................................................Serial data and Python
May 11 / Today the accelerometers from Floris.cc arrived, but the microcontrollers and resonators from Digikey hadn't yet. Since I felt the urge to get going, I decided to connect the accelerometer to my Arduino Uno and work on generating serial data and visualizing that data with a Python interface that way.
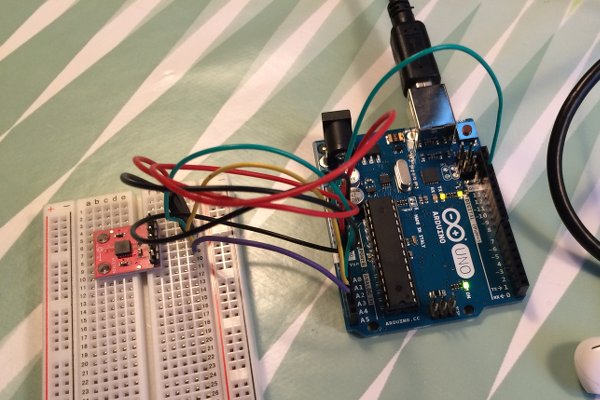
I found a nice Instructables tutorial on how to use Python and Arduino to plot data. I connected the accelerometer to a breadboard and arduino in the following way;
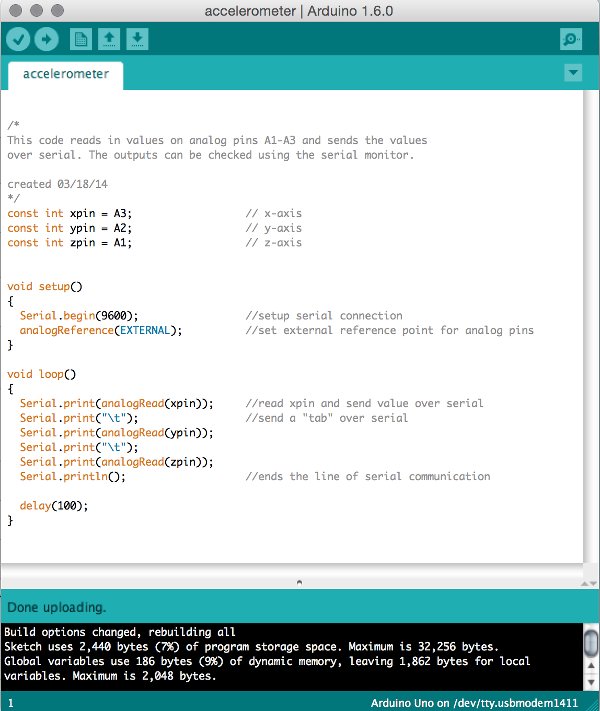
The last wire is for setting the reference, since the analog pins on the Arduino range from 0-5V, while the accelerometer ranges from 0-3V. If you want to use the full range of analogue input values, the ranges should be the same. I used the following Arduino code and saw accelerometer output in my serial monitor.
Next, I looked for a way to test with Python whether I could see the serial data outside of the serial monitor. I found some code to test a serial connection and made some changes so that it applied to my situation. Running serialtest.py now showed the serial data in terminal. Please find the code under 'resources' below.
 ..................................................................................................................................................................................
Visualizing and troubleshooting
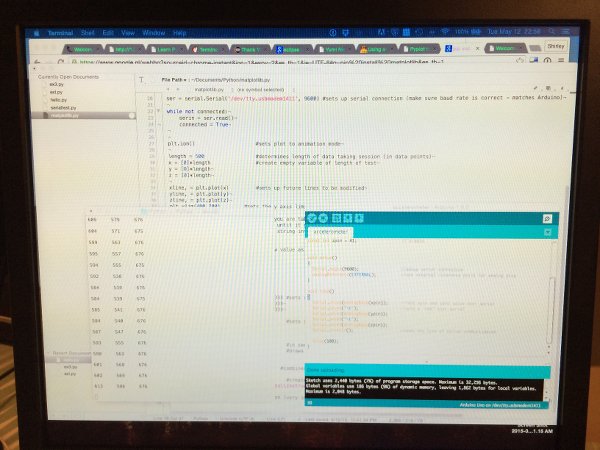
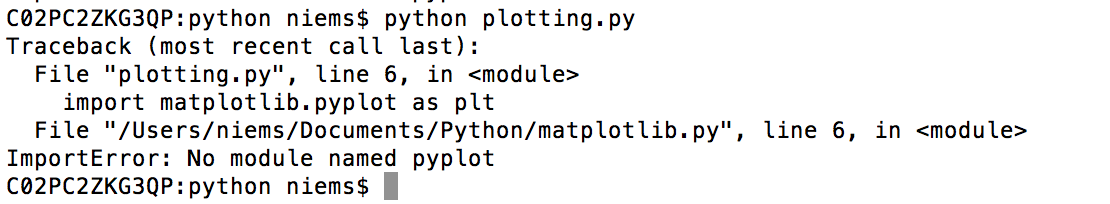
May 12 / Going back to the Instructables tutorial, I then adapted the Python code meant for a windows machine that, by using the 'matplotlib.pyplot' library, should plot the axis data in a graph. Although I had installed the matplotlib module before (using pip), errors kept popping up upon running the code, saying that there was no module named pyplot.
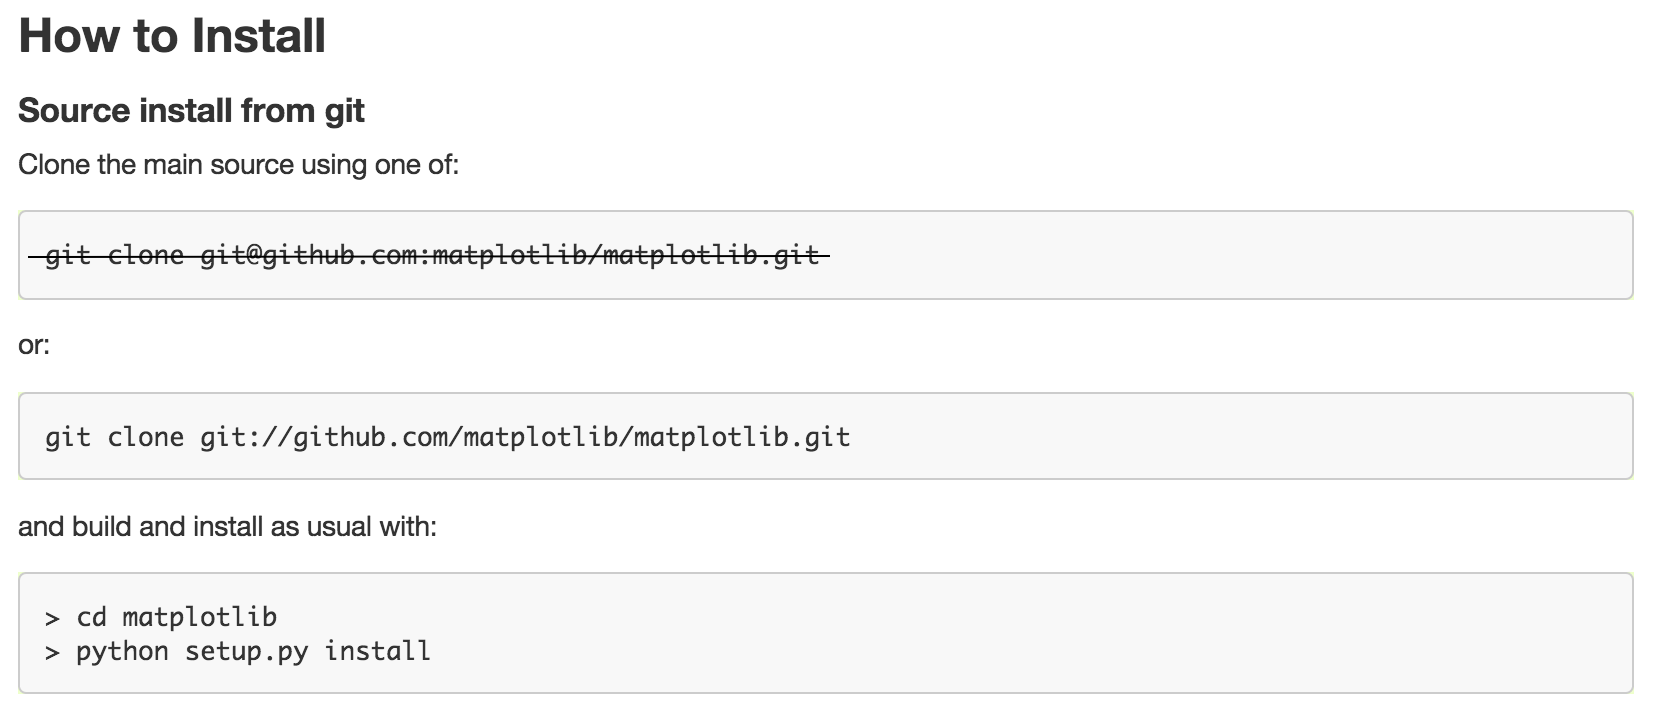
It took several removals and new installs until I found out that cloning the source from Git was the way to go;
Then finally, after moving my code file to the same directory, I could run it and saw the accelerometer data in a graph. Briefly! It vanished just as I was preparing my phone for a video, and I had a hard time getting it back! The error message I got was the following;
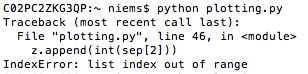
In the Python code (see plotting.py in 'resources' below) there are various limits to the amount of data gathered and saved, I think I should take a longer look at it and see if I can fix the problem. By 'commenting out' pieces of that code, I did manage to get another brief moment of data visualization, and because I had my camera ready, I could make this short video (until my memory was full);
IMG 1222 from shirley niemans on Vimeo.
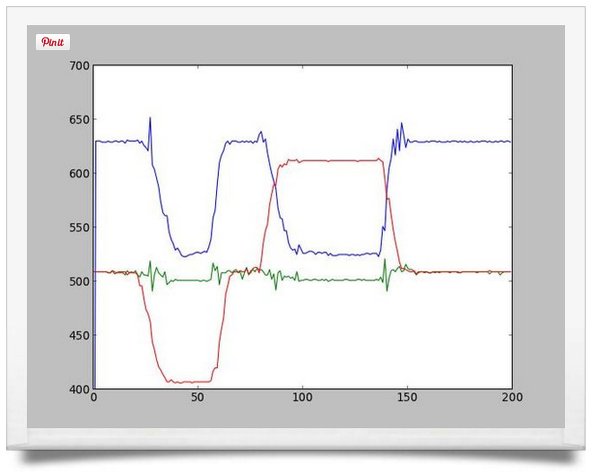
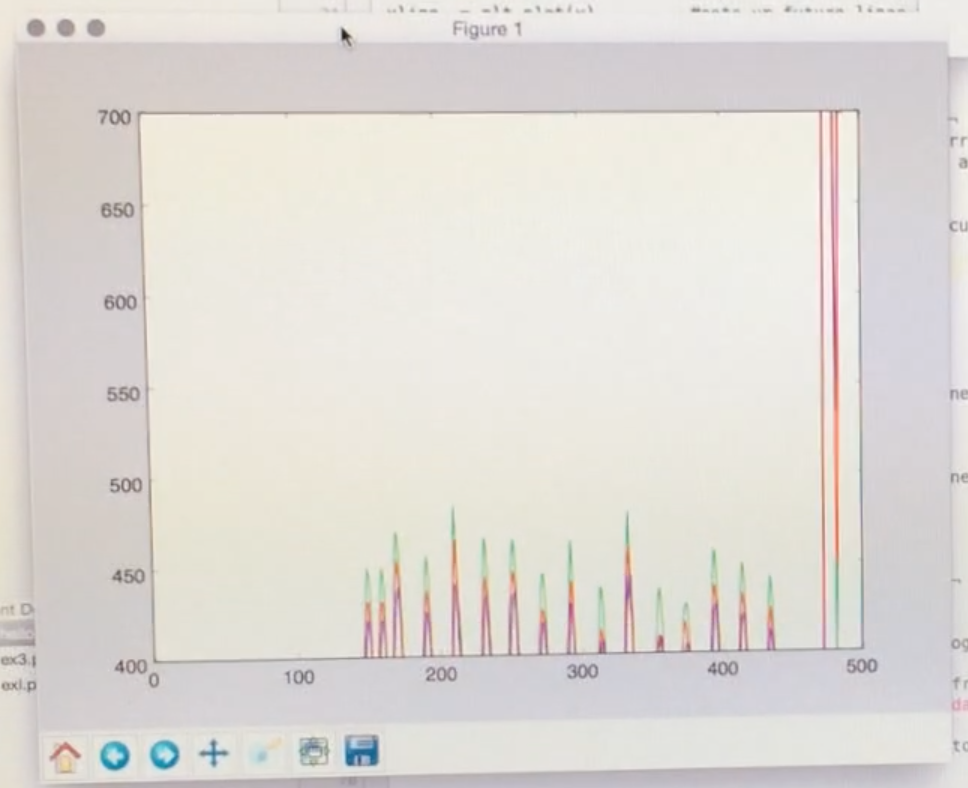
According to the tutorial I followed, the graph should look like the first picture below here. It seems like the data is represented in another way, and more importantly, it seems that the range of my output doesn't match the range of the graph. This may have caused the program to stop. Since I'm out of time I'll leave it at this for now, and go focus on my final project.
 ..................................................................................................................................................................................
Resources