The assignment for this week is to write an application that interfaces with an input and/or output device.
I decided to make an interface to help with the programming of the RC servo positions for my final project. To position the RC servos you program a value that defines the position that you want. Unfortunately, this value is not in degrees. It is based upon controlling a pulse typically between 1 and 2 milliseconds long. With hardware PWM (pulse width modulation) control there is an equation in the data sheet that can be used determine the result of a value.
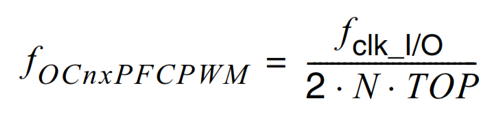
The PWM frequency for the output when using phase and frequency correct PWM can be calculated with this equation.
In my application:
This equation however only determines the resulting PWM signal not the position of the RC servo motor. To make things more interesting, how you attach the horn to the servo defines your starting angle. Servos also vary in range of motion and how far they move for a given pulse width modulation signal.
For my electro-mechanical scoreboard project, I need to know the values for 28 different servo positions. I can determine these position values by trail and error but it is very inefficient and time consuming.
I modified my ATTiny 44 program to manually jog the servo motors by increasing/decreasing the OCR1A and OCR1B values that control the hardware PWM to the servos.
I also added the programming needed to take the current PWM value and Hz_pulse value and send them via an asynchronous serial bus to a PC.
I wanted to send both the hardware and the software pwm values since they are different. Unfortunately, I was not able to modify my program to variably control the software PWM value on-the-fly. For some reason the delay.h library wants a constant for each delay defined when the program is compiled. I modified my program to run a loop that calls up a variable delay but for some reason it did not work. The software PWM controlled servos would move to the end of travel upon power-up when the value was set for the center position. I suspect this was caused by the additional overhead time of executing my approach or the way I stored my values in memory. In the interest of time management, I decided to concentrate on the hardware PWM for this assignment. Instead of sending the software PWM value I calculated the pulse_hz value and sent it. This was unnecessary since I could have also calculated this value on the PC side.
When I designed the circuit board for controlling my electro-mechanical scoreboard, I added a communication port for the asynchronous serial bus. I figured I could use it to optionally add wireless control of the scoreboard and/or if I wanted to take a modular systems approach. I used this interface to communicate with a PC. However, this board only had bus the connector of a "node". This network also typically needs a bridge circuit that also has a FTDI (USB-to-serial) connector on it. Since I didn't need to communicate to anything but a PC, I decided to make a simple FTDI to 4-pin asynchronous serial bus adapter cable. This adapter cable might also come in handy when initially programming individual nodes to go on an asynchronous serial bus network.
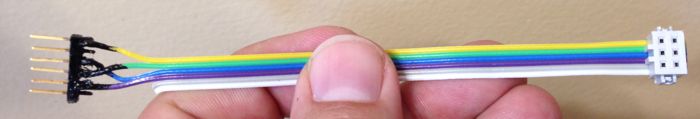
A simple FTDI to 4-pin asynchronous serial bus adapter cable. It may not look real pretty or be durable but it works. I didn't have heat shrink tubing so I used liquid electrical tape. I didn't have a 4-pin ribbon connector socket so I used a 6-pin. Consider this a successful prototype.
In addition to communications, the FTDI/4-pin bus cable also supplies DC power from the USB port. Be sure not to use the external controller battery when connected to the asynchronous serial bus
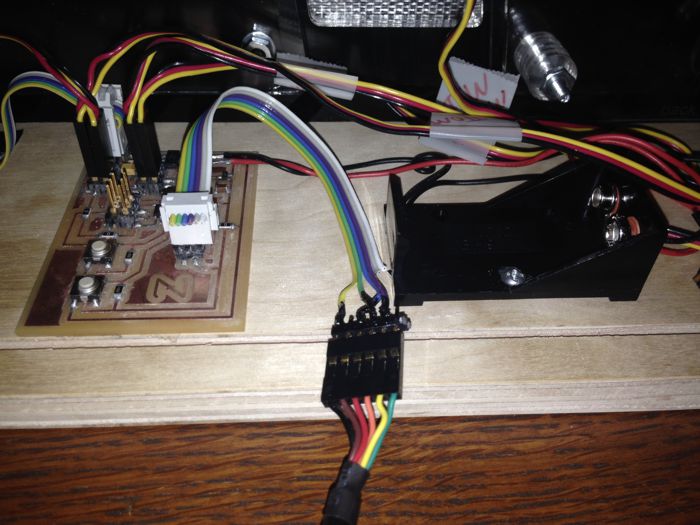
The simple FTDI to 4-pin asynchronous serial bus adapter cable connected to the servo control board. Notice that the battery should be disconnected since power is supplied via the bus connection.
I developed the graphical user interface (GUI) for the PC with Python and Tkinter. This GUI program receives info via FTDI from a hardware PWM servo control board and displays the information on a PC.
For this application I didn't need any moving bar graphs or fancy animations. I just wanted to display the hardware PWM information close to real time and so it look nice.
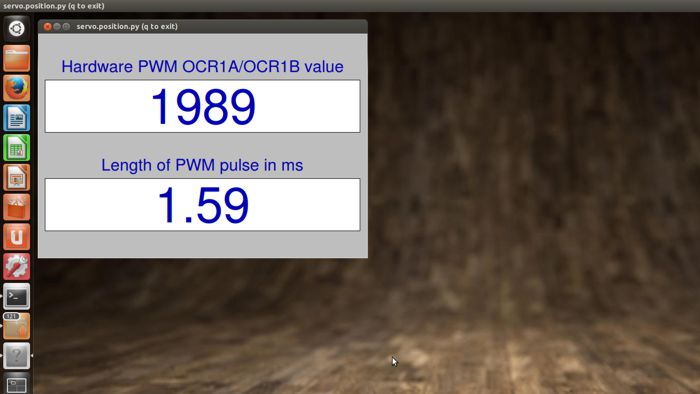
The graphical user interface showing the needed information.
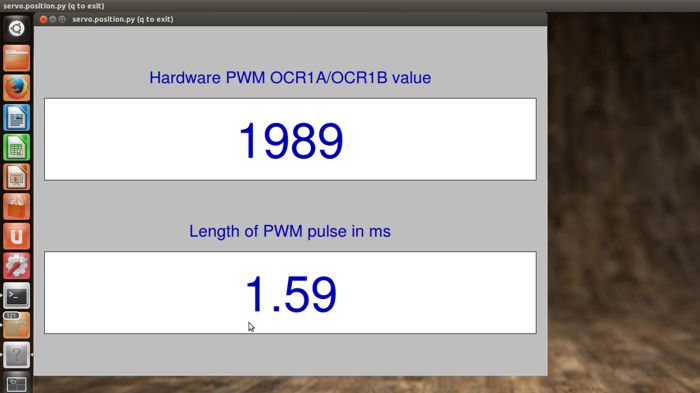
Since the text and other graphics are positioned and sized based upon the window size, it can easily be scaled by changing the WINDOW value in the Python program for easier viewing and/or different resolution monitors.
I am used to developing human machine interfaces (HMI) for industrial control applications. I typically do this with a very WYSIWYG graphical software. Programming with Python and Tkinter was very different from this. There is plenty of information on the web about making graphical user interfaces using Python and Tkinter. However, for some reason I found it hard at time to find the details I was looking for. For example, what are my options for formatting a value in something like canvas.itemconfigure("text4",text="%.2f"%hardpwm_value). Luckily, it was intuitive enough that I was just able to figure it out. Another thing I questioned was how the program declares data types (e.g. integers vs. floating point). I found that period = (1000/hz_value) resulted in integer answers while period = (1000.000/hz_value) resulted in a fractional answer.
Here is a video of the finished graphical user interface in action. It works very well. The display is very easy to read and "rock-solid" - the values do not fluctuate randomly. It is also very responsive and updates quickly as the servo physically moves.