Group Assignment – Output Devices Analysis
Testing HC-SR04 with XIAO ESP32-C3 using Multimeter
Group Assignment - Output Devices Power Consumption Measurement
Correction note: this group assignment corresponds to Output Devices. The measured system is an output actuator: a 5V DC motor controlled with a XIAO ESP32-C3 and an L298N driver. This activity evaluates actuator power consumption.
The objective of this group assignment was to measure the power consumption of an output device and document the complete process. For this purpose, a 5V DC motor controlled by a XIAO ESP32-C3 and an L298N driver was used as the test system.
The practical work began with the assembly of the circuit on a protoboard, ensuring correct connections between the microcontroller, motor driver, and power supply. A program was developed and uploaded to the XIAO ESP32-C3 to control the motor, allowing it to rotate in both directions at fixed time intervals.
Once the system was operating correctly, electrical measurements were performed using a multimeter. Voltage was measured in parallel across the motor terminals, and current was measured in series. These values were then used to calculate the power consumption of the motor using fundamental electrical formulas.
This assignment allowed the group to understand how real electrical systems behave under operation, reinforcing concepts such as voltage polarity, current flow, and energy consumption in embedded systems.
Group Assignment Development
To strengthen the group assignment, the test was organized as a complete measurement workflow instead of only a functional motor test. The group first identified the output device, the driver stage, and the power supply path. Then the system was tested in different operating states so that voltage, current, and power could be compared under bench-test conditions.
| Test Condition | What Was Observed | Learning |
|---|---|---|
| Motor stopped | The circuit consumed very low current. | A system can still consume energy even when the actuator is not moving. |
| Motor rotating forward | Current increased when the L298N activated the motor. | The driver protects the microcontroller from the motor load. |
| Motor changing direction | The current changed during the transition between directions. | Direction changes create transient electrical demand. |
| Motor rotating with no external mechanical load | The current represented the free-running consumption of the motor. | This verifies the circuit, but it does not estimate the real working power of the motor. |
The power was calculated using P = V x I. This made the group exercise more useful for the final project because the modular manufacturing cell will require actuators that move reliably without overloading the controller or the power distribution system.
No-Load Measurement Limitation and Rated Power Comparison
The first measurement was useful to confirm that the controller, L298N driver, wiring, and motor were working correctly. However, the test was performed with the motor rotating without a real mechanical load. For that reason, the value calculated with P = V x I must be interpreted as the electrical input power during a no-load bench test, not as the actual useful output power of the motor in a working mechanism.
A no-load measurement normally produces a lower current than a loaded condition. Therefore, it cannot be used alone to size the final power supply, estimate torque demand, or predict the motor behavior when it is moving a mechanical system. The correct comparison should be made against the motor rated power.
Rated electrical power reference: Prated = Vrated x Irated. In this test, the small DC motor did not include a complete datasheet or a visible rated-current label, so the comparison could only be qualitative: the no-load measured power is expected to be lower than the real loaded or rated operating power.
| Measurement Type | What It Shows | Use in Design | Limitation |
|---|---|---|---|
| No-load current | Free-running motor consumption. | Useful for checking wiring, driver behavior, and basic operation. | Does not represent real mechanical work. |
| Loaded current | Current while the motor moves a mechanism or resists friction. | Better for selecting power supply, driver capacity, and cable size. | Requires a controlled load or the final mechanism. |
| Startup or stall current | Peak current when the motor starts or is briefly blocked. | Important for protecting the driver and avoiding voltage drops. | Must be measured carefully for a very short time to avoid damage. |
As a next improvement, the motor should be tested with a defined mechanical load, for example by connecting it to the final mechanism, a pulley, a small brake, or a friction load. New voltage and current measurements should then be taken during startup and steady operation. If torque and speed are also measured, the mechanical output power can be estimated with Pmechanical = torque x angular speed. This would provide a more realistic comparison with the motor rated power and a better basis for selecting the driver and power supply.
12V DC Motor Startup Load Measurement
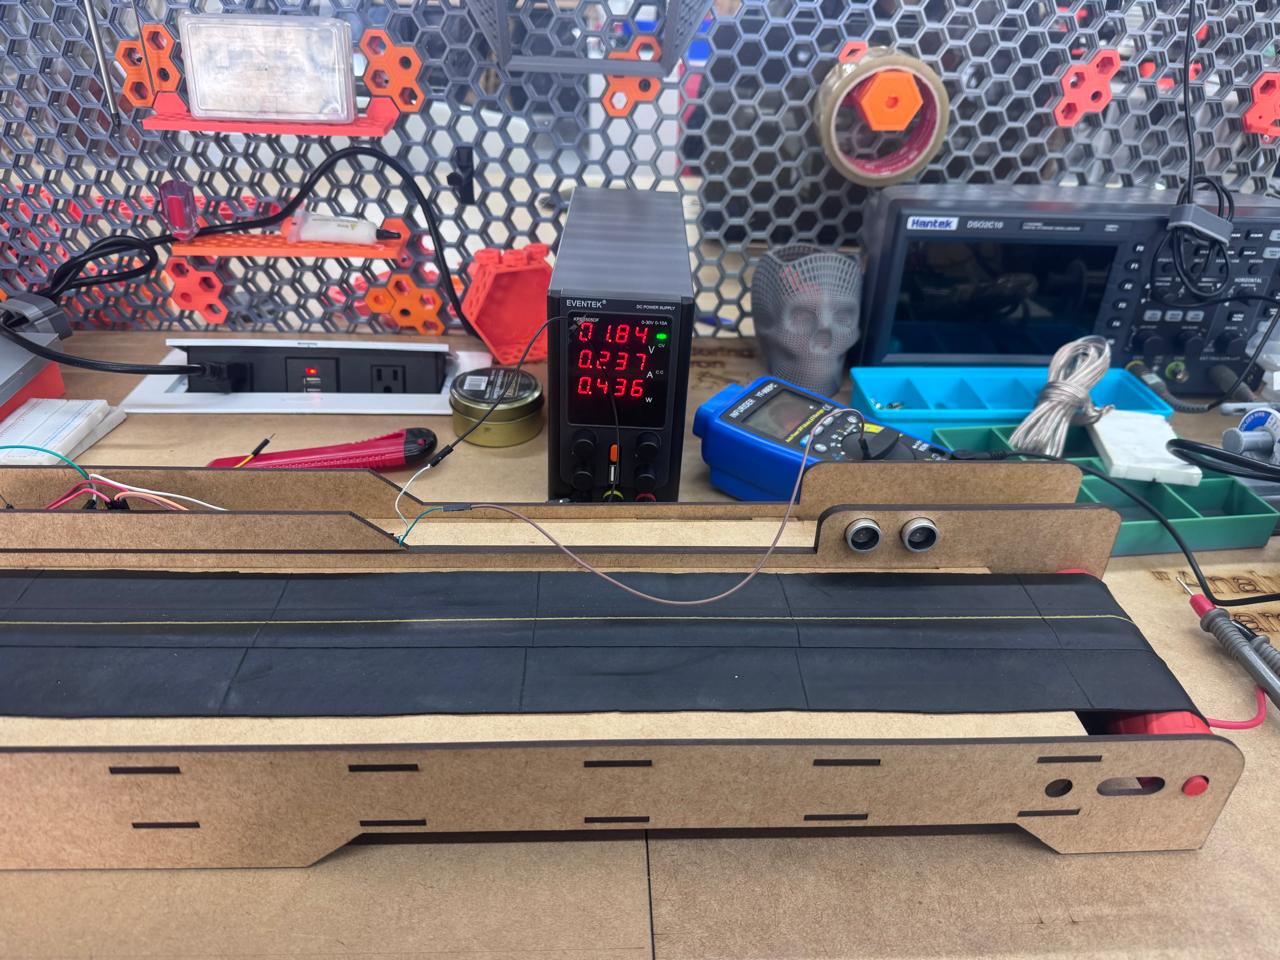
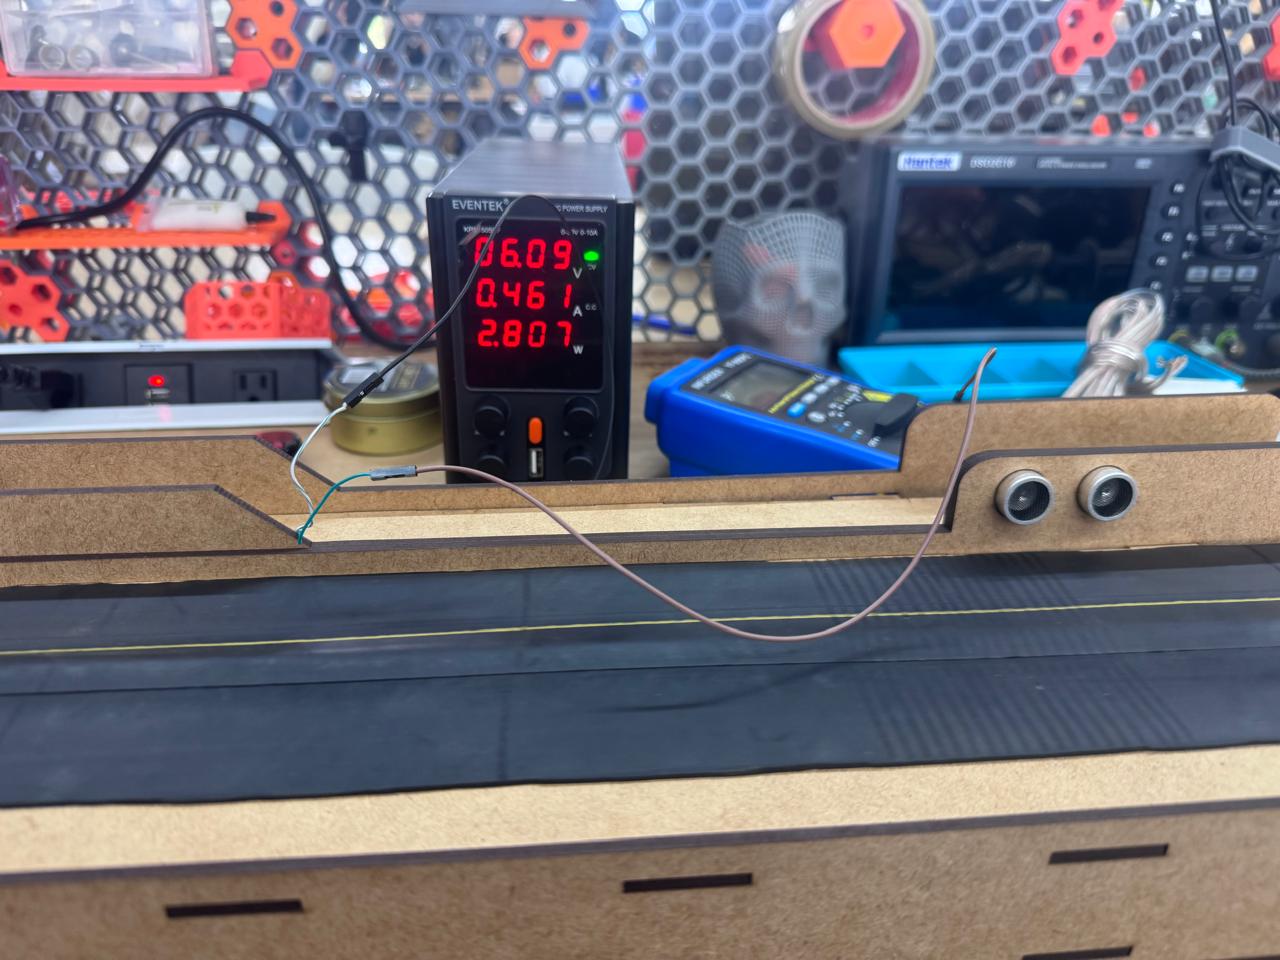
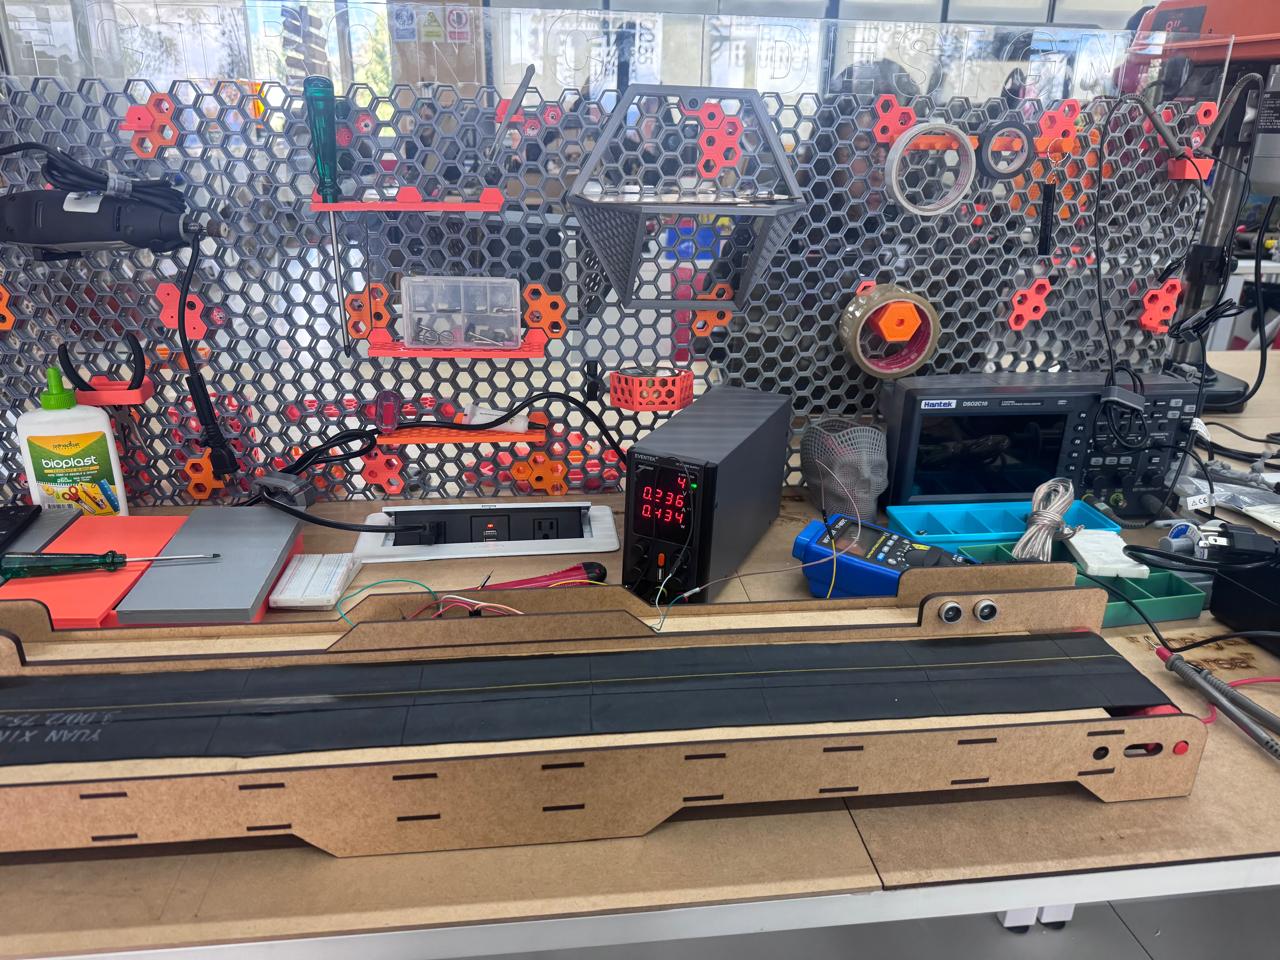
This section documents the startup behavior of a 12V DC motor when it is connected to a real mechanical load. Instead of testing the motor without resistance, the motor was evaluated while trying to move the conveyor belt mechanism of the final project. This is important because the highest electrical demand of a DC motor usually occurs at the beginning, when the shaft must break the inertia of the belt, rollers, and friction of the system.
The assignment objective was to identify the current required to start the loaded mechanism, compare it with the current after movement begins, and observe the voltage-current-power trend using a bench power supply with integrated voltage, amperage, and power readouts.
Measurement Setup
- Output device: 12V DC motor.
- Mechanical load: conveyor belt mechanism from the Smart Lean Cell prototype.
- Power source: adjustable DC bench power supply with voltage, current, and power display.
- Measured variables: voltage (V), amperage (A), and electrical power (W).
- Procedure: the supply voltage was increased step by step while observing when the belt started moving and how the current changed after startup.
Startup Load Data Table
The following table was created from the measurement file. The peak current appears at 5.00 V, where the motor reached 0.683 A. This point represents the highest current demand observed during startup and marks the effort needed to overcome static friction and start moving the conveyor belt.
| Voltage (V) | Current (A) | Power (W) | Observation |
|---|---|---|---|
| 0.00 | 0.000 | 0.000 | Motor stopped. |
| 1.00 | 0.090 | 0.080 | Insufficient voltage for motion. |
| 2.00 | 0.267 | 0.528 | Current increases as the motor tries to move. |
| 3.00 | 0.425 | 1.272 | The loaded mechanism is still resisting motion. |
| 4.00 | 0.561 | 2.230 | Current continues rising before startup. |
| 5.00 | 0.683 | 3.420 | Peak startup current: inertia is broken. |
| 6.10 | 0.461 | 2.600 | Current drops after the belt begins moving. |
| 7.00 | 0.470 | 3.210 | Stable loaded movement. |
| 8.00 | 0.470 | 3.710 | Current remains almost constant. |
| 9.00 | 0.490 | 4.280 | Power increases with voltage. |
| 10.00 | 0.470 | 4.840 | Steady operation. |
| 11.00 | 0.500 | 5.820 | Slight current increase. |
| 12.00 | 0.580 | 5.990 | Near nominal motor voltage. |
| 13.00 | 0.590 | 7.870 | Highest measured power in the test. |
Statistical Analysis and Trends
The most important result is the startup peak. The motor required 0.683 A at 5.00 V to break the inertia of the loaded conveyor belt. After this point, the current dropped to 0.461 A at 6.10 V, a reduction of approximately 32.5%. This confirms that the motor demanded more current before movement than during steady rotation.
For the steady operating region from 6.10 V to 13.00 V, the average current was 0.504 A, with a standard deviation of 0.052 A. The peak startup current was approximately 35.5% higher than this steady-state average. This value is useful for selecting the motor driver and power supply, because the system must support the startup current and not only the current observed once the belt is already moving.
The power trend was strongly related to voltage. The correlation between voltage and power was 0.975, and the fitted trend increased by about 0.565 W per volt. In contrast, the voltage-current correlation was moderate at 0.603, because current does not rise linearly during the whole test: it first climbs to overcome static friction, then drops and stabilizes after the mechanism starts moving.
Statistical Discussion of the Startup Curves
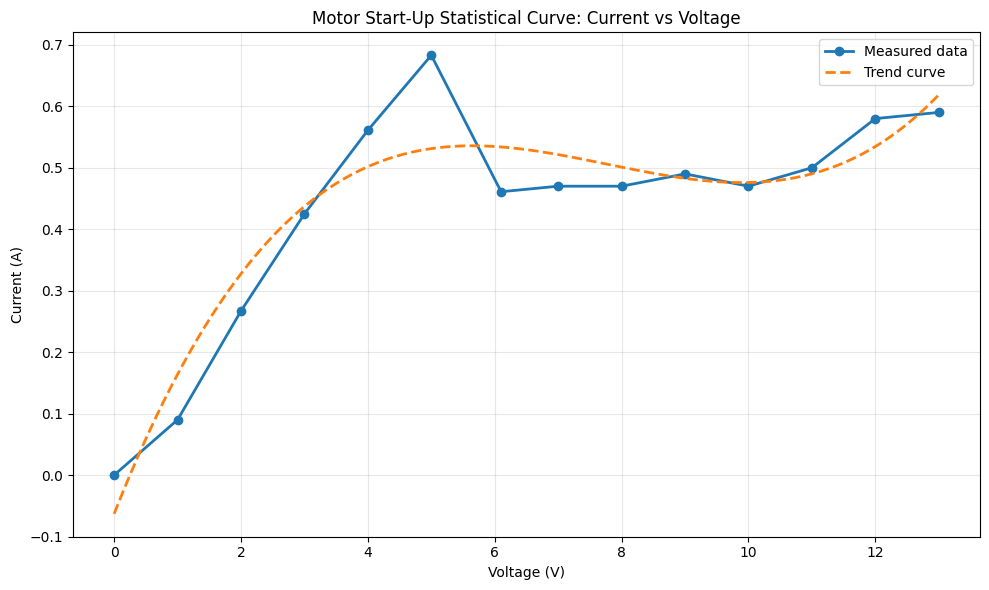
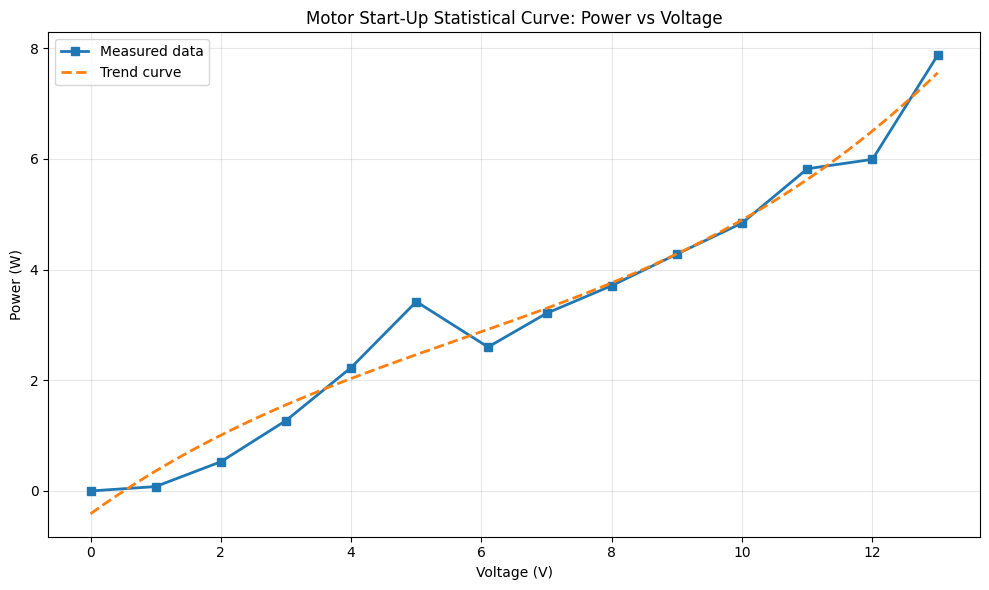
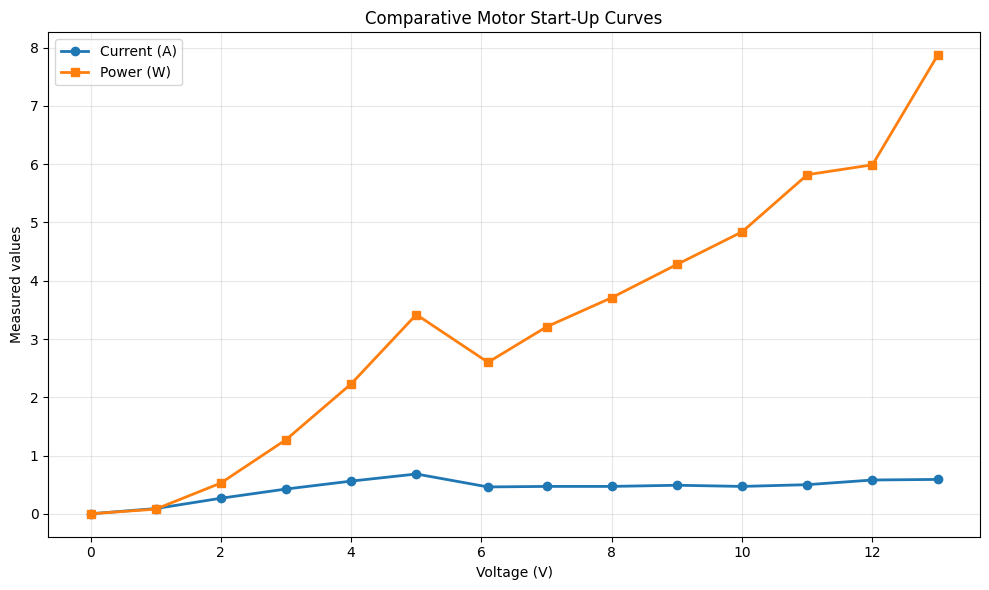
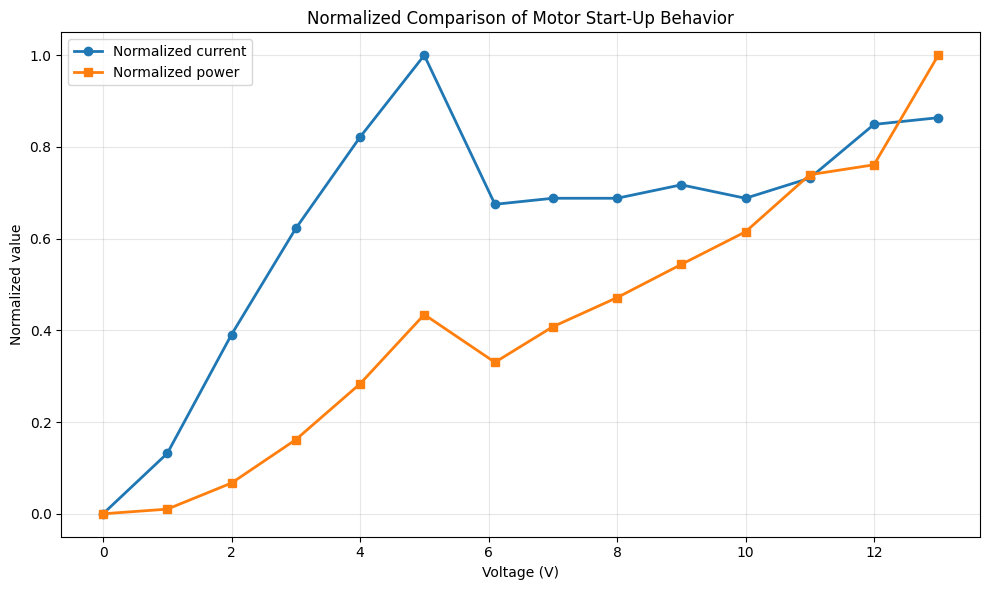
The current curve shows a clear transient startup region between 0 V and 5 V. In this region, current rises quickly from 0 A to 0.683 A. This maximum value is the most important point of the test because it corresponds to the moment when the motor has to overcome static friction and the inertia of the conveyor belt. Statistically, this point behaves as a local peak rather than as part of a smooth linear increase.
After the peak, the current decreases to 0.461 A at 6.10 V and then remains in a narrower operating band. From 6.10 V to 13.00 V, most current values stay between approximately 0.47 A and 0.59 A. This behavior indicates that once the belt is already moving, the motor requires less current to maintain motion than it required to start the mechanism.
The power curve behaves differently. Power continues increasing as voltage increases, even when current is relatively stable, because electrical power is calculated as P = V x I. For this reason, the highest power value appears at 13 V with 7.87 W, while the highest current appears much earlier at 5 V. This difference separates two design concerns: startup current is critical for breaking inertia, while higher-voltage operation is critical for total power consumption and thermal load.
The normalized comparison makes the startup effect easier to see. Current reaches its normalized maximum at the startup point, then falls and stabilizes. Power, however, keeps increasing toward the highest voltage. This means the conveyor belt system has two operating phases: a short inertia-breaking phase dominated by current demand, and a running phase where power grows mainly with voltage.
Design conclusion: the conveyor belt should be powered with a supply and driver that can safely provide more than the measured startup peak of 0.683 A. A practical design margin should be added because real loads, belt tension, friction, and repeated starts can increase the required current.
Learning Reflection
Through this activity, the group learned how to use measurement instruments such as a multimeter, differentiate between voltage and current measurement techniques, and apply theoretical concepts to real systems. The analysis also showed how control logic affects the behavior and energy consumption of output devices.
Group Assignment – Measuring Power Consumption of an Output Device
The objective of this assignment is to measure the electrical power consumption of an output device. In this case, a 5V DC motor controlled by a XIAO ESP32-C3 through an L298N driver is analyzed. The motor rotates alternately in both directions every 4 seconds.
System Description
The system consists of a DC motor connected to an H-bridge driver (L298N), allowing bidirectional rotation. A microcontroller (XIAO ESP32-C3) controls the motor direction using timed signals.
- Motor rotation: 4 seconds clockwise
- Motor rotation: 4 seconds counterclockwise
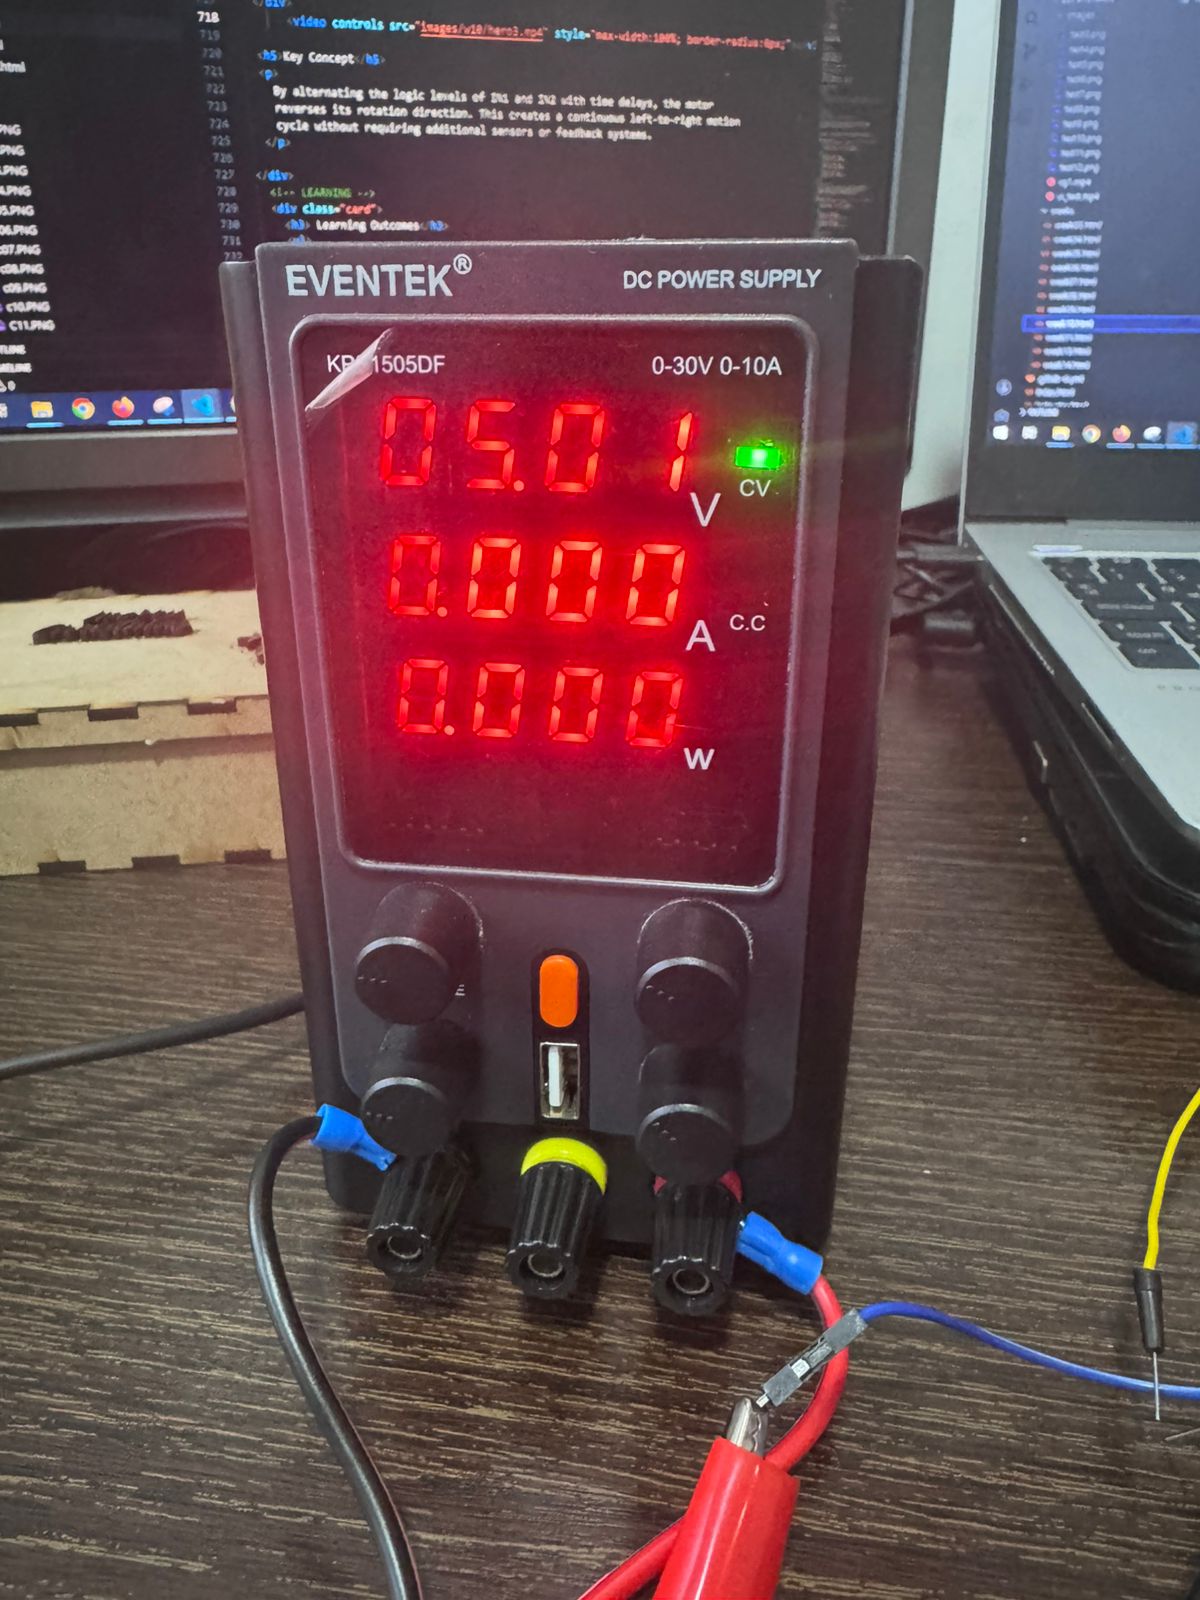
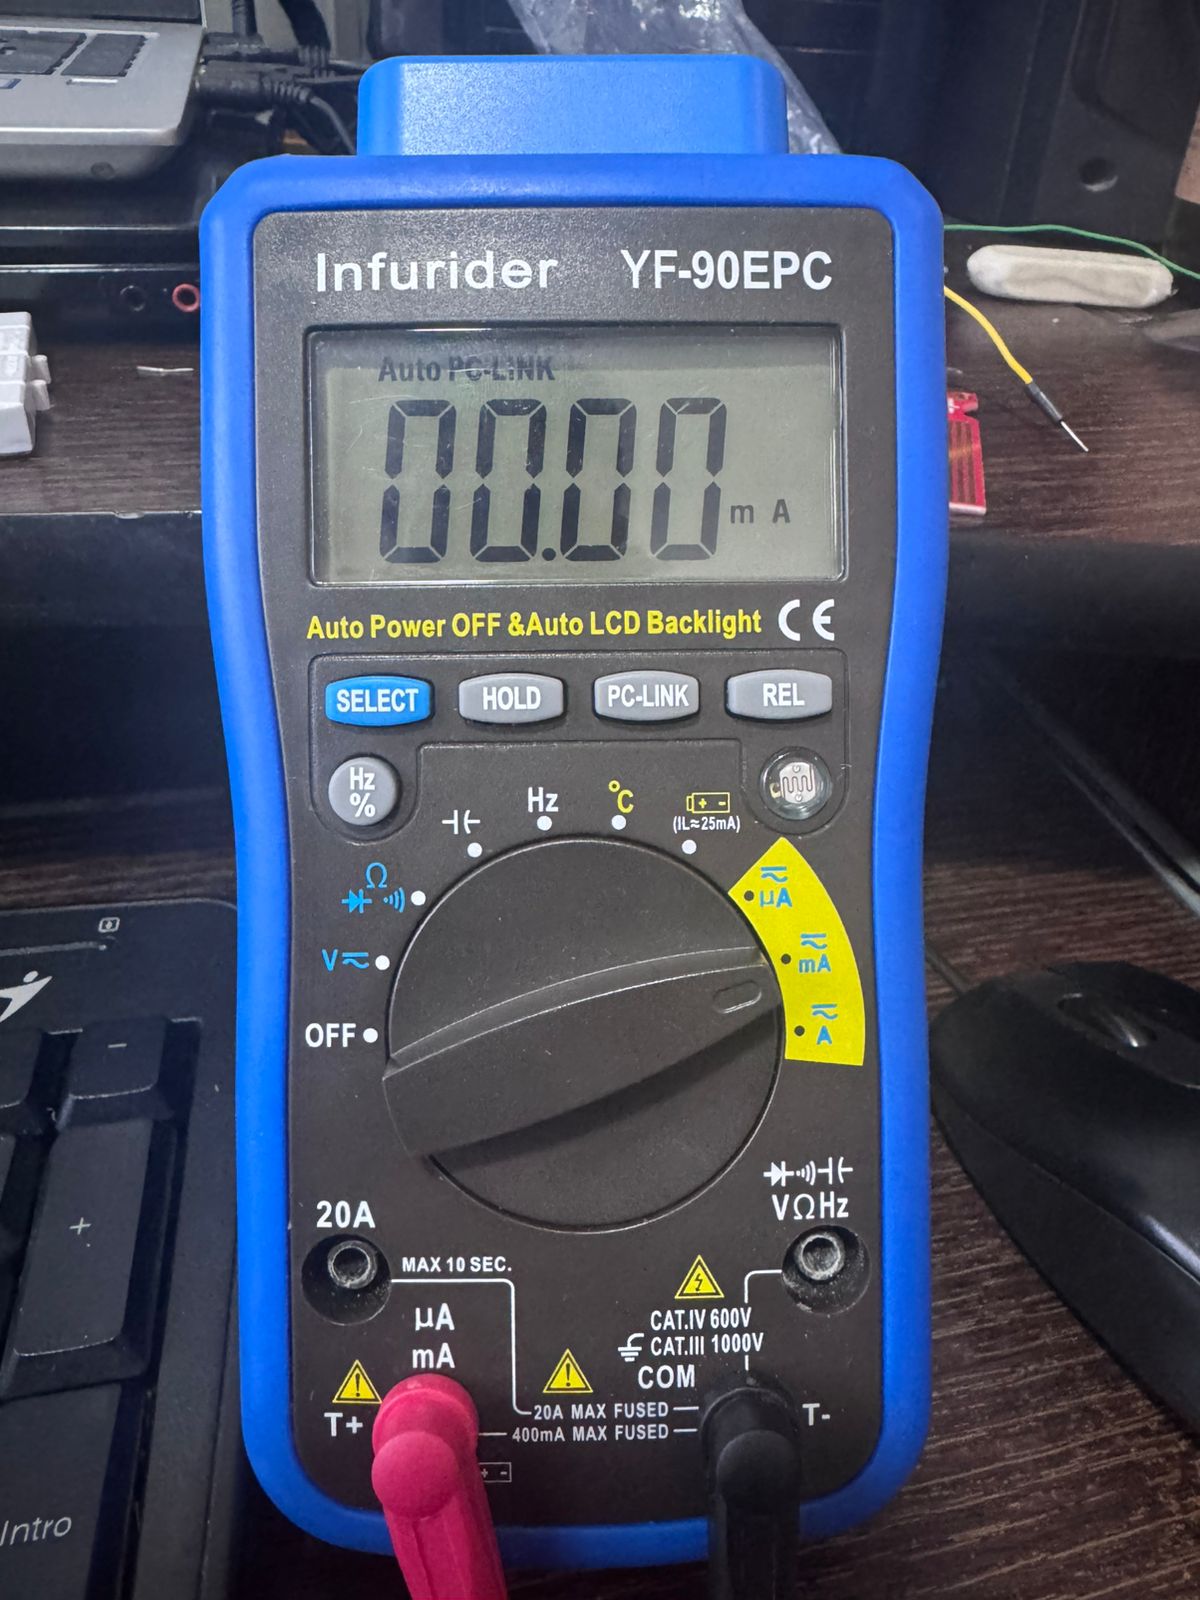
- Measurement tools: Multimeter and power supply
Materials and Equipment
The following materials and instruments were used to assemble the system and perform the power consumption measurements of the DC motor.
Measurement Instruments
| Instrument | Function |
|---|---|
| Multimeter | Used to measure voltage (parallel) and current (series) |
| DC Power Supply | Provides stable voltage for the motor and driver module |
Main Components
| Component | Description |
|---|---|
| XIAO ESP32-C3 | Microcontroller used to control motor direction |
| L298N Motor Driver | H-bridge module used to control motor direction and power |
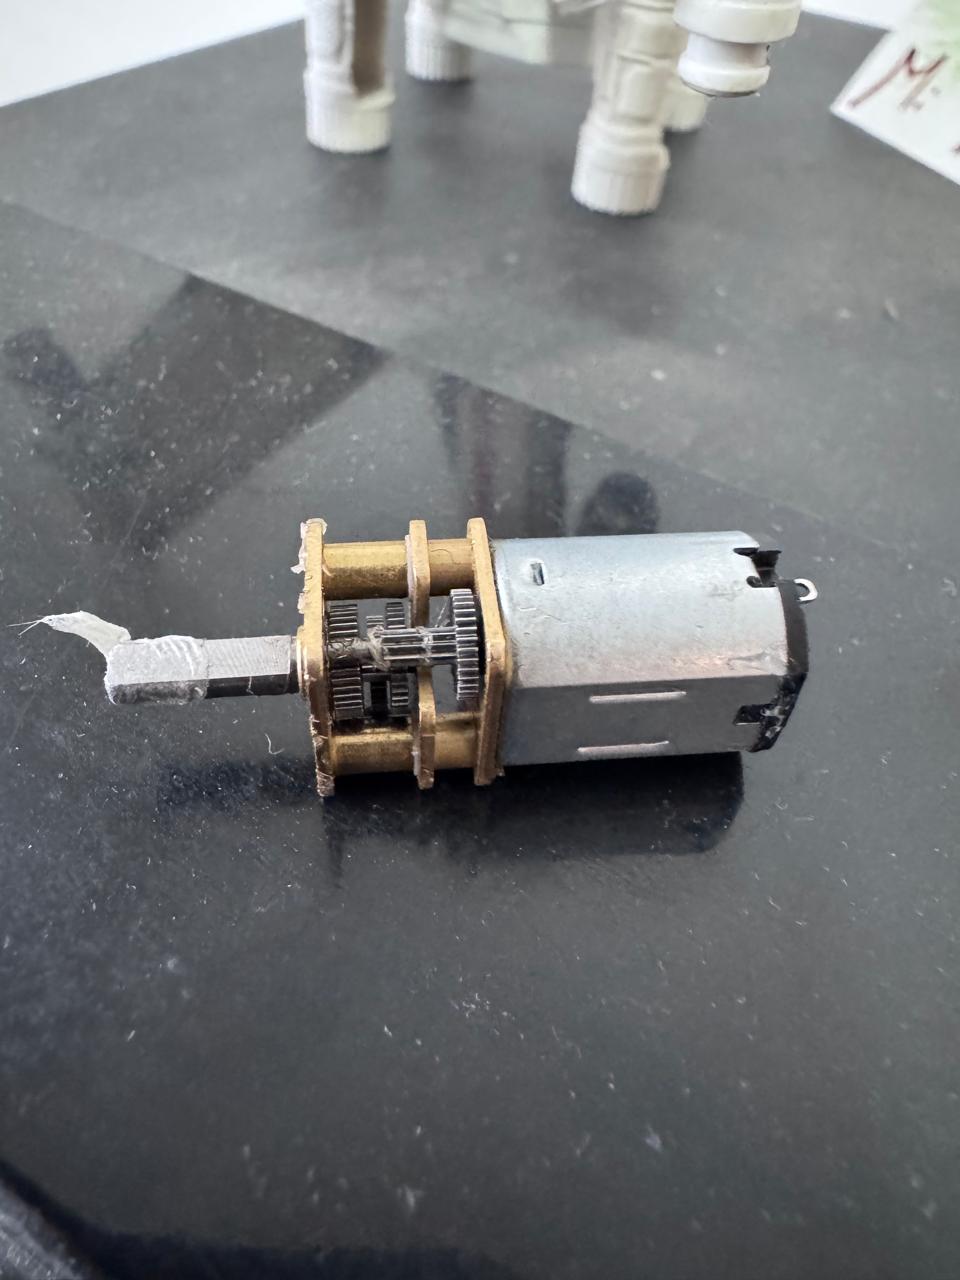
| DC Motor (5V) | Output device used for rotation and power measurement |
Additional Materials
| Material | Purpose |
|---|---|
| Protoboard | Used to assemble the circuit without soldering |
| Jumper Wires | Electrical connections between components |
| USB Cable | Used to program and power the XIAO ESP32-C3 |
| Resistors (optional) | Used if needed for signal conditioning or protection |
System Overview
The system integrates a microcontroller (XIAO ESP32-C3) with an H-bridge driver (L298N) to control the direction of a 5V DC motor. Measurement instruments such as a multimeter and a power supply are used to analyze electrical parameters, including voltage, current, and power consumption.
Workflow
- Design and assemble the circuit on a protoboard
- Connect the motor to the L298N driver (OUT1 and OUT2)
- Upload the control code to the XIAO ESP32-C3
- Verify bidirectional motor operation
- Measure voltage across the motor terminals (parallel measurement)
- Measure current flowing through the motor (series measurement)
- Calculate electrical power using measured values
Code Description – Bidirectional DC Motor Control
This program controls a DC motor using an H-bridge driver (L298N) to alternate its rotation direction at fixed time intervals. The motor rotates in one direction for 3 seconds, then reverses its direction for another 3 seconds, creating a continuous oscillating motion.
Code Implementation
// DC Motor Bidirectional Control with Time Intervals

const int IN1 = 6; // D4
const int IN2 = 7; // D5

void setup() {
  pinMode(IN1, OUTPUT);
  pinMode(IN2, OUTPUT);
}

void loop() {

  // Rotate in one direction
  digitalWrite(IN1, HIGH);
  digitalWrite(IN2, LOW);
  delay(3000);

  // Rotate in opposite direction
  digitalWrite(IN1, LOW);
  digitalWrite(IN2, HIGH);
  delay(3000);
}
Program Logic
- The pins IN1 and IN2 control the direction of the motor through the L298N driver
- When IN1 is HIGH and IN2 is LOW, the motor rotates in one direction
- When IN1 is LOW and IN2 is HIGH, the motor rotates in the opposite direction
- The delay function defines the duration of each movement (3 seconds)
Key Concept
By alternating digital signals and using time delays, the system achieves bidirectional motion without sensors. This technique is useful in applications requiring repetitive or oscillating movement.
Voltage Measurement
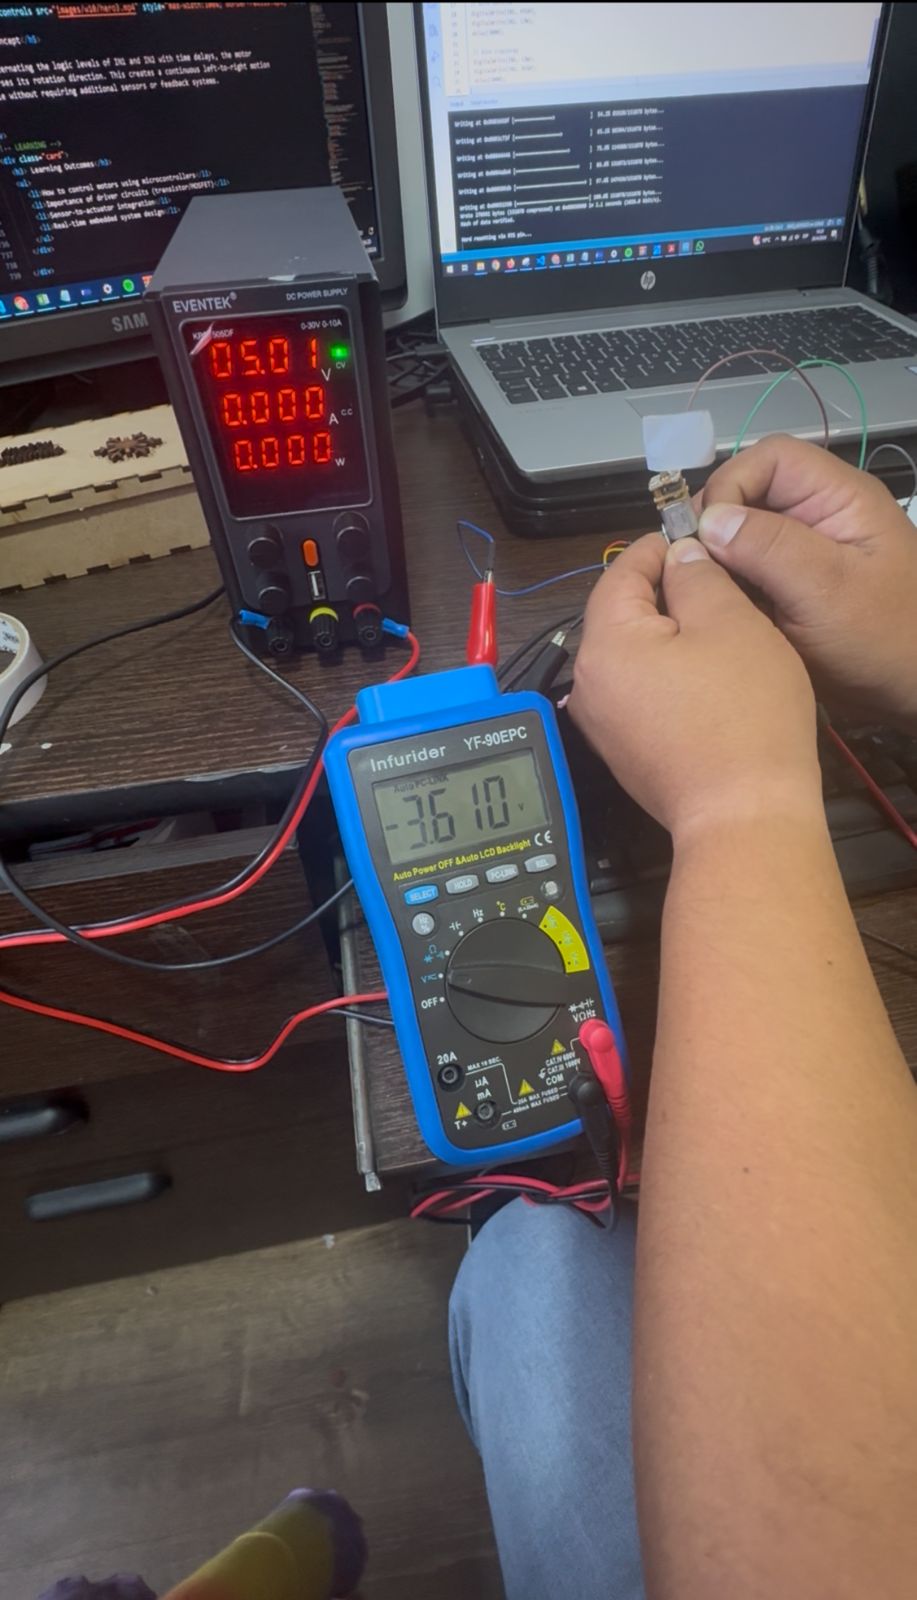
Voltage was measured in parallel across the motor terminals while operating in both directions.
| Rotation Direction | Voltage (V) |
|---|---|
| Clockwise | 3.56 V |
| Counterclockwise | -3.56 V |
The negative voltage indicates a reversal in polarity due to the H-bridge configuration.
Current Measurement
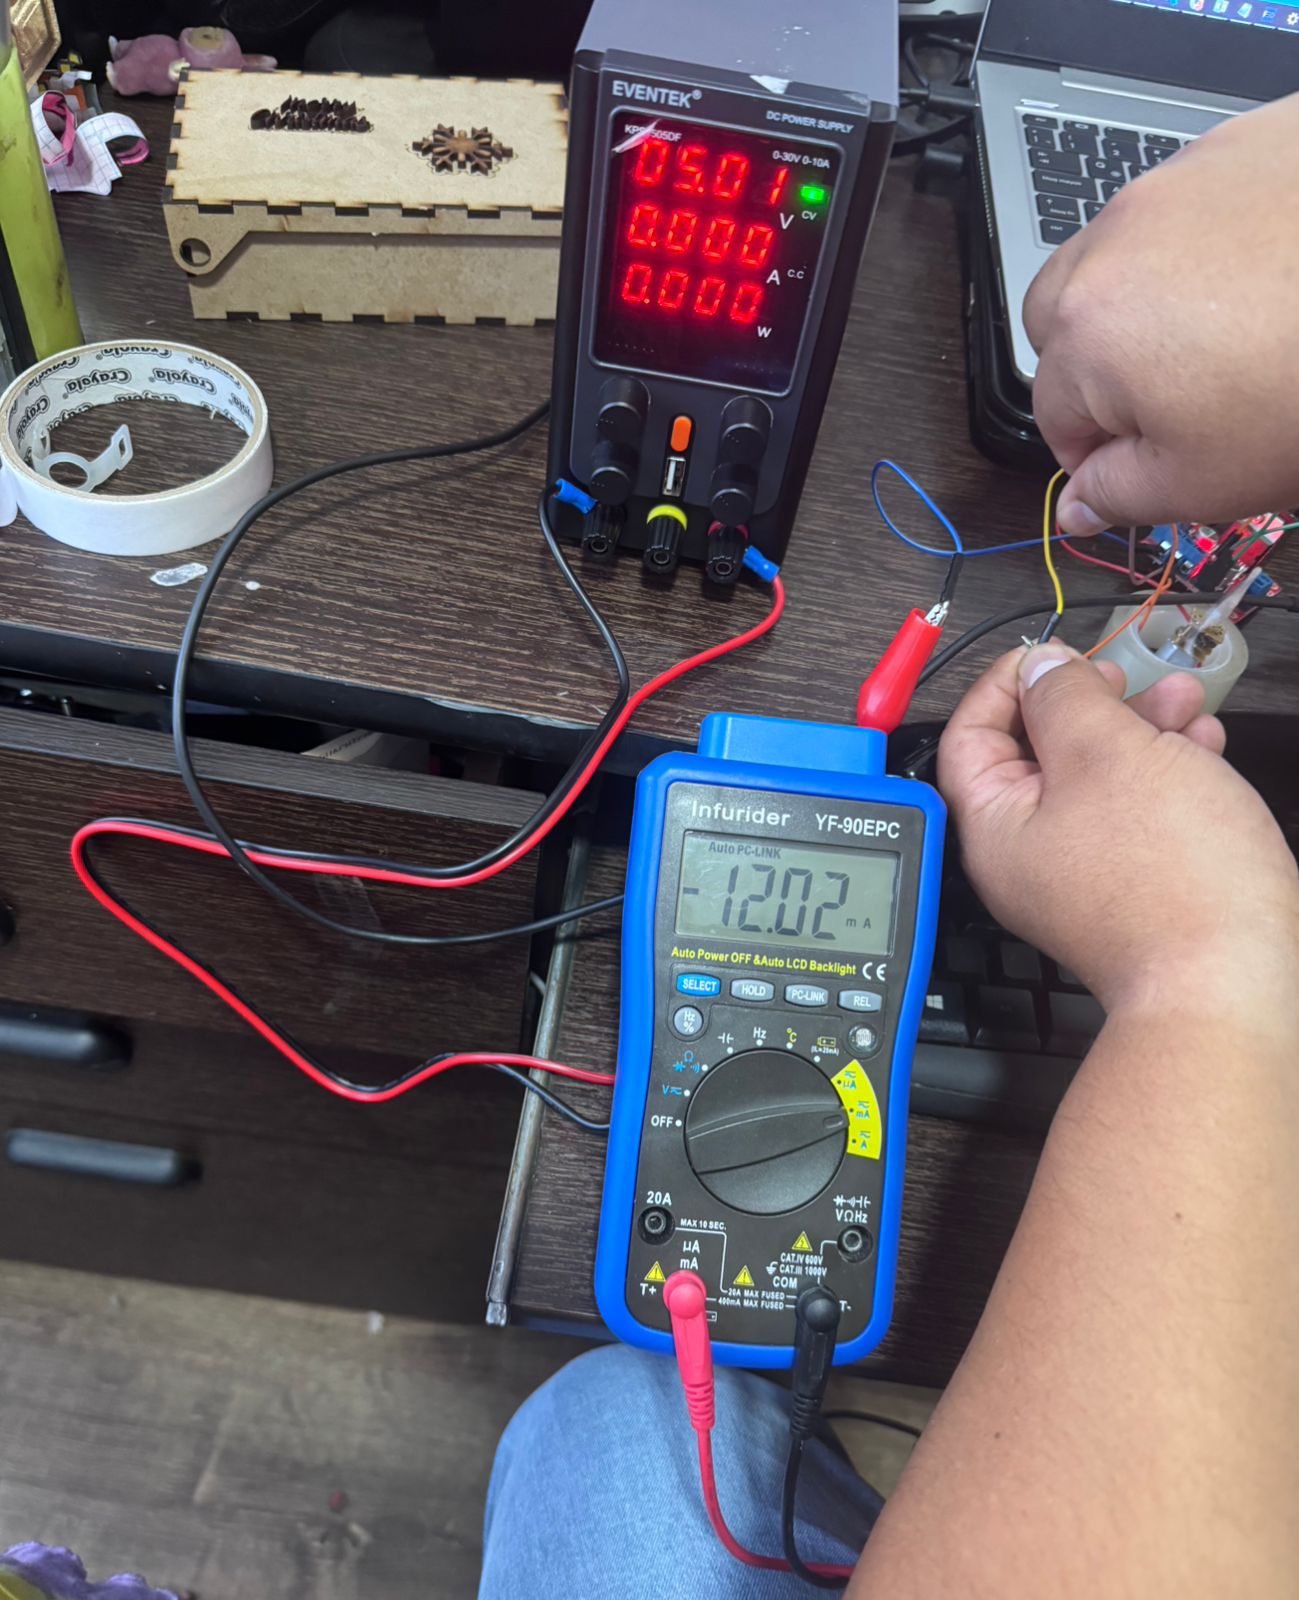
Current was measured in series with the motor using a multimeter.
| Rotation Direction | Current (mA) |
|---|---|
| Clockwise | 12.10 mA |
| Counterclockwise | -12.10 mA |
PCB Output Device Test with L9110S Driver
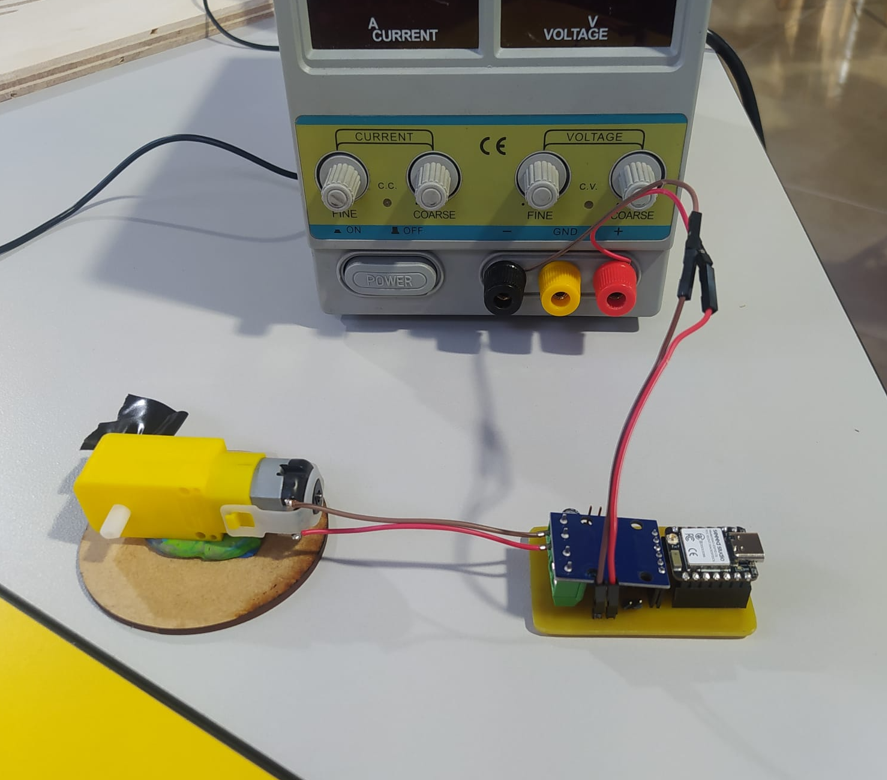
Another output device test was performed using an integrated PCB that includes a XIAO ESP32-C6, an L9110S motor driver, a DC motor output, and an LED. The L9110S works as an H-bridge driver, allowing the microcontroller to control the motor by switching the output polarity applied to the motor terminals.
In this circuit, the motor and LED are used as output devices. The motor response was analyzed using both an oscilloscope and a Fluke 117 multimeter to observe the electrical behavior when the motor turns on and off.
Oscilloscope Measurement
The oscilloscope was used to observe the voltage waveform generated when the motor was turned on and off. The measurement was taken using GND and one of the motor output terminals, allowing the voltage behavior of the motor output to be visualized over time.
This measurement is useful because the motor does not behave as a purely static load. When it starts, stops, or changes state, the output signal can show variations and peaks caused by the switching of the driver and the electrical behavior of the motor.
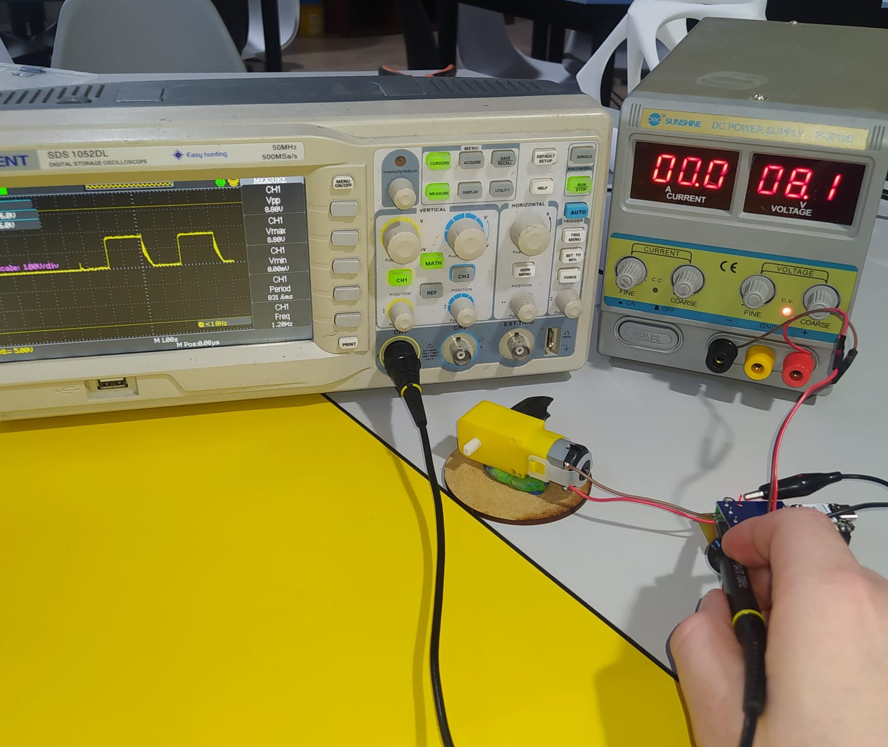
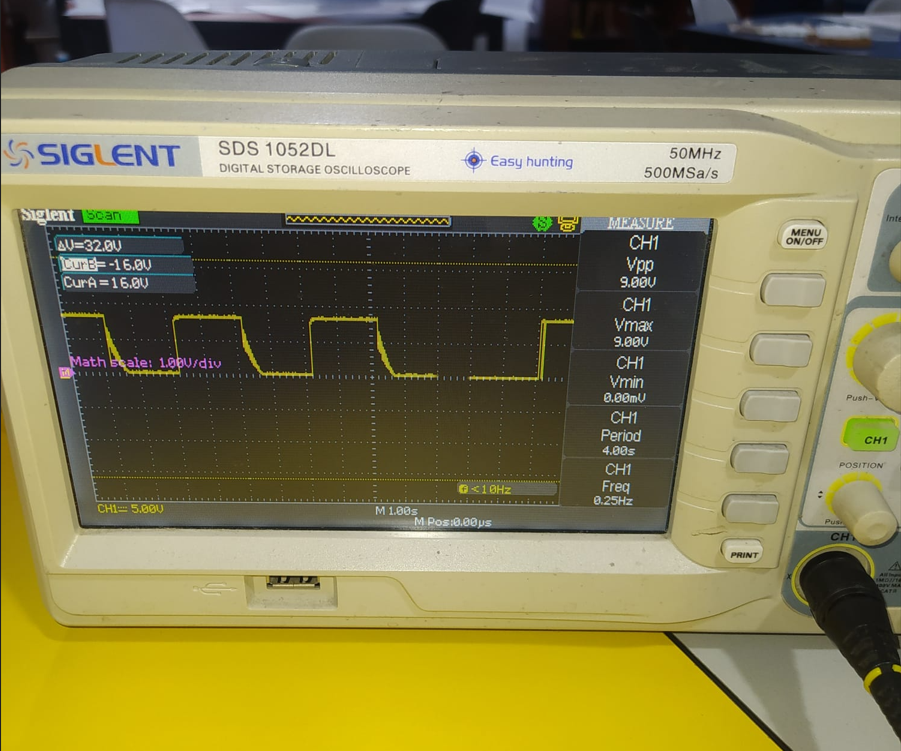
In the video, the oscilloscope shows how the waveform changes as the motor is activated. The generated signal allows us to identify the voltage variation at the output of the driver during the operation of the motor.
Multimeter Voltage Measurement
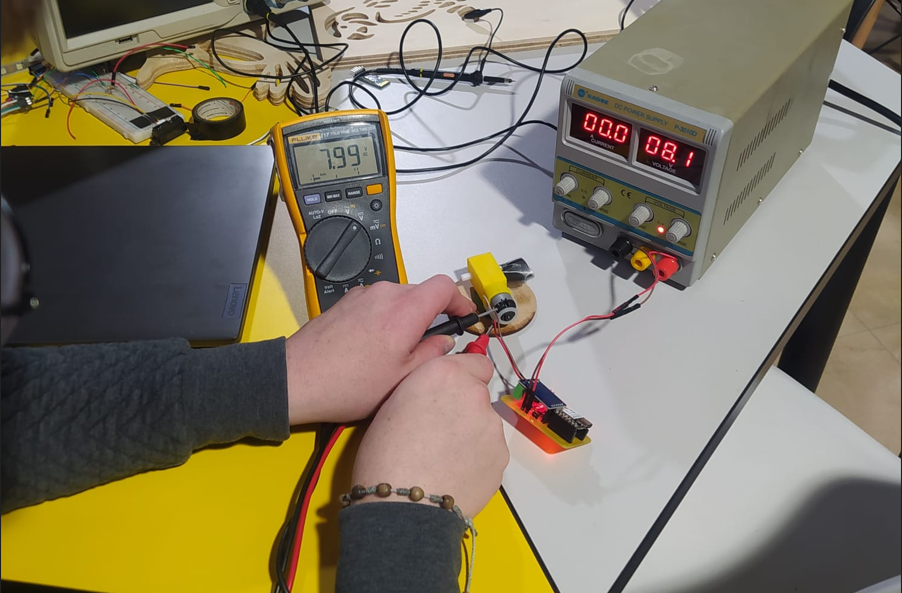
The motor voltage was also measured using a Fluke 117 multimeter. For this measurement, the multimeter probes were placed at both terminals of the motor to read the voltage directly across the output device while it was turned on.
When the motor was activated, the measured voltage was approximately 7.99 V. This value represents the voltage applied to the motor terminals during operation.
Additional Results
- The L9110S driver output was observed with the oscilloscope, showing the voltage waveform generated when the motor was turned on and off.
- The multimeter measurement across the motor terminals showed approximately 7.99 V while the motor was activated.
Power Calculation
Electrical power is calculated using the fundamental formula:
P = V × I
Where:
- P = Power (Watts)
- V = Voltage (Volts)
- I = Current (Amperes)
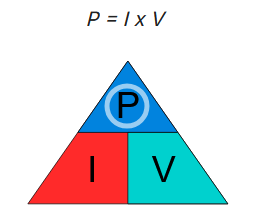
Calculation
Converting current to amperes:
12.10 mA = 0.0121 A
Power:
P = 3.56 × 0.0121 = 0.043076 W
Therefore, the motor consumes approximately:
0.043 W (43 mW) in both directions.