Week 6 – Electronic Design
Electronic design
Personal Contributions
| Name | University | Activities carried out |
|---|---|---|
| Rodrigo Guamán | Universidad de Cuenca |
|
| Jenny Rojas | Universidad de Cuenca |
|
| Diego Zhindón | Universidad Politécnica Salesiana |
|
1. Introduction
This week’s group assignment consisted of learning how to use laboratory test equipment to observe and analyze the operation of a microcontroller circuit board.
As a minimum requirement, we demonstrated the use of:
- A Multimeter
- An Oscilloscope
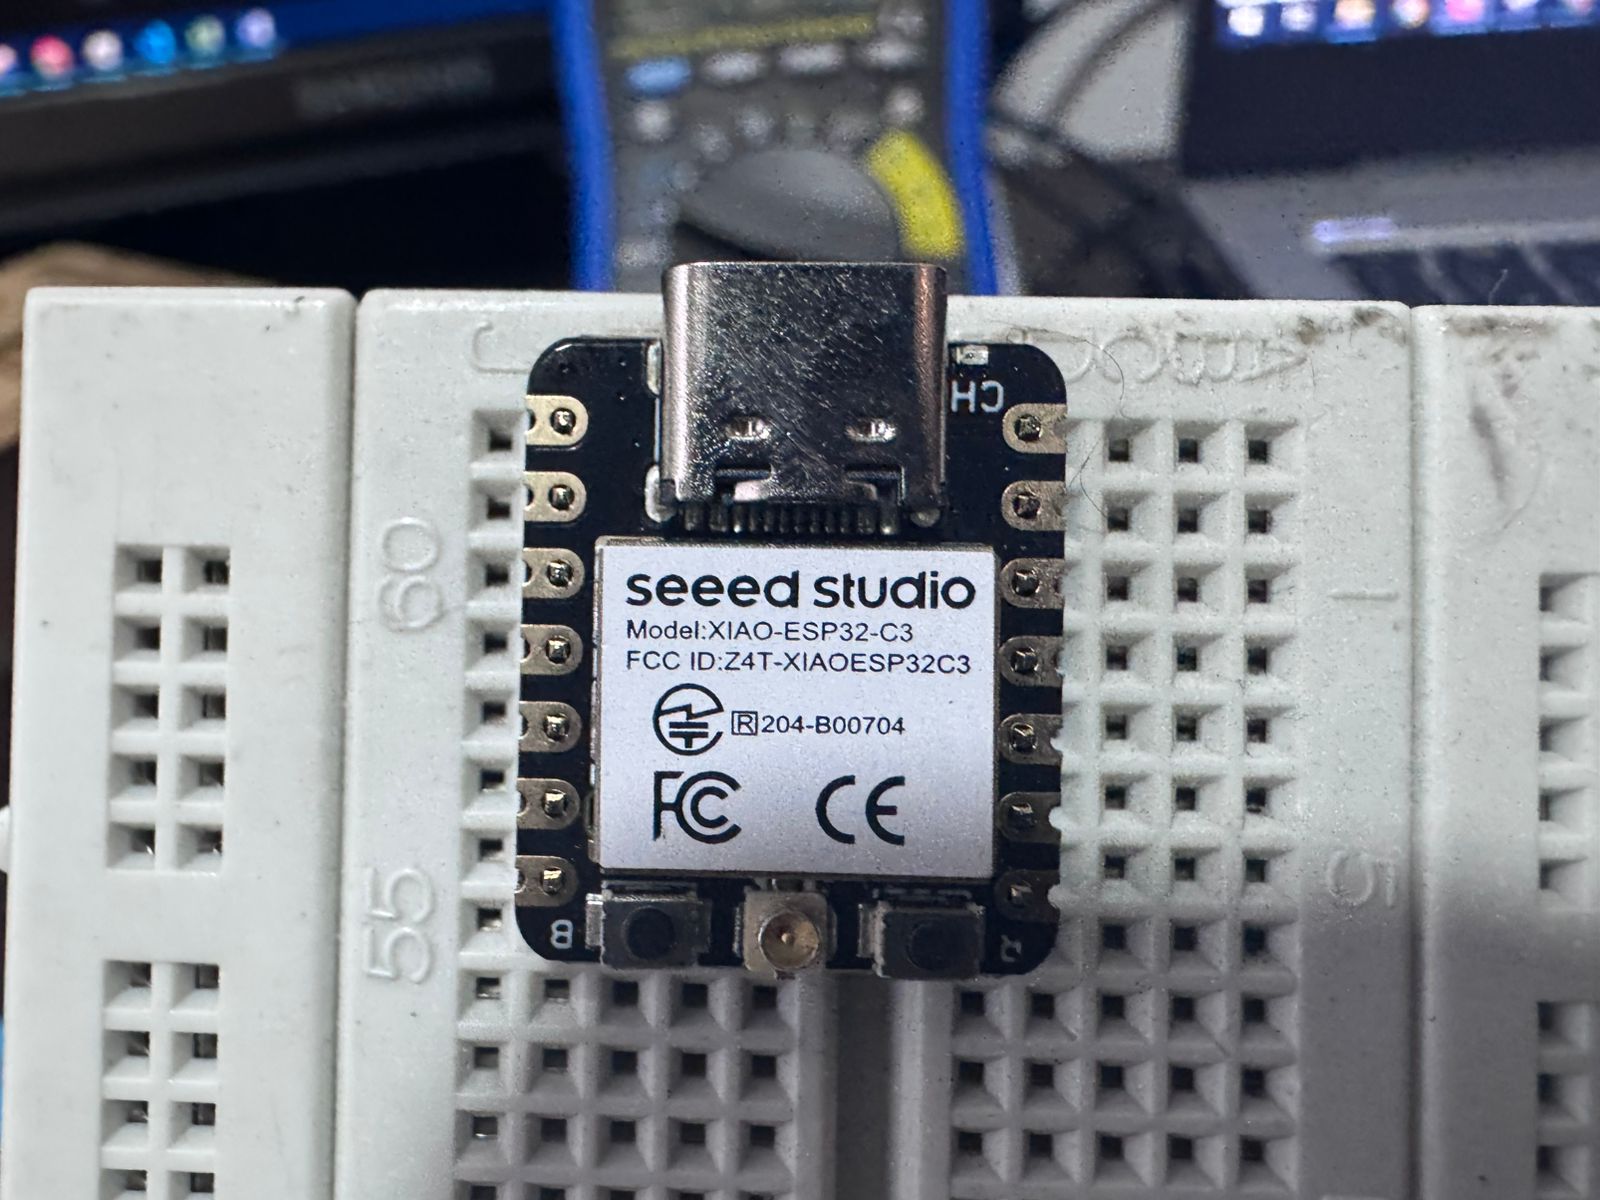
The system under test was an ESP32-C3 development board powered via USB (5V) and operating at 3.3V logic level.
The objective was to understand how electrical signals behave in real hardware and to validate circuit functionality before moving into PCB design.
2. Definitions of Technical Equipment
| Equipment | Description | Useful For |
|---|---|---|
| Regulated Power Supply | Provides stable DC voltage independent of input fluctuations. | Safely powering circuits during testing. |
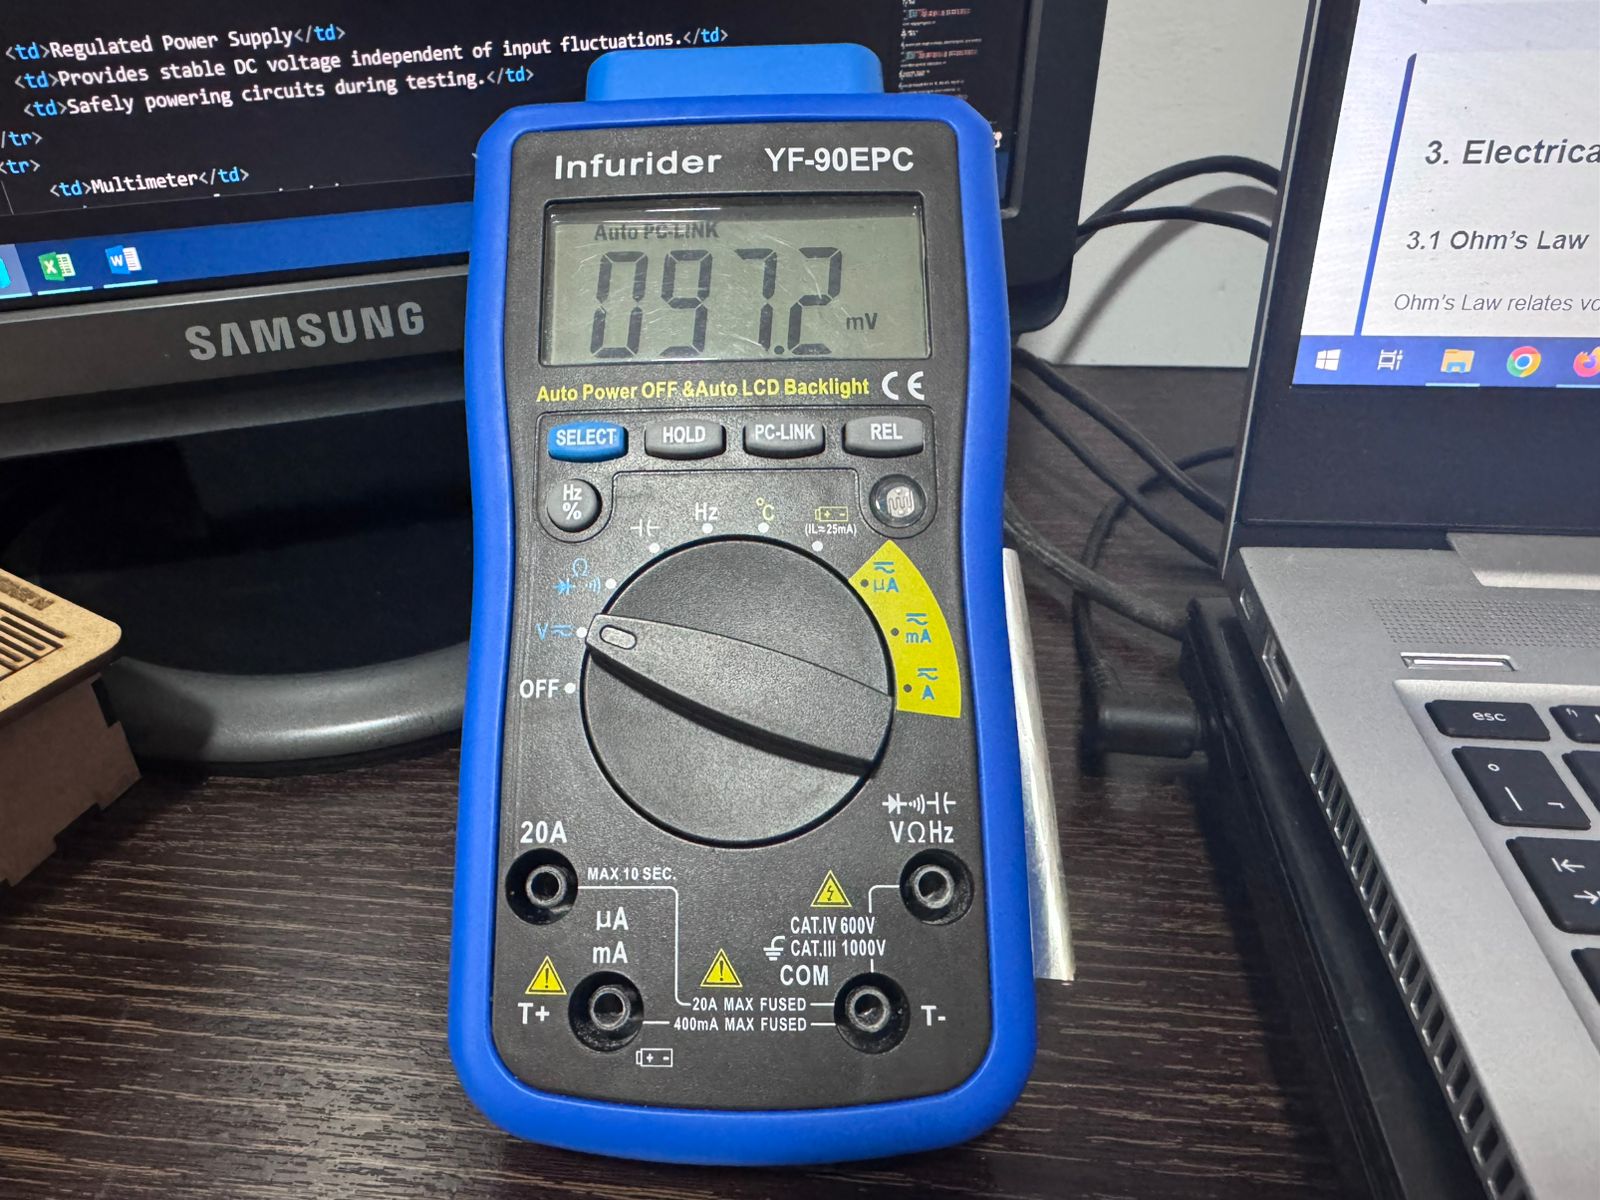
| Multimeter | Measures Voltage (AC/DC), Current, Resistance, Continuity, and sometimes Capacitance. | Diagnosing circuit issues and verifying correct electrical values. |
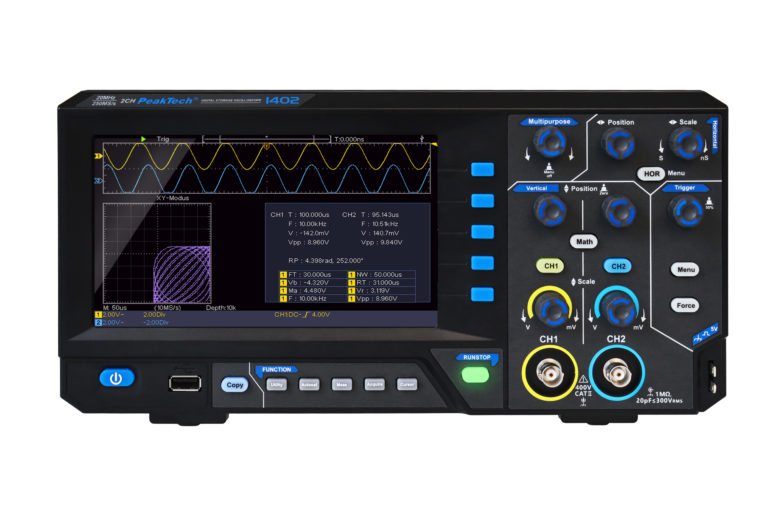
| Oscilloscope | Displays voltage as a function of time (Voltage vs Time). | Observing waveform shape, frequency, amplitude, and signal integrity. |
| Logic Analyzer | Captures multiple digital signals simultaneously. | Analyzing digital communication and logic states. |
| Mixed Signal Oscilloscope | Combines analog and digital signal analysis. | Testing circuits with both analog and digital components. |
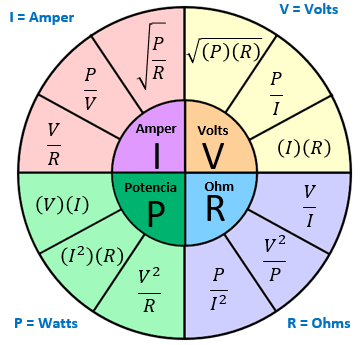
3. Electrical Fundamentals
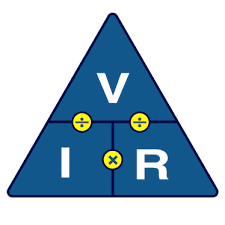
3.1 Ohm’s Law
Ohm’s Law relates voltage, current, and resistance:
V = I × R
Where:
V = Voltage (Volts)
I = Current (Amperes)
R = Resistance (Ohms)
Derived forms:
I = V / R
R = V / I

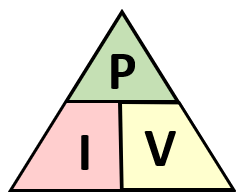
3.2 Electrical Power
Power is the rate at which electrical energy is consumed.
P = V × I
Alternative forms using Ohm’s Law:
P = I² × R
P = V² / R
Where:
P = Power (Watts)
Example – LED with ESP32-C3
ESP32-C3 GPIO = 3.3V
LED forward voltage ≈ 2.0V
Desired current = 5mA (0.005A)
R = (3.3V − 2.0V) / 0.005A
R = 260Ω
Standard value used: 220Ω
Power dissipation in resistor:
P = V × I
P = 1.3V × 0.005A
P = 0.0065W (6.5mW)
A 1/4W resistor is more than sufficient.
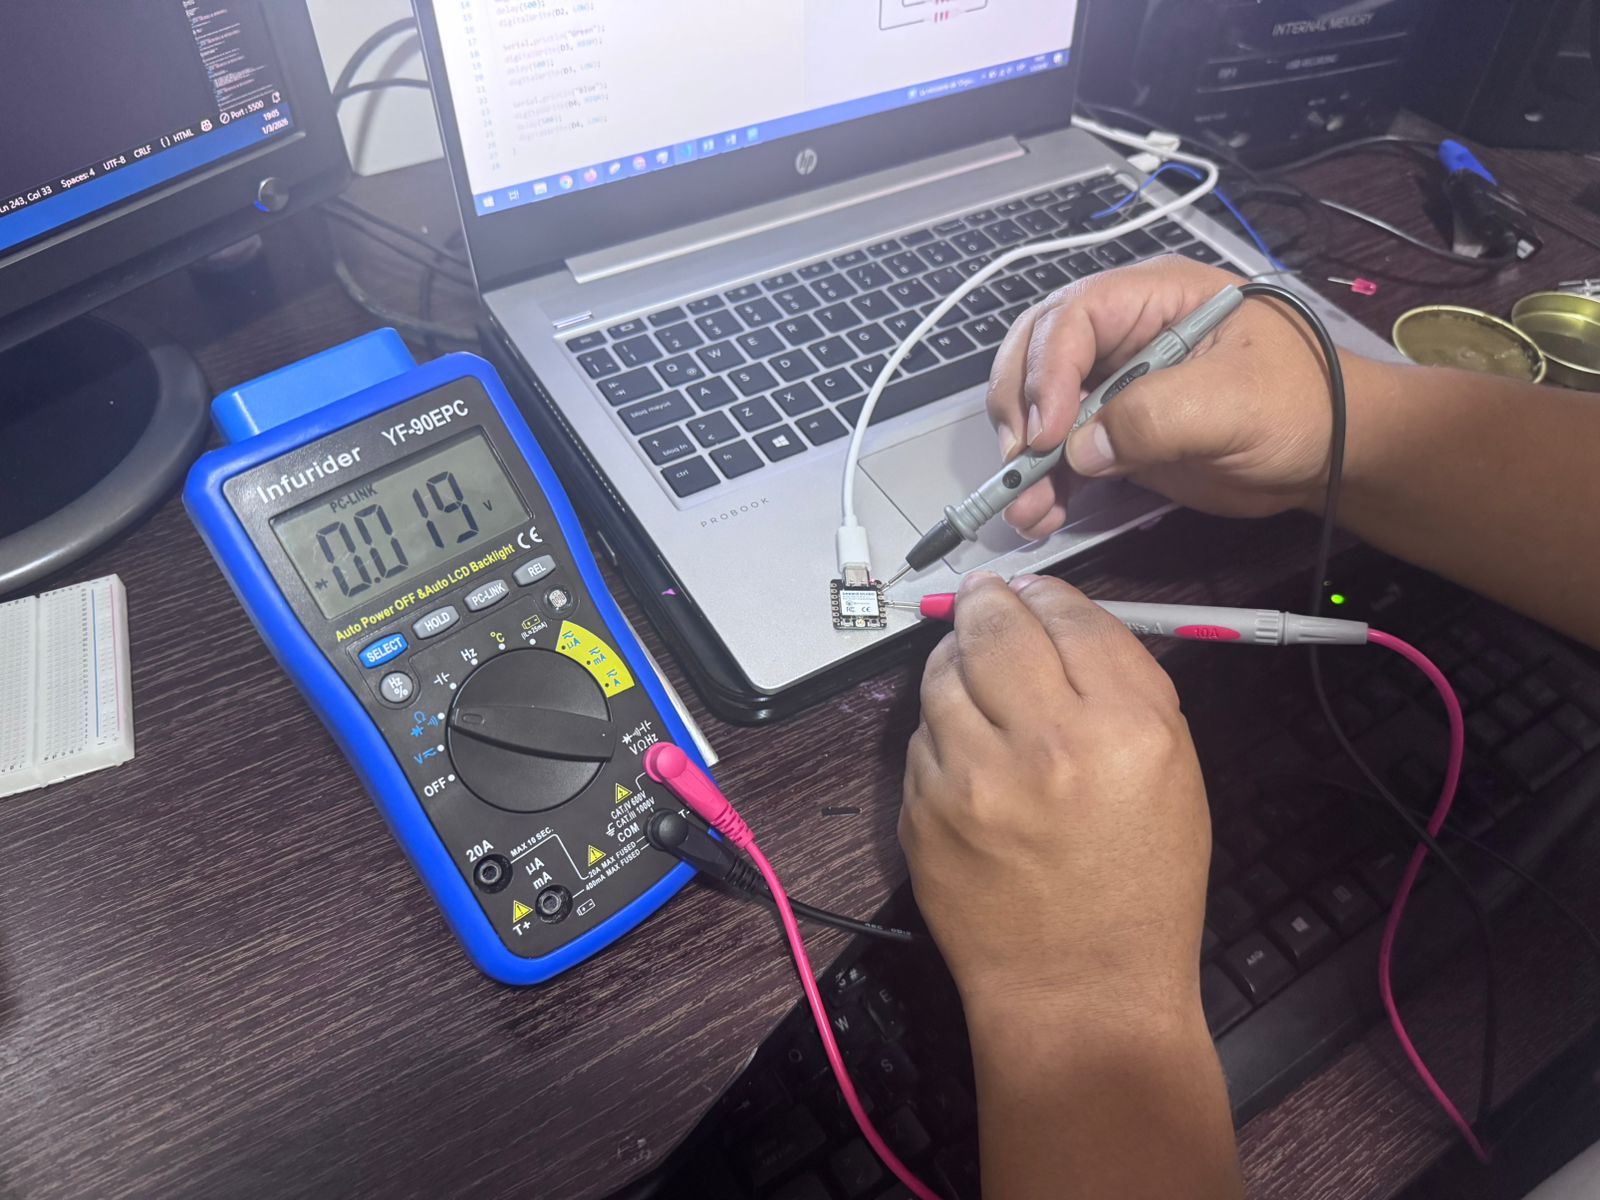
4. Using the Multimeter
4.1 Measuring Voltage
Purpose: Verify correct power supply levels.
- Turn on multimeter.
- Select DC Voltage (<20V range).
- Connect black probe to GND.
- Connect red probe to measurement point.
Measurements performed:
Working battery → 8.9V
Dead battery → 1.2V
ESP32-C3 3.3V output → 3.2V
This confirmed proper voltage regulation.
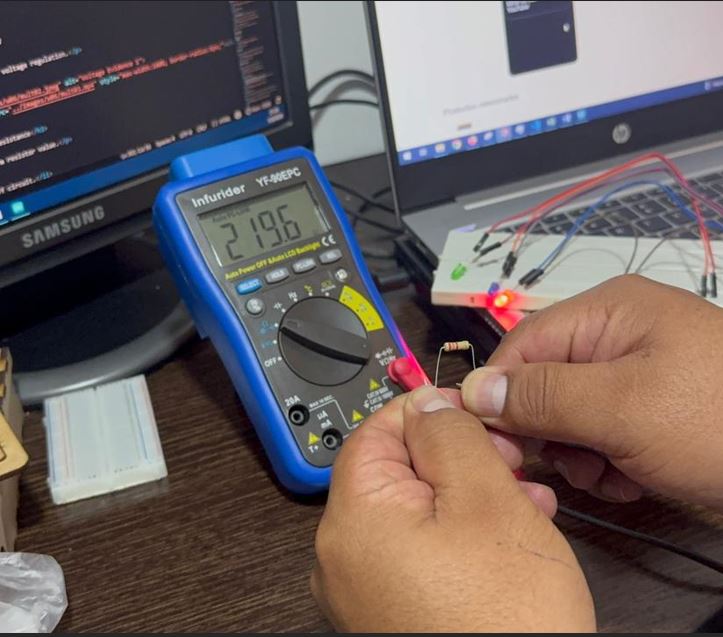
4.2 Measuring Resistance
Purpose: Confirm resistor value.
- Power off circuit.
- Select Ω mode.
- Place probes across resistor terminals.
Measured value: 220Ω
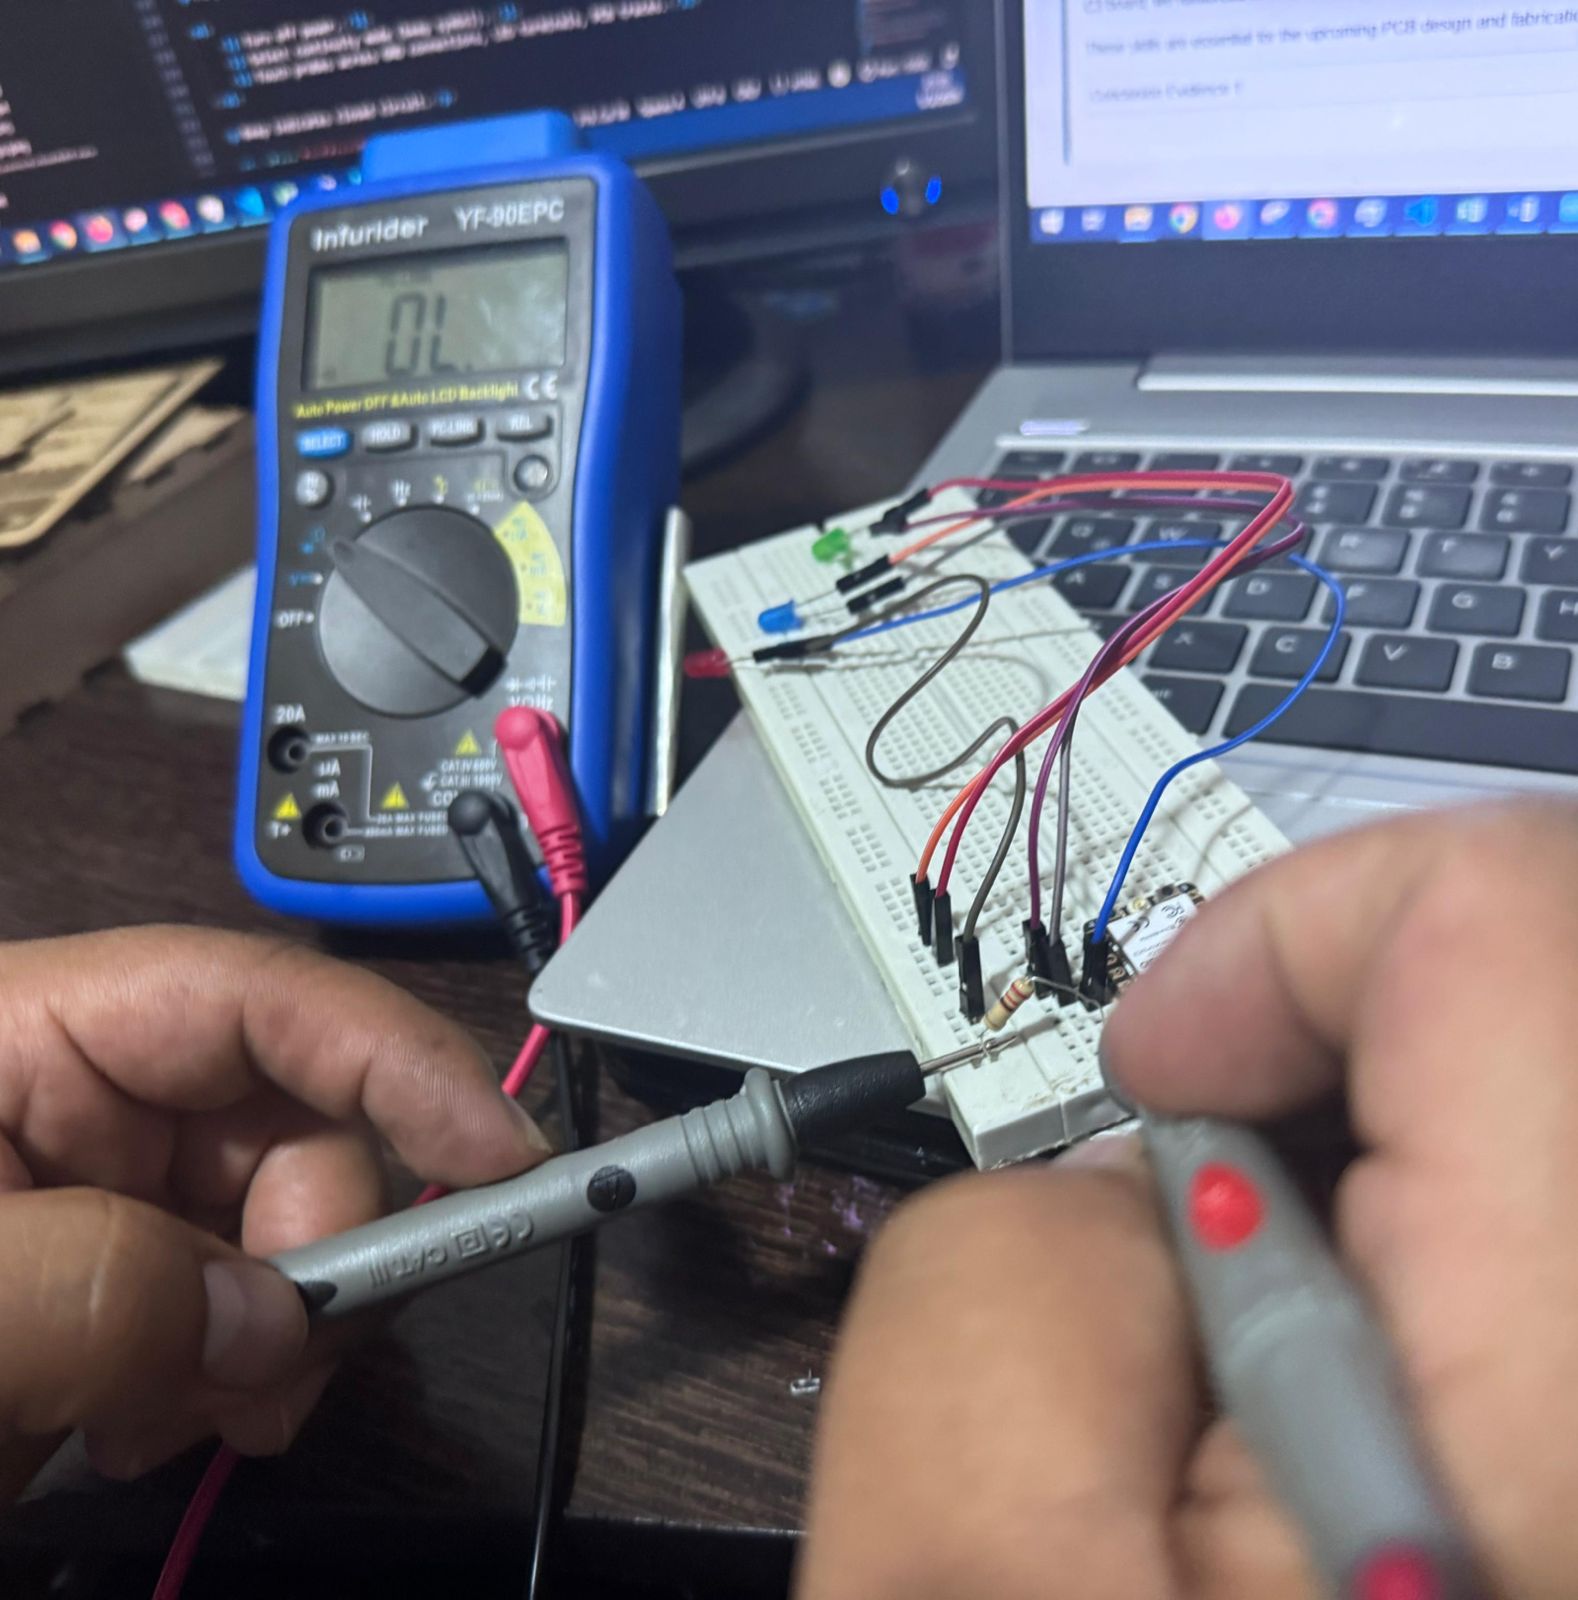
4.3 Testing Continuity
Purpose: Ensure circuit connections are closed and solder joints are correct.
- Turn off power.
- Select continuity mode (beep symbol).
- Touch probes across GND connections, LED terminals, PCB traces.
Beep indicates closed circuit.
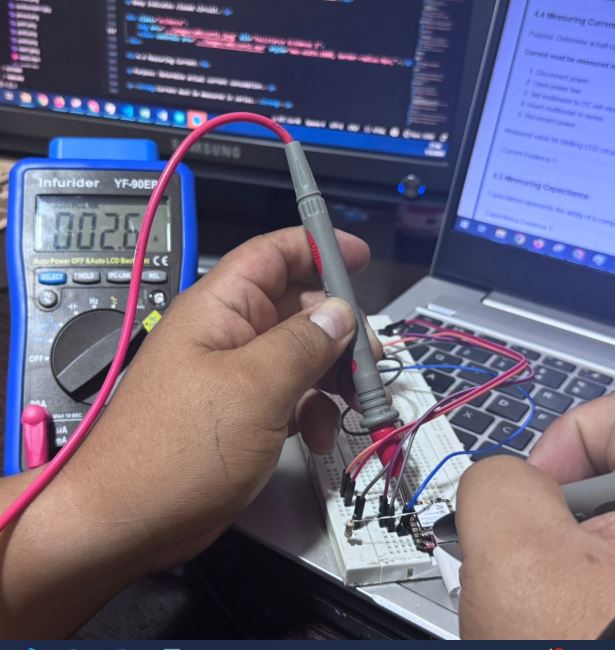
4.4 Measuring Current
Purpose: Determine actual current consumption.
Current must be measured in series.
- Disconnect power.
- Open power line.
- Set multimeter to DC mA mode.
- Insert multimeter in series.
- Reconnect power.
Measured value for blinking LED circuit: 5.4 mA
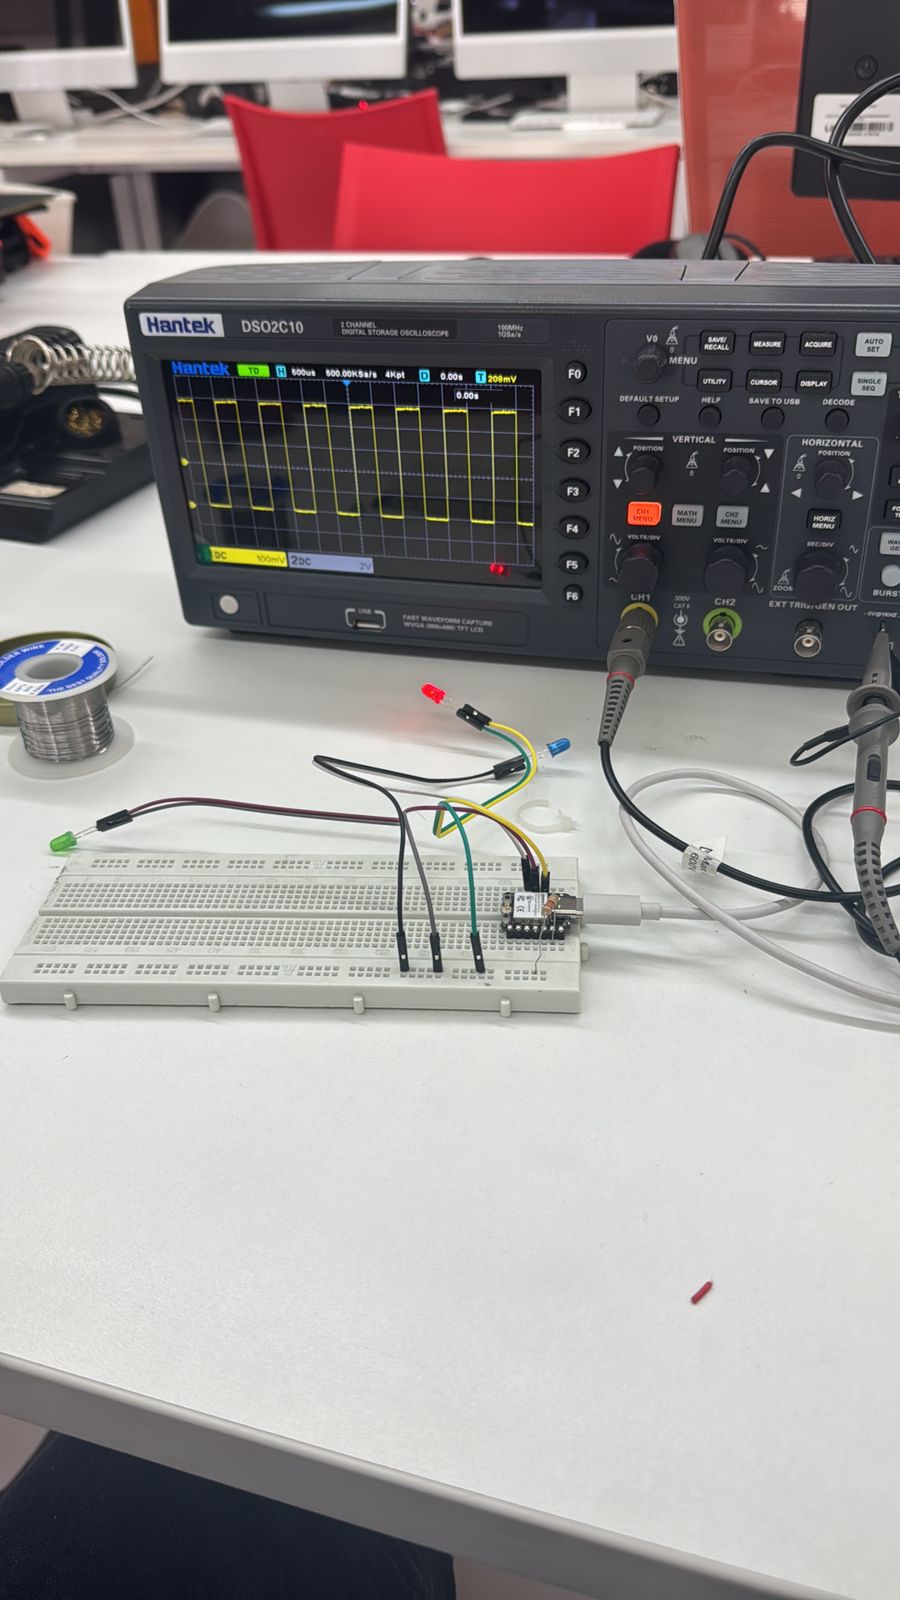
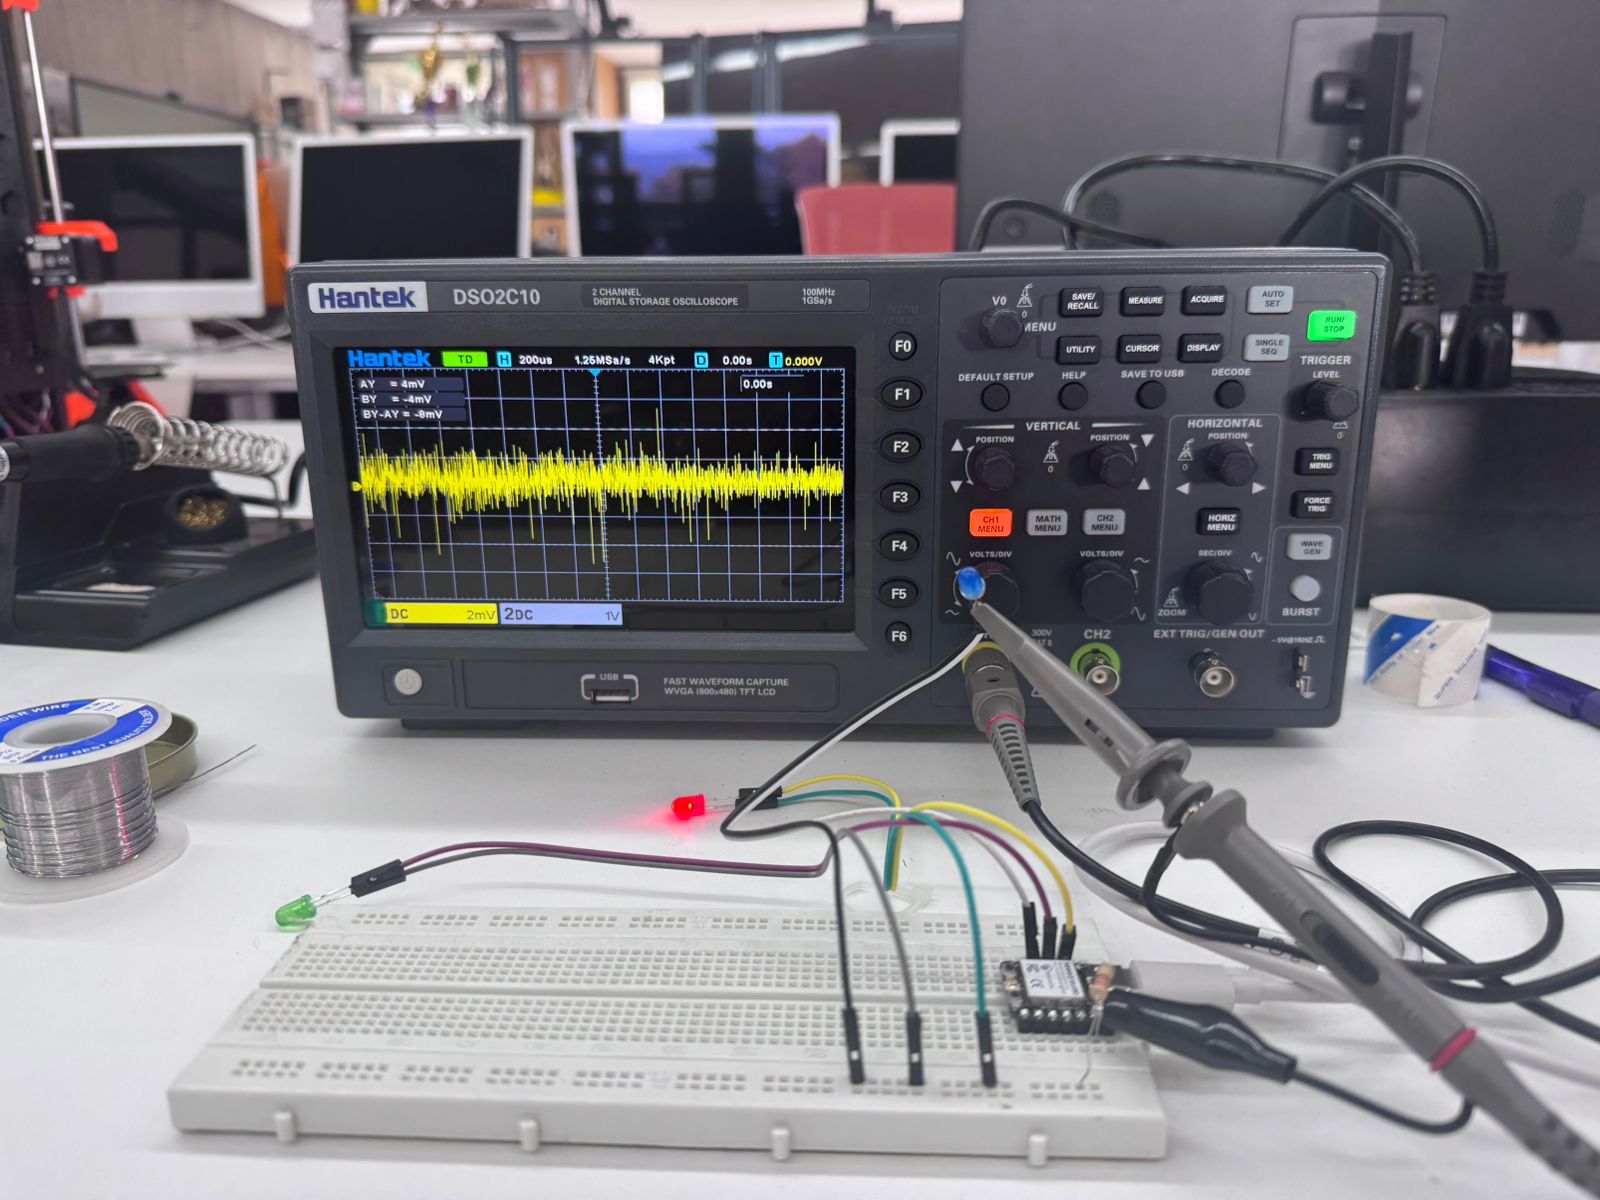
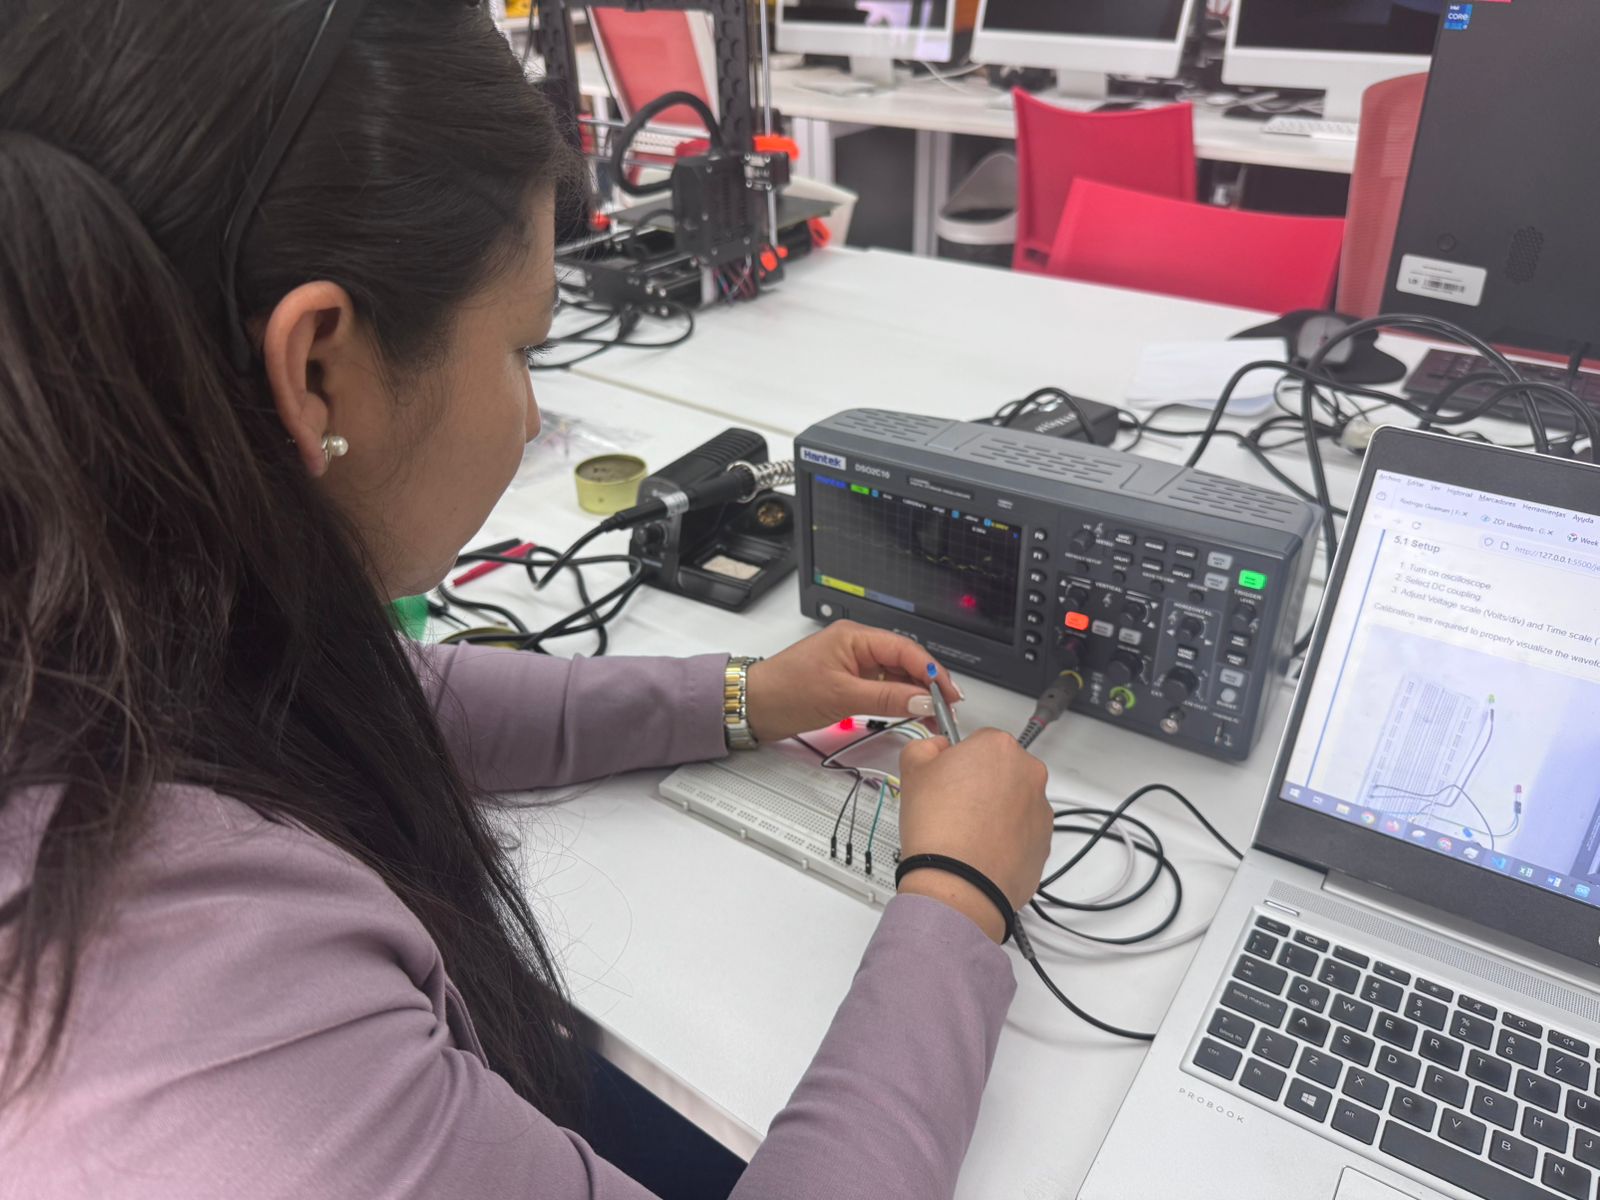
5. Using the Oscilloscope
5.1 Setup
- Turn on oscilloscope.
- Select DC coupling.
- Adjust Voltage scale (Volts/div) and Time scale (Time/div).
Calibration was required to properly visualize the waveform.
5.2 Observing GPIO Blink Signal
The ESP32-C3 was programmed with a blinking LED (100 ms interval).
Probe connections:
Tip → GPIO pin
Ground clip → GND
Observed waveform:
Square wave
0V (LOW)
3.3V (HIGH)
5.3 Changing Frequency
LOW = 500 ms
HIGH = 100 ms
The waveform width changed accordingly, demonstrating duty cycle variation.
5.4 Observing Serial Communication
We transmitted character “K”. ASCII binary: 111101011
Oscilloscope displayed Start bit (0), Data bits, Stop bit (1).
This confirmed correct digital serial transmission.
6. Key Learning Outcomes
- How to safely use a multimeter.
- How to measure voltage, resistance, current, and continuity.
- How to validate power integrity in a microcontroller board.
- The difference between DC average measurement and time-based waveform visualization.
- How digital signals appear as square waves.
- How theoretical calculations compare to real measurements.
7. Individual Contribution – Diego Zhindón
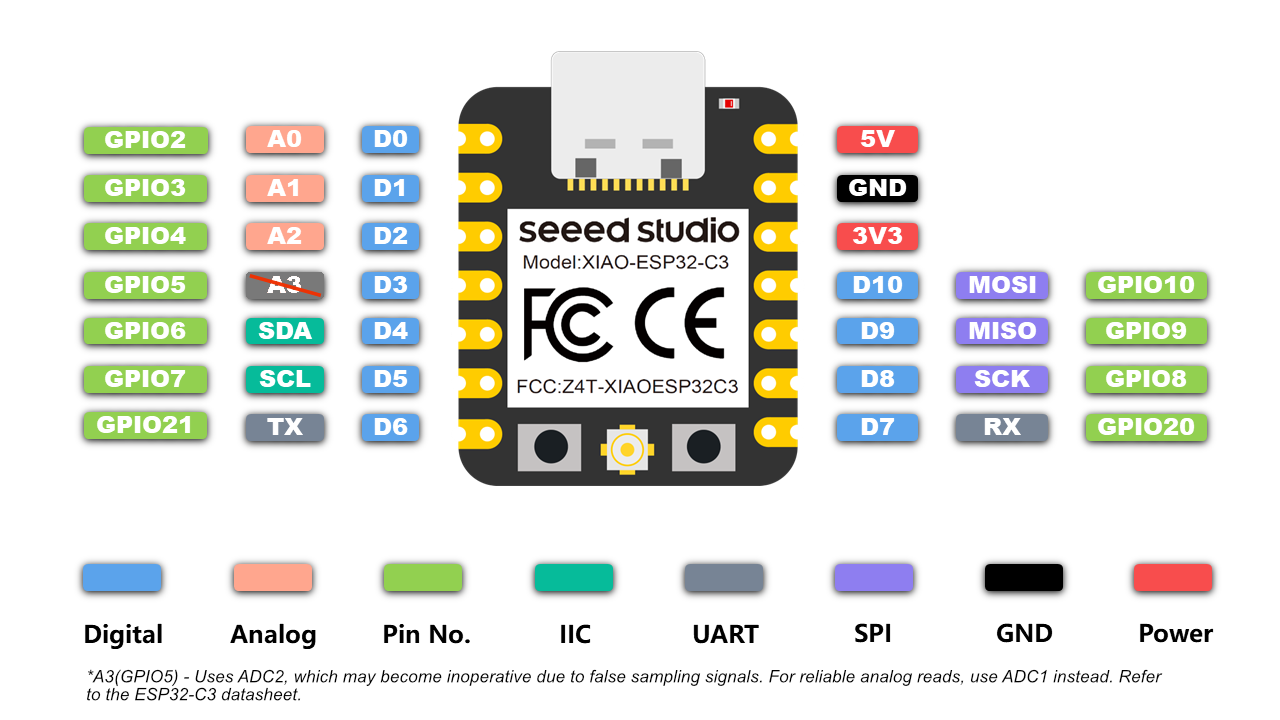
7.1 XIAO Board Used for Measurement
For the practical measurements, I used a XIAO board. This board works mainly with 3.3V logic, while it can also expose the 5V USB rail depending on the power source. These two voltages were used as the first measurement points in this practice.
| Pin / Rail | Function |
|---|---|
| 5V | USB supply rail |
| 3V3 | Regulated logic voltage used by the board |
| GND | Electrical reference point for all measurements |
| D2 | GPIO pin used for PWM and digital signal tests |
8. Voltage Measurements on the XIAO
The first practical step was verifying the main power rails of the XIAO. All voltage measurements were made with respect to GND, since ground defines the electrical zero reference of the board.
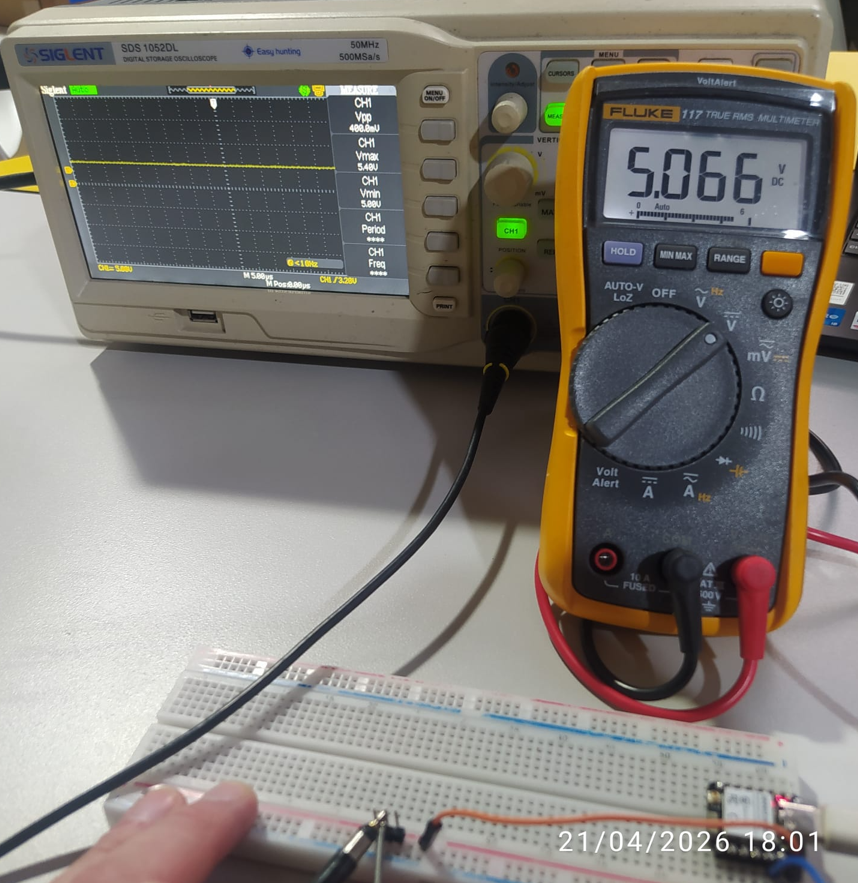
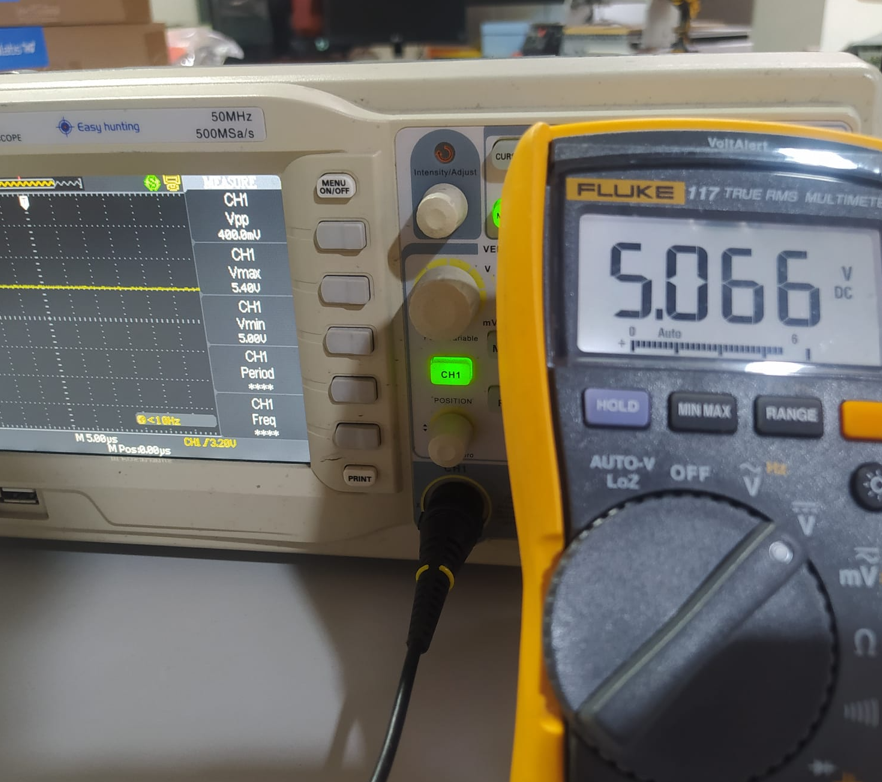
8.1 Measuring the 5V Rail
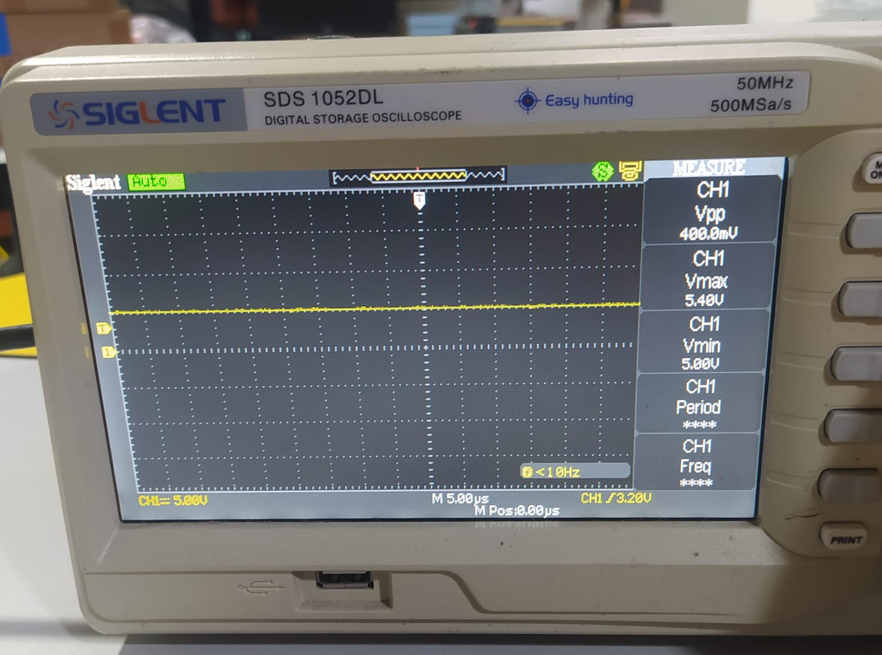
I first measured the 5V rail of the board. Using the Fluke 117 multimeter, the measured value was 5.066 V. On the oscilloscope, the signal remained stable around the DC level, with a recorded Vmax = 5.40 V and Vmin = 5.00 V.
8.2 Measuring the 3.3V Rail
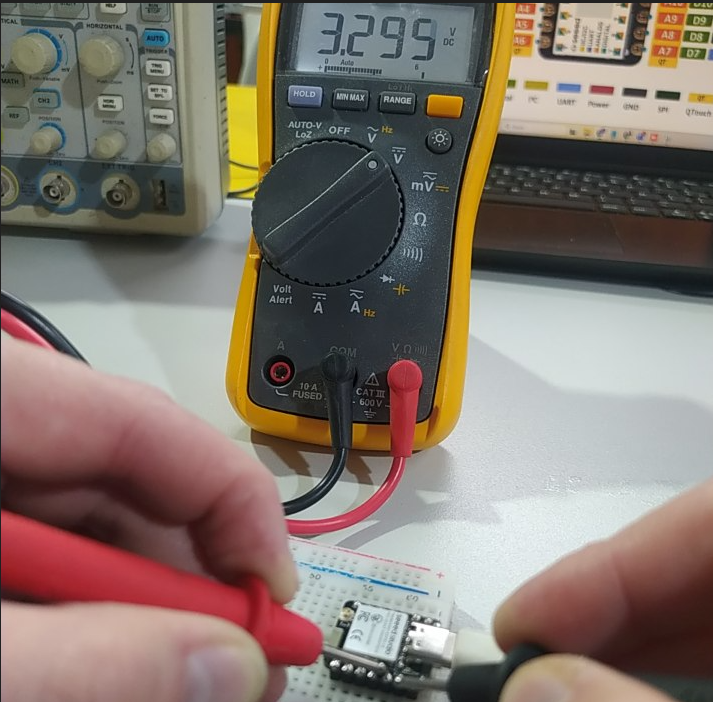
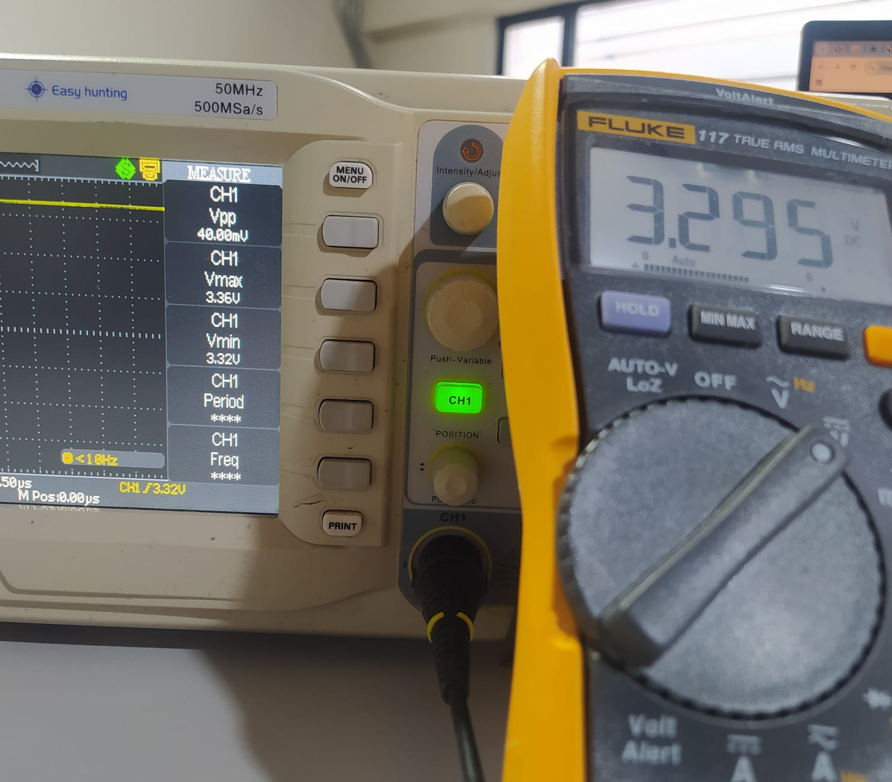
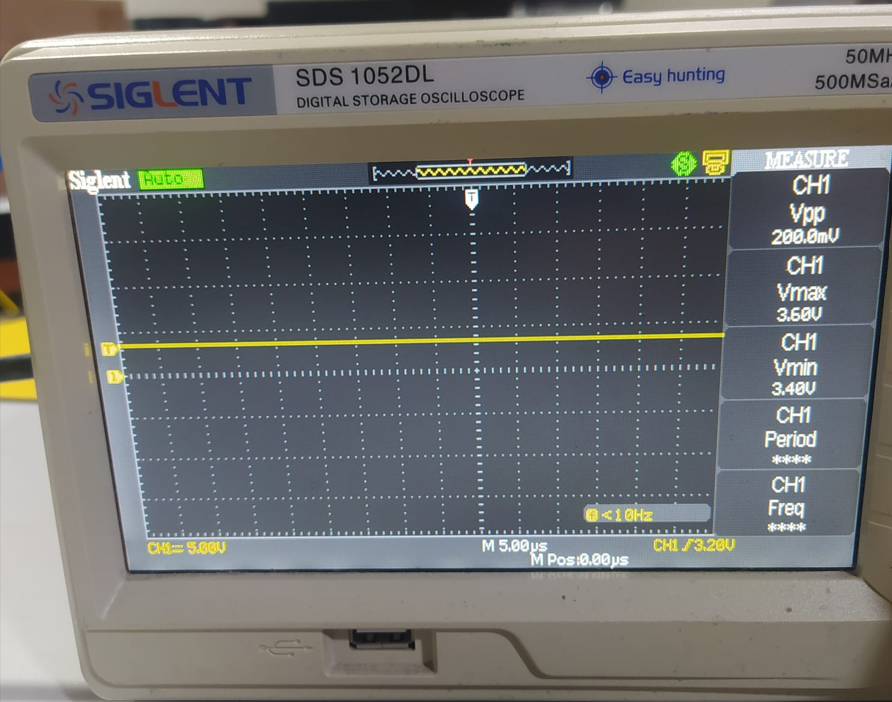
The second measurement was the 3.3V regulated rail, which is especially important because it is the working logic level of the XIAO. Using the multimeter, the measured value was 3.295 V. On the oscilloscope, the voltage remained stable with Vmax = 3.36 V and Vmin = 3.32 V.
8.3 Measurement Summary Table
The following table summarizes the voltage measurements obtained using both the multimeter and the oscilloscope. This comparison helps validate the stability of the power rails and highlights the difference between static and dynamic measurement methods.
| Signal | Multimeter (DC Value) | Oscilloscope Vmax | Oscilloscope Vmin | Observation |
|---|---|---|---|---|
| 5V Rail | 5.066 V | 5.40 V | 5.00 V | Stable DC voltage with minor variation observed in oscilloscope |
| 3.3V Rail | 3.295 V | 3.36 V | 3.32 V | Regulated voltage line with stable behavior |
9. PWM Signal Analysis
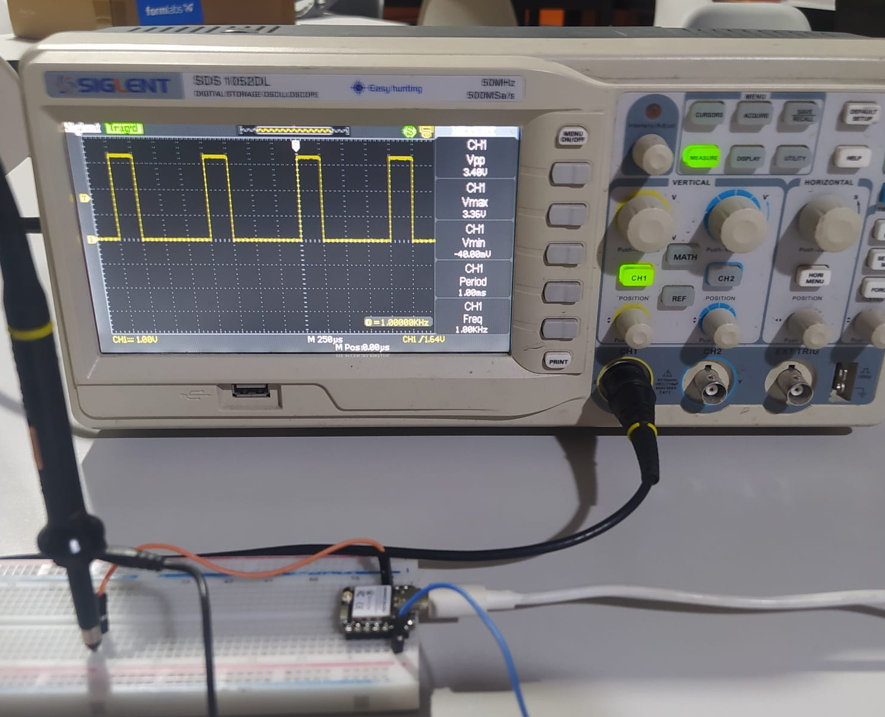
One of the most useful experiments of this week was generating a PWM (Pulse Width Modulation) signal on pin D2 and observing its behavior in the oscilloscope.
PWM is a digital technique used to simulate analog behavior by rapidly switching a signal between HIGH and LOW states. What changes is not the maximum voltage, but the proportion of time that the signal remains in the HIGH state. This proportion is known as the duty cycle.
In this exercise, I tested three duty cycle levels to compare how the square wave changes while keeping the same peak logic voltage.
9.1 PWM at 25%
int pwmPin = 2;

void setup() {
  pinMode(pwmPin, OUTPUT);
}

void loop() {
  analogWrite(pwmPin, 64); // PWM low (25%)
}
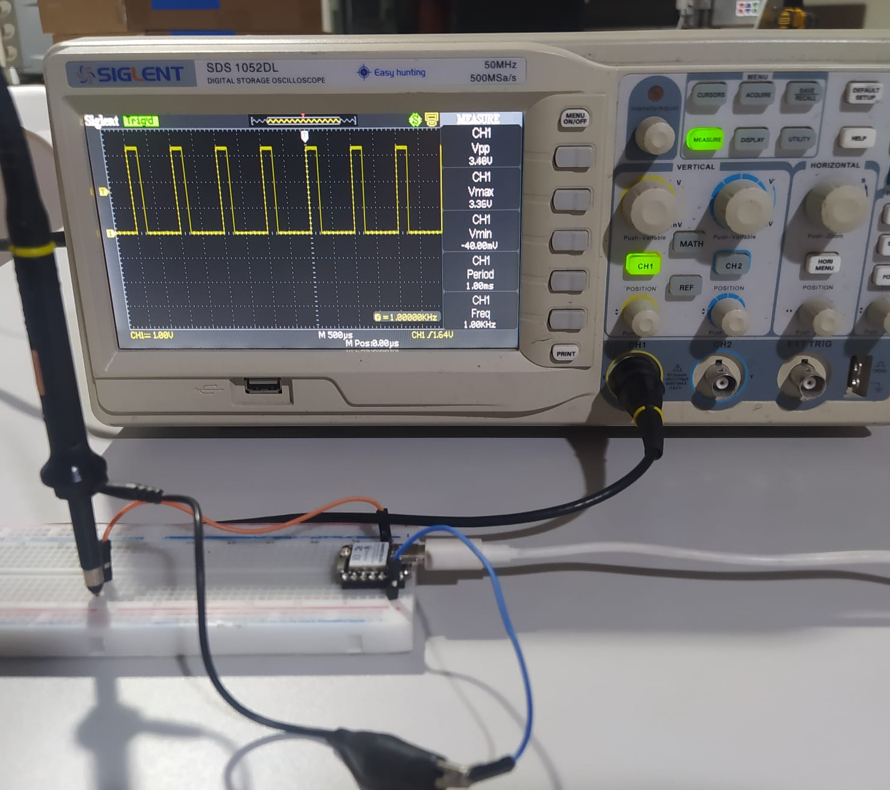
10.2 PWM at 50%
int pwmPin = 2;

void setup() {
  pinMode(pwmPin, OUTPUT);
}

void loop() {
  analogWrite(pwmPin, 128); // PWM medium (50%)
}
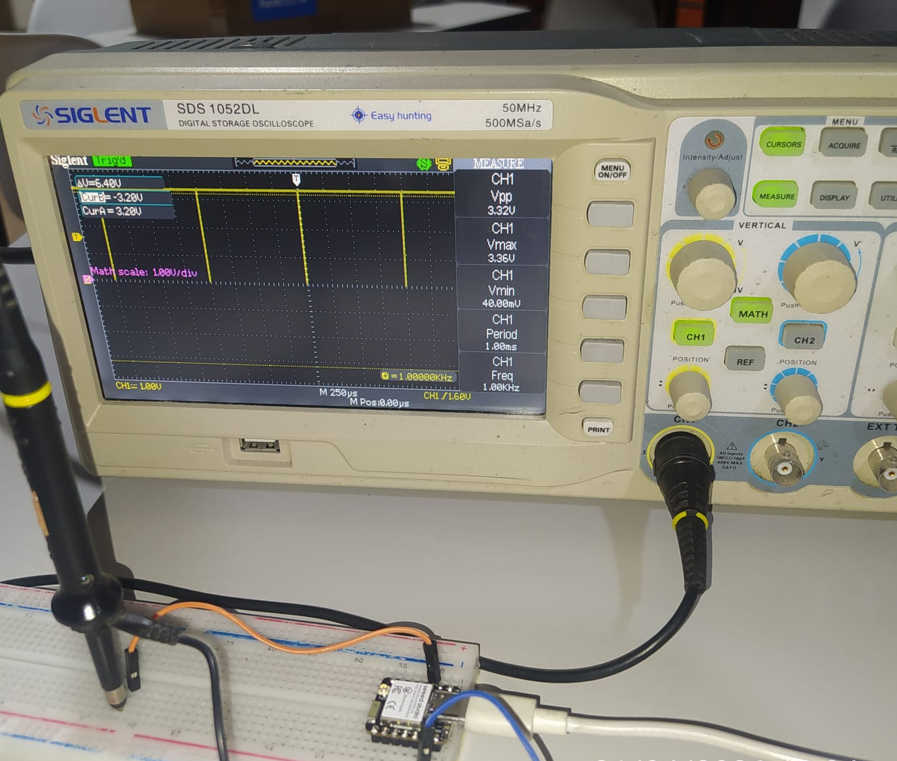
9.3 PWM at 100%
int pwmPin = 2;

void setup() {
  pinMode(pwmPin, OUTPUT);
}

void loop() {
  analogWrite(pwmPin, 255); // PWM high (100%)
}
10. Digital Square Wave with LED Blink
As a final practical exercise, I programmed the XIAO to turn an LED on and off every second using pin D2. This made it possible to observe a slower and more explicit digital square wave on the oscilloscope.
// BLINK DIGITAL - SQUARE WAVE (approx. 1 Hz)

int ledPin = 2;  // Pin D2

void setup() {
  pinMode(ledPin, OUTPUT);
}

void loop() {
  digitalWrite(ledPin, HIGH); // LED on
  delay(1000);                // 1 second

  digitalWrite(ledPin, LOW);  // LED off
  delay(1000);                // 1 second
}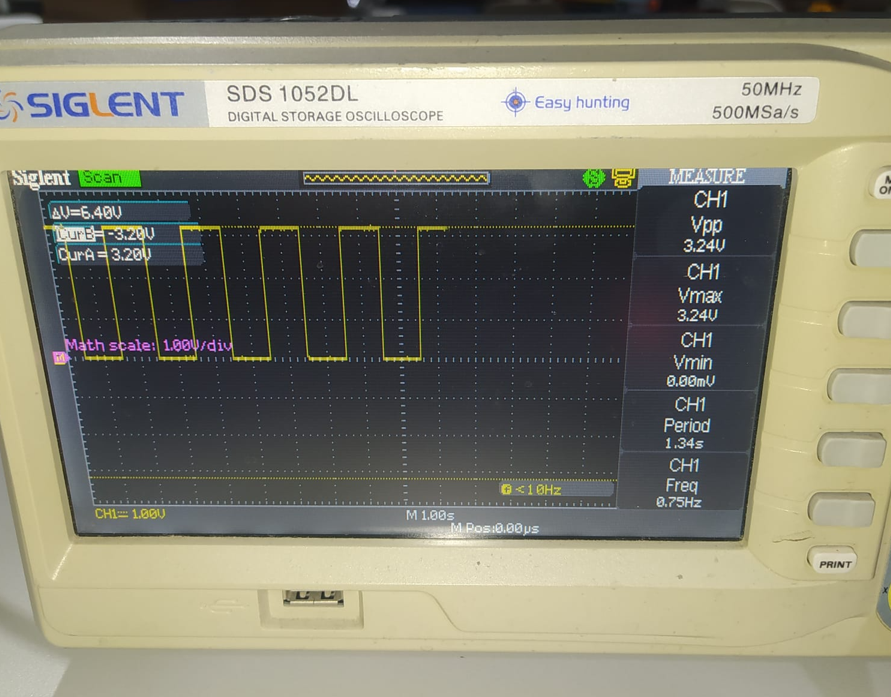
This measurement is especially useful because it clearly shows the logic transition between HIGH and LOW states, making it easier to understand how a digital signal behaves over time.
11. Reflection
- This group assignment provided practical experience using laboratory test equipment to analyze a microcontroller system. By validating electrical parameters on the ESP32-C3 board, we reinforced fundamental concepts such as Ohm’s Law, power dissipation, signal integrity, and digital waveform behavior.
- These skills are essential for the upcoming PCB design and fabrication stages, where electrical validation becomes critical before hardware deployment.
- On the measurement side, this week helped connect design theory with real electrical behavior. Using the Fluke 117 multimeter to verify the 5V and 3.3V rails reinforced the importance of using GND as the common electrical reference. It also made clear that voltage values are only meaningful when measured relative to a defined reference point.
- The oscilloscope practice with the Siglent SDS1052DL was especially important because it revealed behavior that a multimeter alone cannot show. While the multimeter gives a stable numeric value, the oscilloscope made it possible to observe waveform shape, pulse width, transitions, and signal timing. This was one of the strongest learning moments of the week.
- Observing the PWM signals at different duty cycles helped me understand much better how Pulse Width Modulation works. The key lesson was that PWM does not create a true analog voltage at the pin; instead, it changes the proportion of time that the signal remains in the HIGH state. Seeing the waveform at 25%, 50%, and 100% made this concept much clearer than reading it only in theory.
- The LED blink experiment was also very useful because it produced a slow and easy-to-read square wave. This made it easier to connect the programming logic with the electrical signal observed on the oscilloscope. It also reinforced practical concepts such as period, frequency, and logic transitions between HIGH and LOW.
- Overall, this week gave me a stronger foundation in how electronic systems are conceived and verified. I now understand more clearly the relationship between design rules, schematic clarity, PCB layout decisions, manufacturing outputs, and real signal measurement. More importantly, I see electronics design as a bridge between digital planning and physical system behavior.