Designed group measurement strategy, set up oscilloscope for LDR analog signal capture, and documented real-time waveform analysis. Created system documentation explaining voltage divider configuration and signal behavior under changing light conditions. Coordinated integration of group findings with individual sensor implementations.
👨
André Mamani — Hardware Measurement & Component Testing
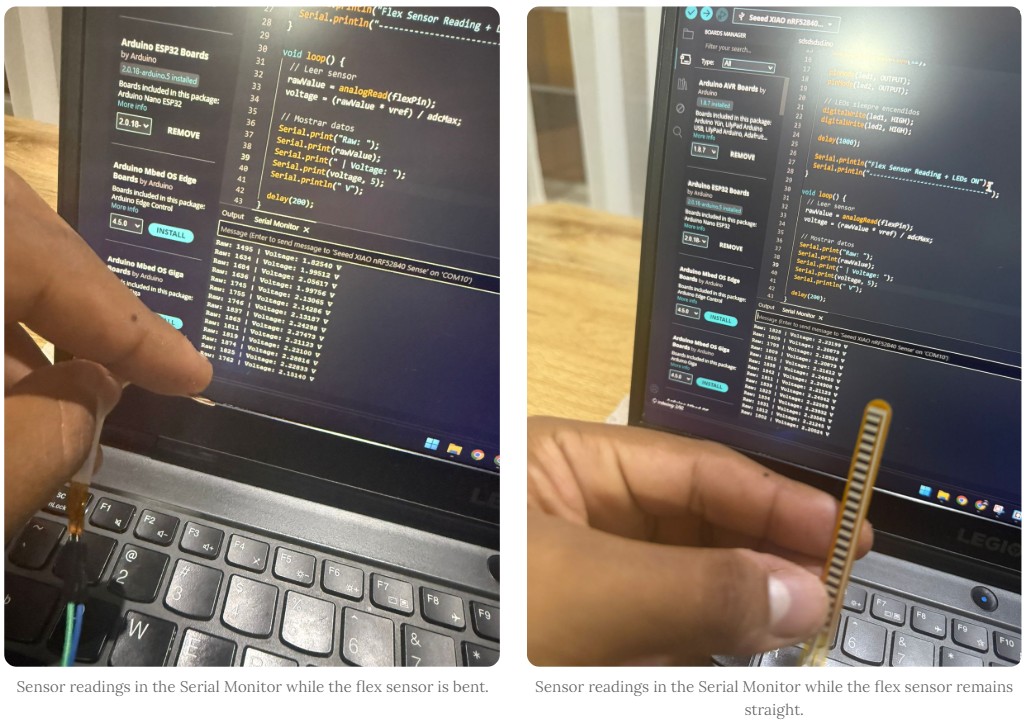
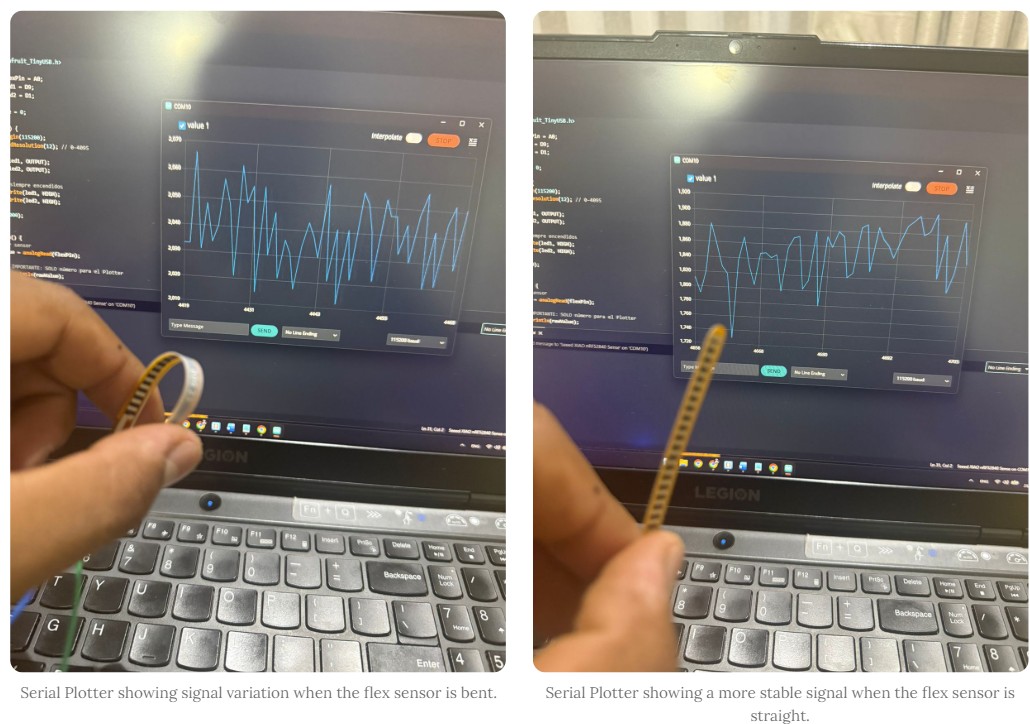
Performed direct multimeter measurements of flex sensor resistance (8.99 kΩ straight → 9.71 kΩ bent). Designed voltage divider circuit and conducted ADC testing with Arduino. Documented component behavior and created technical specs for sensor integration across both individual and group assignments.
✅ Assignment Goals (All Completed)
✓ Probe Input Devices
Successfully tested analog levels and digital signals of LDR, flex sensor, HC-SR04, and PIR using oscilloscope and multimeter.
✓ Document Behavior
Complete documentation of sensor signal characteristics, measurement data, and electrical properties for all components tested.
✓ Analyze Results
Comprehensive comparison table of all sensors with measurements from oscilloscope and multimeter, including detailed findings.
Section 1: Analog & Digital Signal Behavior
Oscilloscope & Multimeter Analysis
📊 Sensor Overview: Understanding Input Devices
Input devices (sensors) convert physical phenomena (light, temperature, motion, distance) into electrical signals that microcontrollers can read. There are two main types:
Analog vs Digital Signals
Aspect
Analog Signal
Digital Signal
Values
Continuous range (0–3.3V)
Discrete states (HIGH/LOW)
Measurement
ADC (Analog-to-Digital Converter)
GPIO (Digital Input Pin)
Resolution
12-bit: 4096 distinct values
1-bit: 2 states (on/off)
Response
Proportional to input (smooth)
Threshold-based (abrupt)
Example Sensors
LDR, Flex Sensor, Temperature
PIR Motion, Button Press
🔬 LDR Sensor – Analog Signal Analysis
The Light Dependent Resistor (LDR) is a resistive sensor whose resistance varies continuously with light intensity. In a voltage divider circuit, this produces an analog output signal.
Oscilloscope Measurements
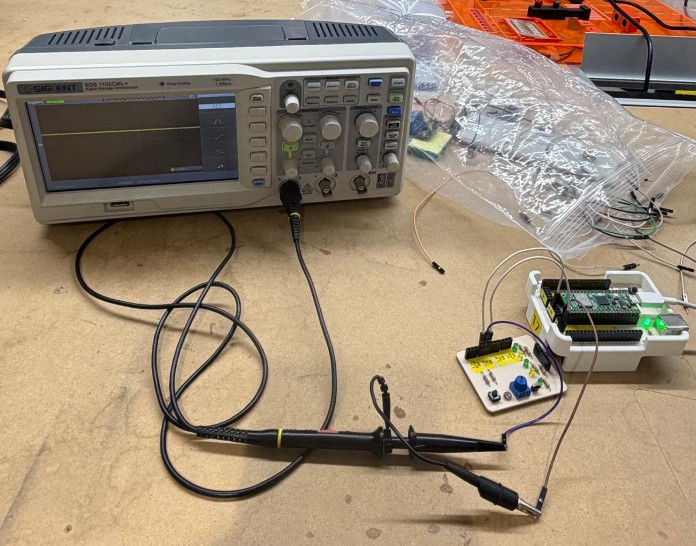
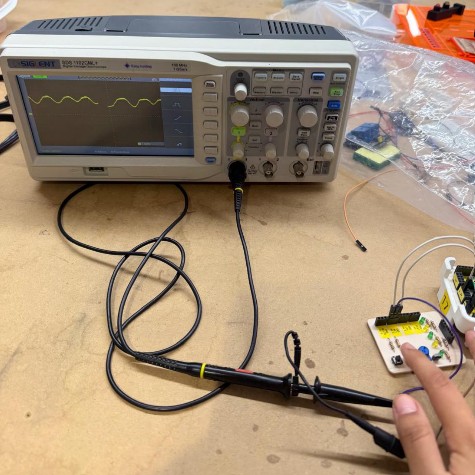
Left: LDR under ambient room light. Right: LDR when covered — voltage changes due to resistance increase.
Key Observations
✓ Continuous Signal: The output varies smoothly, not in discrete steps. This is true analog behavior.
✓ Signal Noise: Small fluctuations are visible—inherent to real sensors due to environmental variations.
✓ Voltage Range: Under ambient light: ~1–1.5V. When covered: varies up to 3.3V range.
✓ Response Time: Signal updates continuously (~0.5–5 Hz), suitable for slow environmental changes.
Why Analog Matters
Analog signals preserve information about gradual changes. With 12-bit ADC, we get 4096 discrete levels to represent continuous light intensity. This allows proportional control (dimming, smooth transitions) rather than just on/off.
📏 Flex Sensor – Resistive Input Analysis
The Flex Sensor changes resistance proportionally to mechanical bending. Using a voltage divider and ADC, we convert resistance change into readable voltage.
Direct Multimeter Measurements
Straight State
Resistance: 8.99 kΩ
Voltage (divider): ~1.65V
Bent State
Resistance: 9.71 kΩ
Voltage (divider): ~1.72V
Change
ΔR: 0.72 kΩ (8% variation)
ΔV: ~70 mV (easily detected)
Why This Matters
70 mV change across full bend is easily detectable by 12-bit ADC (minimum resolution: ~0.8 mV). This sensor provides proportional feedback for glove-based control (HigiBox individual project) where finger bend angle maps to output intensity.
🎯 Why Oscilloscope & Multimeter?
Oscilloscope
Shows: Real-time signal behavior, noise patterns, frequency content, abrupt transitions.
Best for: Understanding dynamic behavior and troubleshooting timing issues.
Multimeter
Shows: Precise DC voltage and resistance values with numeric accuracy.
Best for: Characterizing component specs and validating circuit calculations.
Together
Oscilloscope reveals how a signal behaves dynamically. Multimeter confirms what the steady-state values are. Complete picture of sensor behavior.
Section 2: Comprehensive Sensor Comparison
All Sensors Tested During Week 9
📋 Complete Sensor Specification Table
Comparison of all four sensors tested, including their electrical characteristics, measurement methods, and observed behavior in lab.
Sensor
Type
Signal Output
Measurement Tool
Idle/Baseline
Active State
Key Characteristic
LDR
Resistive Sensor
Analog Voltage
Oscilloscope
~1.5V (ambient light)
0–3.3V (variable)
Continuous signal; proportional to light intensity
Flex Sensor
Resistive Sensor
Analog Voltage (divider)
Multimeter & ADC
8.99 kΩ (straight)
9.71 kΩ (bent)
Proportional resistance change; ~70 mV voltage variation
HC-SR04
Distance Sensor
Digital Pulse
Pulse Timing
No object
Object ~10 cm
Time-of-flight; pulse duration encodes distance
PIR Motion
Digital Sensor
Digital HIGH/LOW
GPIO Read
LOW (0V) – no motion
HIGH (5V) – motion
Abrupt digital transitions on IR gradient change
🔍 Detailed Measurement Data
01
LDR Oscilloscope Readings
Ambient room light: Stable output ~1–1.5V
Covered / low light: Voltage increases, waveform shows fluctuation
Signal frequency: ~0.5–5 Hz variation (slow changes)
Signal type: Continuous analog, NOT discrete steps
Noise level: Minor ripple present (typical for real sensors)
02
Flex Sensor Multimeter Data
Straight resistance: 8.99 kΩ → voltage divider output ~1.65V
Bent resistance: 9.71 kΩ → voltage divider output ~1.72V
Response: Repeatable and proportional to bend angle
03
HC-SR04 & PIR Summary
HC-SR04 (Distance): Uses time-of-flight (pulse duration = distance). Digital interface, analog information encoding.
PIR Motion: Detects IR gradient changes. Output is pure digital HIGH/LOW with no intermediate states.
📸 Lab Equipment & Documentation
Live oscilloscope capture of sensor signal behavior during testing
Section 3: Individual Assignments — Detailed
Sensor Implementation & Testing by Each Team Member
👩
Micaela Córdova — Input Devices: HC-SR04 Ultrasonic & PIR Motion
Individual Assignment: Measure something by adding a sensor to a microcontroller board and reading it. Tested two complementary sensors: HC-SR04 (distance/analog-like) and PIR (motion/digital).
📦 Sensor 1: HC-SR04 Ultrasonic Distance Sensor
What it measures: Distance using ultrasonic sound waves (20 cm to 4 meters typical range). Sends a pulse, waits for echo return, calculates time difference to determine distance.
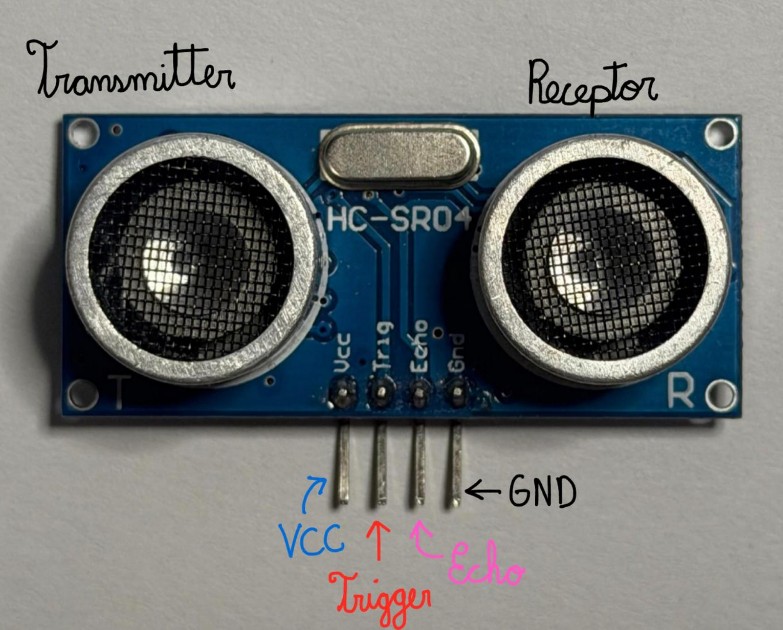
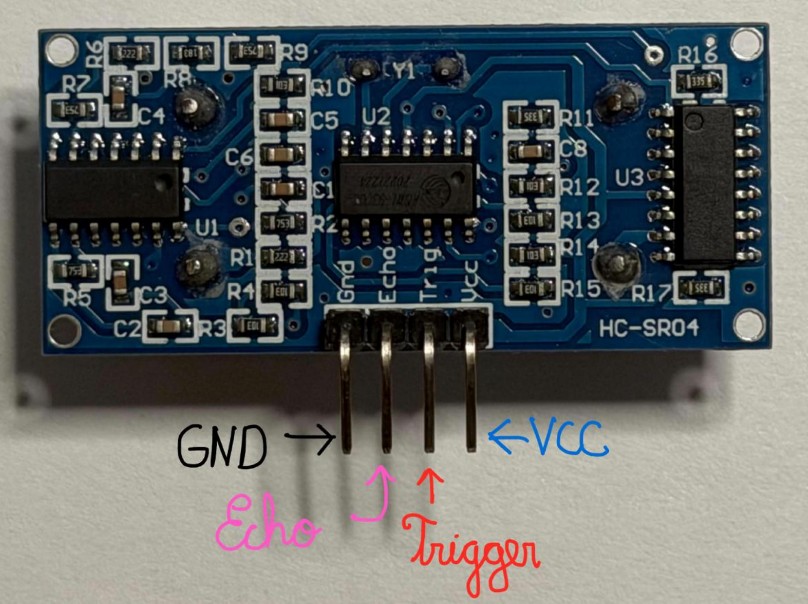
HC-SR04 front (VCC/Trigger/Echo/GND labeled) and back view showing transducers
Pin Configuration
VCC: 5V power supply
Trigger (TRIG): Digital pulse input (10μs pulse triggers measurement)
Echo (ECHO): Digital pulse output (duration = distance × 2 / speed of sound)
HC-SR04 distance measurement demonstration — real-time distance display on Serial Monitor
Testing HC-SR04 with object at varying distances
🔴 Sensor 2: PIR Motion Sensor
What it measures: Infrared radiation changes from moving objects. Detects body heat movement within ~100° field of view and up to 7 meters range.
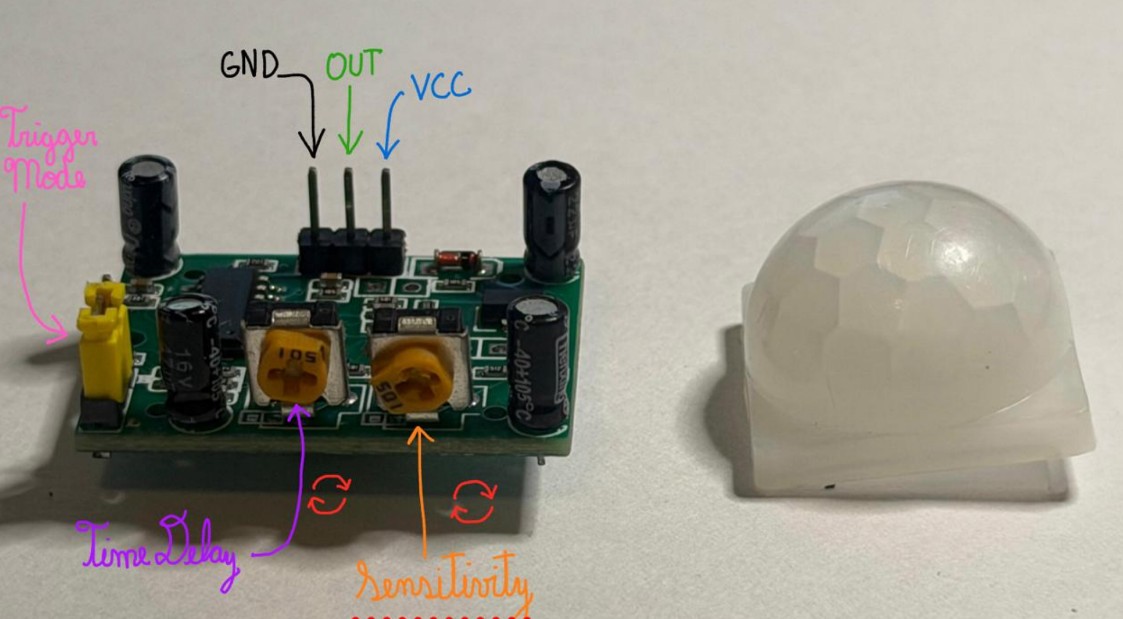
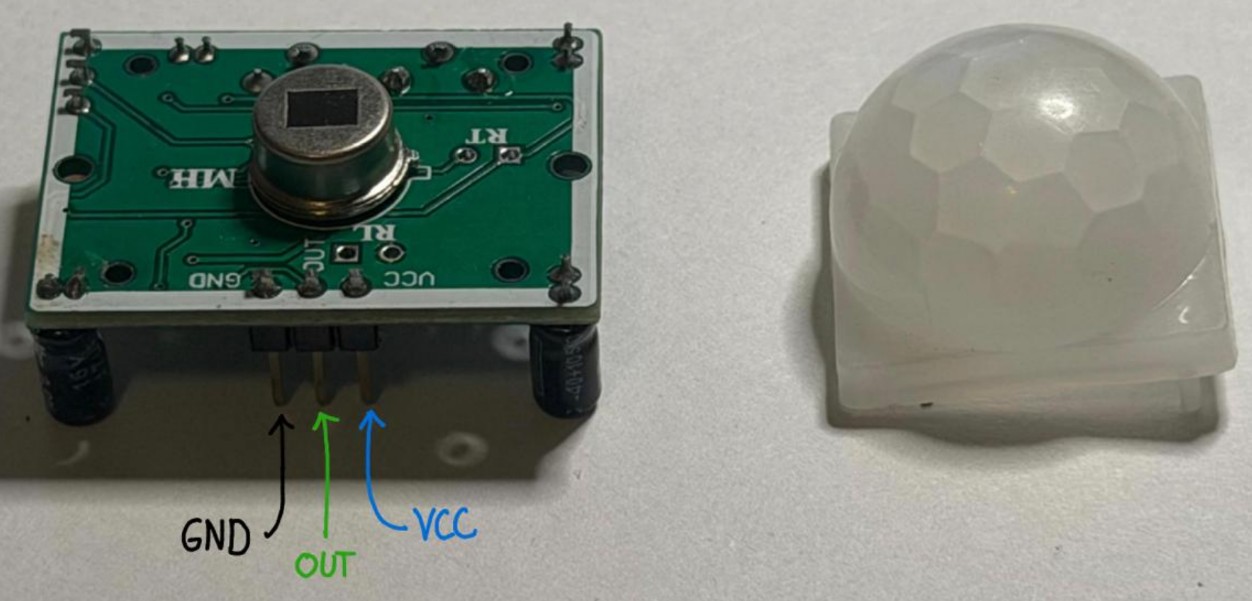
PIR front showing adjustment potentiometers (Time Delay, Sensitivity) and back showing pin connections
Pin Configuration & Controls
VCC: 5V power supply
OUT: Digital output (HIGH when motion detected, LOW otherwise)
GND: Ground
Sensitivity Potentiometer (Orange): Adjusts detection range (3–7 meters typical)
Time Delay Potentiometer (Purple): Sets how long output stays HIGH after motion stops (3–300 seconds)
Trigger Mode Jumper (Pink): Single trigger or repeated trigger mode
Why PIR Didn't Work (Initially)
Problem 1: PIR requires 30–60 second warm-up period before reading stabilizes. Testing immediately after power-on = no detections.
Problem 2: Movement was too fast or too slow. PIR detects IR gradient changes (rapid temperature differences), not static heat. Slow motion = no detection.
Solutions Implemented:
Added 2-second initialization delay in code before reading begins
Adjusted sensitivity potentiometer for optimal range
Used Serial Monitor feedback to confirm active detection
Individual PIR testing with Serial Monitor output showing HIGH/LOW transitions
Key Learnings — Micaela
Time-of-Flight vs Digital
HC-SR04 encodes distance in pulse duration (analog-like information through digital interface). PIR is pure digital binary. Different encoding → different programming approaches.
Sensor Initialization Critical
PIR warm-up, HC-SR04 timing requirements—sensors aren't instant. Code must account for these delays or results are unreliable.
Serial Monitor as Debug Tool
Real-time output monitoring revealed sensor behavior patterns invisible to the human eye. Essential troubleshooting technique for embedded systems.
👨
André Mamani — Input Devices: Flex Sensor with PCB & Voltage Divider
Individual Assignment: Design and fabricate a PCB-based circuit integrating a flex sensor with voltage divider configuration. Measure resistance changes and convert to analog voltage for Arduino ADC reading.
📏 Flex Sensor Circuit Design
Component: Flex sensor (variable resistor that changes resistance when bent). Straight state: ~9 kΩ, Bent state: ~9.7 kΩ, Change: ~0.7 kΩ (8% variation).
Voltage Divider Configuration
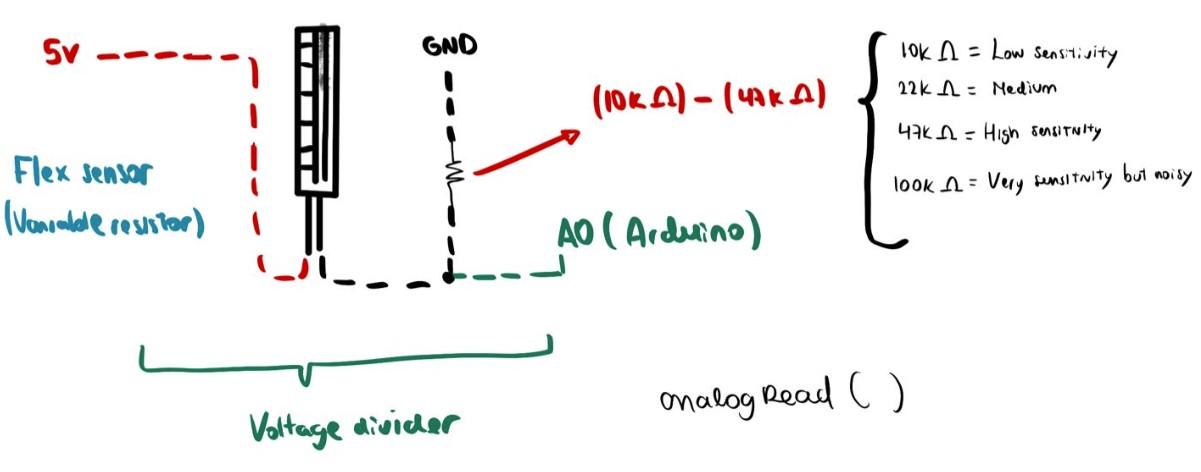
Hand-drawn schematic showing flex sensor in voltage divider with 10kΩ pull-down resistor
Why Voltage Divider? Flex sensor is a variable resistor. To read changing resistance, convert it to changing voltage using voltage divider formula:
V_out = Vcc × R_flex / (R_flex + R_fixed)
When R_flex changes (bent), V_out changes proportionally. This voltage variation is readable by Arduino's ADC.
Multimeter Measurements
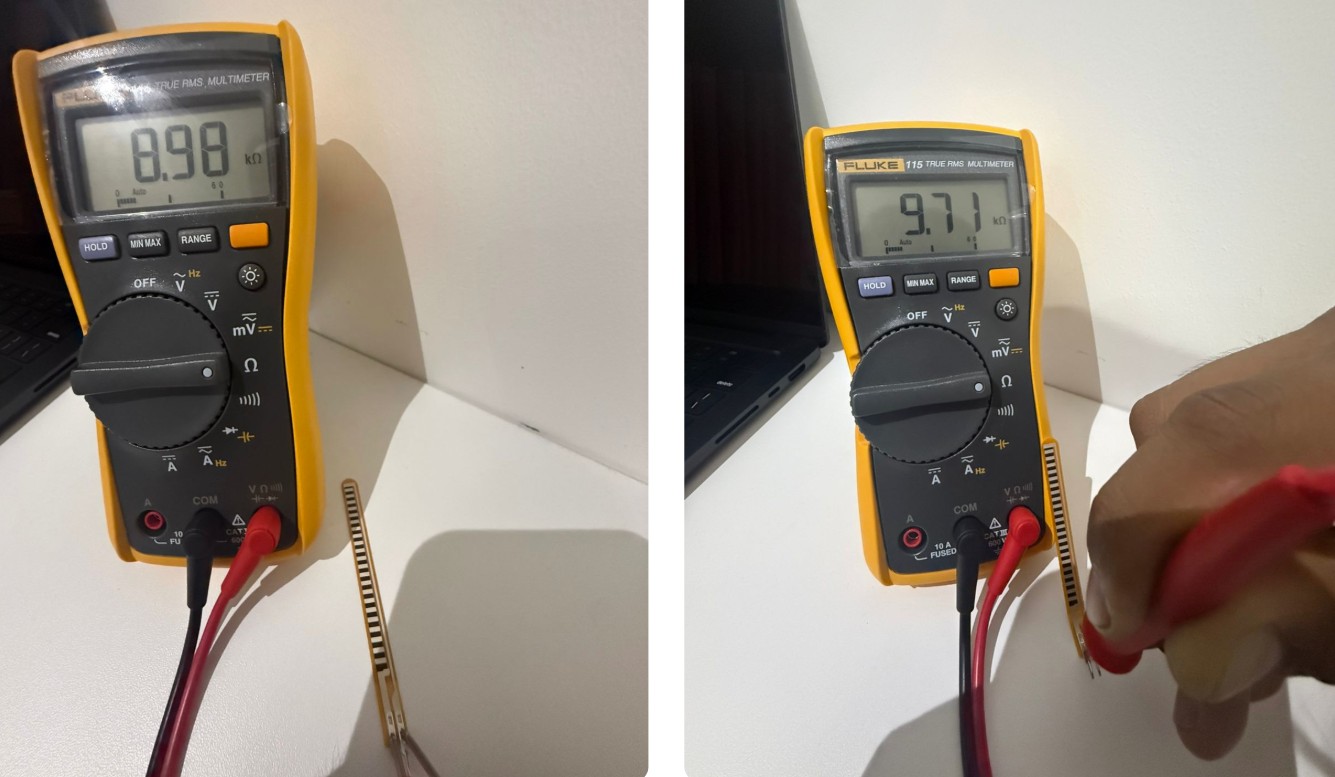
Left: Straight state 8.98 kΩ. Right: Bent state 9.71 kΩ (measured directly with multimeter)
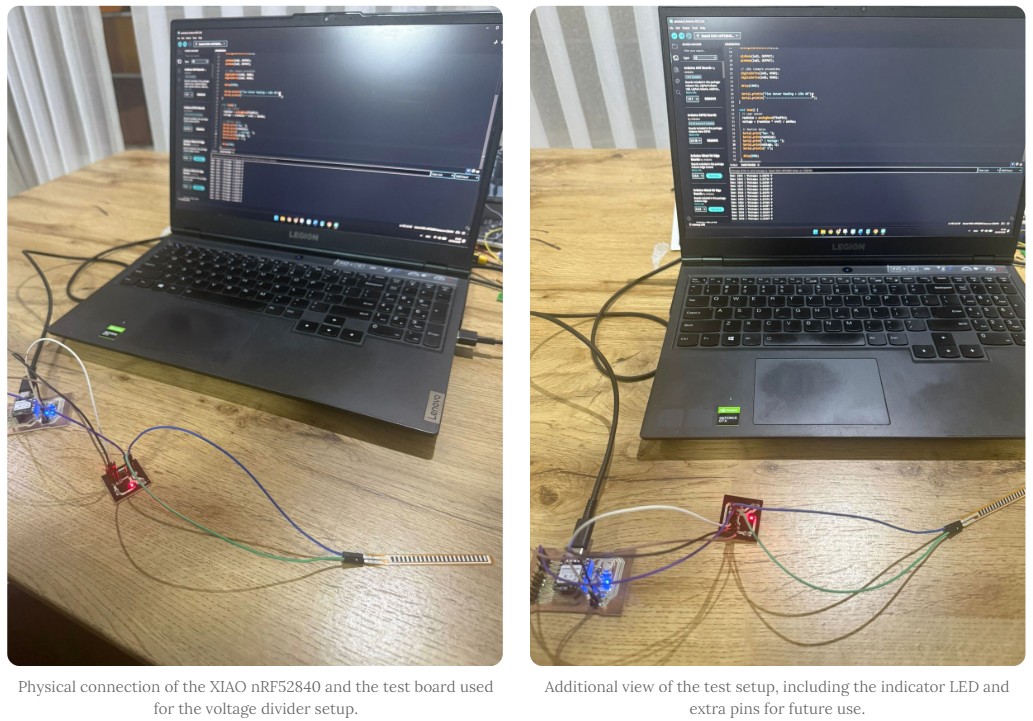
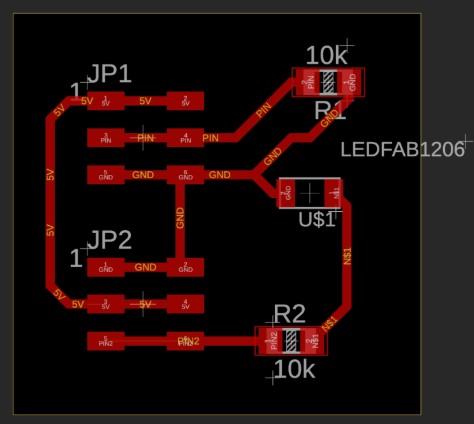
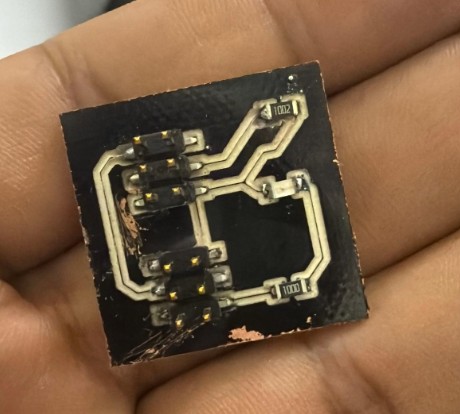
Custom PCB designed in Fusion 360, milled on Roland machine, components hand-soldered. Board integrates:
XIAO nRF52840 microcontroller header
10kΩ pull-down resistor for voltage divider
Flex sensor connector (external)
LED indicator for visual feedback
Additional GPIO pins for future expansion
Sensitivity Configuration
Resistor Value Selection Impact:
10kΩ (chosen): Balanced sensitivity across full bend range. Linear response.
22kΩ: More sensitive to small bends (steeper voltage change curve)
47kΩ: Less sensitive; better for detecting large bends only
Key Design Decision: 10kΩ matching flex sensor baseline resistance (8.99 kΩ) creates nearly equal voltage divider, maximizing voltage swing across the ADC range. This matches impedance optimization principle.
Key Learnings — André
Voltage Divider Fundamentals
Resistive sensors aren't directly readable. Must convert resistance to voltage. Choice of reference resistor directly impacts sensor sensitivity and ADC resolution.
Impedance Matching Matters
10kΩ reference matching ~9kΩ flex sensor baseline isn't coincidental—it's optimal impedance design that maximizes sensor-to-ADC signal fidelity.
PCB Integration Over Breadboards
Designed custom PCB instead of breadboard. Cleaner wiring, reduced noise, professional result. Fabrication skill essential for Fab Academy workflow.
Proportional Control Foundation
Flex sensor + voltage divider + 12-bit ADC = 4096 discrete levels of finger bend information. Foundation for wearable glove control system (final project).
Section 4: Individual Reflections
What We Learned From Week 9
👩
Micaela Córdova's Reflection
Before this assignment, I had theoretical knowledge about analog and digital signals, but seeing them live on the oscilloscope made it real. The contrast between the PIR's sharp digital switching and the LDR's smooth continuous variation cemented my understanding in ways that lectures never could.
Learning to use lab equipment properly—setting oscilloscope gain, reading voltage scales, interpreting waveform patterns—was a skill I'd never practiced before. Working with classmates highlighted how sensor selection directly impacts system design. If your application needs proportional feedback, analog sensors are essential. If you only care about binary states, digital suffices.
This knowledge will directly inform my individual assignments and final project. For HigiBox (intelligent menstrual care dispenser), I'll need multiple input types: digital buttons for mode selection, analog sensors for product level detection, and PWM control for dispensing mechanisms. This week taught me that choosing the right sensor type is not a luxury—it's critical to system success.
👨
André Mamani's Reflection
This assignment reinforced that you can't design circuits in isolation. Understanding sensor electrical behavior is essential, but so is knowing how to interface them correctly. The flex sensor's 8–9 kΩ range seems small on a multimeter, but through a voltage divider and 12-bit ADC, it becomes 85+ distinct levels—enough for smooth control.
Documenting group work alongside my individual flex sensor PCB design showed me the complete picture: theory → measurement → implementation. The voltage divider I designed for the flex sensor directly relates to the LDR's analog signal analysis. Both are resistive sensors converted to voltage; both feed into an ADC. The principles are identical; only the application differs.
This holistic understanding is crucial for my wearable glove project. Multiple flex sensors on each finger feed into a central Arduino. Each sensor provides 12-bit resolution feedback. That feedback maps to motor control signals for soft robotic tentacles. The entire system relies on this sensor→divider→ADC→motor pipeline. Week 9 was my final confirmation that I understand the mechanics. Now I execute the design.