During this week we used laboratory test equipment to observe the real behavior of an embedded microcontroller. Working with the oscilloscope, multimeter, and regulated power supply gave us direct visibility into power rails, GPIO outputs, PWM waveforms, and component characteristics that would otherwise be invisible from the code alone.
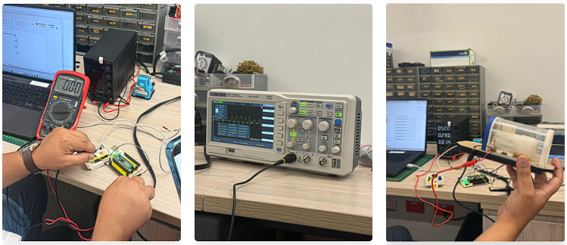
Img 1 — Lab setup overviewLeft: multimeter measuring a PCB with Pico. Center: Siglent SDS 1102CML+ oscilloscope with active waveform. Right: oscilloscope probing a breadboard circuit — power supply visible in background.
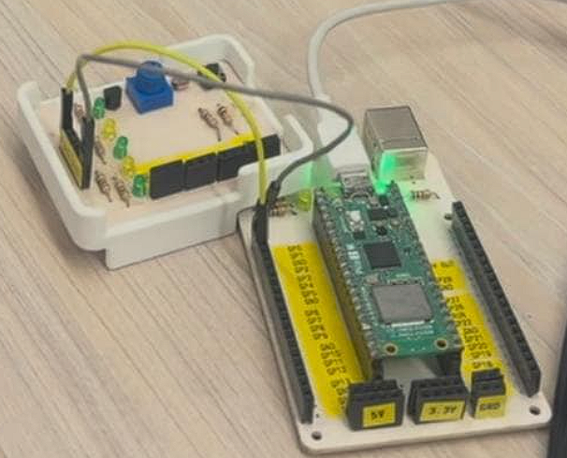
Img 17 — Microcontroller under test — Raspberry Pi Pico 2WCustom breakout PCB inside a 3D-printed enclosure: blue button, yellow and green LEDs, side connectors. Right: Pico 2W on its carrier board with 5V, 3.3V, and GND labeled terminals — the embedded system observed throughout the lab session.
Oscilloscope
Siglent SDS 1102CML+
100 MHz · 2-channel · digital storage
Visualizes electrical signals over time — shows waveform, amplitude, frequency, period, duty cycle, and timing behavior. Key for debugging embedded systems.
Multimeter
Prasek Premium PR-85
Digital · AC/DC voltage, current, resistance, diode
Measures different electrical quantities and verifies whether components are working correctly. Includes diode test mode for LED polarity and forward voltage checks.
Power Supply
Wanptek DPS3010U
0–30 V · 0–10 A · regulated
Variable voltage and adjustable current with real-time display. Allows safe component testing by controlling exactly how much voltage and current a circuit receives.
Understanding these concepts is essential before interpreting any measurement from lab equipment.
V
Voltage (V)
V = I × R
Electric potential difference between two points. Measured in volts. Drives current through a circuit.
I
Current (A)
I = V / R
Flow of electric charge through a conductor. Measured in amperes. Too much current can damage components.
R
Resistance (Ω)
R = V / I
Opposition to current flow. Used to control current in circuits — essential for LED protection.
P
Power (W)
P = V × I
Rate at which energy is consumed. Determines component heating and battery life.
⟿
PWM
Duty cycle = t_on / T
Pulse Width Modulation — rapidly switches ON/OFF to control average power delivered to a load.
Vf
Forward Voltage
Vf (LED) = 1.8–3.7 V
Minimum voltage to forward-bias a diode or LED. Below this threshold, no current flows.
Supporting Circuit Elements
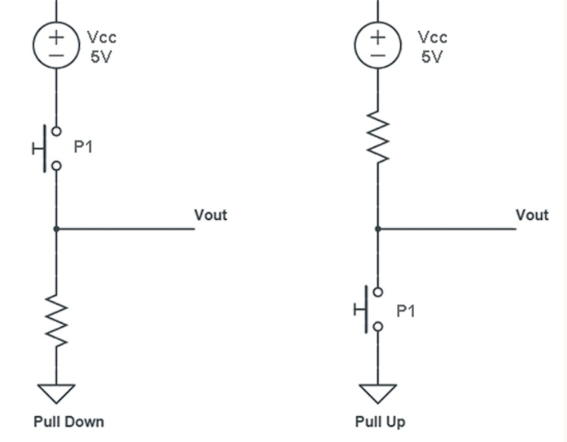
Img 12 — Pull-down vs Pull-up resistor configurationsLeft: pull-down — resistor connects input to GND, ensuring LOW when switch is open. Right: pull-up — resistor connects to Vcc, ensuring HIGH when switch is open. Both prevent floating inputs on GPIO pins.
⊤
Voltage Divider
Vout = Vin × R2 / (R1 + R2)
Steps down voltage using two resistors. Adapts signal levels — e.g., 12 V → 5 V for a sensor input.
⌬
Electrolytic Capacitor
Polarized — observe +/−
Filters voltage variations and reduces noise on power rails. Common on 5 V and 3.3 V supply lines.
→|
Series Resistor (LED)
R = (Vs − Vf) / If
Required to limit current through an LED. Without it, excessive current destroys the LED instantly.
Equipment 01
Multimeter — Prasek Premium PR-85
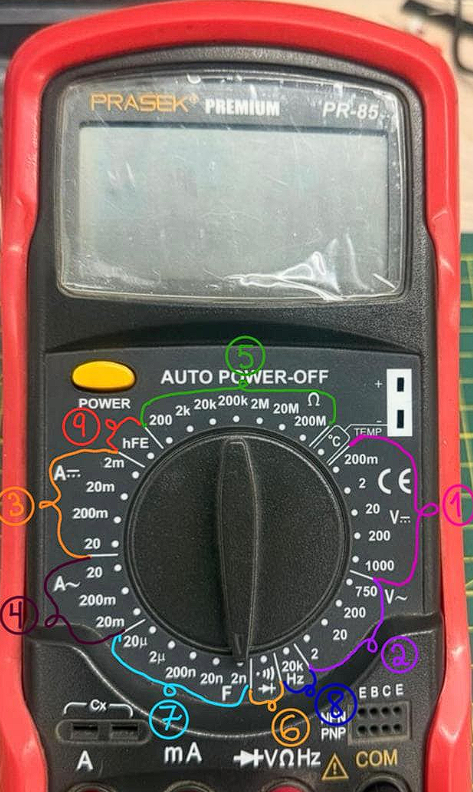
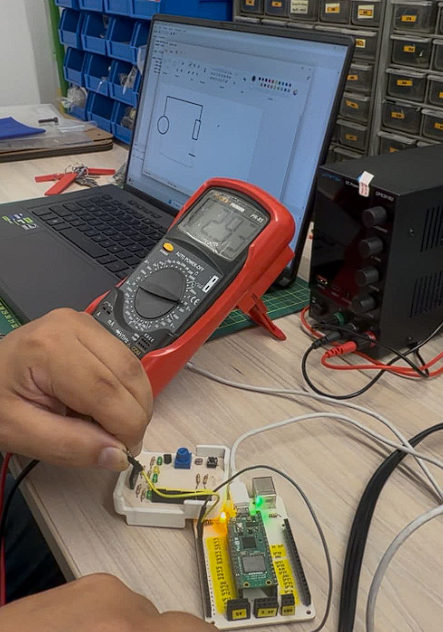
Img 13 — Prasek PR-85 — dial functions annotated9 zones color-coded: 1 = DC Voltage · 2 = AC Voltage · 3 = DC Current · 4 = AC Current · 5 = Resistance · 6 = Diode/Continuity · 7 = Capacitance · 8 = Transistor hFE · 9 = Frequency/Hz.Img 14 — Prasek PR-85 measuring a Pico PCBRed multimeter probing a custom breakout PCB connected to the Raspberry Pi Pico 2W. Yellow LED lit. Wanptek power supply and laptop with schematic in the background.
The Prasek Premium PR-85 is a digital multimeter that measures different electrical quantities and verifies whether components are working correctly. Each mode on the dial corresponds to a specific measurement function.
V~
AC Voltage
Measures alternating voltage from wall outlets and AC power sources.
V⎓
DC Voltage
Measures direct voltage from batteries, power supplies, and microcontroller pins. Most common mode in embedded work.
A⎓
DC Current
Measures current flowing through a circuit. Must be placed in series — not parallel — with the load.
Ω
Resistance
Measures component resistance. Component must be disconnected from circuit for accurate reading.
→|
Diode Test
Applies ~2.7 V to check diode polarity and forward voltage. LEDs with Vf below this value will illuminate.
))
Continuity
Beeps when a closed path exists between two points. Used to check connections, traces, and short circuits.
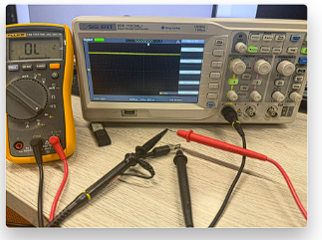
Img 10 — Multimeter + oscilloscope — dual instrument setupFluke multimeter (showing OL — overload/open circuit) next to the Siglent SDS 1102CML+ with a flat DC line on screen. Probes laid out ready to test — both instruments complement each other.
Observation
Diode Test Mode — ~2.7 V
The oscilloscope detected the multimeter providing approximately 2.7 V during diode test mode. This explains why LEDs with a forward voltage above 2.8 V (blue, white) will not activate during the test, even though they function correctly in normal circuit conditions. Red and orange LEDs (Vf ≈ 2.0–2.2 V) illuminate normally.
Equipment 02
Oscilloscope — Siglent SDS 1102CML+
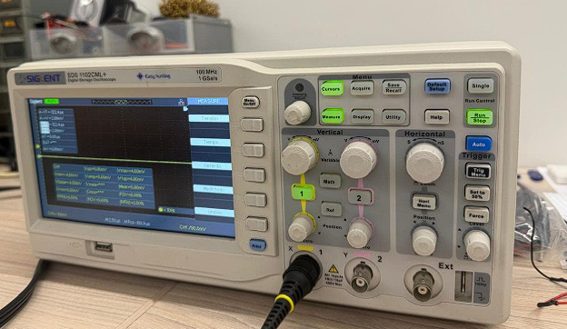
Img 16 — Siglent SDS 1102CML+ — front panel detail100 MHz · 1 GSa/s. Screen showing auto-measured parameters with PWM waveform active. Vertical (Volts/div), Horizontal (Time/div), Trigger section, and CH1/CH2 inputs all visible. Measure panel open on the right side.
Unlike the multimeter, the oscilloscope visualizes how voltage changes over time. The Y-axis shows voltage and the X-axis shows time. The trigger system stabilizes the signal for clean, repeatable analysis — key for debugging embedded systems.
Control
Function
Volts/div
Sets the vertical scale — how many volts each grid division represents
Time/div
Sets the horizontal scale — how much time each grid division covers
Trigger level
Defines the voltage threshold that starts capturing the waveform
CH1 / CH2
Two independent input channels for simultaneous signal comparison
Measure
Auto-calculates frequency, period, amplitude, duty cycle, and RMS
Test 1
Voltage Measurements on the Raspberry Pi Pico 2 W
The board was powered by USB (5 V). The onboard voltage regulator steps this down to 3.3 V for the microcontroller. Measuring the 3V3 pin confirmed correct regulation — a stable flat line on the oscilloscope, confirming no noise or ripple on the power rail.
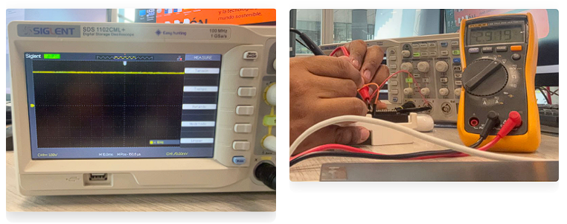
Measuring a GPIO pin driving an LED load returned approximately 2.9 V. This small drop below 3.3 V occurs because the GPIO output has a non-zero source impedance — when driving a load, a small voltage drops across the internal resistance of the pin.
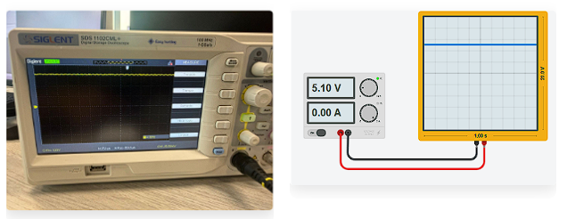
Img 2 — Oscilloscope — 5V flat line & circuit diagramLeft: Siglent showing a clean flat DC line — stable 5V power supply rail with no ripple. Right: schematic showing the oscilloscope probed across a DC source (5.10 V, 0.00 A), confirming clean power delivery.
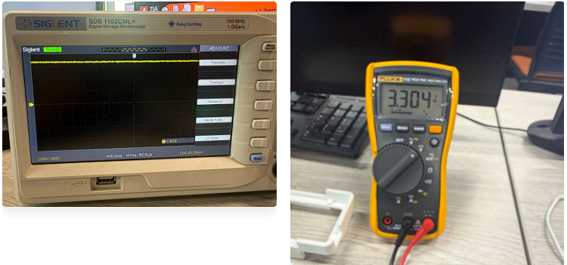
Img 4 — 3V3 rail — flat line confirmedLeft: oscilloscope flat line for the 3.3V regulated rail. Right: Fluke multimeter reading 3.304 V — confirming the regulator output is stable and accurate.Img 5 — GPIO under LED load — voltage drop to ~2.9 VLeft: oscilloscope showing the GPIO output slightly below 3.3 V. Right: multimeter reading 2.919 V — the ~0.4 V drop is due to the GPIO pin's internal source impedance when driving a current load.
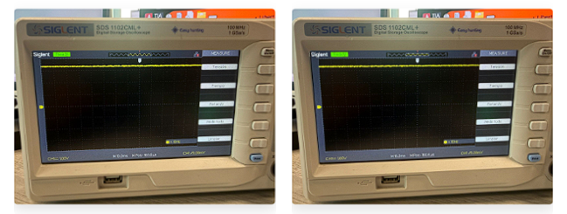
Img 9 — Side-by-side comparison — 3V3 rail vs GPIO under loadLeft: 3V3 power rail — steady and noise-free. Right: GPIO pin driving an LED — slightly lower, showing the voltage drop caused by current draw through the pin's internal resistance.
Test 2
PWM Duty Cycle and LED Brightness
A test circuit was built with a Raspberry Pi Pico 2 W and an LED, controlling PWM via Thonny in MicroPython. We tested different duty cycle values to observe how ON-time affects average power and perceived LED brightness. Maximum voltage observed was approximately 3.3 V — matching the microcontroller's rated supply.
5%
Very short ON pulses. Extremely dim — almost imperceptible to the eye.
25%
ON for a short time. Dimmer — low average power to the LED.
50%
ON for half the period. Medium brightness — clear square wave on oscilloscope.
75%
ON for most of the period. Close to maximum brightness.
100%
Constant HIGH — acts like DC. Maximum brightness, flat line on oscilloscope.
PWM Waveforms — Oscilloscope Captures
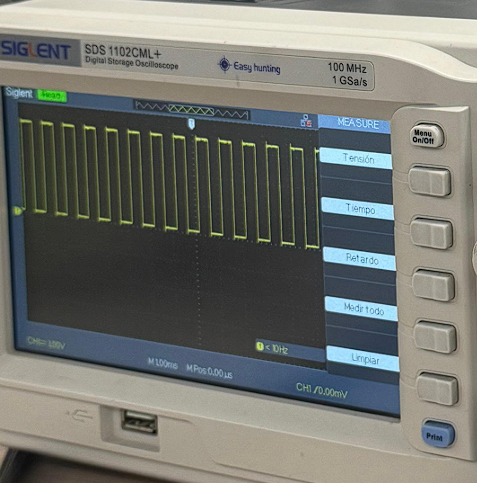
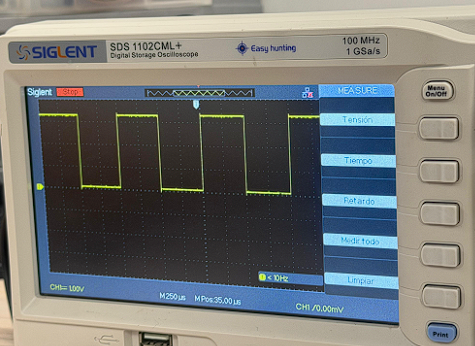
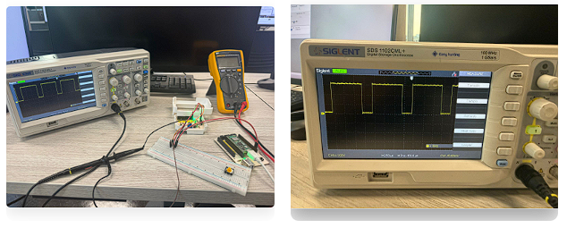
Img 18 — PWM high-frequency narrow pulses (~25%)Siglent SDS 1102CML+ showing very dense narrow ON pulses at M100ms time/div — many cycles visible. Short HIGH, long LOW confirms low duty cycle. Measure panel shows Tensión / Tiempo / Retardo.Img 19 — PWM 50% — wider time scale (M250ms)Same waveform at a wider time/div: only 4–5 cycles visible, clearly showing equal HIGH and LOW times. Confirms a stable, repeatable 50% duty cycle over multiple periods.
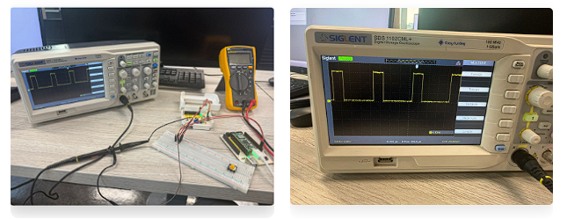
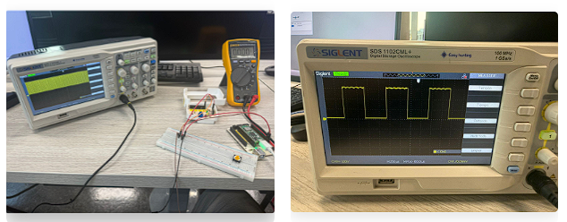
Img 6 — PWM 25% duty cycleLeft: breadboard setup with Pico, LED, multimeter. Right: oscilloscope showing narrow ON pulses — short HIGH, long LOW. Low average power, dim LED.Img 3 — PWM 50% duty cycleLeft: full lab setup. Right: clean 50/50 square wave — equal HIGH and LOW time. Medium brightness. Symmetrical waveform on the oscilloscope screen.
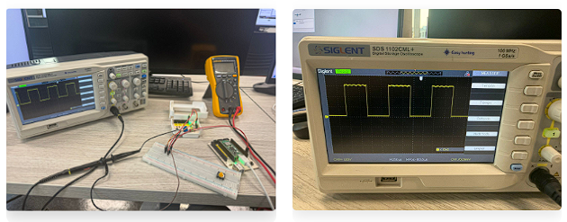
Img 7 — PWM 75% duty cycleLeft: setup. Right: wider ON pulses — longer HIGH than LOW. High average power, LED near maximum brightness.Img 8 — PWM 50% — wider time scaleSame 50% duty cycle at a wider time/div setting — multiple complete cycles visible. Confirms stable and repeatable waveform period across time.
Component Test
LED — Diode Test and Signal Analysis
The multimeter was set to diode mode to verify several LEDs. Most illuminated, confirming polarity and basic functionality. One LED did not turn on as expected, leading to an understanding of forward voltage requirements and the multimeter's test voltage limitation.
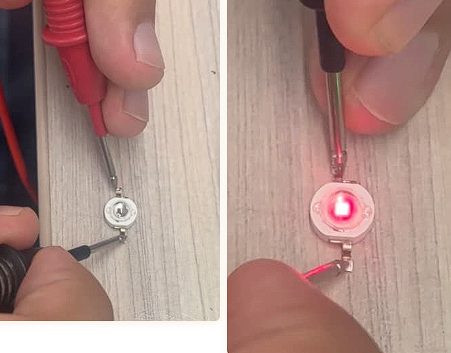
Img 15 — Diode test — red SMD LEDLeft: multimeter probes placed on the SMD LED pads — polarity check with no illumination yet. Right: LED illuminating red when probes are correctly oriented — Vf ≈ 2.0 V, within the multimeter's 2.7 V test range. Confirms the component is functional.
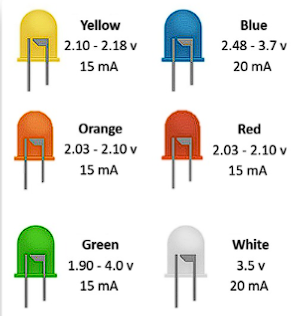
Img 11 — LED forward voltage & current by colorReference chart: Yellow 2.10–2.18 V / Blue 2.48–3.7 V / Orange 2.03–2.10 V / Red 2.03–2.10 V / Green 1.90–4.0 V / White 3.5 V. Current ratings 15–20 mA depending on color.
LED Forward Voltage by Color
LEDs have a forward voltage (Vf) that depends on color and semiconductor material. Voltage must exceed Vf for the LED to conduct and emit light. A series resistor is always required to limit and stabilize current.
Red
~2.0 V
Orange
~2.0 V
Yellow
~2.2 V
Green
~2.2 V
Blue
~2.8–3.4 V
White
~3.0–3.7 V
Transparent
~3.0 V
Key finding — multimeter diode test limit
The multimeter applies ~2.7 V in diode test mode. LEDs with Vf above 2.8 V (blue, white, transparent) will not activate during the test — not because they are defective, but because the test voltage is insufficient. The transparent LED's turn-on threshold of 3 V was confirmed using the regulated power supply instead.
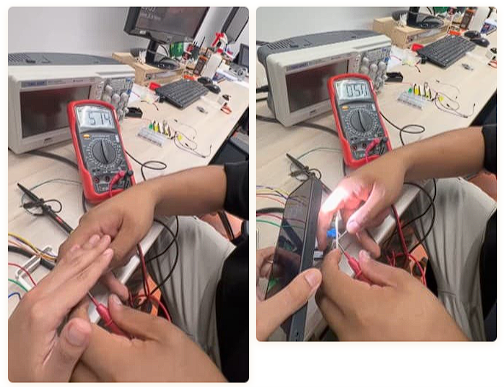
Img 20 — White LED turn-on with higher voltageLeft: multimeter reading ~5.7 V applied to a white LED — above its Vf threshold. Right: white LED lit at ~5 V confirming it is functional. This demonstrates that white LEDs (Vf ≈ 3.0–3.7 V) simply need more voltage than the diode test mode provides.
Equipment 03
Regulated Power Supply — Wanptek DPS3010U
The Wanptek DPS3010U provides variable voltage (0–30 V) and adjustable current (0–10 A), displaying consumed current in real time. Ideal for safely characterizing components — voltage can be increased gradually while monitoring current draw, identifying exact turn-on thresholds without risking component damage.
Test — Transparent LED Threshold
Finding the Turn-On Voltage
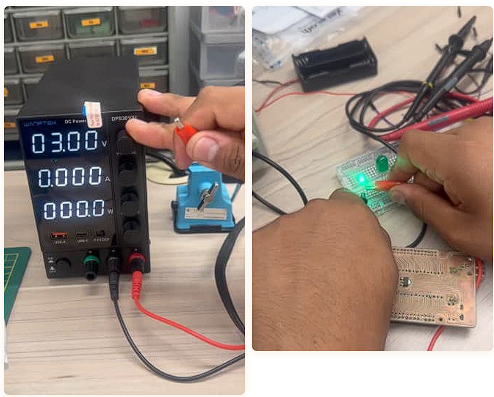
The transparent LED that did not respond during the multimeter diode test was connected to the power supply. Voltage was increased gradually from 0 V. The LED began conducting and emitting light at exactly 3 V, confirming the multimeter's 2.7 V test mode was simply insufficient — the LED was functioning correctly all along.
This test demonstrates how the regulated power supply complements the multimeter: it can apply any voltage precisely, making it possible to characterize components the multimeter cannot test at its fixed voltage levels.
Img 21 — Wanptek DPS3010U at 3.00 V — green LED confirmedLeft: power supply display showing exactly 3.00 V / 0.000 A output. Right: green LED illuminated on a breadboard at 3 V — confirming the component is functional and that the regulated supply provides the precise voltage needed to characterize LEDs below the multimeter's diode test range.
Feature
Detail
Voltage range
0 – 30 V, continuously adjustable
Current range
0 – 10 A, continuously adjustable
Current display
Real-time — shows actual consumption
Protection
Current limiting prevents component damage during tests
What each team member learned from this week's assignment.
Nicolas
Working with the oscilloscope gave me practical experience observing signals in real hardware that would be completely invisible from the code. Seeing the GPIO pin drop from 3.3 V to 2.9 V when driving an LED load made Ohm's law tangible — it is no longer just a formula, it is something I can see on a screen. The PWM tests were also clarifying: watching the duty cycle change in real time on the oscilloscope made the relationship between code, waveform, and perceived brightness very direct. Troubleshooting the LED that would not turn on during the diode test reinforced that the instrument's own limitations can look like a component failure.
Micaela
This week showed me that reading a voltage with a multimeter and reading a voltage with an oscilloscope are very different experiences — the oscilloscope shows the behavior of the signal over time, not just a number. Understanding that the multimeter's diode test applies 2.7 V and that blue or white LEDs need more than that was a practical lesson that no datasheet would have made as clear as actually testing it. The regulated power supply completing the test — gradually increasing until the transparent LED lit at exactly 3 V — was a good example of how different instruments work together rather than replacing each other.