Group Assignment - Electronic Design
For the group task we are going to see the operation of 3 tools that help us measure different aspects of electricity, but they have different purposes and provide information in different ways, the tools are an oscilloscope, a multimeter and an LA104 logic analyzer.
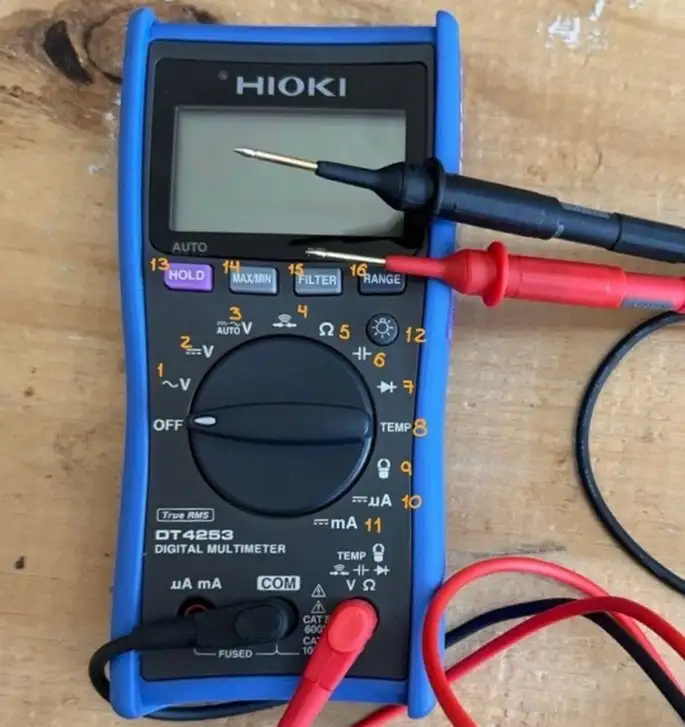
At Fablab Puebla we have 22 Gwinstek brand oscilloscopes and 20 Hioki multimeters. Let's briefly analyze the function of each one:
Multimeter
A multimeter is used to measure various electrical magnitudes in circuits, being the essential tool for diagnosing, repairing and installing electrical and electronic equipment.
Its basic functions include measuring the following:
- Voltage (V): It is used to know if there is energy and how much. You can measure from a 9V battery to the outlet on your wall. It is divided into Alternating Current (AC) and Direct Current (DC).
- Current (A): It measures the flow of electrons passing through a point. It is useful to know how much a device "consumes", although it requires connecting the multimeter in series with the circuit.
- Resistance (Ω): It measures how much a component opposes the flow of current. It is essential to verify if a sensor or resistor is in good condition.
Another important thing to mention is that the voltage in parallel is the same but in series it is different and that the current in series is the same and in parallel it is different, in addition the voltage, resistance and current are related to Ohm's Law.
- Voltage Measurement in Alternating Current (AC). Alternating current is what is used in homes.
- Direct Current (DC) Voltage Measurement. It is used for batteries and cells.
- Automatic Voltage Detection Function. The multimeter decides if it is AC or DC.
- Continuity helps us verify that our circuit is closed.
- To measure Resistance (ohms)
- Used to measure Capacitors.
- To verify if a diode allows current to flow in only one direction.
- Temperature Measurement. Requires you to connect a thermocouple instead of the normal leads.
- It is for use with an external clamp sensor. It is used to measure very high currents without opening the circuit.
- Measurement of Microampere in Direct Current.
- Measurement of Milliamperes in Direct Current.
- Turn on the screen backlight.
- Freeze the current reading on the screen.
- Records the maximum and minimum value reached during a measurement.
- Activate a low pass filter. It serves to eliminate electrical noise.
- Allows you to change the scale range manually (for example, go from mV to V).
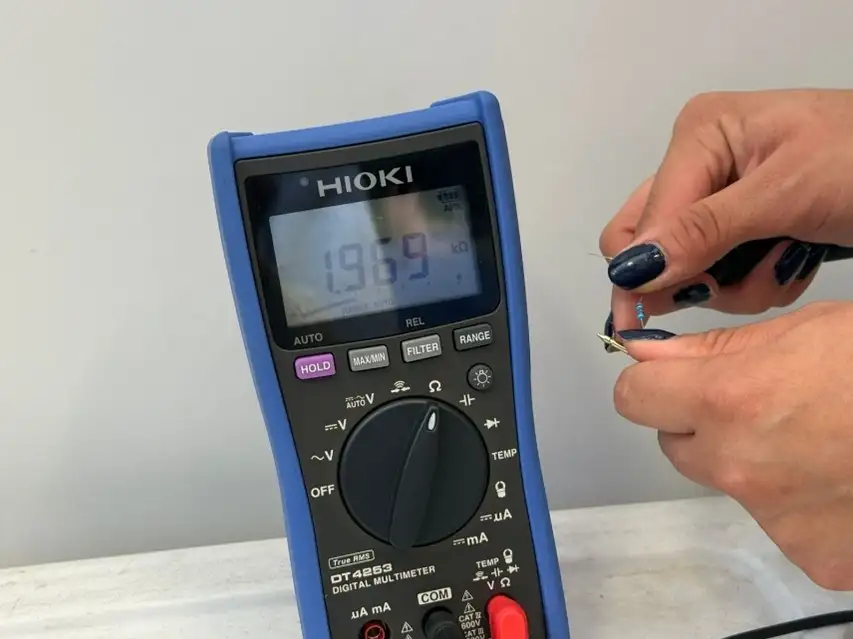
To test the different functions of the multimeter we did some tests:
We took a 2k ohm resistor and what the multimeter showed was 1.969 k ohms. This variation can happen due to wear and tear on the resistor or because you are holding the resistor incorrectly.
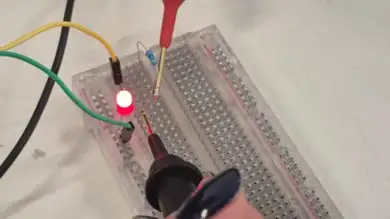
Then we grab an LED and if we place the multimeter leads correctly and the LED works, it should turn on.
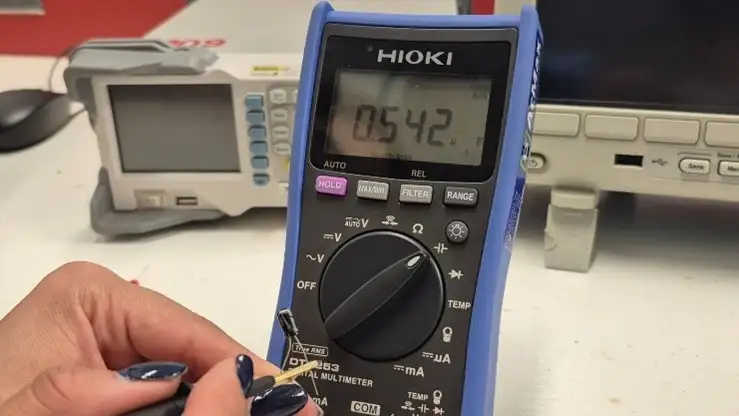
With a 0.47 uF electrolytic capacitor we had a measurement of 0.54 uF
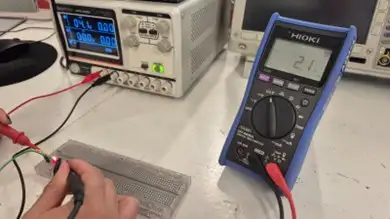
Then we connect a 470 ohm resistor and an LED to a 4.1 volt source and we measure two things: the voltage found in the resistor and the current between the LED and the resistor, the mathematical results are as follows:
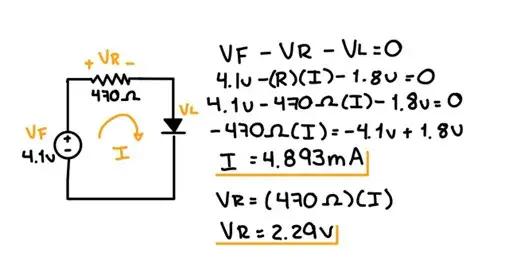
It is important to know that the voltage is measured in parallel and that the current is measured in series. Additionally, with the model of our multimeter we have to change the red lead of the multimeter from the right side to the left side, otherwise we can affect the operation of the multimeter. Physically, the red LED we placed could consume more than 1.8 volts, which is why a variation with the theoretical voltage is observed.
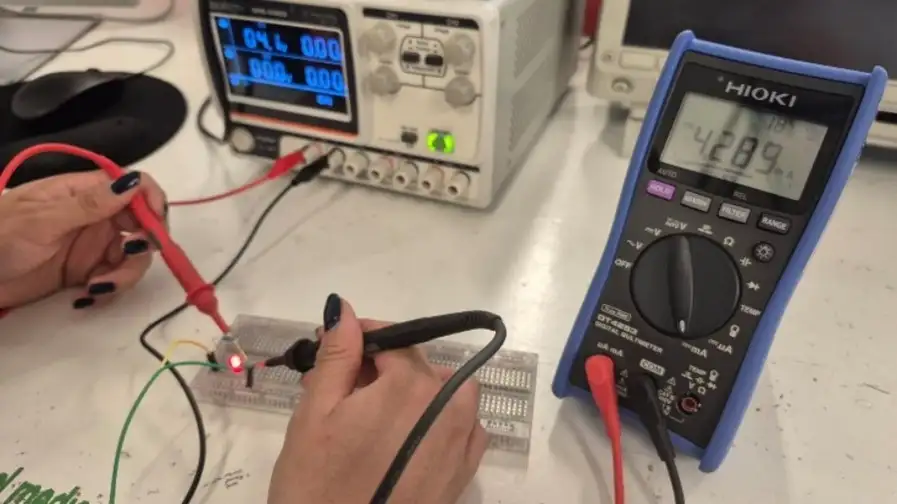
With the multimeter we obtained a current of 4.289 mA and a voltage of 2.1v
Function Generator
A function generator is an electronic device that produces various types of electrical waveforms over a wide range of frequencies. It is commonly used in electronics testing and development to simulate signals for testing circuits and components.
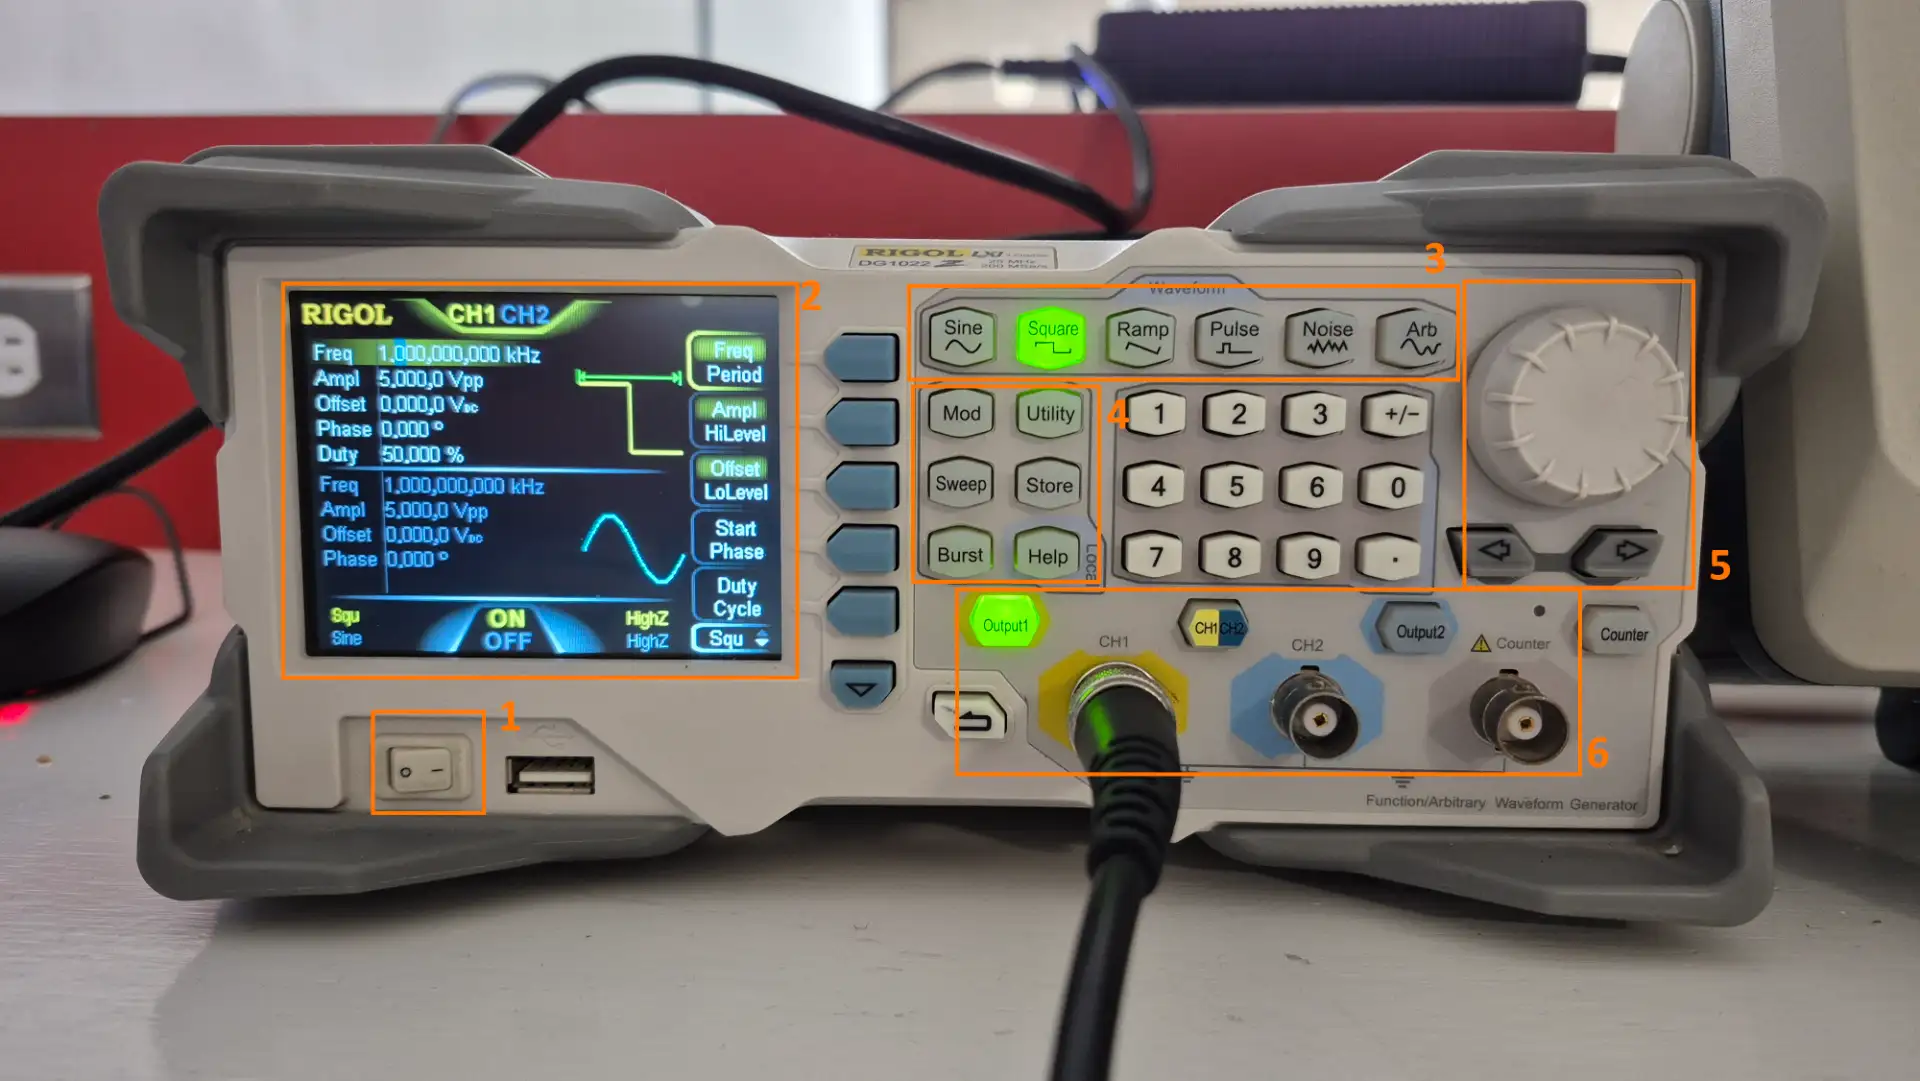
- Power Switch: Main switch to turn the generator on and off.
- LCD Display: Shows current parameters for both channels, including frequency, amplitude, offset, and the visual shape of the wave.
- Waveform Selection: Dedicated buttons to quickly choose the signal type: Sine, Square, Ramp, Pulse, Noise, or Arbitrary.
- Numeric Keypad: Allows for precise manual entry of values like frequency (Hz) or voltage (V).
- Adjustment Knob & Arrows: Used to increase or decrease values incrementally and navigate through menu options.
- Output Channels (BNC): Connection points for the cables. In the image, Channel 1 (CH1) is active and sending a signal.
Oscilloscope
The oscilloscope is like a movie that allows you to see the behavior of an electrical signal over time in a circuit.
It is used to analyze the shape of the signal, its amplitude, frequency and any distortion that may occur. It is an essential tool for diagnosing problems in electronic circuits and for designing and testing new circuits.
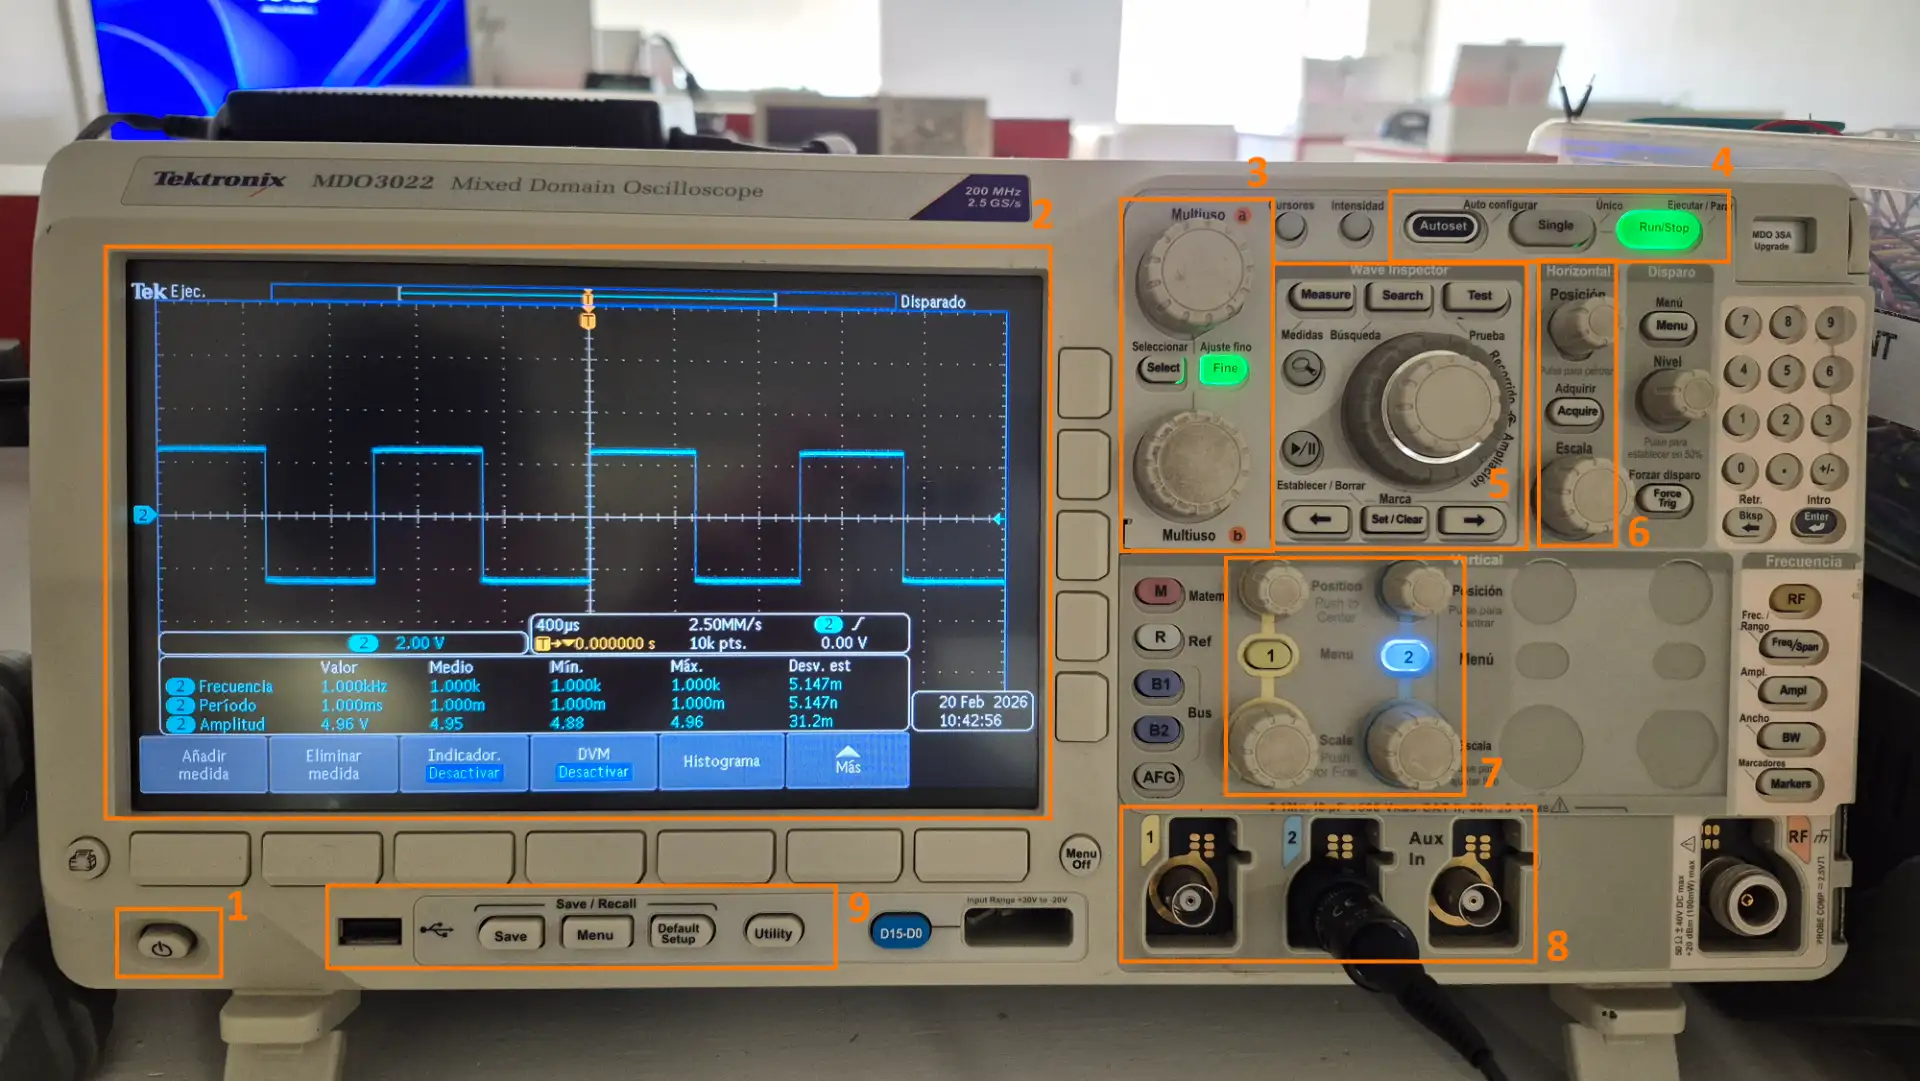
- On/Off Button: It is the physical button to turn the device on or off.
- Digital Screen: Where you view voltage waves against time.
- Multipurpose Knobs: Used to navigate on-screen menus, adjust specific parameters such as cursors, or move letters on the virtual keyboard.
- Execution Controls
- Run/Stop: Starts or stops the acquisition of signals.
- AutoSet: Automatically adjusts the vertical and horizontal scales to fit the signal on the screen.
- Wave Inspector Search and Zoom: This is the large dual knob that is used to navigate through very long memory captures.
- Horizontal Controls: Adjust the time scale and horizontal position of the signal on the screen.
- Vertical Controls: Adjust the voltage scale and up/down position of each channel
- BNC Channel Inputs: Where you connect the physical probes. You have Channel 1 and Channel 2 available, plus an auxiliary input.
- USB Port and Save: Used to connect a USB memory and save screenshots of your signals, something mandatory to document your Fab Academy group tasks.
Signal Reading
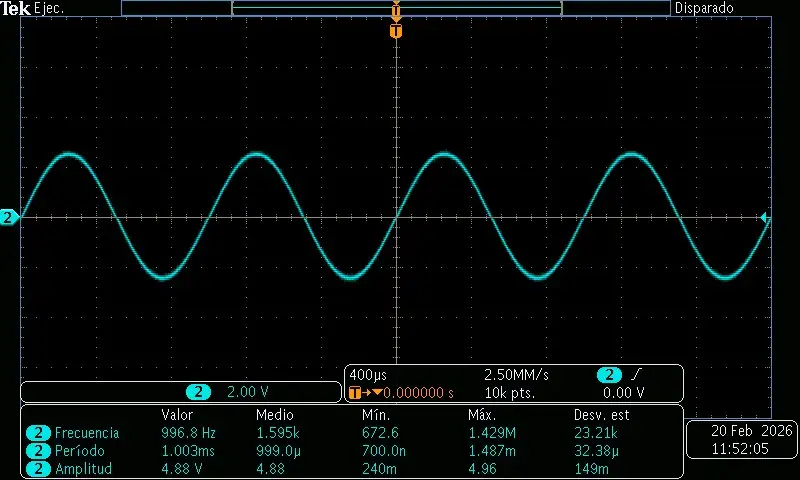
To characterize both the function generator and the oscilloscope, we connected the generator's output directly to the oscilloscope's input. This allowed us to visualize and verify the generated signal in real time.
- Frequency: 1,000 kHz
- Amplitude: 5,000 Vpp (Volts peak to peak)
- Offset: 0,000 Vpp
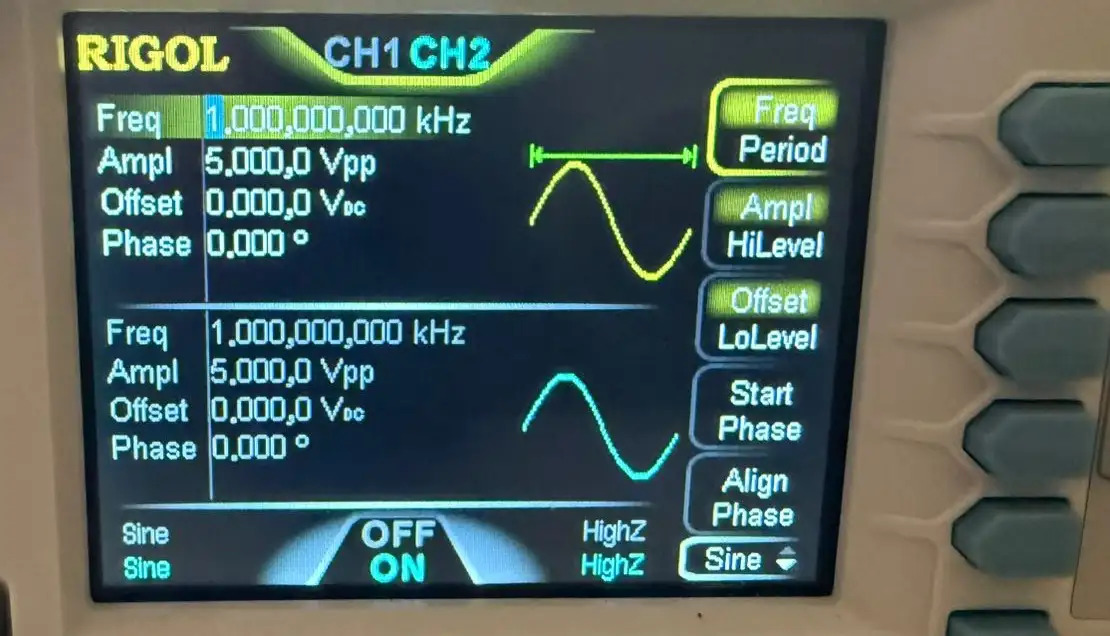
The measurement result confirms the correct interaction and calibration between the two pieces of laboratory equipment. When the generator is configured to emit a 1,000 kHz sine wave with an amplitude of 5,000 Vpp, the oscilloscope captures the signal with high fidelity, displaying a clean and stable waveform on the screen. The oscilloscope's measurements reflect a frequency of 996.8 Hz and an amplitude of 4.88 V; these very small variations from the original values are completely normal in the physical world and represent the slight losses generated by the resistance of the cable
PWM Signal
For our second test, we switched from using the function generator to using a real microcontroller: the RP2040. The goal was to program one of its pins GPIO to output a PWM Pulse Width Modulation signal and analyze its actual behavior using the oscilloscope.
#include "pico/stdlib.h"
#include "hardware/pwm.h"

int main() {
    const uint pin_pwm = 0;
    gpio_set_function(pin_pwm, GPIO_FUNC_PWM);

    uint slice_num = pwm_gpio_to_slice_num(pin_pwm);
    pwm_set_wrap(slice_num, 12500);

    pwm_set_enabled(slice_num, true);

    int nivel = 0;
    int direccion = 500;

    while (true) {
        pwm_set_gpio_level(pin_pwm, nivel);

        nivel += direccion;
        if (nivel >= 12500 || nivel <= 0) {
            direccion = -direccion;
        }

        sleep_ms(50);
    }
}
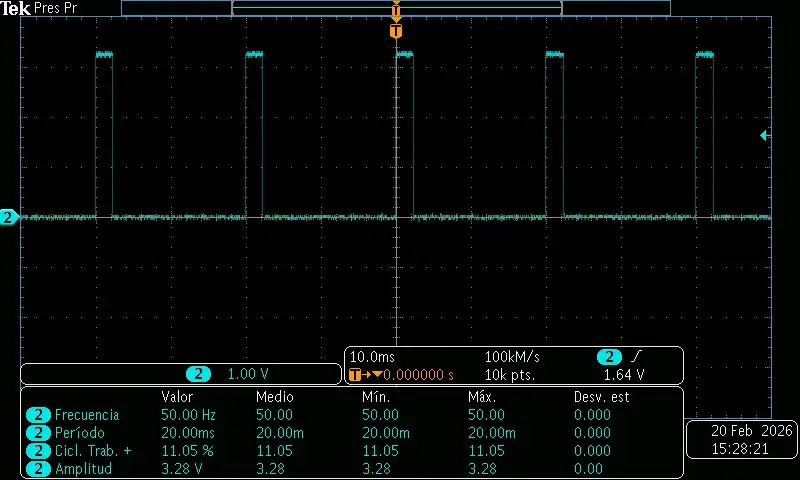
In this test, we observed a PWM signal with a frequency of approximately 1.6 kHz and a duty cycle that smoothly transitions from 0% to 100% and back to 0% in a continuous loop. The oscilloscope's measurements confirm the expected behavior of the PWM signal, demonstrating that the microcontroller is correctly generating the signal according to the programmed code.
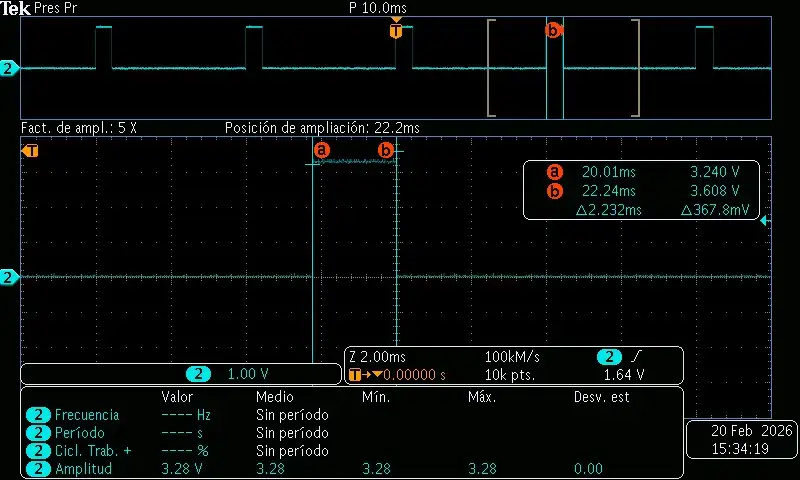
Using the cursor tool to measure specific points on our waveform allows us to extract accurate manual readings, instead of relying solely on the oscilloscope's automatic averages.
Pulse width is obtained by placing the cursors on the rising and falling edges, the differential measured 2.232 ms, which represents the exact duration of the signal in the active state.
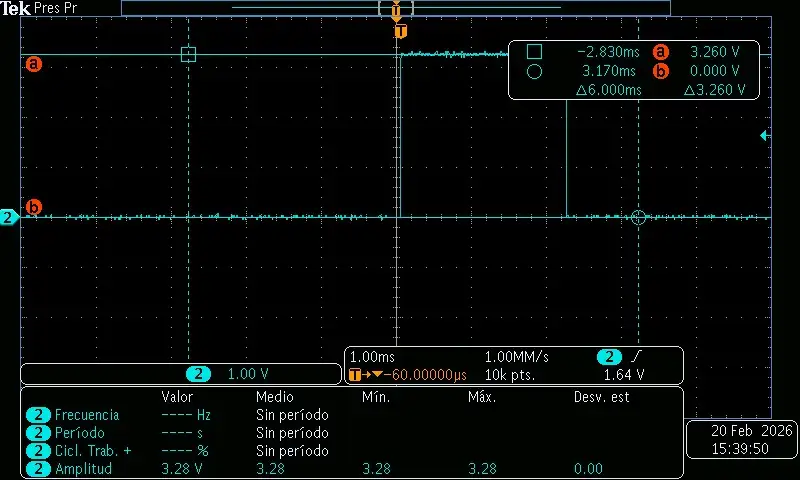
Logic levels obtained with cursors confirmed the physical amplitude of the signal, registering 3.260 V at the pulse peak and 0.000 V at the baseline, thus verifying the correct operation of the microcontroller.
UART Communication
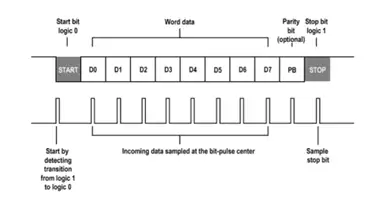
The use of UART communication on which serial printing is based has a very specific way in which it sends its message, as we can see below.
With the following code we saw how this communication works by sending the letter "D".
#include "pico/stdlib.h"
#include "hardware/uart.h"

int main() {
    uart_init(uart1, 9600);

    gpio_set_function(4, GPIO_FUNC_UART);
    gpio_set_function(5, GPIO_FUNC_UART);

    while (true) {
        uart_putc(uart1, 'D');
        sleep_ms(50);
    }

    return 0;
}
When we run the code, we can see the signal generated by the UART communication on the oscilloscope, which consists of a series of pulses that represent the bits being transmitted.
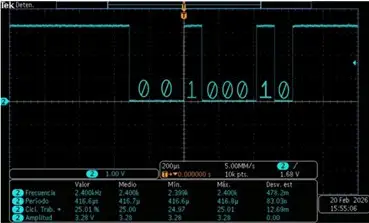
When analyzing the UART signal on the oscilloscope, the binary representation of the character 'D' appears as 00100010 instead of the expected 01000100. This occurs because the UART protocol uses the LSB-First (Least Significant Bit First) transmission standard, meaning that the least significant bit is the first to travel along the wire after the start bit.
Since the oscilloscope displays data chronologically from left to right, the bits appear on the screen in the reverse order of their usual logical reading, sending bit 0 first and ending with bit 7 before the stop bit.
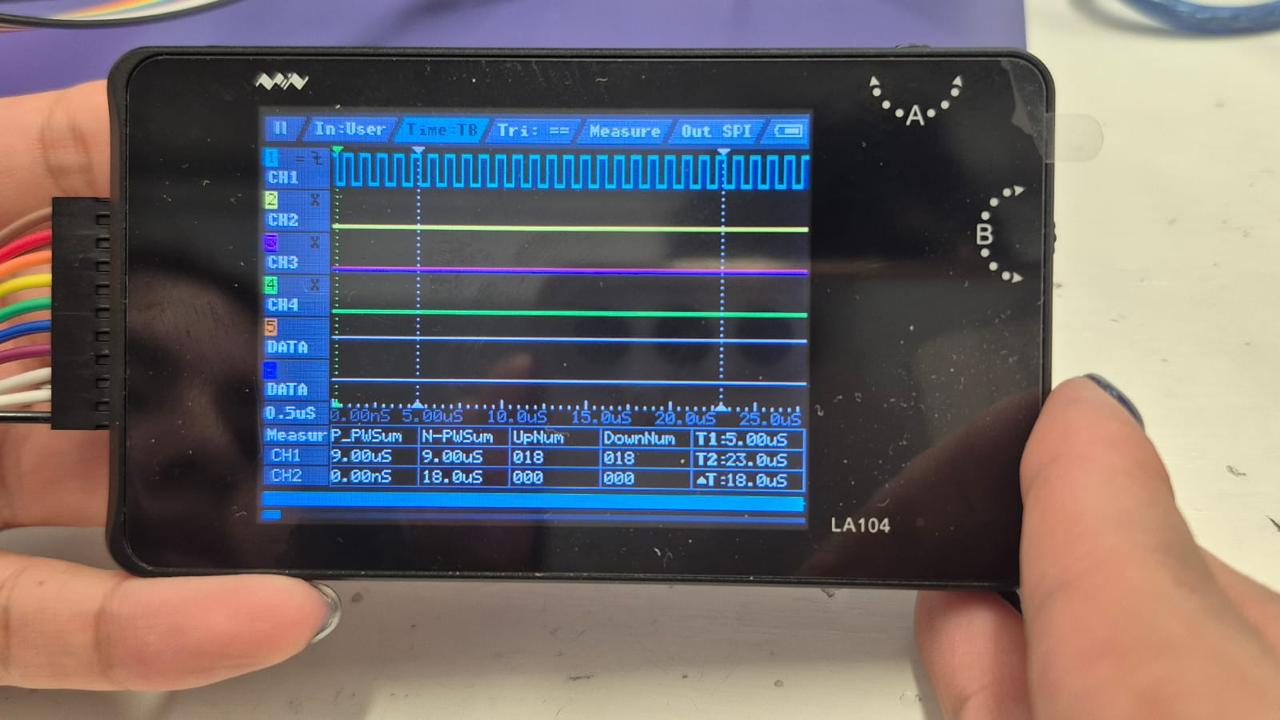
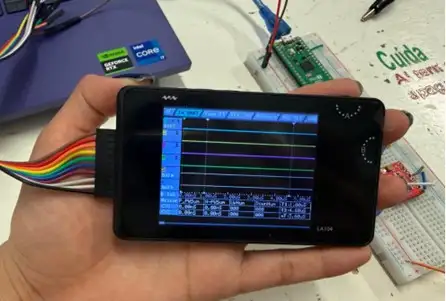
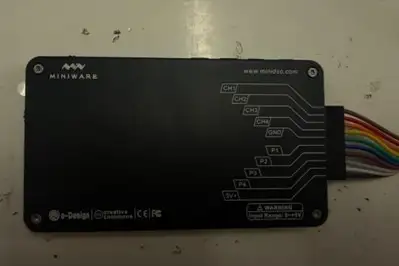
LA104 Logic Analyzer
The logic analyzer is used to capture, display, and decode digital signals that travel between the components of an electronic system.
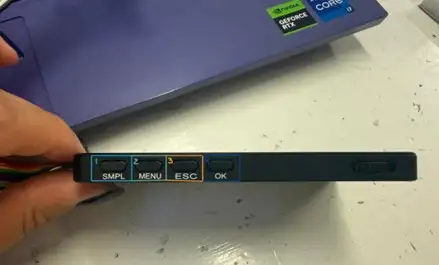
- This is the start/stop button. It's used to begin capturing digital signals from your pins or to stop an ongoing capture.
- This provides access to the advanced settings. Here you select which protocol you want to decode (I2C, SPI, UART, USER) and adjust the sampling rate.
- This is the back/cancel function.
- Confirmation button.
To test the operation of the Logic Analyzer, we performed some tests with a Raspberry PiPico 2, connecting the signal output to channel 1 and connecting the common ground of the logic analyzer and the microcontroller.
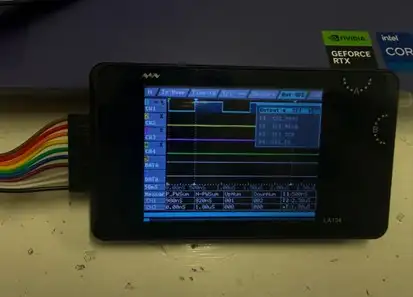
In this menu we can choose the type of input we want (SPI, UART, I2C, USER)
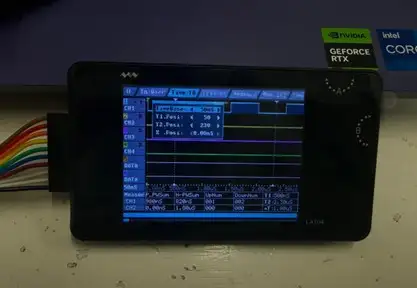
This menu helps us change the time scale in the analyzer.
Our analyzer also serves as a communication device, so it has the option to select which type of output you want (SPI, UART, I2C)
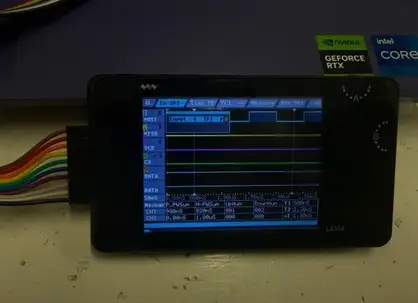
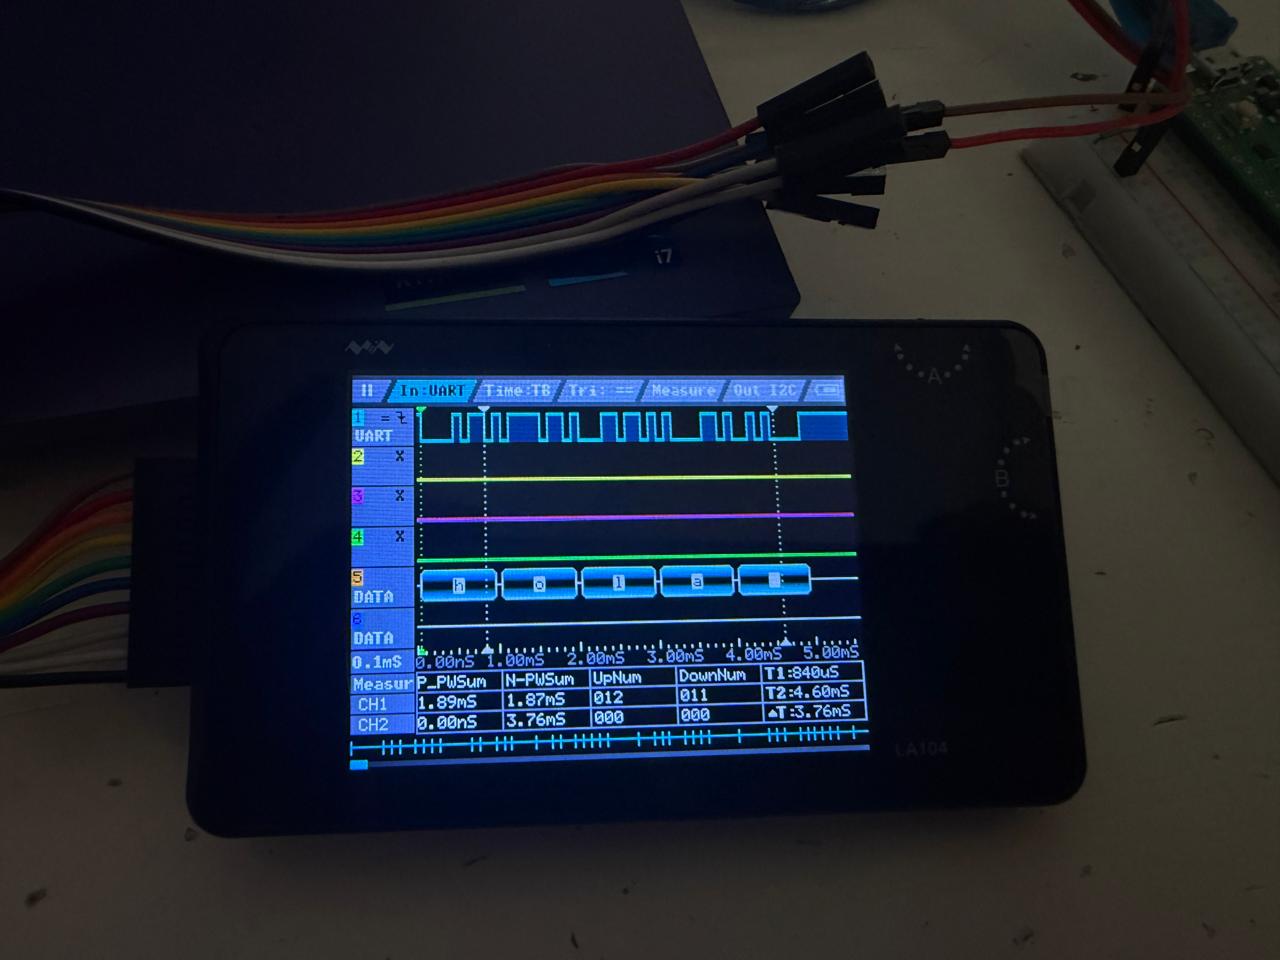
For the first test we made a code so that our Raspberry Pi would send a hello via UART so that we could view it on the LA104, we connected the TX output to channel 1 and common ground, and in the Input type we must put UART.
#include "pico/stdlib.h"
#include "hardware/uart.h"

#define UART_ID uart0
#define BAUD_RATE 9600
#define UART_TX_PIN 0
#define UART_RX_PIN 1

int main() {
    stdio_init_all();
    uart_init(UART_ID, BAUD_RATE);

    gpio_set_function(UART_TX_PIN, GPIO_FUNC_UART);
    gpio_set_function(UART_RX_PIN, GPIO_FUNC_UART);

    while (true) {

        uart_putc(UART_ID, 'h');
        sleep_us(500);

        uart_putc(UART_ID, 'o');
        sleep_us(500);

        uart_putc(UART_ID, 'l');
        sleep_us(500);

        uart_putc(UART_ID, 'a');
        sleep_us(500);
         sleep_ms(1000);
    }
}
When we run the code, we can see the signal generated by the UART communication on the logic analyzer, which consists of a series of pulses that represent the bits being transmitted. The analyzer decodes these pulses and displays the corresponding characters, confirming that the microcontroller is correctly sending the intended message.
We also tried the PWM code that was previously used to see the oscilloscope working; in the In type we must put USER.