Assignment Requirements
Group assignment
- Compare as many tool options as possible.
- Document your work on the group work page and reflect on your individual page what you learned.
Individual assignment
- Write an application for the embedded board that you made. that interfaces a user with an input and/or output device(s)
Progress Status
This is for reporting progress (not for visitors to click).
Group page link + notes added.
Missing final photos and conclusions.
Upload .zip with source files.
Assignment Requirements
Learning outcomes
- Implement a User Interface (UI) using programming and explore protocols to communicate with a microcontroller board that you designed and made.
Have you answered these questions?
- Linked to the group assignment page.✅
- Documented your process.✅.
- Explained the UI that you made and how you did it.✅.
- Explained how your application communicates with your embedded microcontroller board.✅.
- Explained any problems you encountered and how you fixed them.✅.
- Included original source code (or a screenshot of the app code if that's not possible).✅.
- Included a ‘hero shot’ of your application running & communicating with your board.✅.
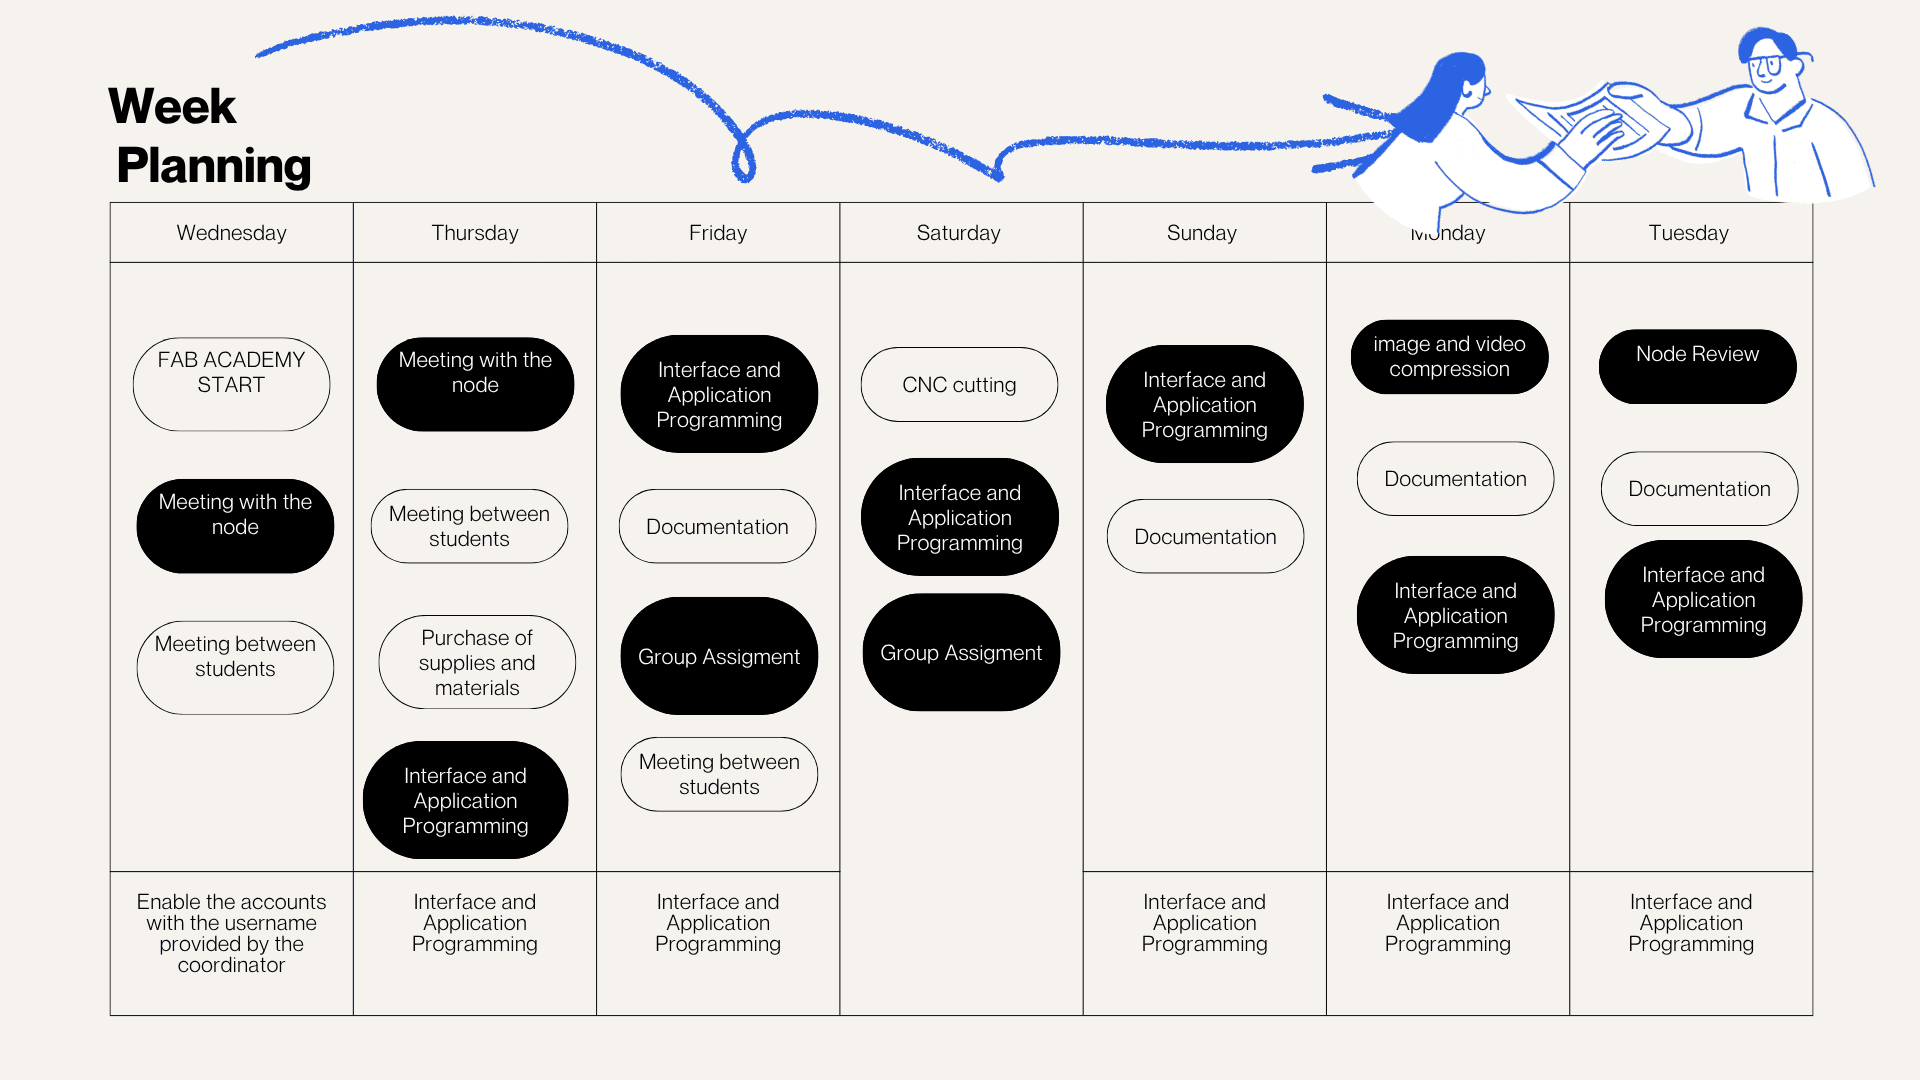
Weekly planning
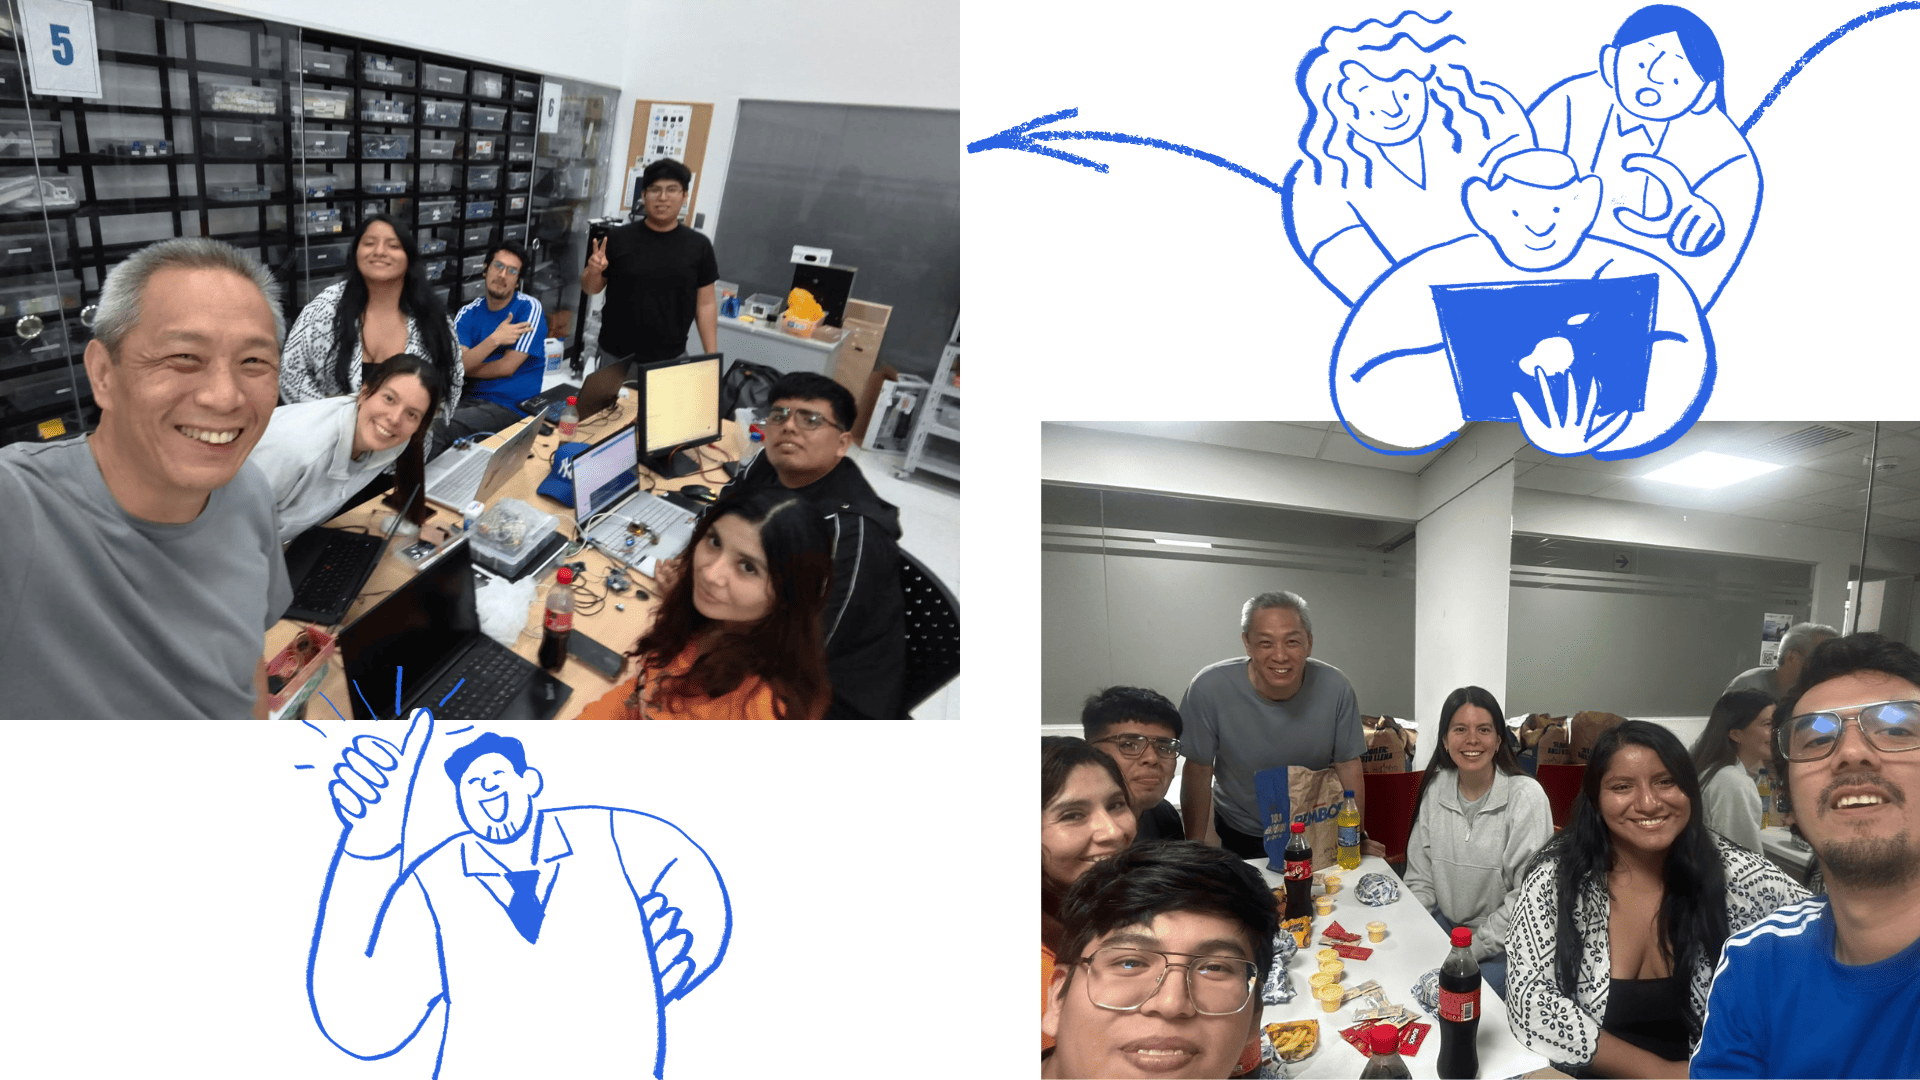
During the week, we carried out various activities that presented significant challenges but were also very rewarding, especially due to the opportunity to share and learn as a team. We met virtually with our colleagues at the node and participated in lab meetings, which allowed us to organize ourselves and conduct open workshops in different spaces. In these sessions, we reviewed and worked with input devices, understanding their operation and their importance in capturing data from the environment for subsequent processing in electronic systems.
During this week of Interface and Application Programming, our group developed and validated various forms of interaction between hardware and software, focusing on real-time communication and device control.
We conducted serial interface tests using PuTTY, successfully displaying data from the HC-SR04 ultrasonic sensor on the terminal and verifying communication between the microcontroller and the computer.
We also implemented a graphical interface in Processing, enabling us to control the on/off and blinking of an LED using interactive buttons, demonstrating functional integration between visual software and hardware.
Finally, we explored wireless communication using Bluetooth, developing a mobile application in MIT App Inventor that allowed us to control an LED from a smartphone, demonstrating the versatility of interfaces and remote connectivity.
Together, these activities allowed us to understand and apply different interaction methods, strengthening our skills in interface development and the integration of physical and digital systems.
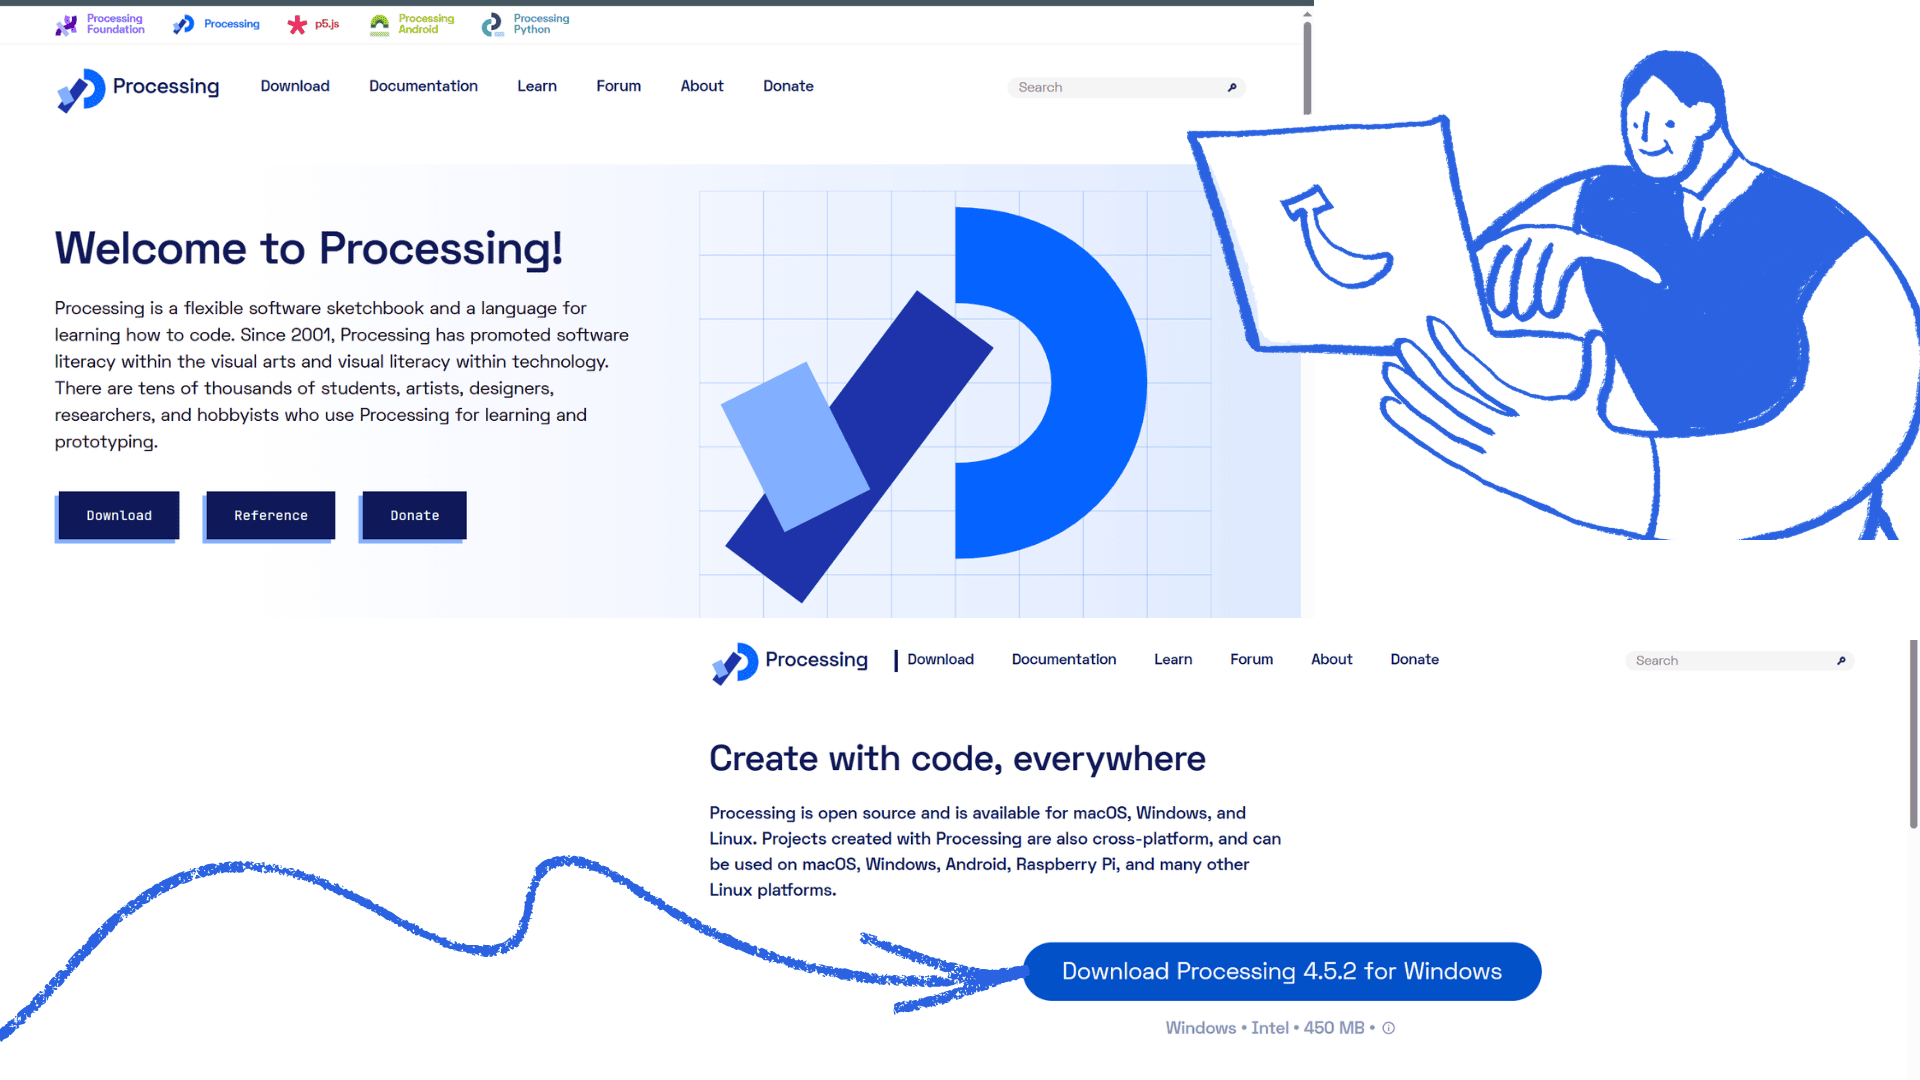
Processing is a flexible programming environment that allows the development of interactive visual interfaces for real-time hardware control.
Access the official Processing website and download the version compatible with your operating system (Windows, macOS, or Linux).
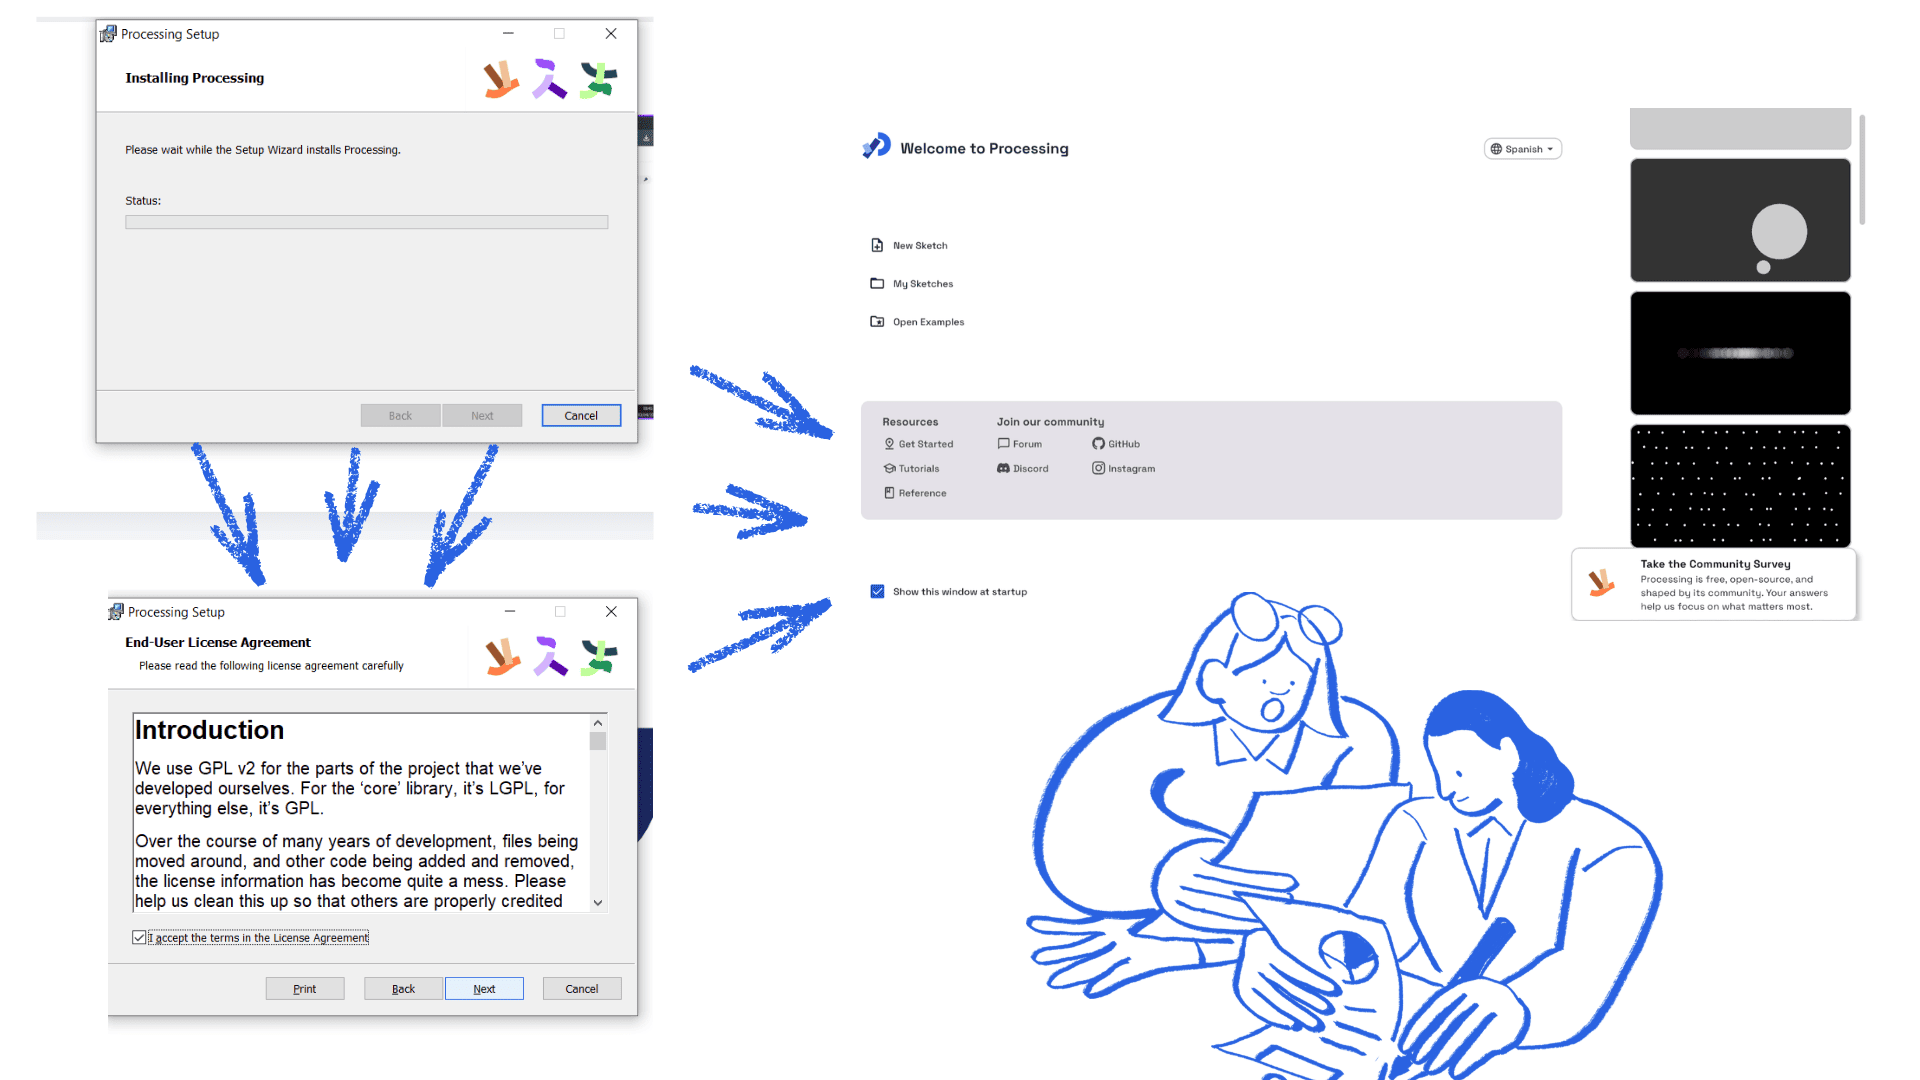
Extract the .zip file into an accessible folder on your computer, such as Desktop or Documents.
Open the extracted folder and run the main file (processing.exe on Windows) to start the environment.
Connect the ESP32-C3 board using a USB cable and verify the assigned port on your system.
Import the Serial library in Processing and select the correct port to establish communication.
Implement the required buttons to control the LED (ON, OFF, and blinking modes).
Press the “Run” button to execute the graphical interface and activate real-time communication.
Verify that the LED responds correctly to the commands sent from the interface.
Before establishing communication with the microcontroller, an initial exploration of the Processing environment was carried out in order to understand its structure, execution logic, and graphical capabilities.
Its programming model was studied based on two main functions: setup() and draw(). The setup() function runs only once when the program starts and is used to configure the environment, such as window size, initial variables, and general parameters. On the other hand, the draw() function runs continuously in a loop, allowing real-time updates of visual elements and the creation of dynamic interfaces.
In addition, the graphical rendering capabilities of Processing were explored, including shape creation, color usage, typography, and screen positioning, which are essential for designing intuitive interfaces.
Interaction mechanisms were also analyzed, such as input event detection through the mouse and keyboard. This helped to understand how users can interact with graphical elements and how these actions can be translated into commands for hardware control.
This stage was essential for establishing a solid foundation in interface development, facilitating the later integration with the microcontroller and the implementation of real-time interactive systems.
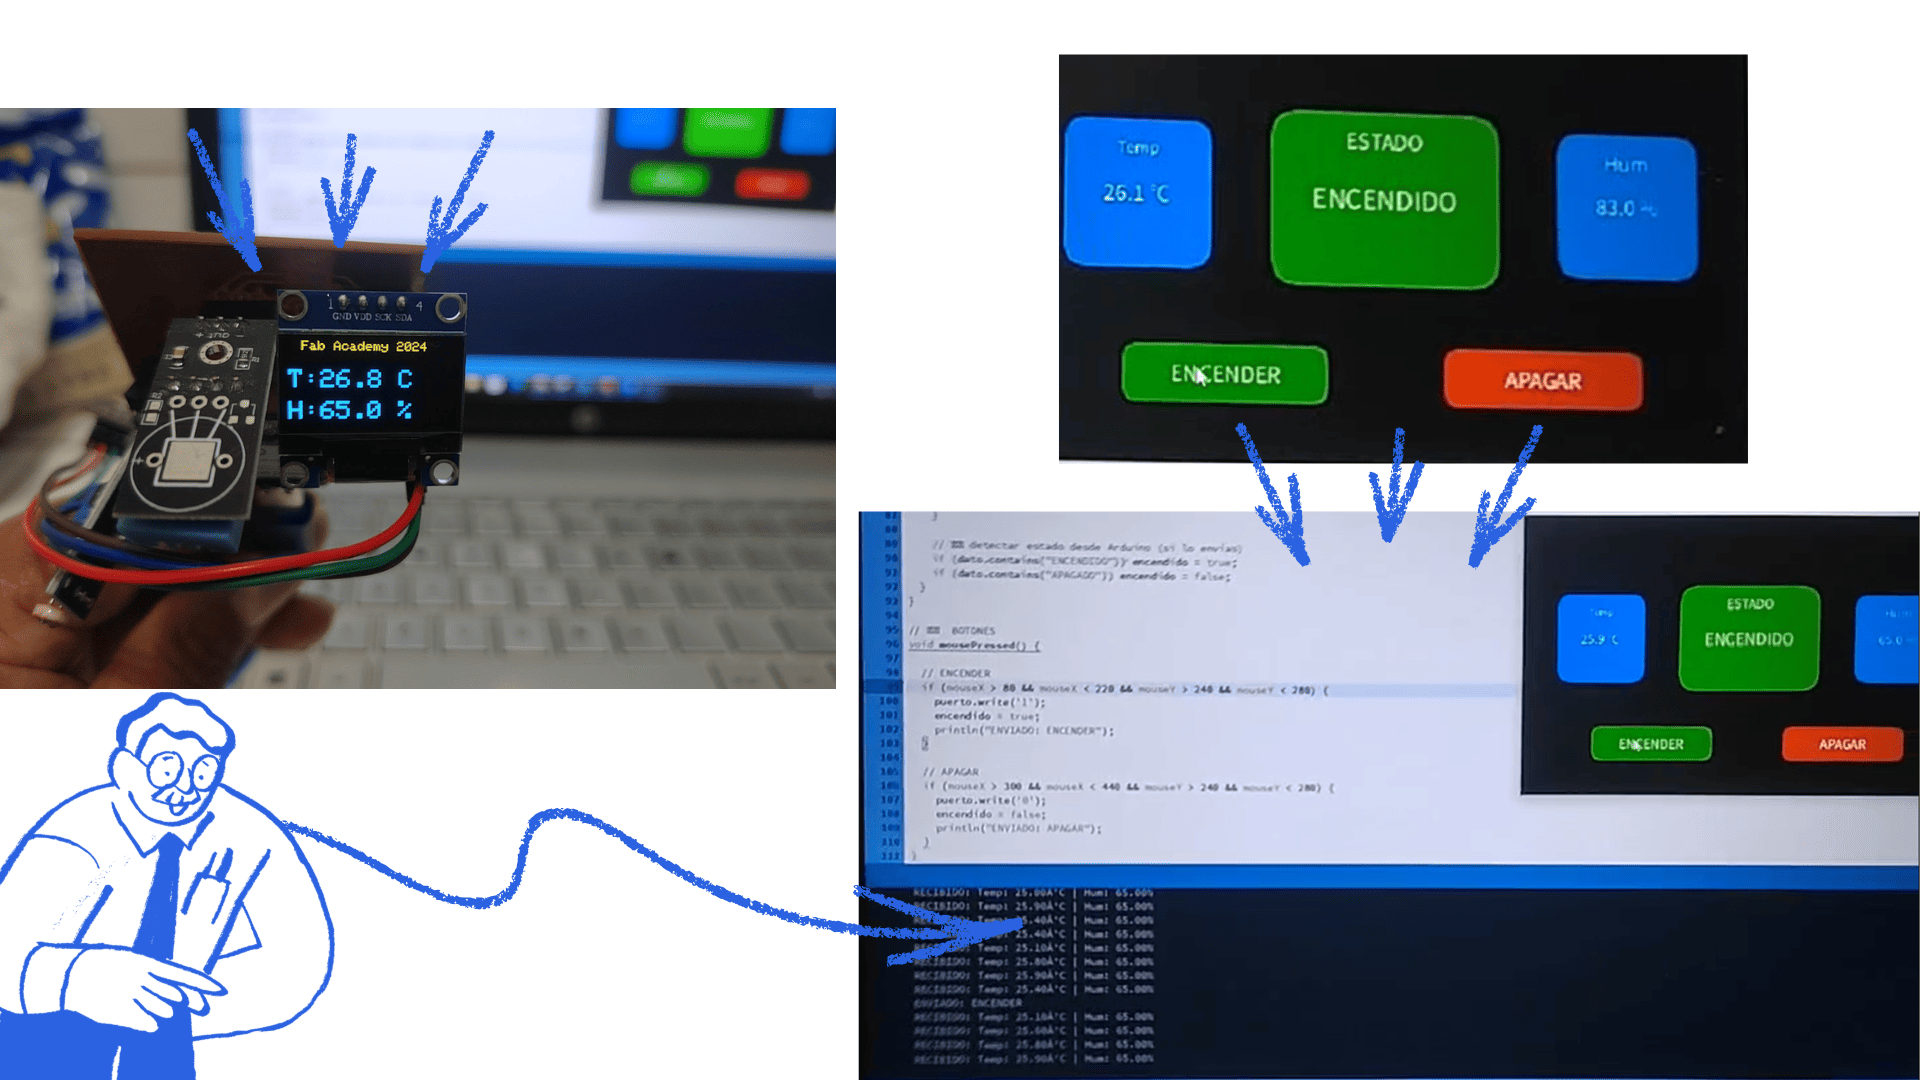
This project focuses on the development of an interactive monitoring and control system using the XIAO ESP32-C3 microcontroller.
The system integrates multiple sensors and output devices, combined with a graphical interface developed in Processing,
allowing real-time visualization and user interaction.
The main objective was to establish a bidirectional communication system between hardware and software, enabling both
data acquisition and remote control through a custom interface.
The system incorporates several electronic components to perform sensing, visualization, and actuation tasks.
A DHT11 sensor was used to measure environmental temperature and humidity, while a light-dependent resistor (LDR)
was included to detect ambient light levels. Additionally, an OLED display based on the SSD1306 controller was used
to provide local feedback directly on the device.
An RGB LED was integrated as a visual actuator, allowing the system to represent different states through color changes.
All components were connected and controlled by the ESP32-C3, which handled both data processing and communication.
The ESP32-C3 continuously reads sensor data and processes it locally. The values obtained from the DHT11 sensor
are transmitted to Processing through serial communication. To ensure proper parsing and synchronization, the data
is sent in a structured format containing only numerical values separated by a comma.
This format allows Processing to efficiently interpret incoming data and update the graphical interface in real time.
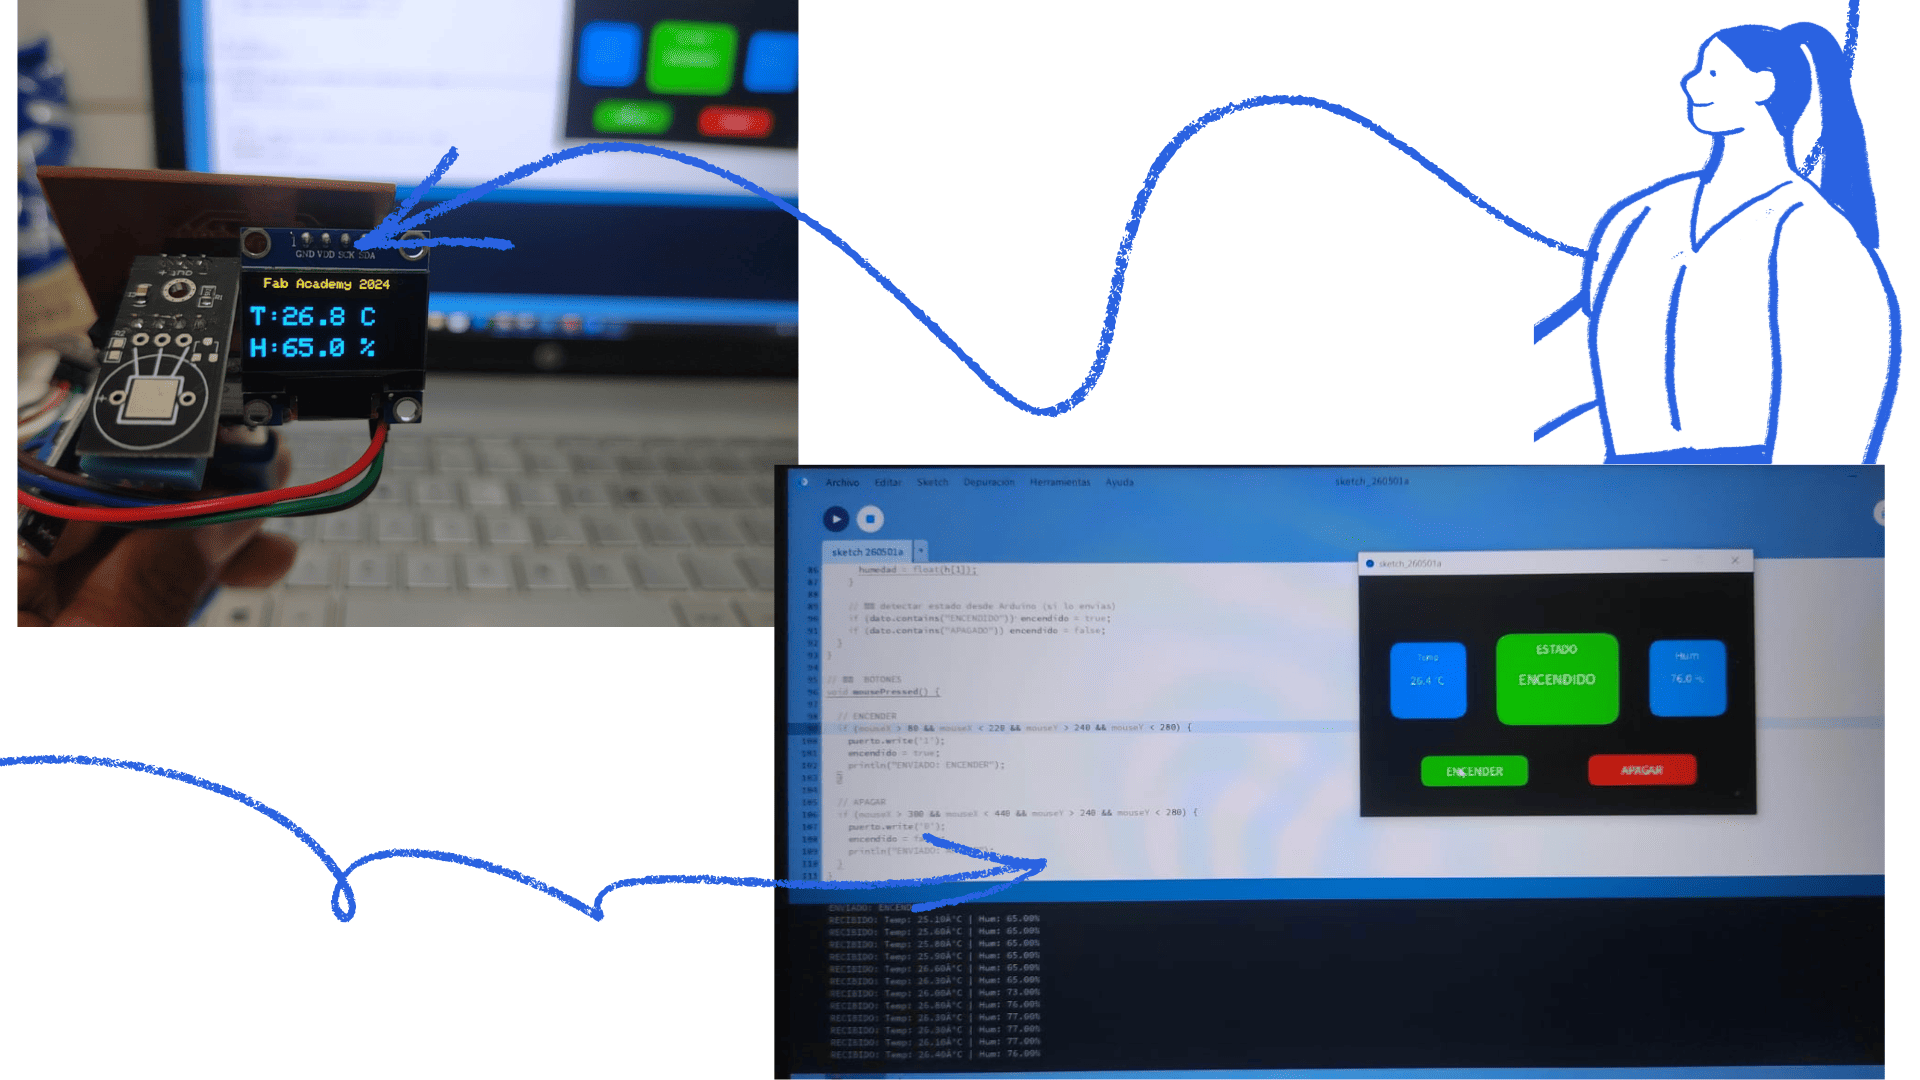
The OLED display provides immediate feedback without requiring a computer interface. It shows temperature and humidity
values, updating continuously as new data is read from the sensors. In addition, the display is capable of presenting
system messages, such as sensor reading errors, ensuring basic diagnostic capability at the hardware level.
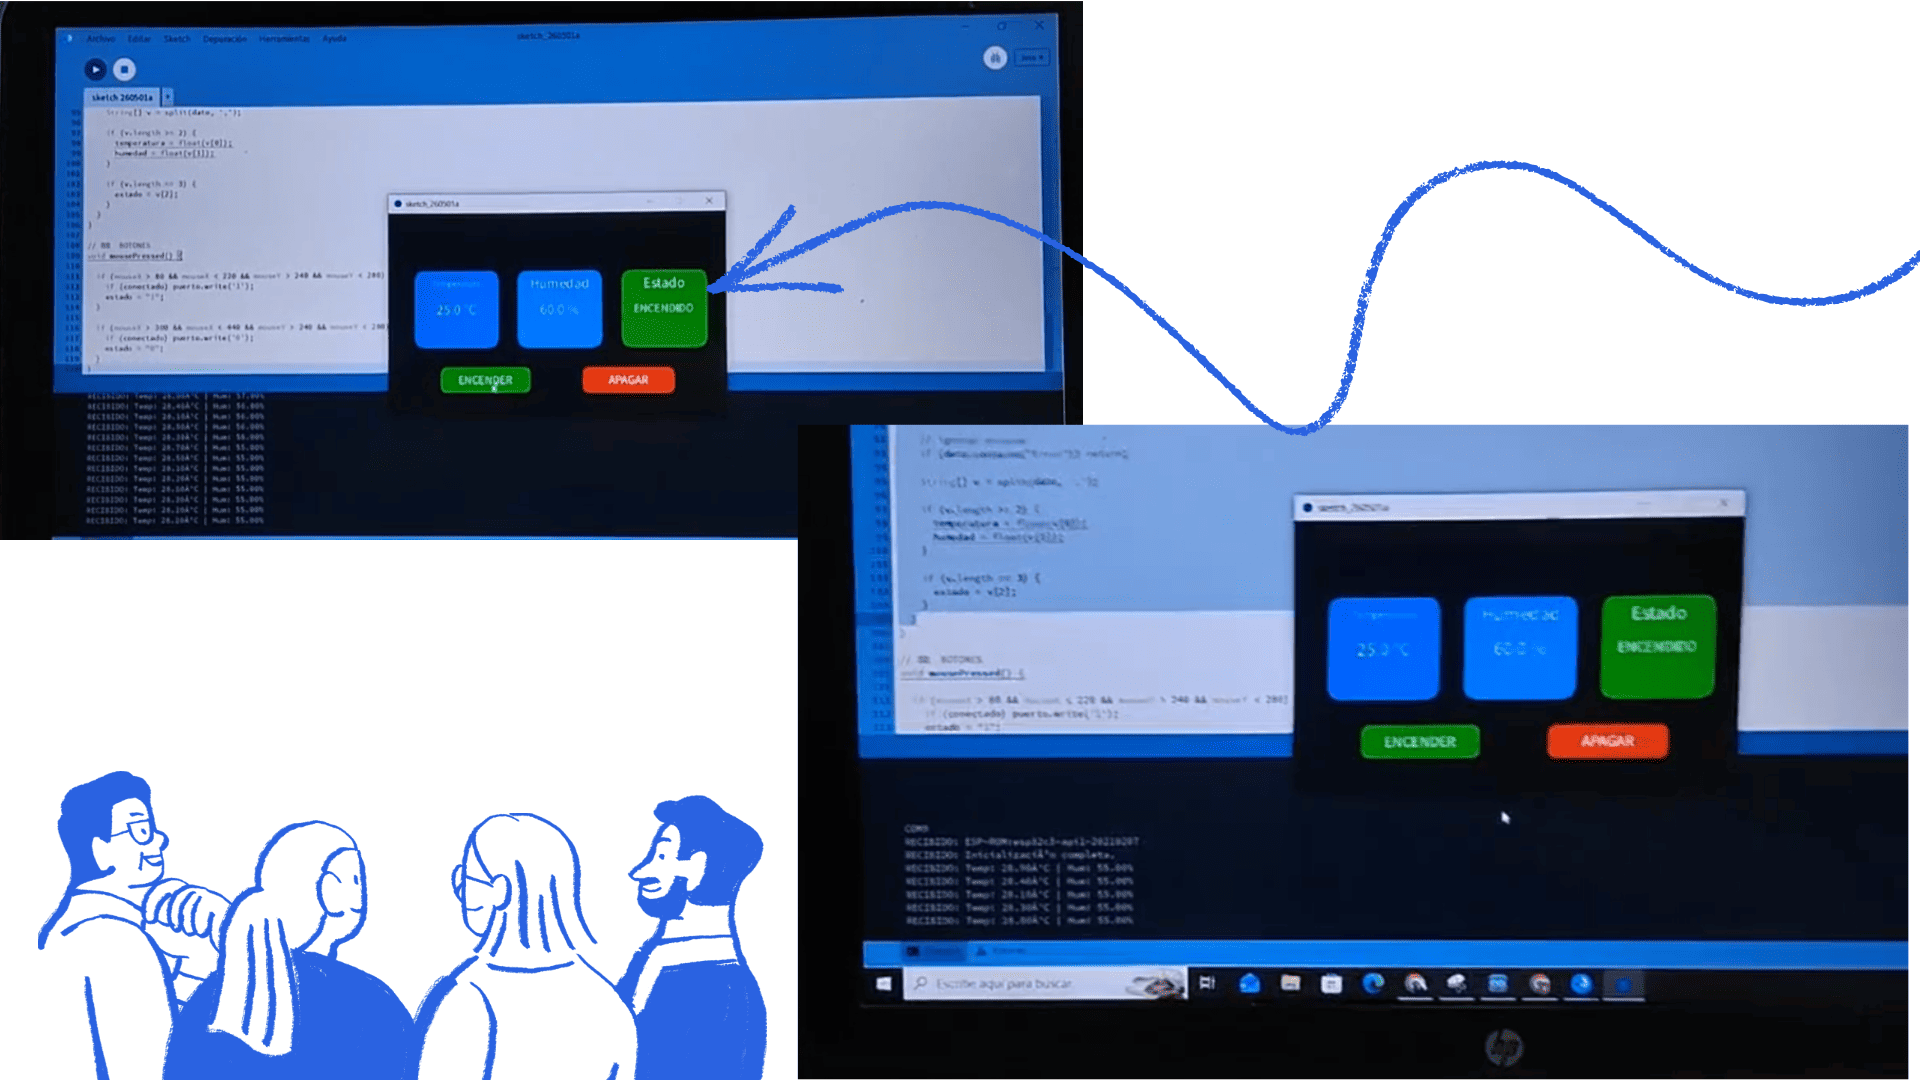
A custom graphical interface was developed using Processing to enhance user interaction and data visualization.
This interface displays temperature and humidity values dynamically and includes a visual representation of the
system state through a color indicator.
The interface also incorporates interactive buttons that allow the user to control the behavior of the RGB LED remotely,
demonstrating a real-time connection between the software interface and the physical system.
Three operational modes were implemented to control the RGB LED:
In automatic mode, the LED color changes according to the measured temperature ranges. Lower temperatures activate
a blue color, medium values produce green, and higher temperatures trigger red. This provides an intuitive visual
representation of environmental conditions.
In manual ON mode, the LED remains fully turned on regardless of sensor values, providing a constant visual output.
In OFF mode, the LED is completely turned off, overriding any automatic behavior.
The system demonstrates a complete integration of sensing, visualization, and control. The ESP32-C3 collects data
from the environment, displays it locally on the OLED, and transmits it to Processing. At the same time, Processing
allows the user to send commands back to the microcontroller, enabling real-time control of the RGB LED.
This bidirectional communication establishes a dynamic interaction loop between the user and the physical system,
making the interface both informative and interactive.
This project highlights the potential of combining embedded systems with graphical programming environments to create
responsive and interactive applications. The integration of sensors, displays, and user controls demonstrates how
real-time data can be effectively visualized and manipulated, resulting in a functional and adaptable system.
The DHT11 sensor was used as an input device to capture environmental temperature and humidity data.
The sensor sends digital environmental data directly to the XIAO ESP32-C3 for processing.
The LDR sensor was implemented to detect changes in ambient light intensity through analog readings.
The microcontroller uses the
The OLED SSD1306 display was integrated as the main output device to visualize environmental information and system states in real time.
Communication between the OLED display and the microcontroller was established using the I2C communication protocol.
The RGB LED was used as a visual actuator to represent different system states according to environmental conditions and control modes.
The RGB LED changes color automatically according to temperature values or through commands sent from the Processing interface.
The OLED display and the RGB LED function as the main output devices of the interactive system.
The OLED display provides immediate visual feedback by showing temperature, humidity, and system messages in real time. At the same time, the RGB LED visually represents different system states through color changes according to environmental values or user actions.
The interface developed in Processing complements the system by enabling dynamic visualization of the sensor data and remote control of the RGB LED behavior.
This integration demonstrates an effective bidirectional communication between hardware and software, combining environmental monitoring, interactive visualization, and real-time control.
The RGB LED changes automatically according to the detected temperature:
The RGB LED remains turned on regardless of the sensor values.
The RGB LED turns off completely, overriding automatic behavior.
The complete system was tested to validate communication between the ESP32-C3, sensors, OLED display, RGB LED, and the Processing interface.
During testing:
These tests validated the correct operation of the interactive system and confirmed the successful integration of sensors, output devices, serial communication, and the graphical interface developed in Processing.
Working with Processing as part of this project was a highly valuable experience, as it allowed the transition
from a purely hardware-based system to a more interactive and user-centered approach. Initially, the project
focused on reading sensor data and displaying it locally on the OLED screen. However, integrating Processing
introduced a new dimension by enabling real-time visualization and control through a graphical interface.
One of the most interesting aspects was observing how data from the ESP32-C3 could be translated into dynamic
visual elements. The interface not only displayed temperature and humidity values but also represented system
states through color changes and interactive components such as buttons. This made the system more intuitive
and easier to understand, especially when monitoring environmental conditions.
The implementation of control modes, including automatic behavior based on temperature and manual ON/OFF states,
demonstrated the potential of bidirectional communication. Processing was not only receiving data but also sending
commands back to the microcontroller, creating a complete interaction loop between the user and the physical system.
Overall, this experience showed how powerful it is to combine embedded electronics with visual programming tools.
Processing transformed the project from a simple sensor-reading setup into a more engaging and functional system,
where information is not only displayed but also actively controlled. This integration highlights the importance
of interface design in making technological systems more accessible, interactive, and meaningful.
Group Work: Interface and Application Programming

Software Installation – Processing
Step 1: Download the Software
Step 2: Extract the File
Step 3: Run the Application
Step 4: Prepare the Hardware
Step 5: Configure Communication
Step 6: Develop the Interface
Step 7: Run the Program
Step 8: System Validation
Initial Interface Exploration (Processing)
Interactive System with ESP32-C3 and Processing
Components and Hardware Integration
Data Acquisition and Serial Communication
temperature,humidityLocal Visualization with OLED Display
Graphical Interface in Processing
Control Modes
System Integration
Conclusion
Components Used
Component
Function
XIAO ESP32-C3
Main microcontroller and data processing unit
DHT11
Temperature and humidity input sensor
LDR Sensor
Ambient light intensity input sensor
OLED SSD1306
Output device for real-time visualization
RGB LED
Visual actuator for system status indication
Processing
Graphical interface for monitoring and control
Resistors
Electrical stability and voltage division
Jumper Wires
Connections between electronic components
USB-C Cable
Power supply and programming connection
Component Connections
DHT11 Sensor (Input Device)
DHT11 Pin
Connection
VCC
3.3V
GND
GND
DATA
GPIO 21
LDR Sensor (Input Device)
LDR Pin
Connection
One side
3.3V
Other side
ESP32-C3 Analog Pin
Resistor
GND
analogRead() function to interpret variations in light intensity detected by the sensor.
OLED SSD1306 Display (Output Device)
OLED Pin
Connection
VCC
3.3V
GND
GND
SDA
ESP32-C3 SDA
SCL
ESP32-C3 SCL
RGB LED (Output Device)
RGB LED Pin
Connection
Red
GPIO Pin
Green
GPIO Pin
Blue
GPIO Pin
Common GND
GND
General System Operation
Output Device Functionality
Control Modes
Automatic Mode
Manual ON Mode
OFF Mode
System Validation
Serial Monitor Output
25.4,72.0
25.5,71.0
25.6,70.0
26.0,69.0
Processing Code
import processing.serial.*;

Serial myPort;

float temp = 0;
float hum = 0;

// color del LED
color ledColor;

void setup() {
  size(600, 400);

  println(Serial.list());
  myPort = new Serial(this, Serial.list()[0], 115200);
  myPort.bufferUntil('\n');
}

void draw() {
  background(20);

  calcularColor();
  dibujarUI();
}

// -------- LÓGICA --------
void calcularColor() {

  char comando;

  if (temp < 20) {
    ledColor = color(0, 0, 255);
    comando = 'B';
  }
  else if (temp <= 28) {
    ledColor = color(0, 255, 0);
    comando = 'G';
  }
  else {
    ledColor = color(255, 0, 0);
    comando = 'R';
  }

  myPort.write(comando);
}

// -------- INTERFAZ --------
void dibujarUI() {

  fill(255);
  textAlign(CENTER);
  textSize(24);
  text("CONTROL TEMPERATURA", width/2, 40);

  fill(200);
  textSize(18);
  text("Temp: " + nf(temp,1,1) + " °C", width/2, 100);
  text("Hum: " + nf(hum,1,1) + " %", width/2, 130);

  fill(ledColor);
  ellipse(width/2, 250, 120, 120);
}

// -------- SERIAL --------
void serialEvent(Serial myPort) {
  String data = myPort.readStringUntil('\n');

  if (data != null) {
    data = trim(data);
    String[] values = split(data, ',');

    if (values.length == 2) {
      temp = float(values[0]);
      hum = float(values[1]);
    }
  }
}
Video (local)
Processing Code – Improved Version
import processing.serial.*;

Serial myPort;

float temp = 0;
float hum = 0;

color ledColor;
boolean ledON = true;

void setup() {
  size(600, 400);

  println(Serial.list());
  myPort = new Serial(this, Serial.list()[0], 115200);
  myPort.bufferUntil('\n');
}

void draw() {
  background(20);

  calcularColor();
  dibujarUI();
}

// -------- LÓGICA --------
void calcularColor() {

  if (!ledON) {
    ledColor = color(50);
    myPort.write('0'); // apagar
    return;
  }

  myPort.write('1'); // encender

  if (temp < 20) {
    ledColor = color(0,0,255);
    myPort.write('B');
  }
  else if (temp <= 28) {
    ledColor = color(0,255,0);
    myPort.write('G');
  }
  else {
    ledColor = color(255,0,0);
    myPort.write('R');
  }
}

// -------- INTERFAZ --------
void dibujarUI() {

  fill(255);
  textAlign(CENTER);
  textSize(24);
  text("CONTROL TEMPERATURA", width/2, 40);

  textSize(18);
  text("Temp: " + nf(temp,1,1) + " °C", width/2, 100);
  text("Hum: " + nf(hum,1,1) + " %", width/2, 130);

  // LED visual
  fill(ledColor);
  ellipse(width/2, 250, 120, 120);

  // BOTÓN
  if (ledON) fill(0,200,0);
  else fill(200,0,0);

  rect(width/2 - 50, 320, 100, 40, 10);

  fill(255);
  text(ledON ? "ON" : "OFF", width/2, 345);
}

// -------- CLICK --------
void mousePressed() {
  if (mouseX > width/2 - 50 && mouseX < width/2 + 50 &&
      mouseY > 320 && mouseY < 360) {
    ledON = !ledON;
  }
}

// -------- SERIAL --------
void serialEvent(Serial myPort) {
  String data = myPort.readStringUntil('\n');

  if (data != null) {
    data = trim(data);
    String[] values = split(data, ',');

    if (values.length == 2) {
      temp = float(values[0]);
      hum = float(values[1]);
    }
  }
}
Video (local)
Reflection and Final Conclusion
Downloads