Week 6 – Electronics Design (Group Assignment)
Overview
This week’s group assignment focused on understanding and using essential electronic test equipment to analyze and debug a microcontroller-based circuit. The aim was to develop practical skills in measuring electrical parameters and visualizing signal behavior in real-time.
By working with standard lab instruments, we learned how electronic systems behave physically, beyond theoretical knowledge.
Group Assignment Objective
- Use electronic test equipment to analyze a working microcontroller circuit
- Measure voltage, current, and signal characteristics
- Visualize digital signals using an oscilloscope
- Understand basic debugging techniques in embedded systems
Equipment Used
Multimeter
ZOYI ZT301 Digital Multimeter | Functionality and Usage Guide
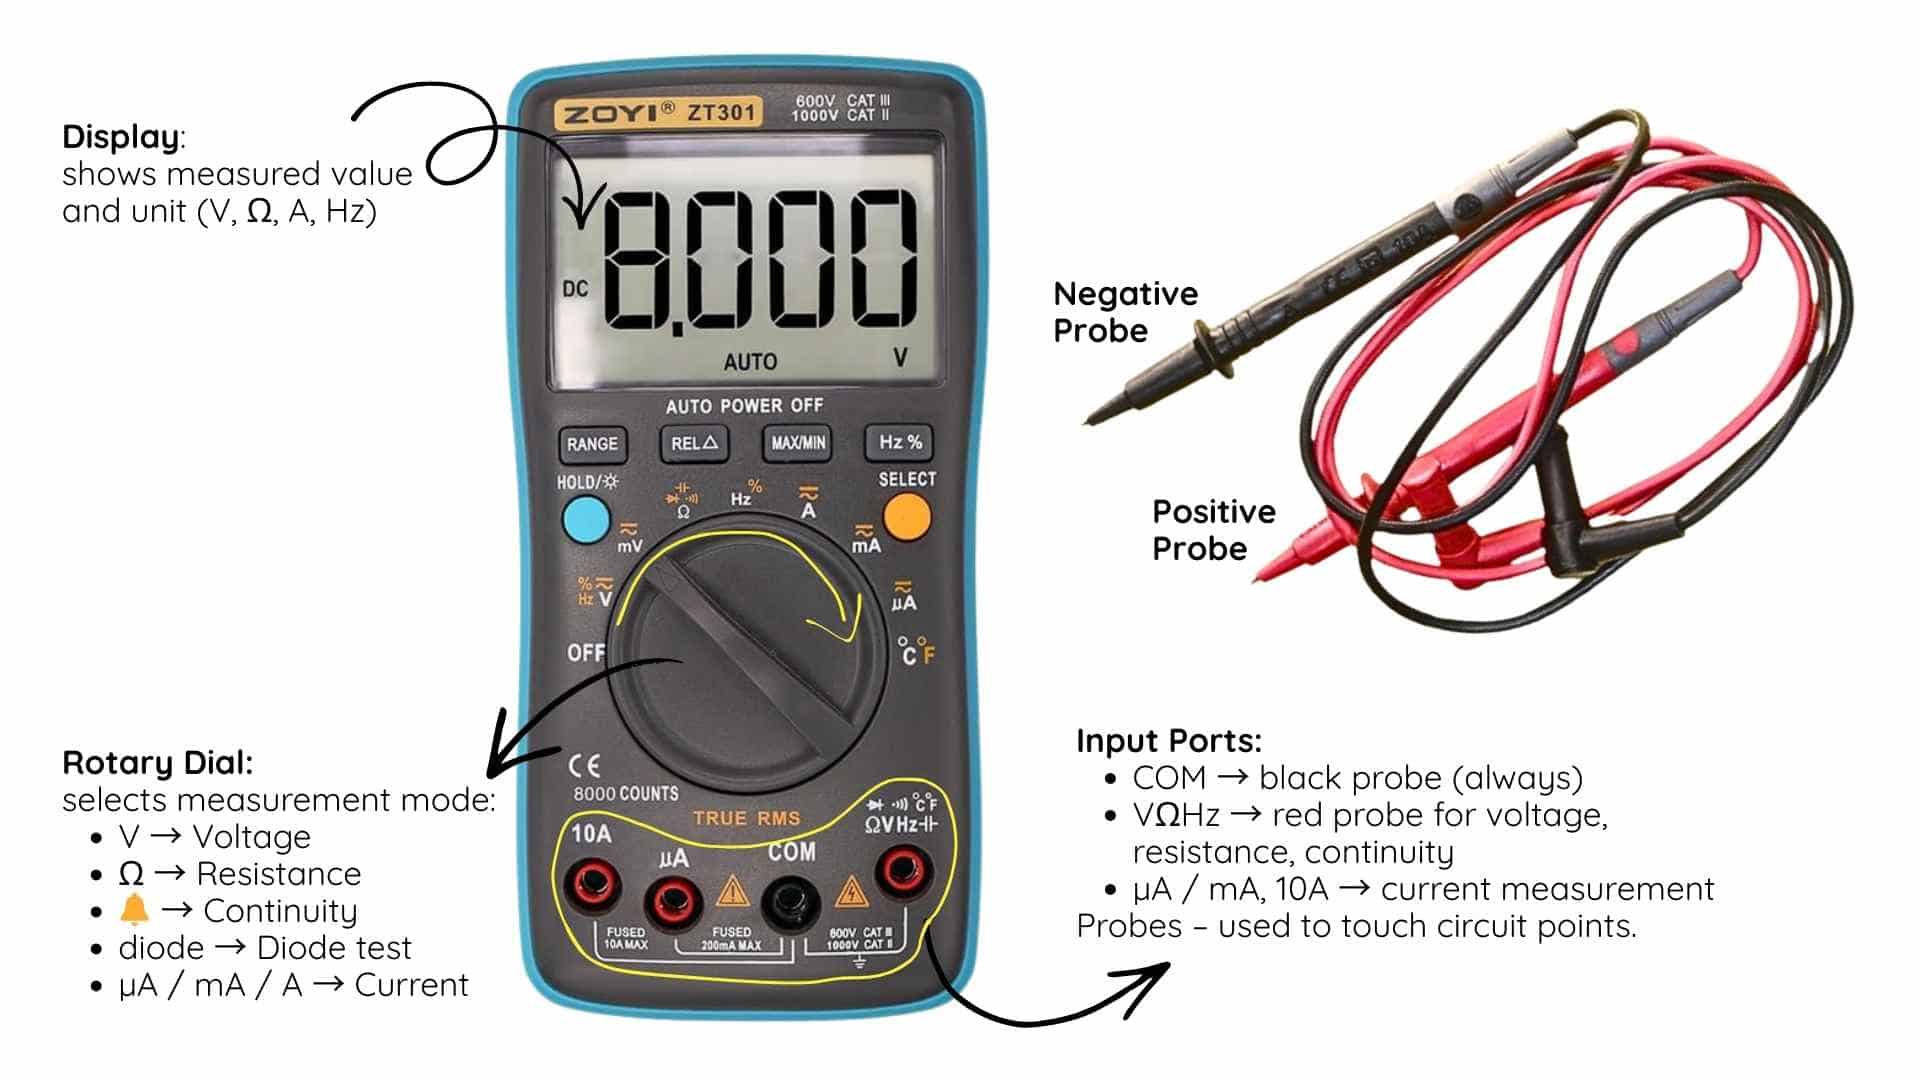
The ZOYI ZT301 Digital Multimeter is a handheld instrument used to measure voltage, current, resistance, continuity, and frequency. It is one of the most important diagnostic tools in electronics, used to verify circuits, test components, and debug PCBs.
Purpose
A multimeter helps determine:
- If power is present
- If two points are connected
- If a component has the correct value
- If there is a short circuit
FabAcademy uses:
- Verify PCB traces after milling
- Check 5 V and 3.3 V power rails
- Test resistors and LEDs
- Debug microcontroller boards
Main Parts
Display – shows measured value and unit (V, Ω, A, Hz)
Rotary Dial – selects measurement mode
Input Ports
Probes – used to touch circuit points.
How to Use (Basic PCB Testing)
1. Check continuity (before powering PCB)
Purpose: detect broken traces or shorts
Steps:
- Black probe → COM
- Red probe → VΩHz
- Turn dial → continuity symbol (sound wave)
- Touch probes to two points
Beep = connected
No beep = not connected
Use to check:
- Trace connections
- Solder joints
- No short between VCC and GND
2. Measure voltage (after powering PCB)
Purpose: confirm correct power supply
Steps:
- Black probe → COM
- Red probe → VΩHz
- Turn dial → V
- Touch black probe to GND
- Touch red probe to VCC
Expected:
- 5 V
- or 3.3 V
3. Measure resistance (component testing)
Purpose: verify resistor value
Steps:
- Turn dial → Ω
- Touch probes across resistor
- Read value
Example:
1000 Ω = 1 kΩ resistor
Why it is essential
The multimeter is the primary tool for verifying, troubleshooting, and validating electronic circuits. It allows quick identification of power issues, broken traces, and faulty components.
Digital Oscilloscope
OWON TAO3104A Digital Oscilloscope | Functionality and Usage Guide
The OWON TAO3104A is a 4-channel digital storage oscilloscope with a 100 MHz bandwidth and a 1 GSa/s sample rate. Unlike a multimeter which only shows static values, an oscilloscope displays how signals change over time — making it essential for analyzing waveforms, timing, and signal behavior in electronic circuits.
Purpose
An oscilloscope helps determine:
- The shape of a signal (sine, square, triangle, sawtooth, etc.)
- The frequency and period of a signal
- The amplitude (voltage level) of a signal
- The duty cycle of a PWM signal
- Whether a signal is noisy, distorted, or behaving unexpectedly
FabAcademy uses:
- Visualize PWM output from microcontrollers
- Verify signal waveforms from function generators
- Debug timing issues in digital circuits
- Measure frequency and duty cycle of signals
- Observe real-time behavior of sensor outputs
Key Specifications
| Parameter | Value |
|---|---|
| Bandwidth | 100 MHz |
| Channels | 4 |
| Sample Rate | 1 GSa/s |
| Display | 8-inch TFT color LCD |
| Input Impedance | 1 MΩ |
| Probe Attenuation | 1X / 10X |
Main Parts
Display – color screen showing waveforms, grid, and measurements
Channel Inputs (CH1–CH4) – BNC connectors where probes are connected
Rotary Knobs – adjust vertical scale (V/div) and horizontal scale (time/div)
Trigger Controls – set the conditions for when the oscilloscope begins capturing
AUTOSET Button – automatically configures settings to display a stable waveform
RUN/STOP Button – starts or freezes the waveform capture
Probes – connect to circuit points; typically have a 1X/10X switch
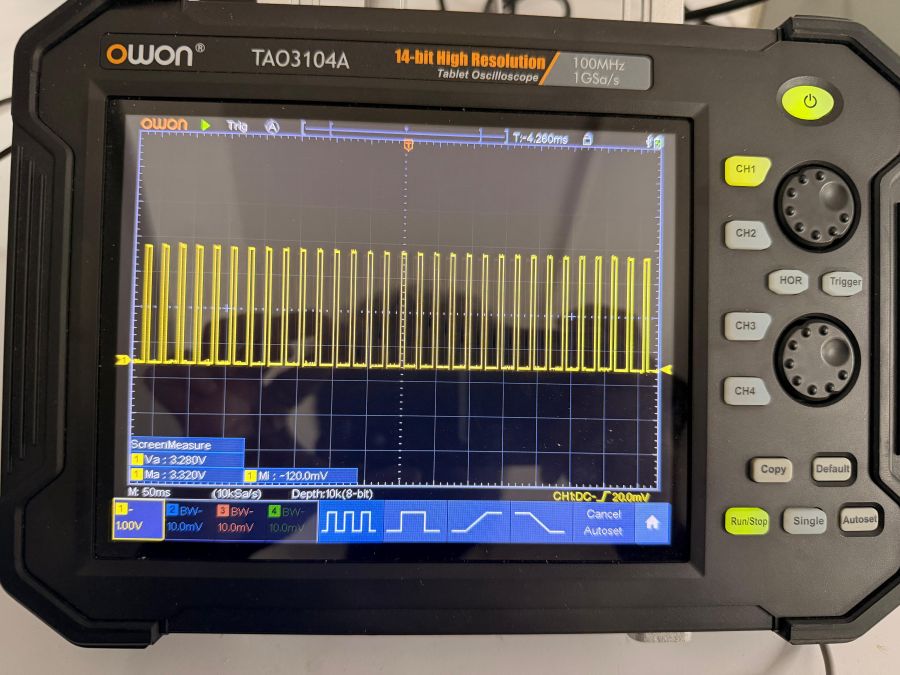
How to Use (Basic Signal Measurement)
1. Calibrate the probe (before measuring)
Purpose: compensate the probe to ensure accurate measurements
Steps:
- Connect probe to CH1 input
- Attach probe tip to the built-in 5V calibration output on the oscilloscope panel
- Clip the ground lead to the adjacent GND terminal
- Press AUTOSET — the oscilloscope will automatically scale and display a square wave
- Check that the square wave has flat tops and sharp edges
- Rounded corners → under-compensated, adjust probe trimmer
- Peaked/spiky corners → over-compensated, adjust probe trimmer
✅ A properly calibrated probe shows a clean, flat-topped square wave
2. Measure a signal
Purpose: observe and analyze a waveform from a circuit
Steps:
- Connect probe ground clip to circuit GND
- Touch probe tip to the signal point
- Press AUTOSET for automatic scaling
- Use V/div knob to adjust vertical zoom
- Use time/div knob to adjust horizontal zoom
- Read frequency, period, and amplitude from the on-screen measurements
3. Measure PWM / Duty Cycle
Purpose: verify PWM output percentage from a microcontroller
Steps:
- Connect probe to the PWM output pin
- Press AUTOSET
- Enable on-screen measurements: frequency, period, duty cycle (+Width)
- Compare measured duty cycle to expected value
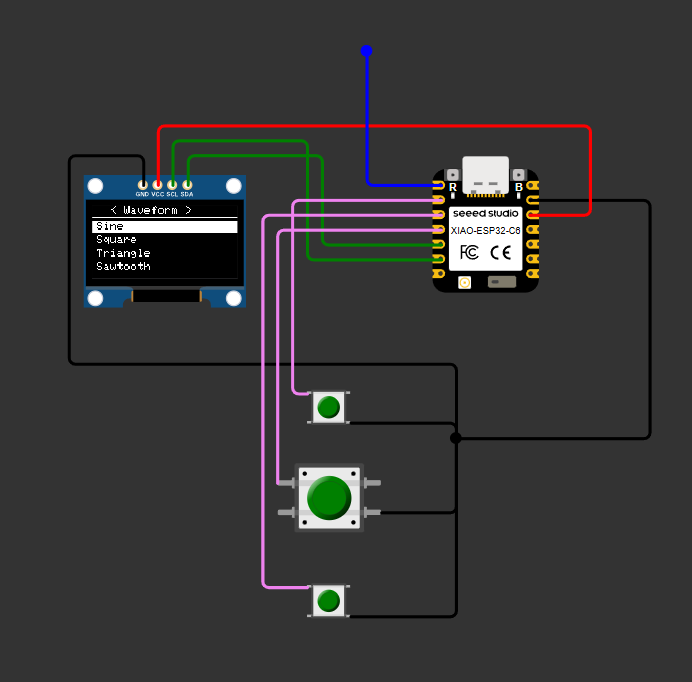
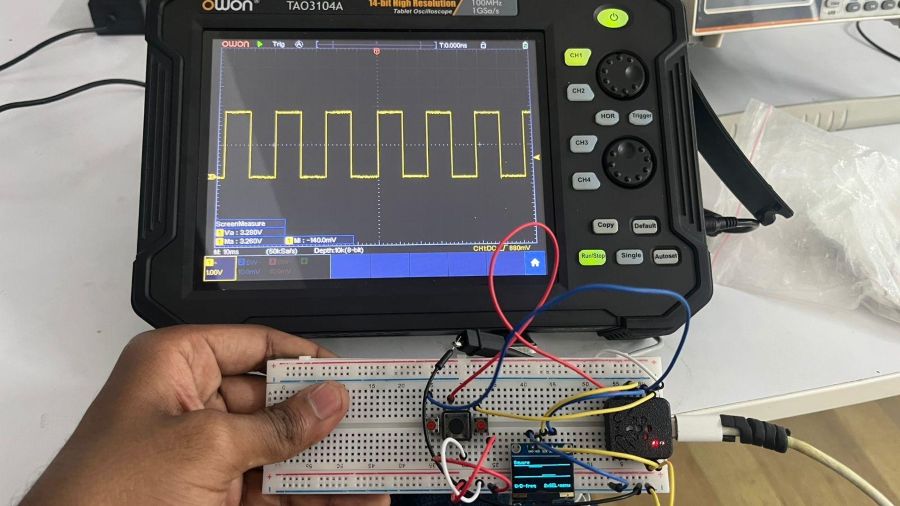
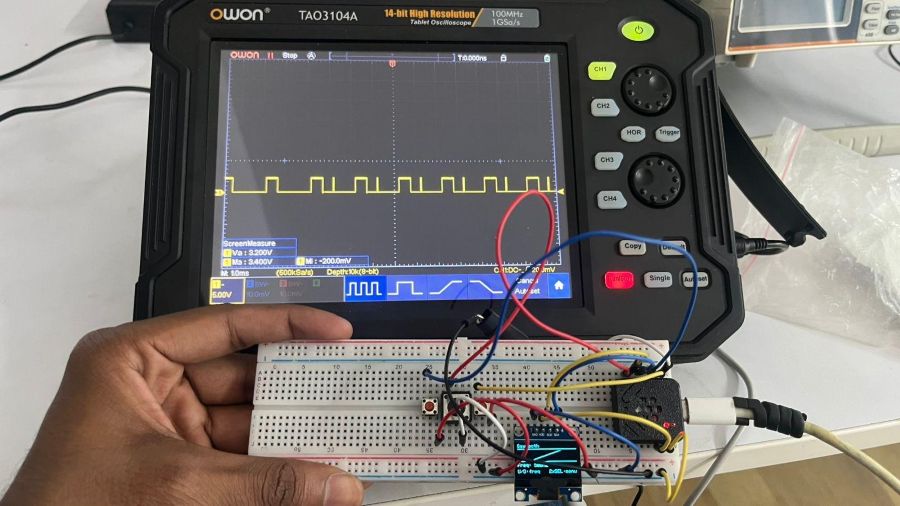
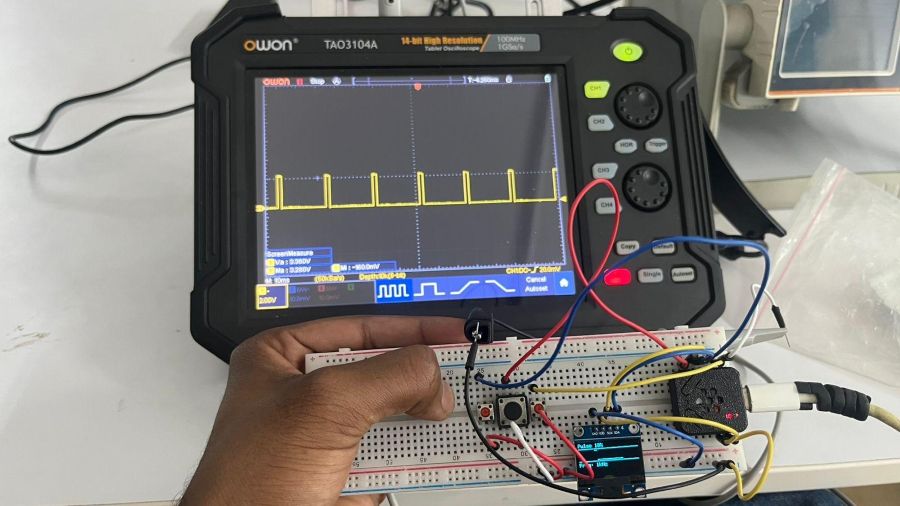
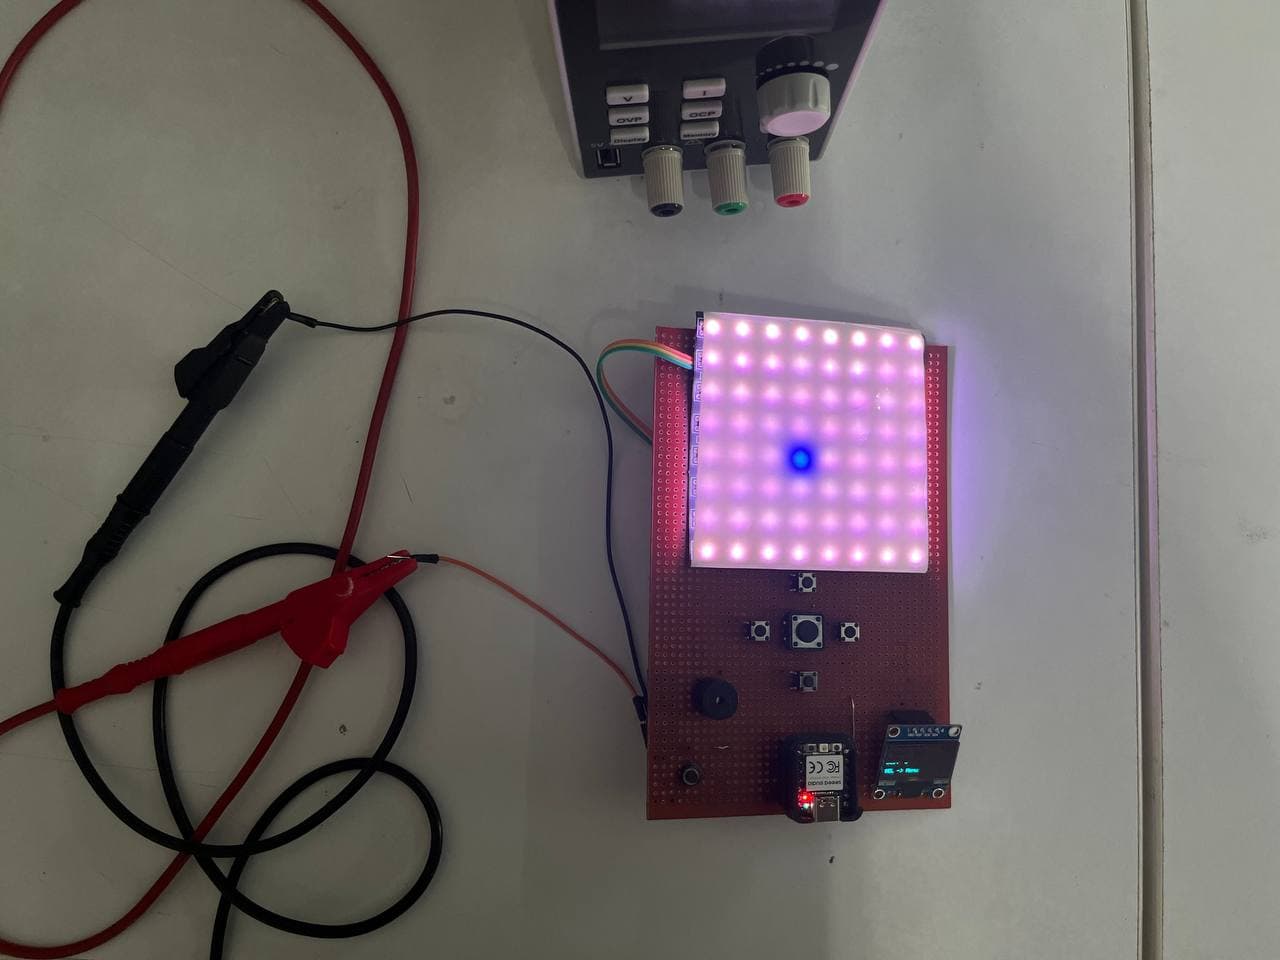
What We Did — XIAO RP2040 Function Generator
We used a Seeed Studio XIAO RP2040 microcontroller as a simple software-defined function generator, outputting waveforms via its PWM peripheral. The oscilloscope was used to visualize and verify each waveform.
Setup
- Connected oscilloscope probe to the 5V calibration output on the oscilloscope
- Pressed AUTOSET to calibrate and verify probe compensation
- Connected CH1 probe to the PWM output pin of the XIAO RP2040
- Connected probe ground to the board's GND
Wiring Schematic
XIAO RP2040 Code
/*
  PWM Signal Generator — Seeed Studio XIAO RP2040
  ================================================
  Libraries needed (install via Arduino Library Manager):
    - Adafruit SSD1306
    - Adafruit GFX Library

  XIAO RP2040 Wiring:
    OLED SDA  → D4 (GPIO6)   I2C
    OLED SCL  → D5 (GPIO7)   I2C
    PWM OUT   → D0 (GPIO26)  → DSO probe tip
    Up button → D1 (GPIO27)  → to GND
    Down btn  → D2 (GPIO28)  → to GND
    Sel btn   → D6 (GPIO0)   → to GND
    DSO GND   → GND pin

  Navigation:
    Home screen       : double-press SELECT → open menu
    Menu              : Up/Down scroll, SELECT to choose waveform
    Running screen    : Up/Down change frequency, double-press SELECT → back to menu
*/

#include <Wire.h>
#include <Adafruit_GFX.h>
#include <Adafruit_SSD1306.h>

// ── OLED ──────────────────────────────────────────────────────────────────────
#define SCREEN_W   128
#define SCREEN_H    64
#define OLED_RESET  -1
Adafruit_SSD1306 display(SCREEN_W, SCREEN_H, &Wire, OLED_RESET);

// ── Pins (XIAO RP2040) ────────────────────────────────────────────────────────
#define PIN_PWM_OUT  D0   // GPIO26
#define PIN_UP       D1   // GPIO27
#define PIN_DOWN     D2   // GPIO28
#define PIN_SEL      D6   // GPIO0

// ── Waveforms & Frequencies ───────────────────────────────────────────────────
const char* WAVEFORMS[] = {"Sine", "Square", "Triangle", "Sawtooth", "Ramp Down", "Pulse 25%", "Pulse 10%"};
const int   NUM_WAVES   = 7;

const uint32_t FREQ_STEPS[] = {10, 50, 100, 500, 1000, 5000, 10000, 50000, 100000};
const int      NUM_FREQS    = 9;

// ── State ─────────────────────────────────────────────────────────────────────
enum AppState { HOME, MENU, RUNNING };
AppState appState = HOME;

int  menuIdx  = 0;
int  waveIdx  = 0;
int  freqIdx  = 4;   // default 1 kHz

// ── LUT & Timer ───────────────────────────────────────────────────────────────
#define SAMPLES 64
uint16_t lut[SAMPLES];
volatile int lutPos = 0;

// RP2040 has hardware PWM slice — we use analogWrite + repeating timer
struct repeating_timer waveTimer;

bool timerCallback(struct repeating_timer* t) {
  analogWrite(PIN_PWM_OUT, lut[lutPos] >> 8);  // scale 16-bit → 8-bit (0-255)
  lutPos = (lutPos + 1) % SAMPLES;
  return true;
}

void buildLut(int wave) {
  for (int i = 0; i < SAMPLES; i++) {
    float t = (float)i / SAMPLES;   // 0.0 … <1.0
    float v = 0.5f;
    switch (wave) {
      case 0: v = (sinf(2 * PI * t) + 1.0f) / 2.0f; break;          // Sine
      case 1: v = (t < 0.5f)  ? 1.0f : 0.0f;         break;          // Square
      case 2: v = (t < 0.5f)  ? 2*t  : 2-2*t;        break;          // Triangle
      case 3: v = t;                                   break;          // Sawtooth
      case 4: v = 1.0f - t;                            break;          // Ramp Down
      case 5: v = (t < 0.25f) ? 1.0f : 0.0f;          break;          // Pulse 25%
      case 6: v = (t < 0.10f) ? 1.0f : 0.0f;          break;          // Pulse 10%
    }
    lut[i] = (uint16_t)(v * 65535);
  }
}

void startWave(int wave, uint32_t freq) {
  cancel_repeating_timer(&waveTimer);
  lutPos = 0;
  buildLut(wave);
  // Period in µs: 1,000,000 / (freq * SAMPLES)
  int32_t period_us = (int32_t)(1000000L / ((long)freq * SAMPLES));
  if (period_us < 1) period_us = 1;
  add_repeating_timer_us(-period_us, timerCallback, NULL, &waveTimer);
}

void stopWave() {
  cancel_repeating_timer(&waveTimer);
  analogWrite(PIN_PWM_OUT, 0);
}

// ── Display helpers ───────────────────────────────────────────────────────────
void drawHome() {
  display.clearDisplay();
  display.setTextSize(1);
  display.setTextColor(SSD1306_WHITE);
  display.setCursor(8, 0);  display.print("PWM Generator");
  display.drawFastHLine(0, 10, 128, SSD1306_WHITE);
  display.setCursor(0, 20); display.print("Double-press SEL");
  display.setCursor(16,32); display.print("to open menu");
  display.setCursor(0, 52); display.print("OUT:D0   GND:GND");
  display.display();
}

void drawMenu(int idx) {
  display.clearDisplay();
  display.setTextSize(1);
  display.setTextColor(SSD1306_WHITE);
  display.setCursor(16, 0); display.print("< Waveform >");
  display.drawFastHLine(0, 10, 128, SSD1306_WHITE);

  int visible = 4;
  int start   = (idx >= visible) ? idx - visible + 1 : 0;
  for (int row = 0; row < visible && (start + row) < NUM_WAVES; row++) {
    int wi = start + row;
    int y  = 14 + row * 12;
    if (wi == idx) {
      display.fillRect(0, y - 1, 128, 11, SSD1306_WHITE);
      display.setTextColor(SSD1306_BLACK);
      display.setCursor(4, y); display.print(WAVEFORMS[wi]);
      display.setTextColor(SSD1306_WHITE);
    } else {
      display.setCursor(4, y); display.print(WAVEFORMS[wi]);
    }
  }
  display.display();
}

// Mini waveform preview (60px wide, 20px tall)
void drawPreview(int wave, int xOff, int yOff, int w = 60, int h = 20) {
  for (int x = 0; x < w; x++) {
    float t = (float)x / w;
    float v = 0.5f;
    switch (wave) {
      case 0: v = (sinf(2 * PI * t) + 1.0f) / 2.0f; break;
      case 1: v = (t < 0.5f)  ? 1.0f : 0.0f;         break;
      case 2: v = (t < 0.5f)  ? 2*t  : 2-2*t;        break;
      case 3: v = t;                                   break;
      case 4: v = 1.0f - t;                            break;
      case 5: v = (t < 0.25f) ? 1.0f : 0.0f;          break;
      case 6: v = (t < 0.10f) ? 1.0f : 0.0f;          break;
    }
    int y = yOff + (int)((1.0f - v) * (h - 1));
    display.drawPixel(xOff + x, y, SSD1306_WHITE);
  }
}

String freqLabel(uint32_t freq) {
  if (freq >= 1000) {
    if (freq % 1000 == 0)
      return String(freq / 1000) + "kHz";
    else
      return String(freq / 1000.0f, 1) + "kHz";
  }
  return String(freq) + "Hz";
}

void drawRunning(int wave, uint32_t freq) {
  display.clearDisplay();
  display.setTextSize(1);
  display.setTextColor(SSD1306_WHITE);
  display.setCursor(0, 0); display.print(WAVEFORMS[wave]);
  display.drawFastHLine(0, 10, 128, SSD1306_WHITE);
  drawPreview(wave, 34, 13);
  display.drawFastHLine(0, 35, 128, SSD1306_WHITE);
  display.setCursor(0, 39); display.print("Freq: " + freqLabel(freq));
  display.setCursor(0, 52); display.print("U/D:freq");
  display.setCursor(68,52); display.print("2xSEL:menu");
  display.display();
}

// ── Button debounce & double-press detection ──────────────────────────────────
#define DEBOUNCE_MS  50
#define DOUBLE_MS   400

unsigned long lastSelMs = 0;
int           selCount  = 0;

// Returns: 'U'=up, 'D'=down, 'S'=single-sel, '2'=double-sel, 0=nothing
char readButtons() {
  if (digitalRead(PIN_UP) == LOW) {
    delay(DEBOUNCE_MS);
    while (digitalRead(PIN_UP) == LOW);
    return 'U';
  }
  if (digitalRead(PIN_DOWN) == LOW) {
    delay(DEBOUNCE_MS);
    while (digitalRead(PIN_DOWN) == LOW);
    return 'D';
  }
  if (digitalRead(PIN_SEL) == LOW) {
    delay(DEBOUNCE_MS);
    while (digitalRead(PIN_SEL) == LOW);
    unsigned long now = millis();
    if (selCount == 1 && (now - lastSelMs) < DOUBLE_MS) {
      selCount  = 0;
      lastSelMs = 0;
      return '2';           // double-press
    } else {
      selCount  = 1;
      lastSelMs = now;
      return 0;             // wait to see if double
    }
  }
  // Single-press timeout
  if (selCount == 1 && (millis() - lastSelMs) > DOUBLE_MS) {
    selCount = 0;
    return 'S';
  }
  return 0;
}

// ── Setup ─────────────────────────────────────────────────────────────────────
void setup() {
  // Buttons — input pull-up
  pinMode(PIN_UP,   INPUT_PULLUP);
  pinMode(PIN_DOWN, INPUT_PULLUP);
  pinMode(PIN_SEL,  INPUT_PULLUP);
  pinMode(PIN_PWM_OUT, OUTPUT);

  // I2C on XIAO RP2040: SDA=D4(GPIO6), SCL=D5(GPIO7)
  Wire.setSDA(D4);
  Wire.setSCL(D5);
  Wire.begin();

  if (!display.begin(SSD1306_SWITCHCAPVCC, 0x3C)) {
    // OLED init failed — halt
    while (true);
  }

  display.clearDisplay();
  display.display();
  drawHome();
}

// ── Loop ──────────────────────────────────────────────────────────────────────
void loop() {
  char btn = readButtons();

  // ── HOME ──────────────────────────────────────────────────────────────────
  if (appState == HOME) {
    if (btn == '2') {
      appState = MENU;
      drawMenu(menuIdx);
    }
  }

  // ── MENU ──────────────────────────────────────────────────────────────────
  else if (appState == MENU) {
    if (btn == 'U') {
      menuIdx = (menuIdx - 1 + NUM_WAVES) % NUM_WAVES;
      drawMenu(menuIdx);
    } else if (btn == 'D') {
      menuIdx = (menuIdx + 1) % NUM_WAVES;
      drawMenu(menuIdx);
    } else if (btn == 'S' || btn == '2') {
      waveIdx = menuIdx;
      stopWave();
      startWave(waveIdx, FREQ_STEPS[freqIdx]);
      appState = RUNNING;
      drawRunning(waveIdx, FREQ_STEPS[freqIdx]);
    }
  }

  // ── RUNNING ───────────────────────────────────────────────────────────────
  else if (appState == RUNNING) {
    if (btn == 'U') {
      if (freqIdx < NUM_FREQS - 1) freqIdx++;
      stopWave();
      startWave(waveIdx, FREQ_STEPS[freqIdx]);
      drawRunning(waveIdx, FREQ_STEPS[freqIdx]);
    } else if (btn == 'D') {
      if (freqIdx > 0) freqIdx--;
      stopWave();
      startWave(waveIdx, FREQ_STEPS[freqIdx]);
      drawRunning(waveIdx, FREQ_STEPS[freqIdx]);
    } else if (btn == '2') {
      stopWave();
      appState = MENU;
      drawMenu(menuIdx);
    }
  }

  delay(10);
}
Waveforms Generated
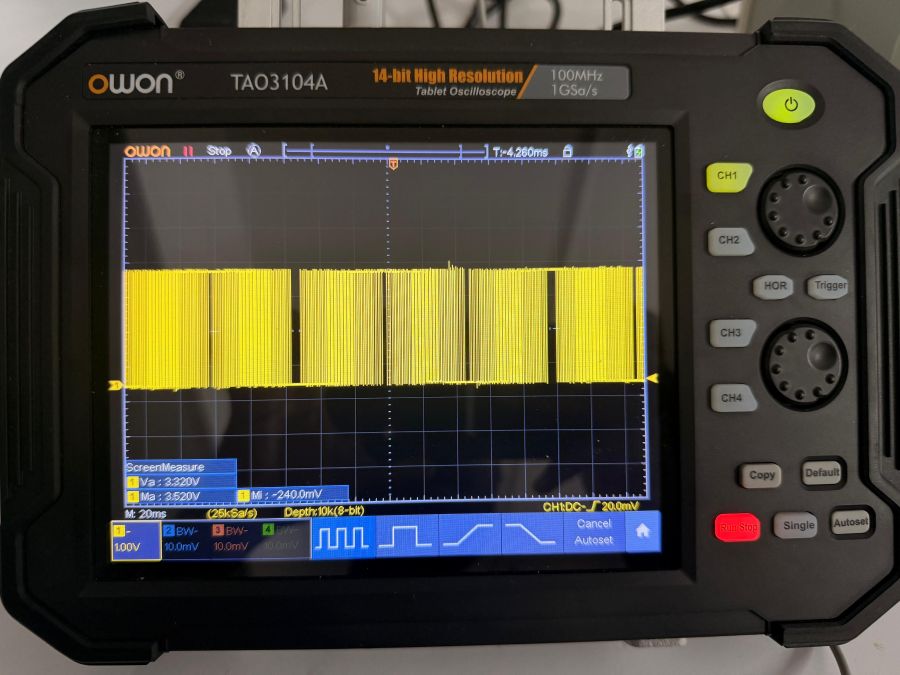
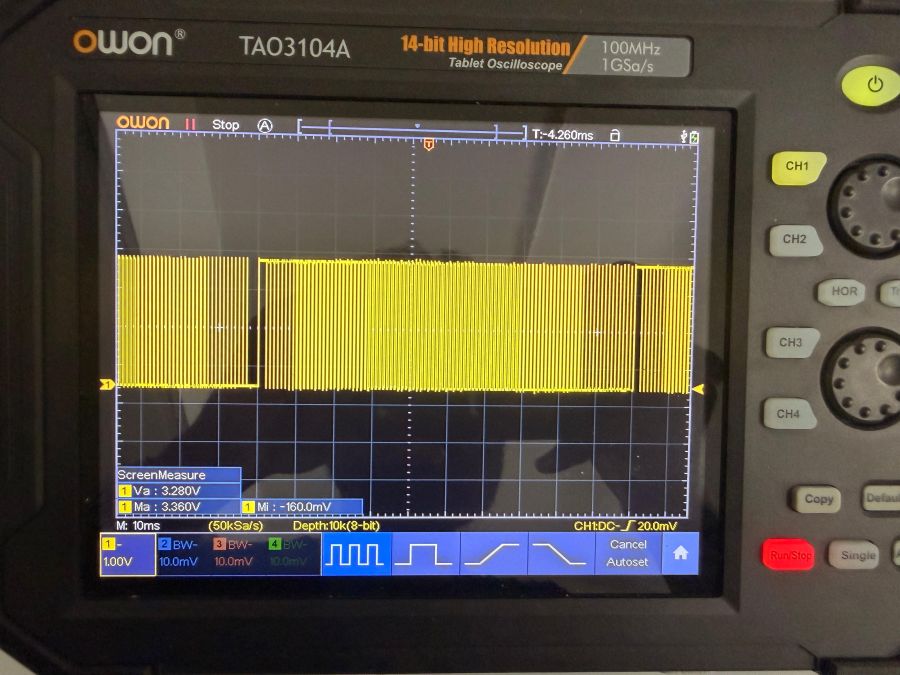
The following waveforms were generated and observed on the oscilloscope:
Sine Wave
PWM-approximated sine using varying pulse widths (not a true analog sine)
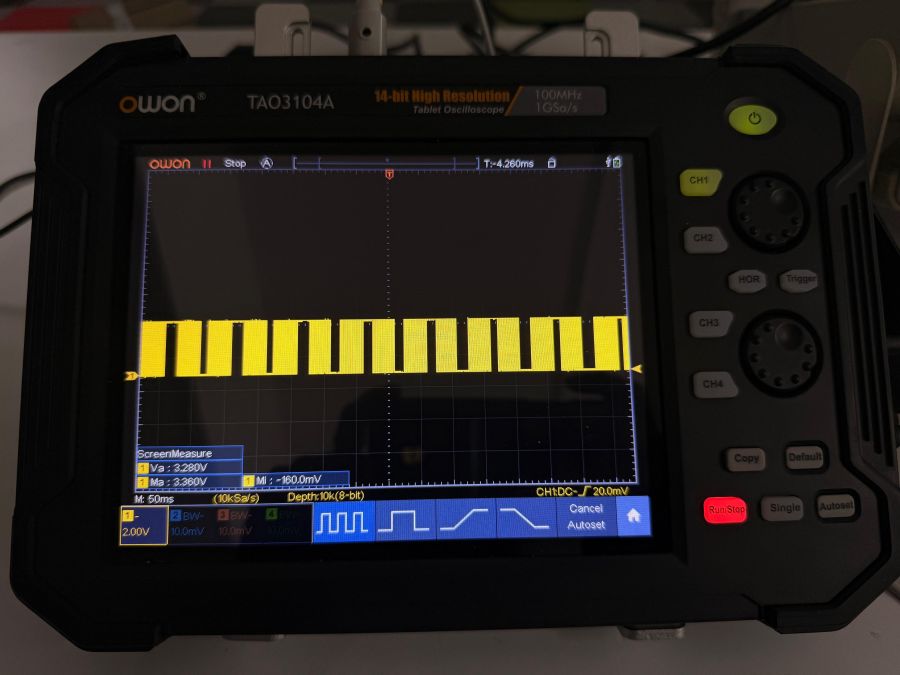
Square Wave
50% duty cycle, clean digital output
Triangle Wave
Linearly increasing then decreasing duty cycle
Ramp
Linearly increasing duty cycle only
Sawtooth
Linearly decreasing duty cycle (inverse ramp)
Pulse 25%
Square wave with 25% duty cycle
Pulse 10%
Narrow pulse with 10% duty cycle
Important Note on PWM-Based Waveforms
Since the XIAO RP2040 outputs digital PWM signals, non-square waveforms (sine, triangle, ramp, sawtooth) are approximations, not true analog signals. The shape is created by rapidly varying the pulse width over time — the oscilloscope time/div scale must be zoomed out enough to see the overall envelope shape rather than individual pulses.
A true sine wave requires a DAC or analog filter circuit. The PWM sine is a stepped approximation visible as a jagged or staircase-like waveform at high zoom.
Key Concepts
Time/div — controls how much time fits on screen horizontally. Lower value = zoomed in, higher value = zoomed out.
V/div — controls the voltage scale vertically. Adjust so the waveform fills ~60–80% of the screen height.
Trigger — determines when the oscilloscope starts drawing. A stable trigger = a stable waveform on screen. AUTOSET handles this automatically.
Duty Cycle — percentage of the period that the signal is HIGH. A 25% duty cycle means the signal is on for 25% and off for 75% of each cycle.
Why it is Essential
The oscilloscope is the primary tool for observing and understanding signal behavior over time. While a multimeter gives a single value, the oscilloscope reveals the full picture — shape, frequency, timing, and noise — making it indispensable for debugging analog and digital circuits, validating microcontroller outputs, and understanding real-world signal quality.
Saleae Logic 8
Saleae Logic 8 Channel Analyzer | Functionality and Usage Guide
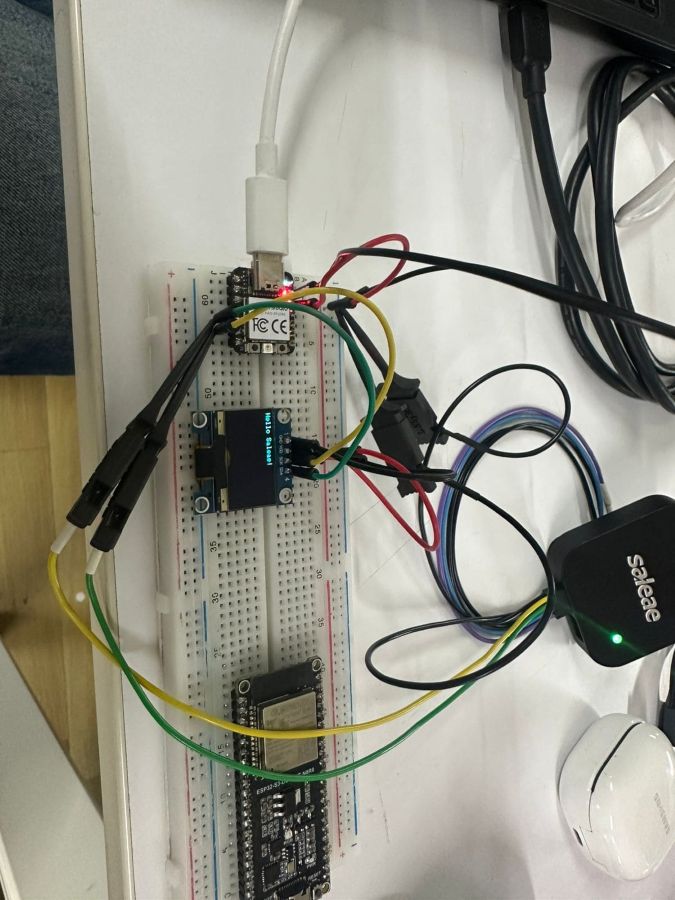
The Saleae Logic 8 is a USB-connected logic analyzer and mixed-signal capture tool that lets you view and decode digital and analog electronic signals on your computer. It's widely used by embedded engineers and hobbyists to debug communication, timing, and logic problems in microcontroller-based systems.
Purpose
A logic analyzer helps determine:
- Real-time digital signal capture across multiple channels
- Communication protocol decoding (UART, SPI, I²C, etc.)
- Timing relationships between signals
- Waveform patterns and signal transitions
- Data transmission sequences in embedded systems
FabAcademy uses:
- Debug serial communication (UART) between microcontrollers
- Analyze I²C display communication
- Capture and decode multi-channel digital protocols
- Troubleshoot timing issues in embedded systems
- Understand real-world communication protocols
Specifications
| Parameter | Value |
|---|---|
| Channels | 8 Digital + 1 Analog |
| Sample Rate | Up to 100 MHz |
| Memory | Deep capture buffer |
| Analog Bandwidth | 5 MHz |
| Voltage Range | 1.8V to 5.5V |
| Connectivity | USB 2.0 |
| Protocol Support | UART, SPI, I²C, CAN, etc. |
Main Parts
USB Port – connects to computer for data transmission and power
Channel Inputs (CH1–CH8 Digital) – where test probes attach for signal capture
Analog Input – dedicated analog channel for mixed-signal measurements
LED Indicators – show capture status and connection state
Logic Probes – connect to circuit test points; include ground reference
Software Interface – powerful Saleae Logic software for analysis and visualization
How to Use (Basic UART Capture)
Step 1: Connect the Analyzer
- Plug the Saleae Logic 8 into your computer via USB
- Open the Saleae Logic software
- Connect the ground probe to system GND
- Connect digital probes to TX/RX pins of the UART
Purpose: establish communication between the logic analyzer and your circuit
Step 2: Configure Capture Settings
Steps:
- Select the channels you want to capture (CH1 for TX, CH2 for RX)
- Set Sample Rate: 9600 for UART, use at least 10× the baud rate
- Click Start to begin capturing
Example for 9600 baud UART:
- Minimum sample rate: 96 kHz
- Recommended: 1-10 MHz
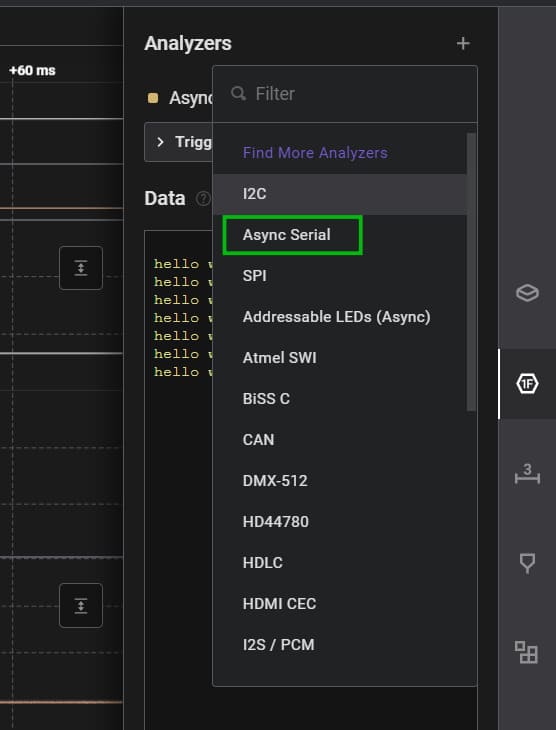
Step 3: Analyze with Protocol Decoder
Purpose: automatically decode the captured digital signals
Steps:
- From the Analyzer dropdown, select Async Serial (UART)
- Configure settings:
- Baud Rate: 9600
- Bits: 8
- Stop Bits: 1
- Parity: None
- The software displays decoded ASCII data
Example UART Capture
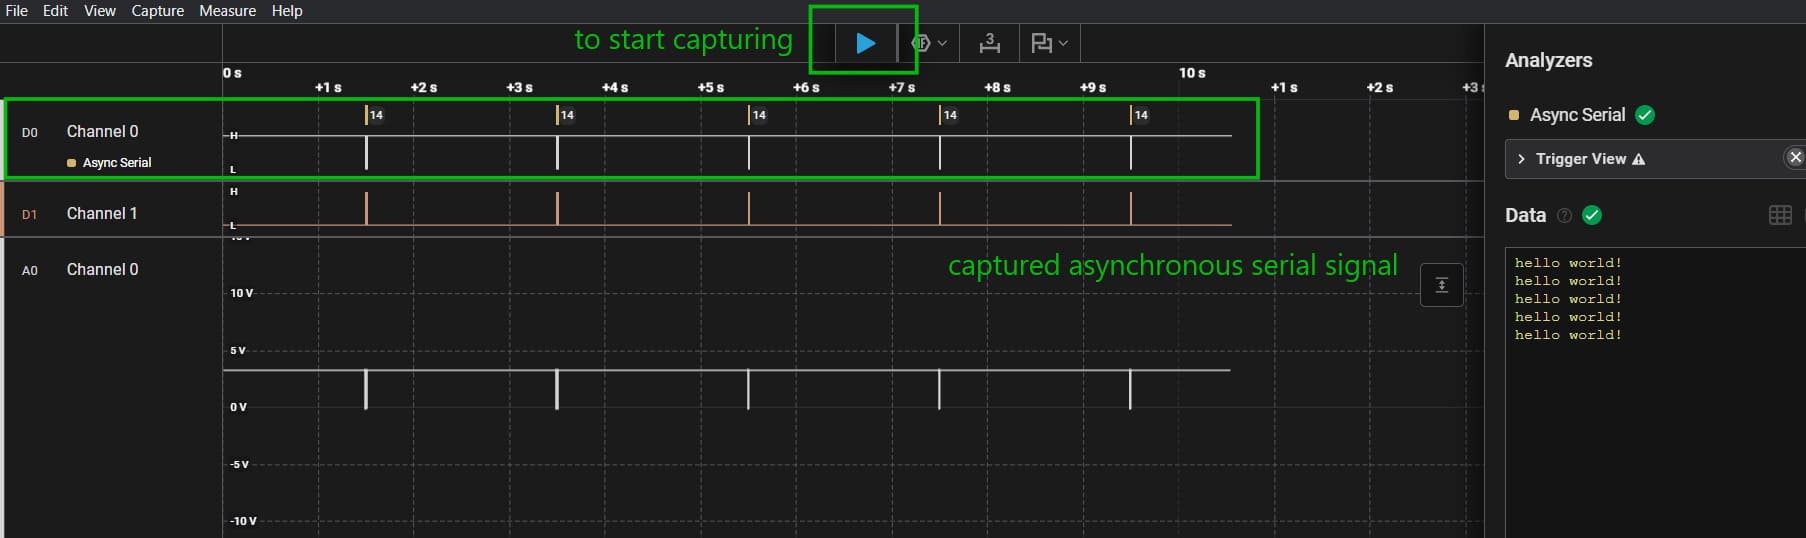
Data transmitted: "hello world!"
- Transmitted every 2 seconds (matches code delay)
- Each character appears as a distinct burst in the capture
- Decoded to ASCII: 'h', 'e', 'l', 'l', 'o', ' ', 'w', 'o', 'r', 'l', 'd', '!'
Setting Up UART on XIAO RP2040
Arduino Code Example
void setup() {
Serial1.begin(9600); // Hardware UART
delay(1000);
}
void loop() {
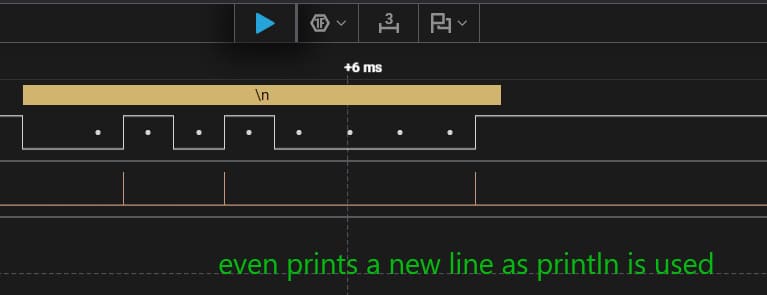
Serial1.println("hello world!");
delay(2000); // Transmit every 2 seconds
}Why Serial1?
- Serial (USB) is for debugging/monitoring
- Serial1 (Hardware UART) transmits via TX/RX pins for external analysis
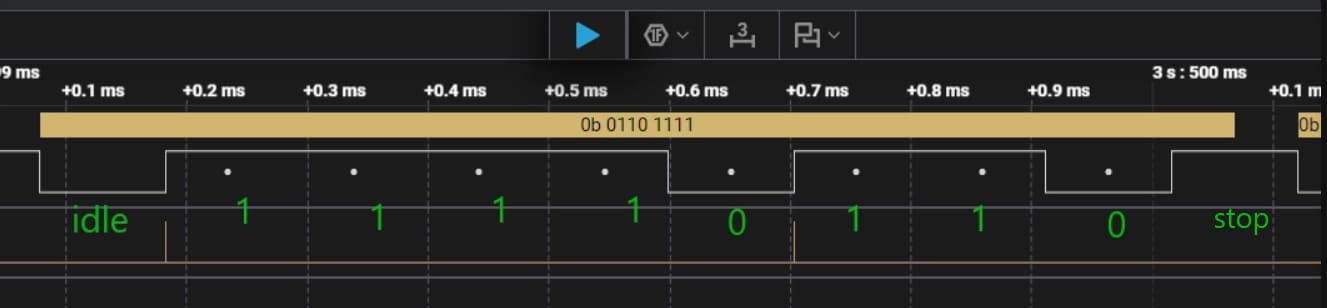
Decoding UART Data
Bit Order
UART transmits data Least Significant Bit (LSB) first
Example: Character 'o' (ASCII 111)
LSB order (transmitted): 11110110 MSB order (interpretation): 01101111
Binary: 0b01101111 Hex: 0x6F ASCII: 'o'
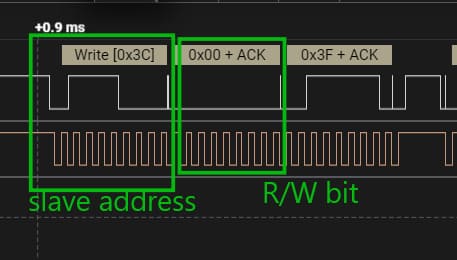
Understanding I²C Communication
I²C Protocol Overview
I²C uses two lines: SDA (data) and SCL (clock)
Protocol Sequence:
- START Condition – SDA goes low while SCL is high
- Address Byte – 7-bit device address + 1-bit R/W flag = 8-bit value
- ACK/NACK – Receiver acknowledges receipt
- Data Bytes – Actual data transmission
- STOP Condition – SDA goes high while SCL is high
Example: SSD1306 OLED Display (I²C Device)
- 7-bit Address: 0x3C
- Write Operation: Address left-shifted + R/W bit = 0x78
- Open-drain bus: idle high due to pull-up resistors
Arduino Code for OLED Display
#include <Wire.h>
#include <Adafruit_GFX.h>
#include <Adafruit_SSD1306.h>

#define SCREEN_WIDTH 128
#define SCREEN_HEIGHT 64

Adafruit_SSD1306 display(SCREEN_WIDTH, SCREEN_HEIGHT, &Wire, -1);

void setup() {
  Wire.begin();                           // SDA=D4, SCL=D5
  Wire.setClock(400000);                  // Fast mode I²C
  display.begin(SSD1306_SWITCHCAPVCC, 0x3C);

  display.clearDisplay();
  display.setTextSize(1);
  display.setTextColor(SSD1306_WHITE);
  display.setCursor(0, 0);
  display.println("Hello Saleae!");
  display.display();
}

void loop() {
}
Analyzing I²C Traffic in Saleae Logic
Step 1: Configure I²C Analyzer
- Select I²C from the Analyzer dropdown
- Set SDA Channel and SCL Channel
- Saleae automatically decodes the protocol
Step 2: Interpret the Capture
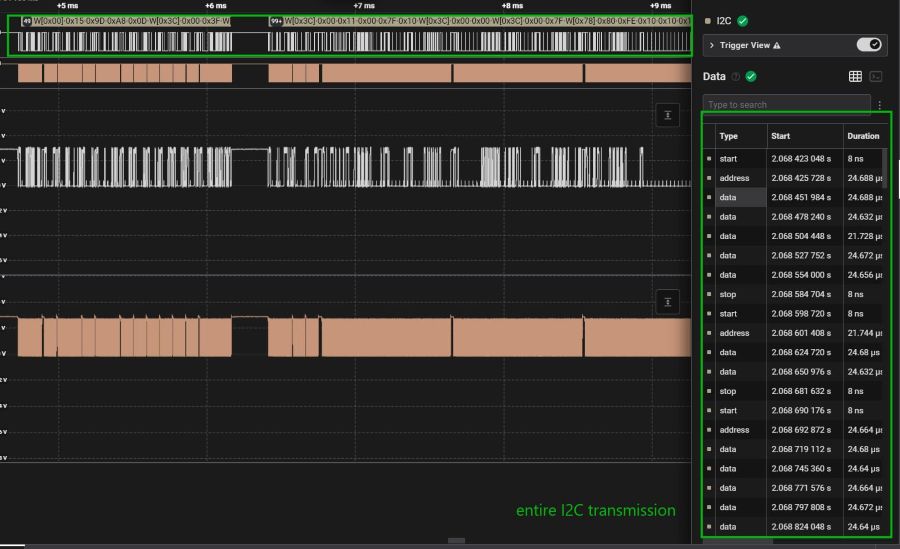
Transaction breakdown:
- START → Address (0x78) → ACK → Control Byte (0x40) → ACK → Data Bytes → STOP
- Data bytes represent pixel information for the display
- Raw hex values shown instead of ASCII (unlike UART)
Understanding I²C Addressing
7-bit to 8-bit Address Conversion:
Given: 7-bit address 0x3C (binary: 0111100)
For Write Operation:
- Left-shift:
01111000 - R/W bit = 0 (write)
- Result: 0x78
Bus Sequence: START → 0x78 → ACK → Data → STOP
Key Points:
- Master always transmits 8-bit address on the bus
- LSB is the R/W bit (0 = write, 1 = read)
- All devices acknowledge (or NACK) receipt of their address
- Pull-up resistors keep bus idle high
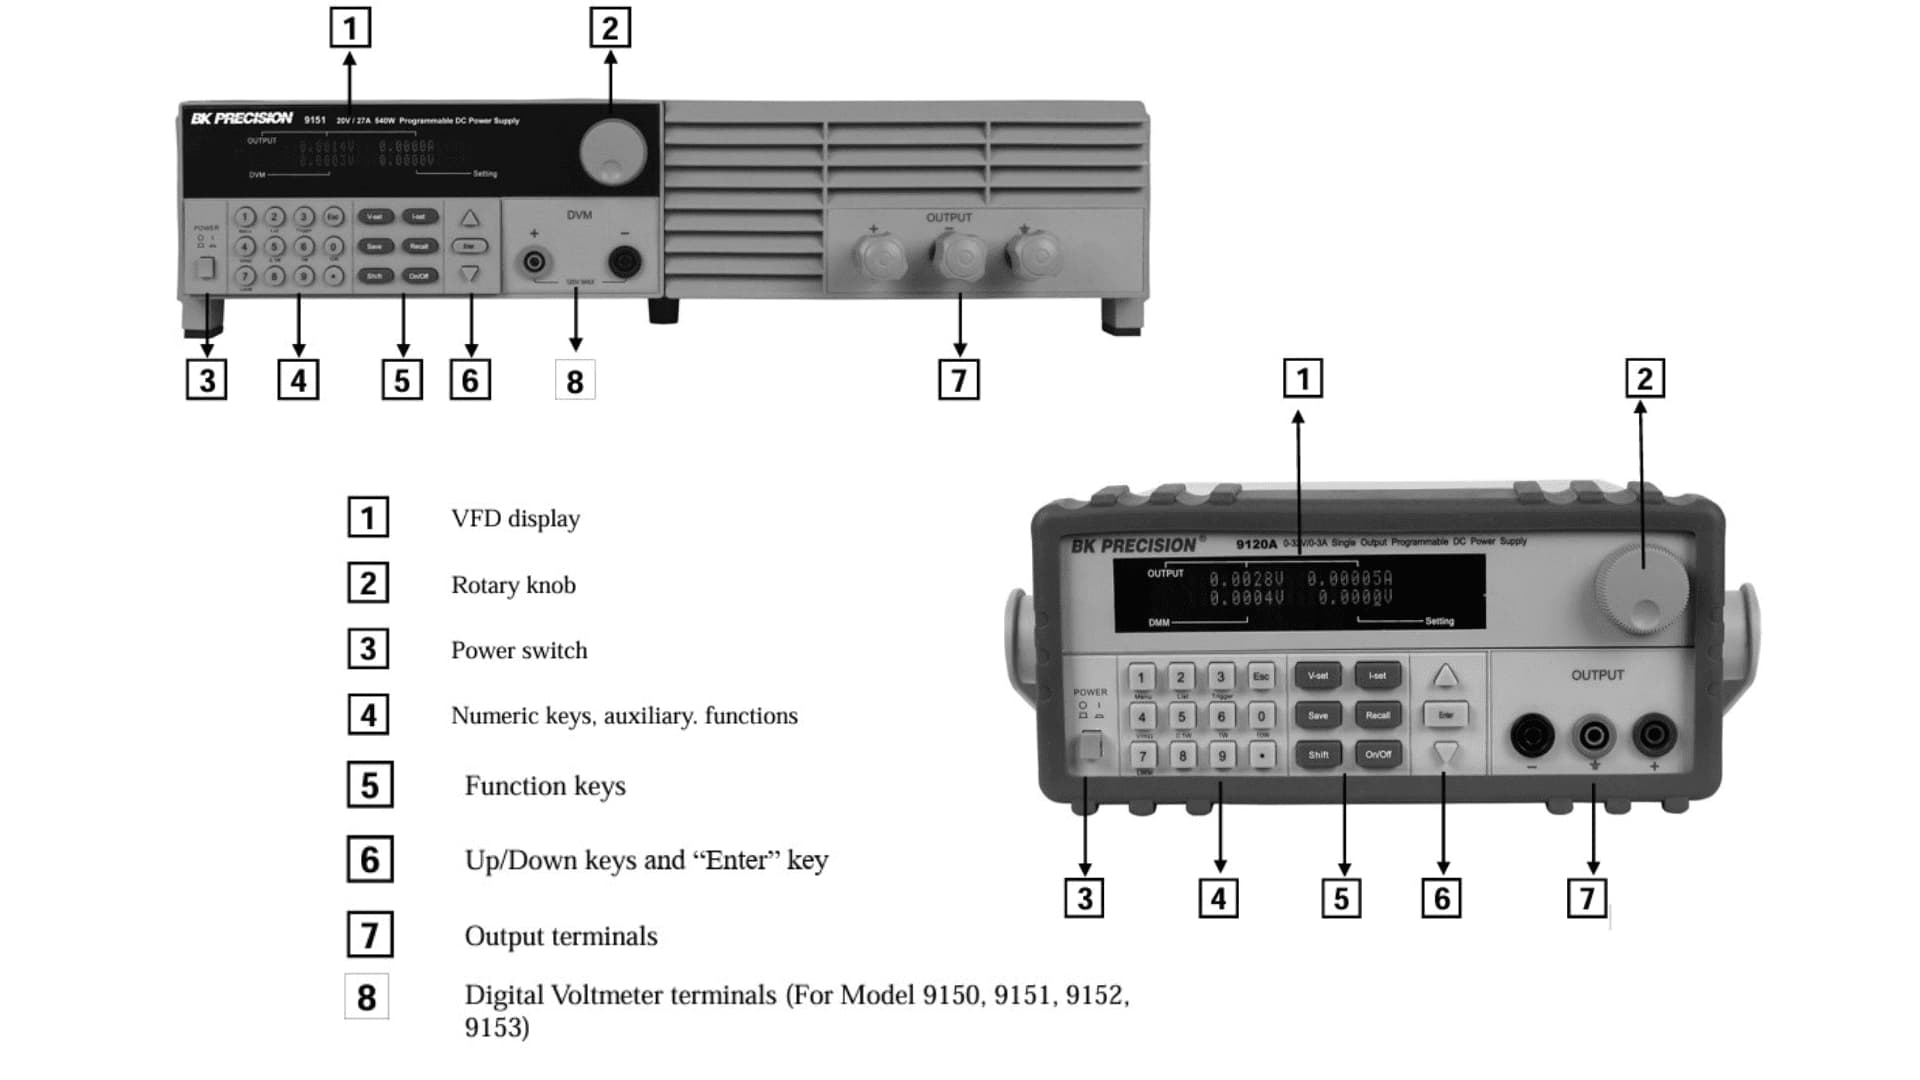
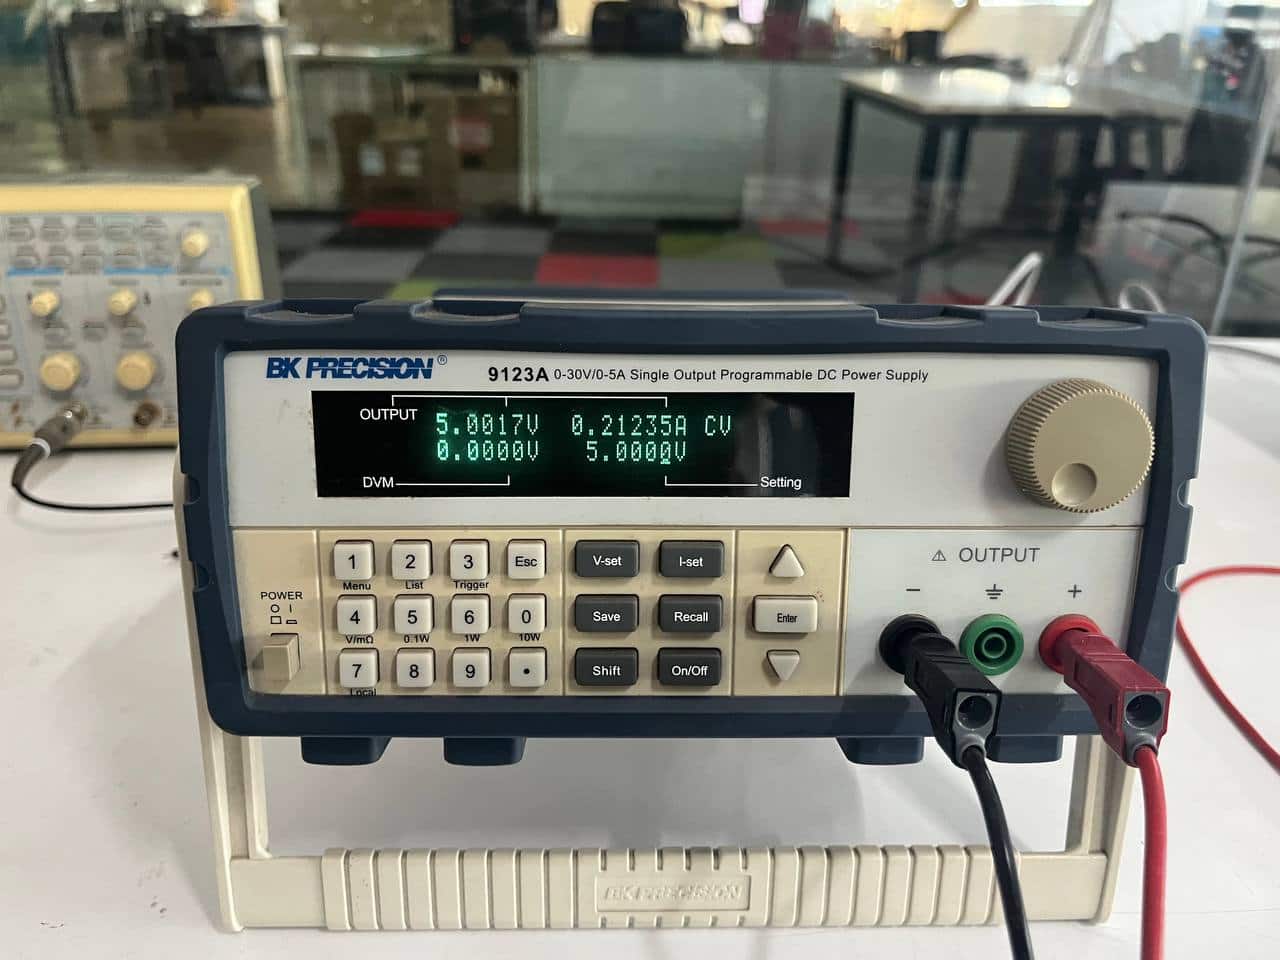
30V/5A Programmable DC Power Supply
https://www.bkprecision.com/products/model/9123A?region_code=eu
The bench power supply available in our lab is from B&K Precision, belonging to the 912xA series.
A 30V/5A programmable DC power supply is a machine that gives controlled DC (Direct Current) voltage and current to your circuit. DC means electricity that flows in one direction, like from a battery.
Instead of powering your project circuit directly from a PC or a battery (which gives fixed voltage ), this lets you set any voltage from 0–30V, control how much current flows from 0–5A, and protect both your circuit and your PC from damage. So, when testing a project, we use this adjustable DC power supply to safely power the circuit without risking burning components or harming the computer.
Data sheet - https://bkpmedia.s3.us-west-1.amazonaws.com/downloads/manuals/en-us/912xA_manual.pdf
User manual - https://bkpmedia.s3.us-west-1.amazonaws.com/downloads/manuals/en-us/912xA_manual.pdf
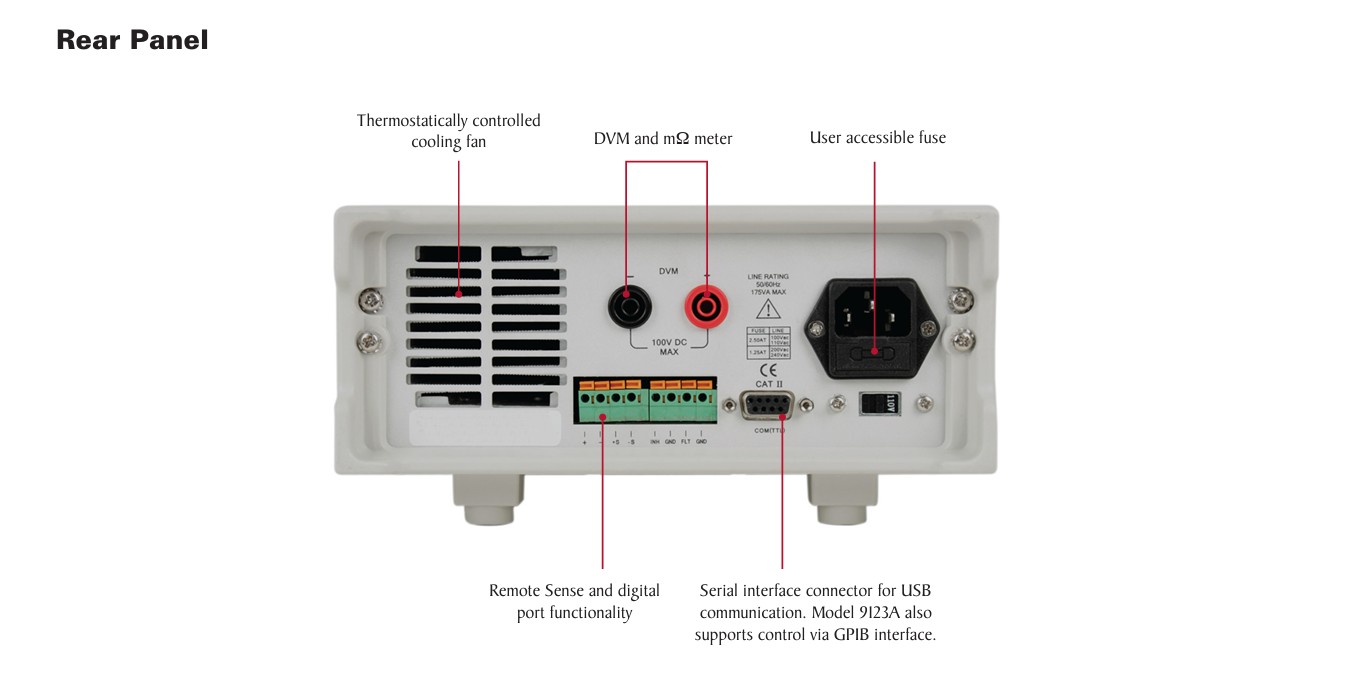
(img from datasheet)
(img from manual)
Usage:
It is used to power and test electronic circuits safely. You can use it to run Arduino, Pico, or ESP boards, check LEDs and motors, and test the PCB you designed.
It is also helpful for debugging—if a circuit is not working, you can gradually increase the voltage and set a current limit to prevent component damage.
It is very useful for learning electronics because it helps you understand voltage, current, and Ohm’s Law while allowing safe experimentation.
Safety Information:
- Read the manual before operating the power supply.
- Only trained users should use this equipment.
- Use the device as instructed in the manual, or its safety protection may not work.
- Always connect a proper earth (ground) connection.
- Do not touch exposed live wires or circuits when powered ON.
- Ensure all connections are properly insulated.
- Turn OFF, unplug, and disconnect all test leads before cleaning or servicing.
- Repairs must be done only by qualified service personnel.
- Follow the safety symbols and warnings shown on the instrument.
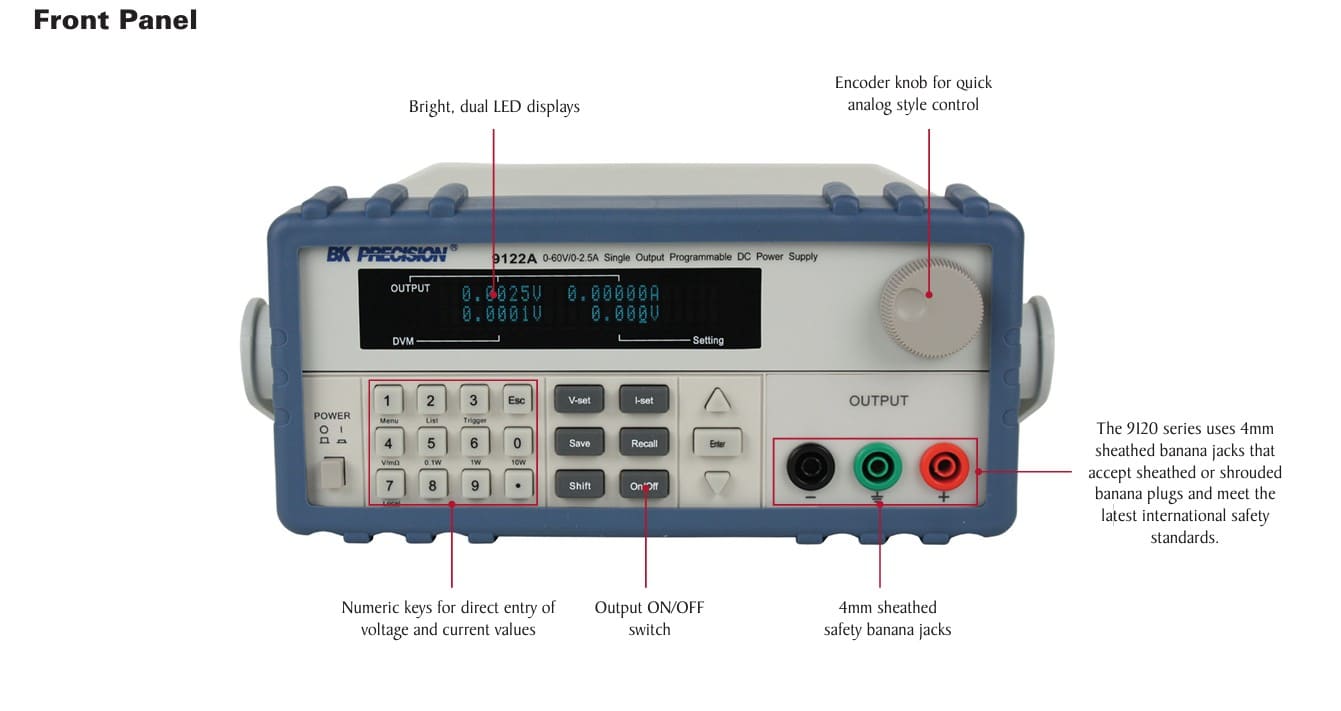
Important Features/Buttons:
V-Set:
Used to set the output voltage.
I-Set:
Used to set the current limit (protection level).
On/Off:
Turns the output ON or OFF.
(Always keep it OFF before connecting the circuit.)
Knob:
Used to adjust values by rotating.
Numeric Key: Used to directly enter the required voltage or current value. If you type something wrong, press ESC to clear it, then re-enter the correct value.
🔴 Red Terminal (+)
Positive output (connect to circuit +).
⚫ Black Terminal (–)
Negative output (connect to circuit GND).
Usually, the circuit ground (GND) is connected here.
🟢 Green Terminal (⏚)
Earth/ ground reference.
Used for safety grounding, not normally needed for basic circuit testing.
Current Limit:
The current limit is a safety protection feature. It controls the maximum amount of current that can flow to your circuit.
For example, if your LED needs only 20mA, you can set:
- Voltage: 5V
- Current limit: 0.05A
If there is a short circuit or mistake, the power supply will not allow more current than the limit you set. This prevents components from burning or getting damaged.
Initially, we did not properly focus on setting the current limit during testing. While documenting, we realized this mistake, even though our instructor had clearly explained.

Don’ts:
- Do not short the red (+) and black (–) terminals directly.
- Do not reverse polarity (never connect + to – wrongly).
- Do not exceed the rated voltage of your components.
- Do not connect polarized components incorrectly.
Our instructor demonstrated what happens when a capacitor is connected with wrong polarity — it overheated and burst like a firecracker. This shows how dangerous incorrect connections can be.
Do’s:
- Always set the current limit first before turning ON the output.
- Start with a low voltage and increase slowly.
- Double-check polarity before powering the circuit.
- Turn OFF the supply before connecting or disconnecting components.
Experiment – Powering NB6 Boy (GameBoy 2) Using Bench Power Supply
We powered Nadec’s NB6 Boy GameBoy 2 using the bench power supply to observe its current consumption.
Hardware Used:
- Microcontroller: Seeed Studio XIAO ESP32-C6
- Display: NeoPixel Matrix & OLED Display
- Audio: Passive Buzzer
- Connectivity: WiFi
We connected the negative (–) terminal of the power supply to the GND of the board and the positive (+) terminal to the VCC (5V) pin. Then we pressed V-Set and set the voltage to 5V. After setting a safe current limit, we turned the output ON.
We connected:
- Negative (–) terminal of the power supply → GND of the board
- Positive (+) terminal → VCC (5V) of the board
Then we pressed V-Set and set the voltage to 5V. After setting a safe current limit, we turned the output ON.
Observation:
Once the board started running, we observed how much current it was drawing. We monitored the current while the games were running, noted the normal operating current and also checked the maximum current it reached during gameplay.
Minimum current observed immediately after connecting the device.Minimum current
Maximum current observed while the device was running.
This experiment helped us understand the power consumption of our device and ensured that it operates safely within the required voltage and current range.
Experiment 2 – Observing Current Change with LED Brightness
In this experiment, we programmed the XIAO RP2040 so that when the button is pressed, the LED brightness increases gradually from OFF to full brightness using PWM. (Pulse Width Modulation controls brightness by turning the LED ON and OFF very quickly and changing how long it stays ON in each cycle.)
Code:
// Pin Definitions
const int buttonPin = D5;
const int ledPin = D6;

void setup() {
  pinMode(ledPin, OUTPUT);

  // Use the internal 20k ohm resistor
  // This pulls the pin HIGH by default
  pinMode(buttonPin, INPUT_PULLUP);
}

void loop() {
  // Logic is inverted: LOW means the button is pressed
  if (digitalRead(buttonPin) == LOW) {

    // Fade in
    for (int brightness = 0; brightness <= 255; brightness++) {
      // If user lets go mid-fade, we stop (optional safety check)
      if (digitalRead(buttonPin) == HIGH) break;

      analogWrite(ledPin, brightness);
      delay(10);
    }

    // Stay at max brightness while held
    while (digitalRead(buttonPin) == LOW) {
      analogWrite(ledPin, 255);
    }

  } else {
    // Turn off when released
    digitalWrite(ledPin, LOW);
  }
}
Hardware Used
- Breadboard
- Jumper wires
- LED (white)
- Resistor (220Ω or 330Ω)
- Push button
- Seeed Studio XIAO RP2040
White LEDs need a higher forward voltage (around 3V–3.3V) compared to red LEDs (~2V). So they draw current differently and brightness changes are more noticeable when powered with 5V.
Power Connection
- Bench Power Supply + (Red) → 5V / VCC of XIAO RP2040
- Bench Power Supply – (Black) → GND of XIAO RP2040
The circuit was powered using a 5V bench power supply, and we observed the current variation while the brightness was changing. The aim was to understand how LED brightness affects current consumption through real-time measurement.
Function Generator
GW Instek AFG-2125 Function Generator | Functionality and Usage Guide
A function generator is an electronic test instrument that produces various waveforms, such as sine, square, triangle, sawtooth, and pulse waves, over a range of frequencies.
Purpose
A function generator helps:
- Generate test signals for circuit analysis
- Simulate sensor outputs during development
- Test frequency response of amplifiers and filters
- Provide clock signals for digital circuits
FabAcademy uses:
- Provide known input signals to test circuit behavior
- Generate audio frequencies for speaker/buzzer testing
- Create trigger signals for oscilloscope synchronization
Main Parts
Function – Press this button to toggle between wave shapes (Sine, Square, Triangle). Frequency – Press this to set the speed of the oscillation. Amplitude – Press this to control the voltage "height" (strength) of the signal. The Knob – After pressing a variable button (like Freq or Ampl), rotate the knob to increase or decrease the value. Output – Press the Output button to send the signal to your probes.
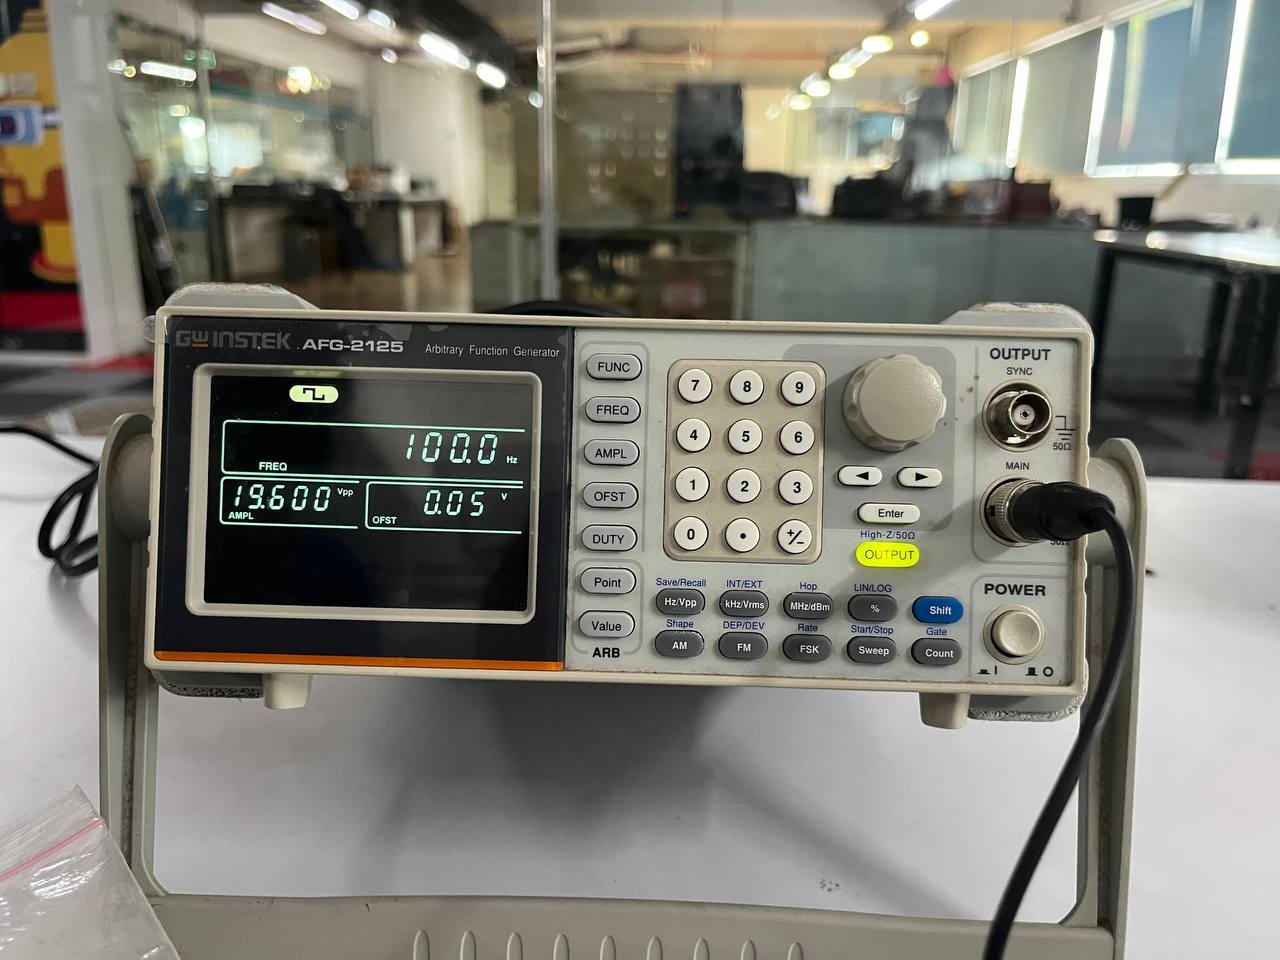
How to Use (Basic Operation)
1. Setup Waveform
The interface is designed for quick adjustments using a "Select and Modify" workflow.
- Press Function to select the desired wave shape.
- Press Frequency and rotate the knob to set the speed of the oscillation.
- Press Amplitude and rotate the knob to set the voltage.
2. Connect Output
- Connect probes to the output terminal.
- Press the Output button to send the signal to your probes.
What We Did — Testing with a Piezoelectric Crystal
To test the capabilities of the function generator, we connected the probes to a piezoelectric crystal. Unlike an LED, which just blinks, a piezo element converts electrical signals into physical movement (vibration).
The Process: We connected the BNC-to-alligator clips from the generator's output to the positive and negative terminals of the piezo disk.
1. Low-Frequency Vibration (1Hz - 10Hz)
We initially set the frequency to 1Hz - 10Hz using a Square wave. At this range, we could physically feel the crystal "clicking" or pulsing as the voltage jumped between high and low states.
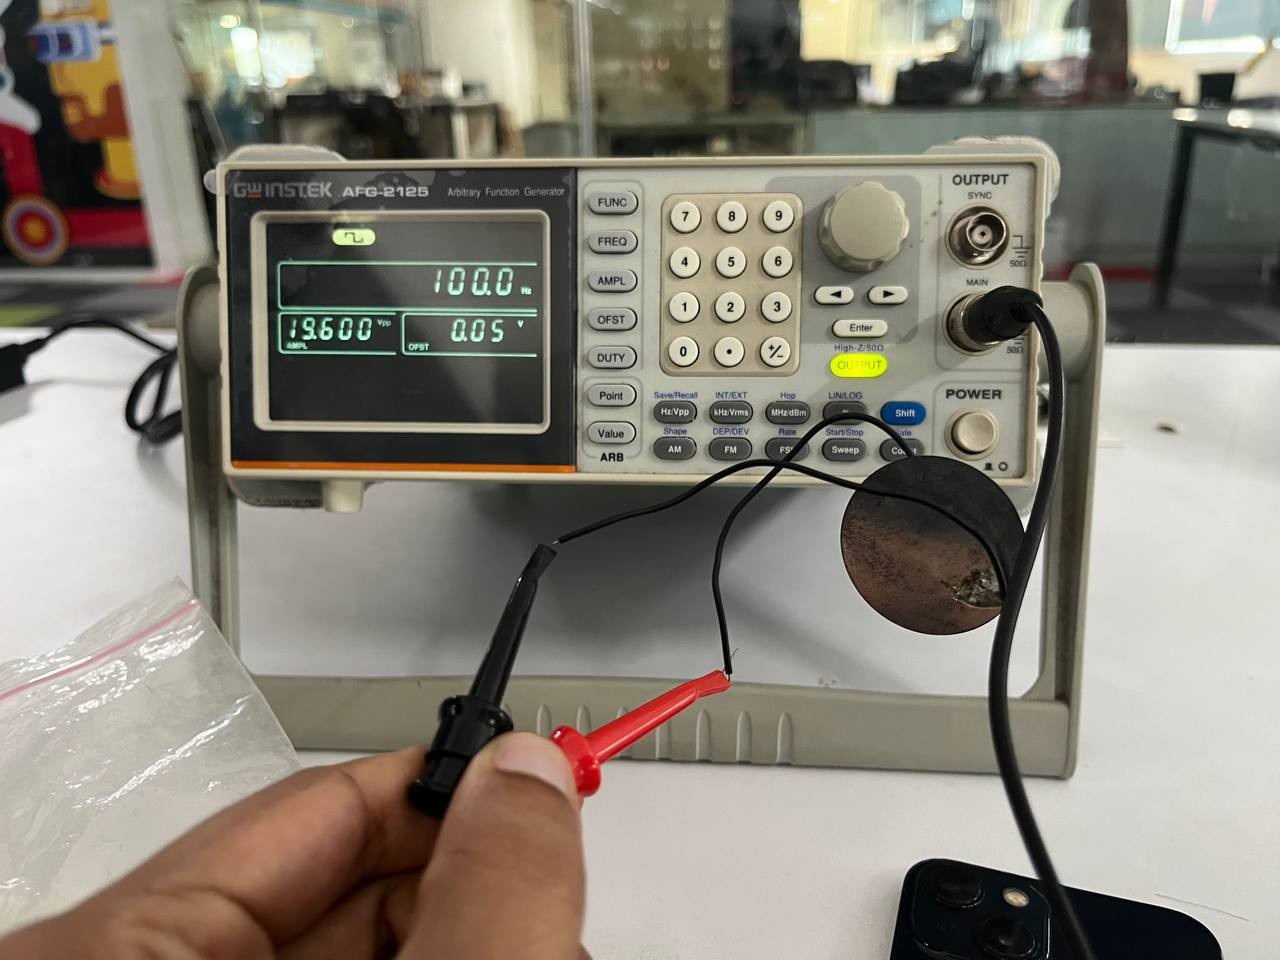
2. Audible Range Test (200Hz - 2kHz)
We then rotated the knob to increase the frequency into the 200Hz - 2kHz range. The mechanical vibrations became fast enough to create audible sound waves, turning the piezo into a buzzer.
Waveform Analysis:
- Sine Wave: Produced a smooth, pure tone.
- Square Wave: Produced a much harsher, "buzzier" sound because of the rapid voltage transitions.
- Triangle Wave: Produced a softer, thinner sound compared to the square wave.
Observations
By varying the amplitude, we could control the volume of the sound. By adjusting the frequency, we could change the pitch. This experiment successfully demonstrated how the AFG-2125 precisely controls the timing and strength of electrical signals to drive hardware components.
Key Learnings
- Logic analyzers are essential for protocol debugging
- Multiple protocols (UART, I²C, SPI) can be captured and analyzed simultaneously
- Timing information is critical for embedded system troubleshooting
- Automatic decoding saves time compared to manual bit interpretation
- Understanding bus protocols is fundamental for embedded system development
Conclusion
The Saleae Logic 8 is an indispensable tool for embedded engineers. By capturing and analyzing real communication protocols (UART, I²C, SPI), you gain deep insight into how embedded systems communicate. This week's assignment demonstrated practical protocol debugging, from simple serial output to complex display communication, building strong foundational skills for future embedded system work.